Article

Identification of Elite Agronomic Traits Using Chromosome Arm Substitution Lines of Triticum dicoccoides in the Background of Common Wheat

1
College of Advanced Agricultural Sciences, Zhejiang A&F University, Hangzhou 311300, China
2
Tonglu County Agricultural Technology Extension Center, Hangzhou 311500, China
3
Tonglu Yangjia Professional Cooperative for Grain and Oil, Hangzhou 311500, China
*
Author to whom correspondence should be addressed.
These authors contributed equally to this work.
Agronomy 2025, 15(3), 752; https://doi.org/10.3390/agronomy15030752
Submission received: 5 February 2025 / Revised: 16 March 2025 / Accepted: 18 March 2025 / Published: 20 March 2025

Abstract

:
To effectively mine and utilize the valuable genes of wild emmer wheat (Triticum dicoccoides, 2n = 4x = 28, AABB), this study conducted an investigation of agronomic traits using two sets of chromosome arm substitution lines (CASLs) of wild emmer wheat in the backgrounds of the common wheat varieties Bethlehem (BLH) and Chinese Spring (CS). The results indicated significant differences in growth parameters, including seedling agronomic traits, heading date (HD), and yield traits among the various CASLs in both the BLH and CS backgrounds. In both genetic backgrounds, the number of tillers in CASL7BS was significantly fewer than that of the parents. Additionally, the average leaf width of six CASLs (2BS, 1AL, 7AL, 5BS, 4AS, and 2BL) was significantly narrower compared to the parents. Among CASLs in the CS background, CASL2BS exhibited a significantly narrower average leaf width and shorter average plant height compared to both the parents and early-maturing CASLs. Conversely, CASL4AL exhibited significantly more tillers and a shorter average plant height than the other CASLs. In the BLH background, the spike phenotypes of all CASLs showed no significant differences from BLH. However, in the CS background, CASL6AS and CASL5AL demonstrated significantly longer spike lengths than CS. Moreover, CASL6BL had more spikelets per spike than CS. CASLs 4AS, 4AL, 6BS, and 6BL exhibited basal short awns and apical long awns, whereas the remaining CASLs displayed no awns, a pattern consistent with CS. We hypothesize that genes governing physiological traits such as seedling tiller number, leaf width, plant height, and spike traits are likely located on the corresponding chromosome arms.

1. Introduction

Wheat (Triticum aestivum L.) is a globally essential staple crop; improving yield, quality, and resistance to biotic/abiotic stresses remains a key objective [1]. The wide adaptability and long-term storage stability of wheat are crucial for food security and social stability [2,3]. Over the past half-century, population expansion and rising living standards have driven a surge in demand for wheat, along with heightened expectations for grain quality. However, the monoculture practices of elite wheat cultivars have led to a scarcity of wheat germplasm resources for breeding new varieties, hampering efforts to enhance wheat yield and quality. Fortunately, wheat has many wild progenitor species whose genetic potential can be harnessed. Researchers have long focused on harnessing superior genetic traits from these species to improve cultivated wheat. Recent advances in introgressing wild alleles into elite germplasm have yielded breakthroughs that revolutionised modern wheat breeding, particularly in developing stress-tolerant, high-yielding cultivars.
Wild emmer wheat (Triticum dicoccoides, 2n = 4x = 28, AABB) is the direct ancestor of cultivated hexaploid and tetraploid wheat [4] and harbours excellent agronomic traits such as early maturity, robust resistance (against Fusarium head blight, rust, etc.), enhanced tolerance to abiotic stresses (salt tolerance, drought tolerance, heat tolerance, herbicide tolerance), elevated grain protein levels, superior processing quality (novel alcohol-soluble proteins and gluten), high amino acid content, and biofortification trace elements [4,5,6,7,8,9]. Thus, wild emmer wheat can serve as a convenient source of exogenous genes for genetic improvement in common wheat [9,10,11]. Unfortunately, only a few excellent genes have been validated loci, primarily focusing on disease resistance and quality traits [12]. Few superior genes from wild emmer wheat have been introduced into cultivated wheat, leading to the development of new varieties [13].
Joppa and Cantrell developed a set of chromosome substitution lines within a tetraploid wheat (Triticum turgidum) genetic background, each carrying a wild emmer wheat (T. dicoccoides) chromosome, to facilitate the identification of agronomically valuable genes and accelerate breeding of improved tetraploid cultivars [14]. Using this genetic resource, researchers have successfully identified and preliminarily mapped multiple beneficial loci from wild emmer wheat. Notably, substitution lines containing chromosomes 2A, 3A, 6A, 5B, and 6B exhibited 17.2–17.9% grain protein content—significantly higher (p < 0.05) than parental controls [14]. Furthermore, the 2A, 3A, and 5B substitution lines demonstrated increased thousand-kernel weights (TKW), and most of these results were confirmed by other researchers. Importantly, disease resistance screening revealed a major quantitative trait locus (QTL) conferring Fusarium head blight resistance on the 3AS and 7AL chromosome arms, providing critical targets for marker-assisted selection [15].
In common hexaploid wheat, two sets of CASLs in the background of the common wheat varieties Bethlehem (BLH) and Chinese Spring (CS) were developed by the Weizmann Institute of Science in Israel through conventional hybridization and cytogenetic identification [16]. These CASLs carry single introgressed wild chromosome arms, enabling precise detection of arm-specific phenotypic variations while eliminating genetic interference from other donor chromosomes—a critical feature for quantifying wild chromosomal segment contributions [6,8]. Owing to their genetic homogeneity and stability, these lines permit perennial multi-location trials, making them powerful tools for dissecting complex agronomic traits [4]. The above advantages of these two sets of CASLs in agronomic trait QTL mapping and gene cloning have gradually shown their potential in the practice of wheat distant hybrid breeding, opening a new pathway for enriching wheat germplasm resources [6,17].
Thus, identifying chromosome regions that govern wheat agronomic traits during growth and development stages, and discovering relevant haplotype-specific SNP markers, will provide a strategic pathway to engineer novel wheat germplasm harboring stacked beneficial alleles, thereby shortening the breeding cycle for climate-resilient elite cultivars. In this study, we systematically phenotyped seedling-to-maturity agronomic traits across two sets of CASL populations to decode wild emmer’s genetic potential. The primary objective of this study is to identify candidate chromosomal regions associated with robust seedling growth, as well as spike and grain traits at maturity, ultimately to establish a theoretical framework and resource base for breeding high-performance wheat varieties adapted to China’s diverse agroecosystems.

2. Materials and Methods

2.1. Plant Material

The experimental materials employed in this study comprise two sets of chromosome arm substitution lines (CASLs) in common wheat (Triticum aestivum), developed in the genetic backgrounds of the hexaploid common wheat varieties Bethlehem (BLH) and Chinese Spring (CS). These CASL populations were introduced by our research group from Professor Feldman’s laboratory at the Weizmann Institute of Science, Israel [18]. BLH, a widely cultivated Israeli variety, is characterized by semi-dwarf stature, early maturity, and high yield potential [7]. In contrast, CS serves as a model genotype for wheat cytogenetic studies and is extensively utilized in foundational genetic research. Both CASL populations exhibit stable agronomic performance, well-defined genetic backgrounds, and precisely demarcated introgressed segments. The wild donor parent used for CASL development was TDIC140, a wild emmer wheat (Triticum dicoccoides) accession native to the eastern Galilee region of Israel. TDIC140 demonstrates resistance to multiple biotic and abiotic stresses, along with advantageous agronomic traits including prolific tillering, enlarged grain morphology, and elevated grain protein content [18,19]. CASLs were generated by hybridizing a disomic addition line of common wheat with the wild emmer accession TDIC140, followed by 4–7 generations of backcrossing to the respective disomic addition line and a single generation of selfing. Cytological verification was performed at each generation [6,8,20]. Wild emmer wheat possesses two genomes (A and B), comprising 14 chromosomes and 28 chromosome arms. While theoretically, 28 CASLs are possible for each recurrent parent, CASLs for chromosome arms 2AL, 4AS, 5AL, and 6BS in the BLH background were not recovered, presumably due to sterility associated with these introgressions [6,7,8]. This indicates that a total of 24 substitution lines were generated in the BLH background, while 28 were produced in the CS background (Table 1).

2.2. Field Experimental Design

CASLs and their parents were evaluated under field conditions during two consecutive growing seasons (November 2014 and December 2015) in Lin’an, Zhejiang Province, China (30.25° N, 119.72° E, 44.2 m above sea level). Field trials employed a randomized complete block design with three replications. Each plot consisted of six double rows (1.2 m long, 0.4 m inter-row spacing) with plants spaced 0.2 m apart within rows (seven plants per row). Standard agronomic practices for large-scale wheat production, including fertilization, irrigation, pest, and weed control, were implemented. They were harvested in June 2015 and June 2016, respectively. Two sets of CASLs were also evaluated in a greenhouse experiment at Zhejiang A&F University in November 2015. Three replicates per CASL were used, with each replicate consisting of three plants grown in a single pot. BLH and CS were included as controls in the greenhouse experiment.

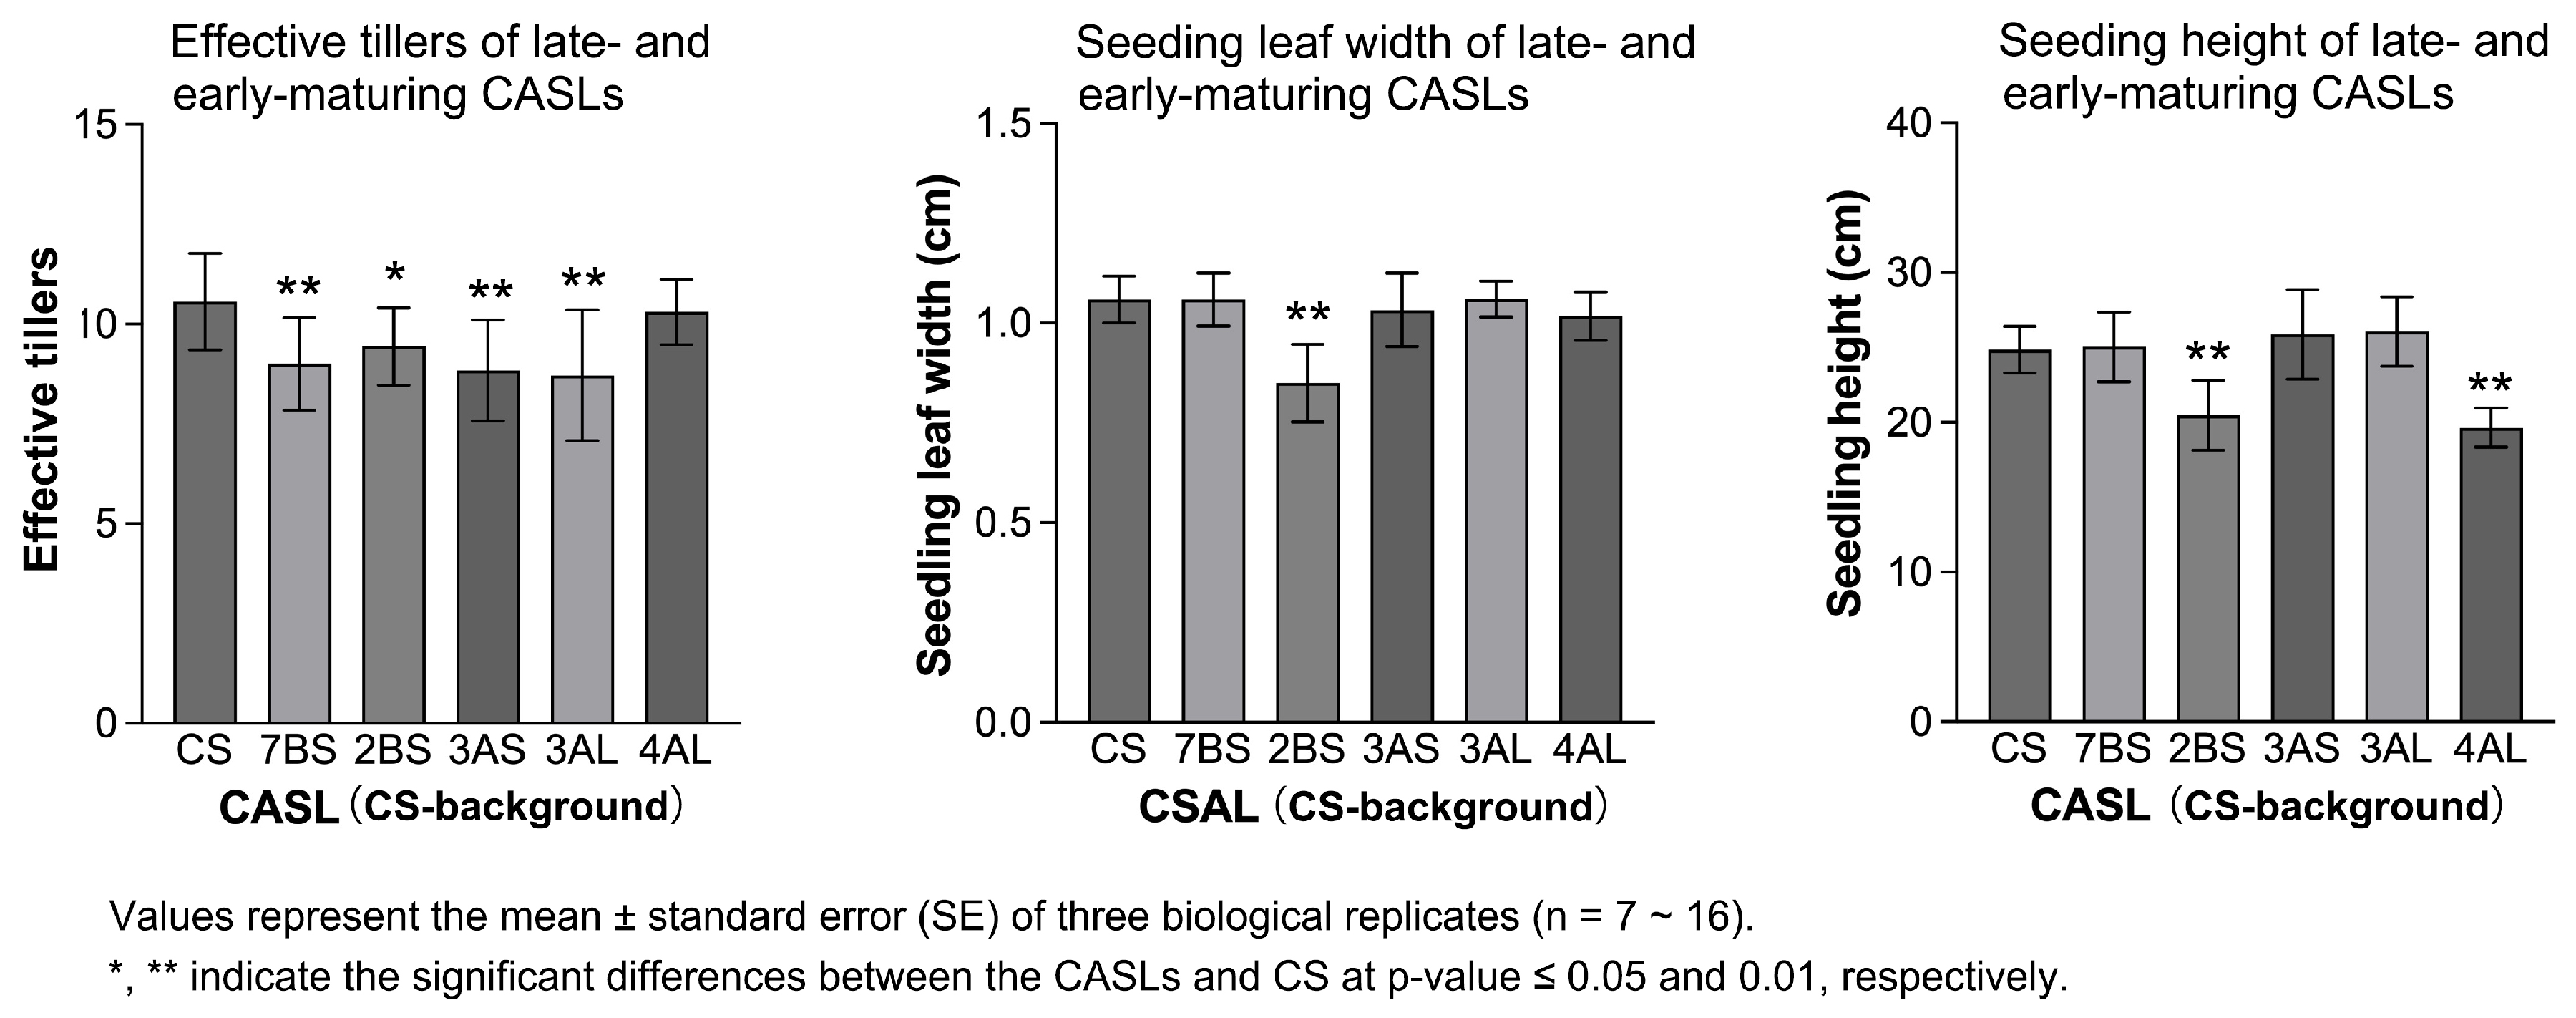
2.3. Investigation of Agronomic Traits at the Seedling Stage

Seedling growth habit of both CASL populations was categorized as prostrate, semi-prostrate, or erect. To compare developmental traits across CASLs, aboveground biomass accumulation was evaluated. Plant height (measured from soil surface to uppermost leaf collar base, in cm), leaf width (maximum blade breadth perpendicular to midrib, in mm), and tiller count (number of fertile tillers per plant) were measured at the peak tillering stage (Zadoks growth stage 29) using standardized phenotyping protocols. Leaf width was measured using a digital caliper (Mitutoyo 500-196-30; accuracy: 0.01 mm) on leaves positioned over a matte white PVC substrate. To mitigate measurement errors induced by leaf curvature, samples were gently flattened with optical-grade glass slides prior to measurement. Three replicate measurements were taken at the maximum width of the fourth fully expanded leaf blade on the main stem, with the final value representing the arithmetic mean of these observations. All measurements were conducted on three plants per genotype, followed by calculation of mean values with standard deviation (mean ± SD; n = 3 biological replicates). Data processing and statistical evaluations were executed through the SPSS Statistics software package version 27.0 (IBM Corp., Endicott, NY, USA, 2020), with the predetermined significance criterion set at p < 0.05 for all inferential analyses. The determination of statistically significant mean differences was achieved through Fisher’s least significant difference (LSD) post hoc testing procedure (IBM SPSS Statistics v27.0), implemented after obtaining a significant omnibus F-test in one-way ANOVA. This software version applies to all subsequent analyses unless otherwise specified.

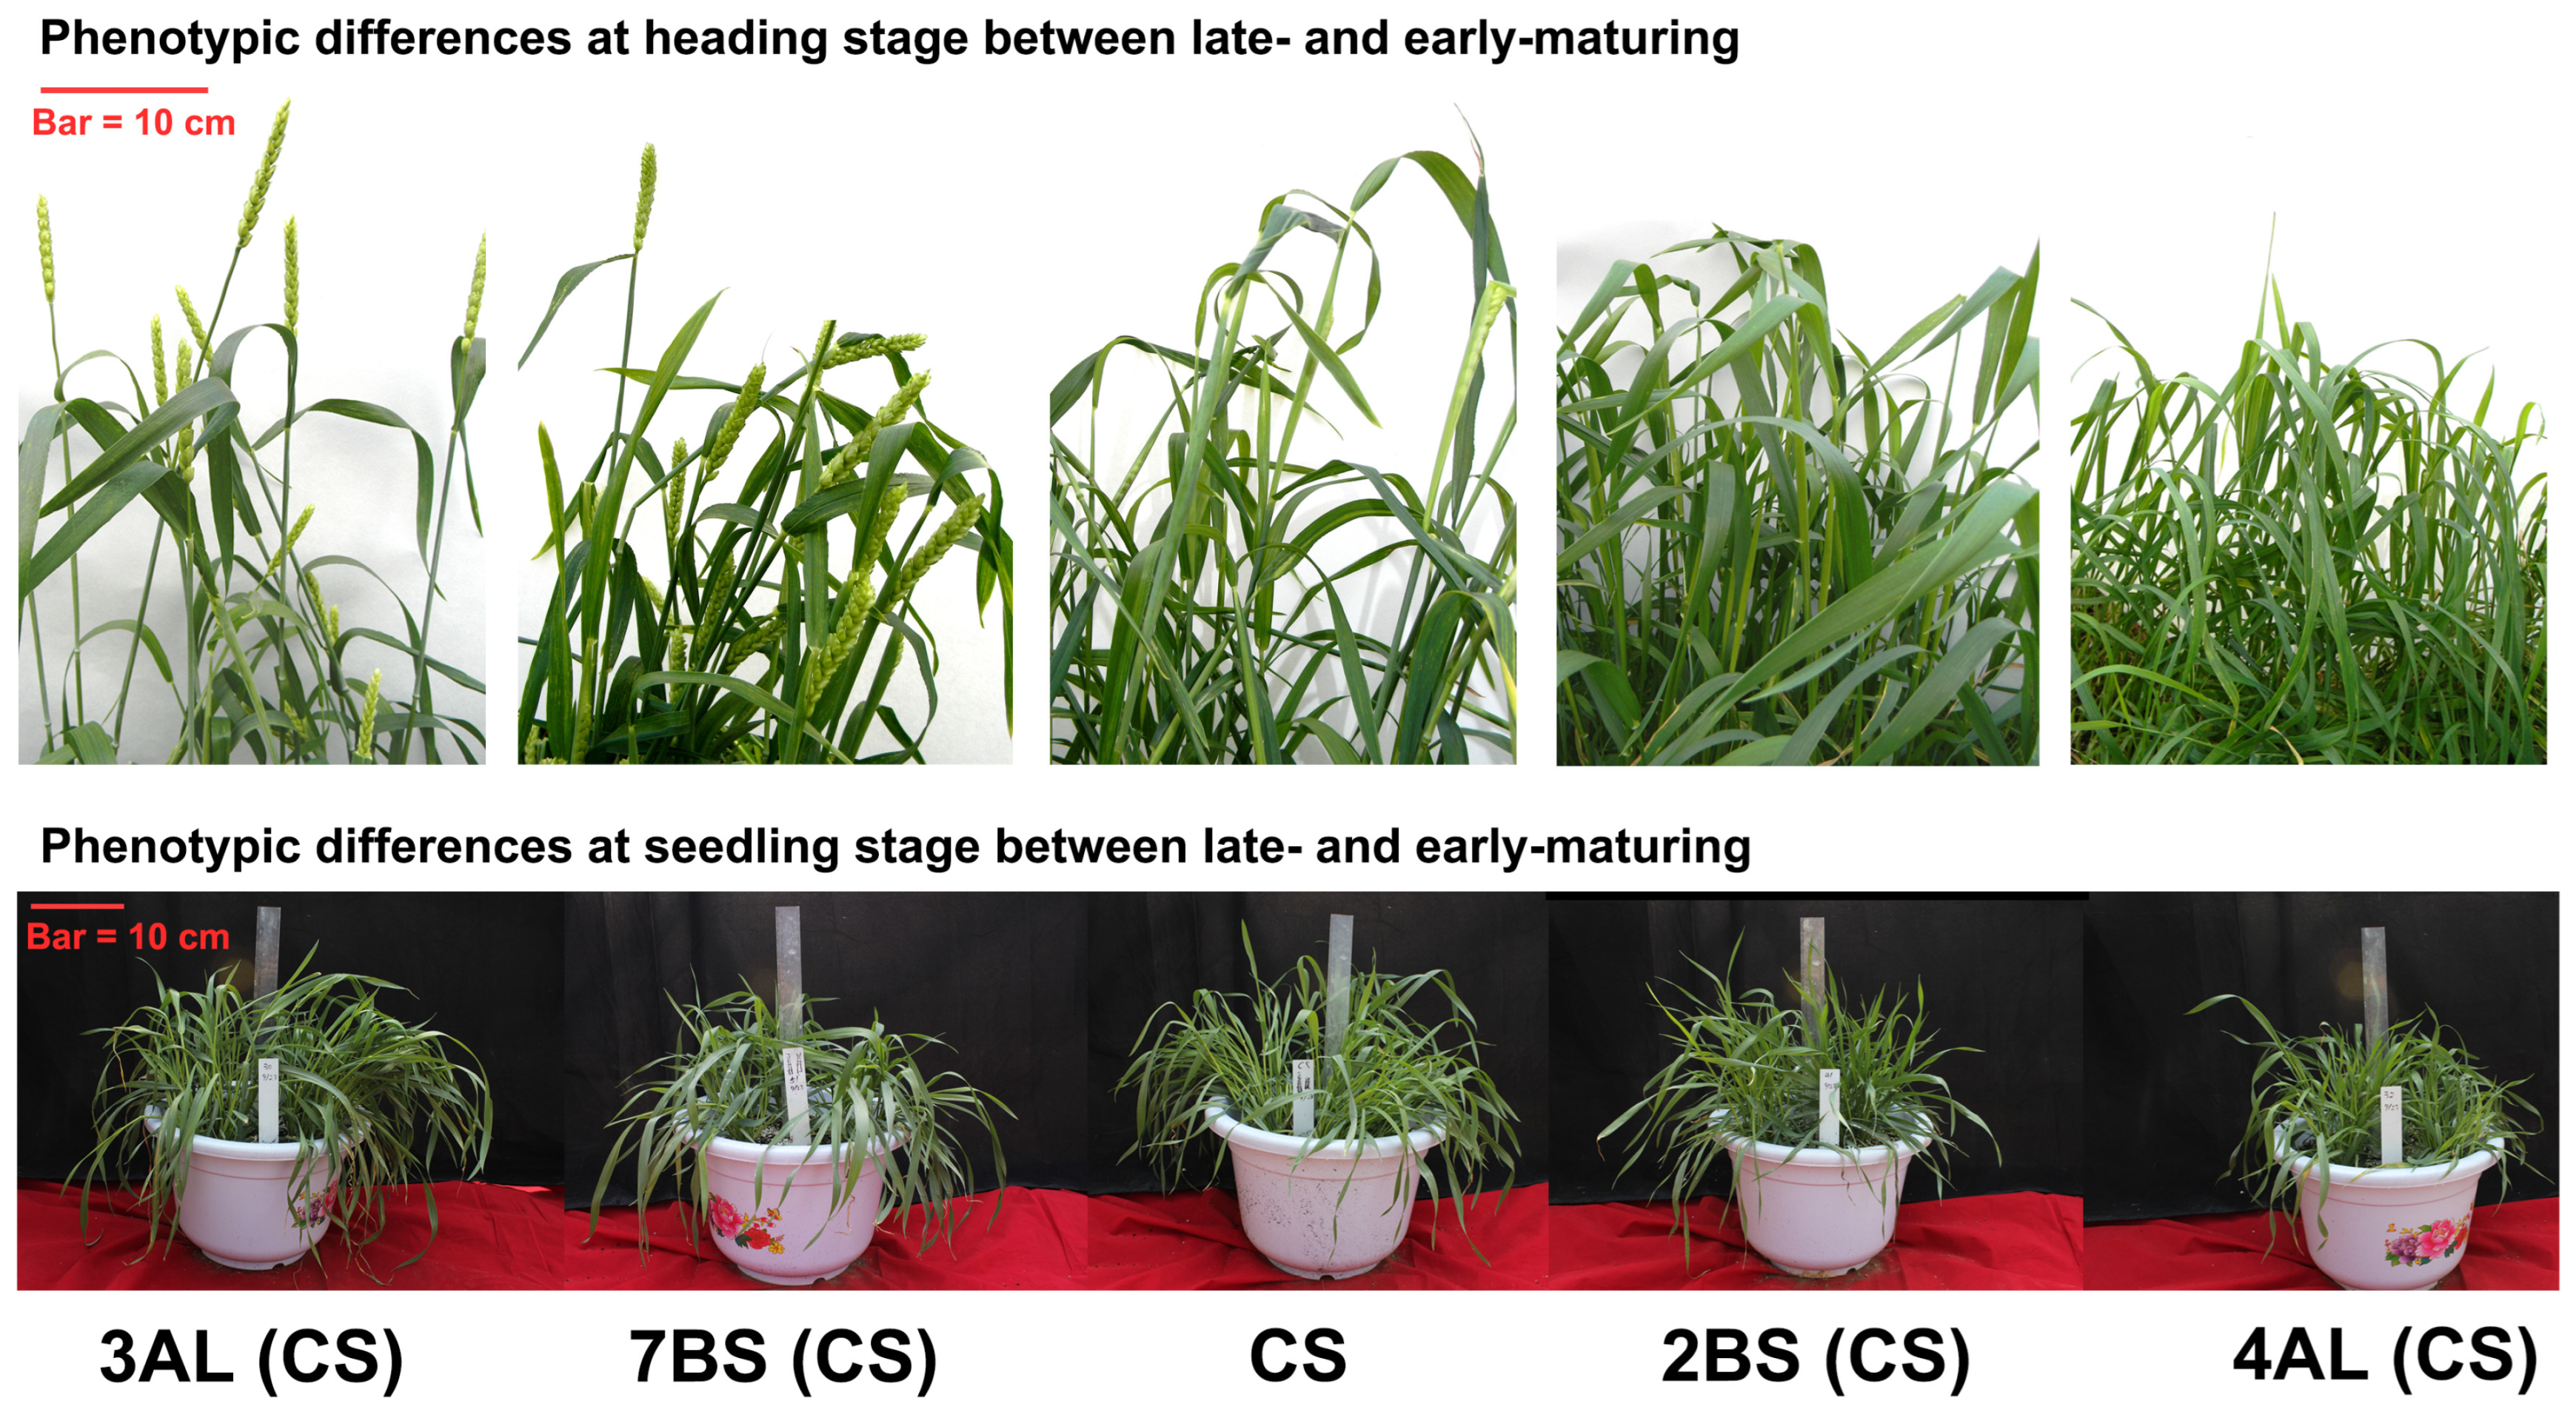
2.4. Agronomic Trait Survey at Heading Stage

To mitigate microenvironmental bias, border plants (first two and last two per row) were excluded from analysis due to edge effects on phenotypic stability. Heading date (HD) was determined when 50% of spikes emerged from flag leaf sheaths. Days to HD were calculated as sowing-to-heading intervals, with subsequent computation of the mean HD ± standard deviation. Tagged plants with recorded HD were systematically excluded from later observations to prevent redundant data collection.

2.5. CASLs Propagation

Wheat was harvested individually, and yield-related traits were evaluated under controlled environment conditions. Propagation procedures followed the “National Wheat Variety Regional Trial Recording Standard” (GB/T 1301-2007).

2.6. Yield Trait Survey

Four yield-related traits were investigated: grain length (GL, mm), grain width (GW, mm), grain thickness (GT, mm), and thousand-kernel weight (TKW, g). For GL and GW, 20 fully intact grains per sample were randomly selected and scanned using an HP5590 scanner. Background-subtracted images were processed in Photoshop and analyzed with Seed_Identification V1.0 software to quantify RGB values, grayscale values, length, width, and projected area. GT was measured with a digital vernier caliper on 20 randomly selected grains per sample. For TKW, two replicates of 500 grains per sample triplicate measurements were averaged for analysis. For TKW, two replicates of 500 grains per sample were dried at 37 °C for 72 h and weighed on an electronic balance (accuracy: 0.01 g). TKW was calculated as: TKW (g) = (W/n) × 1000, where “W” is the total weight and “n” is the number of grains. Three technical replicates ensured a measurement error tolerance of <0.5 g.

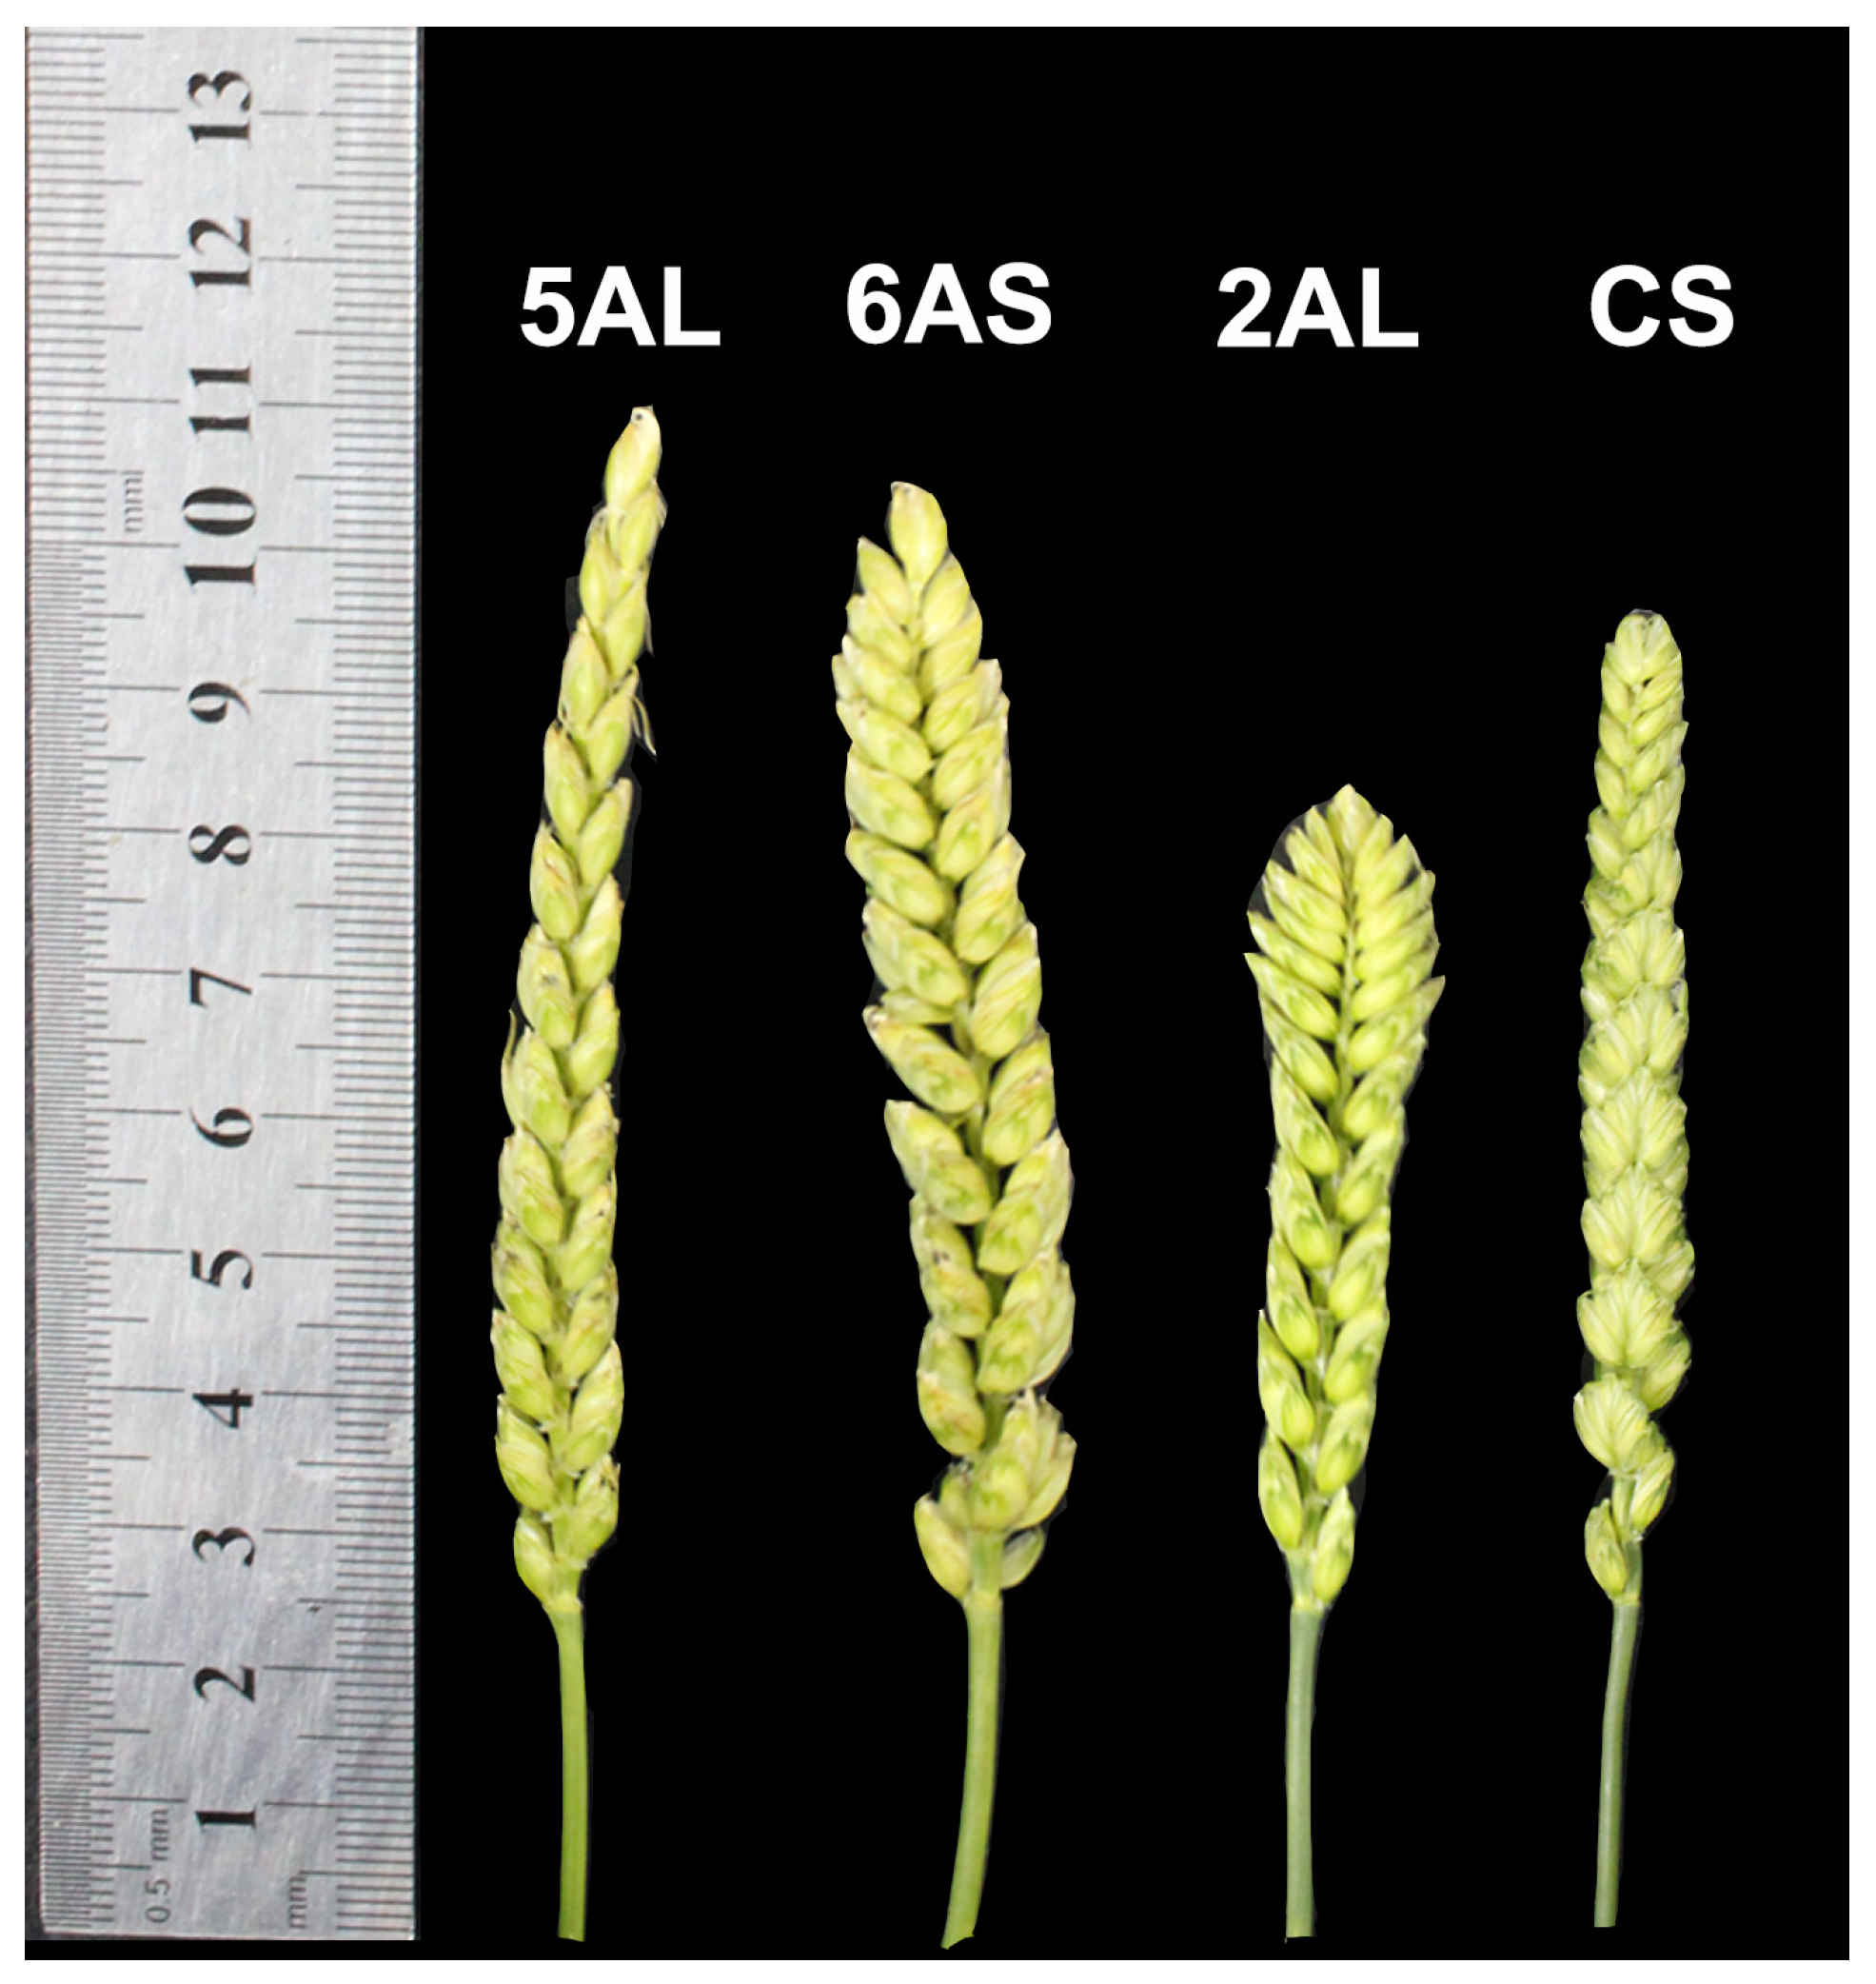
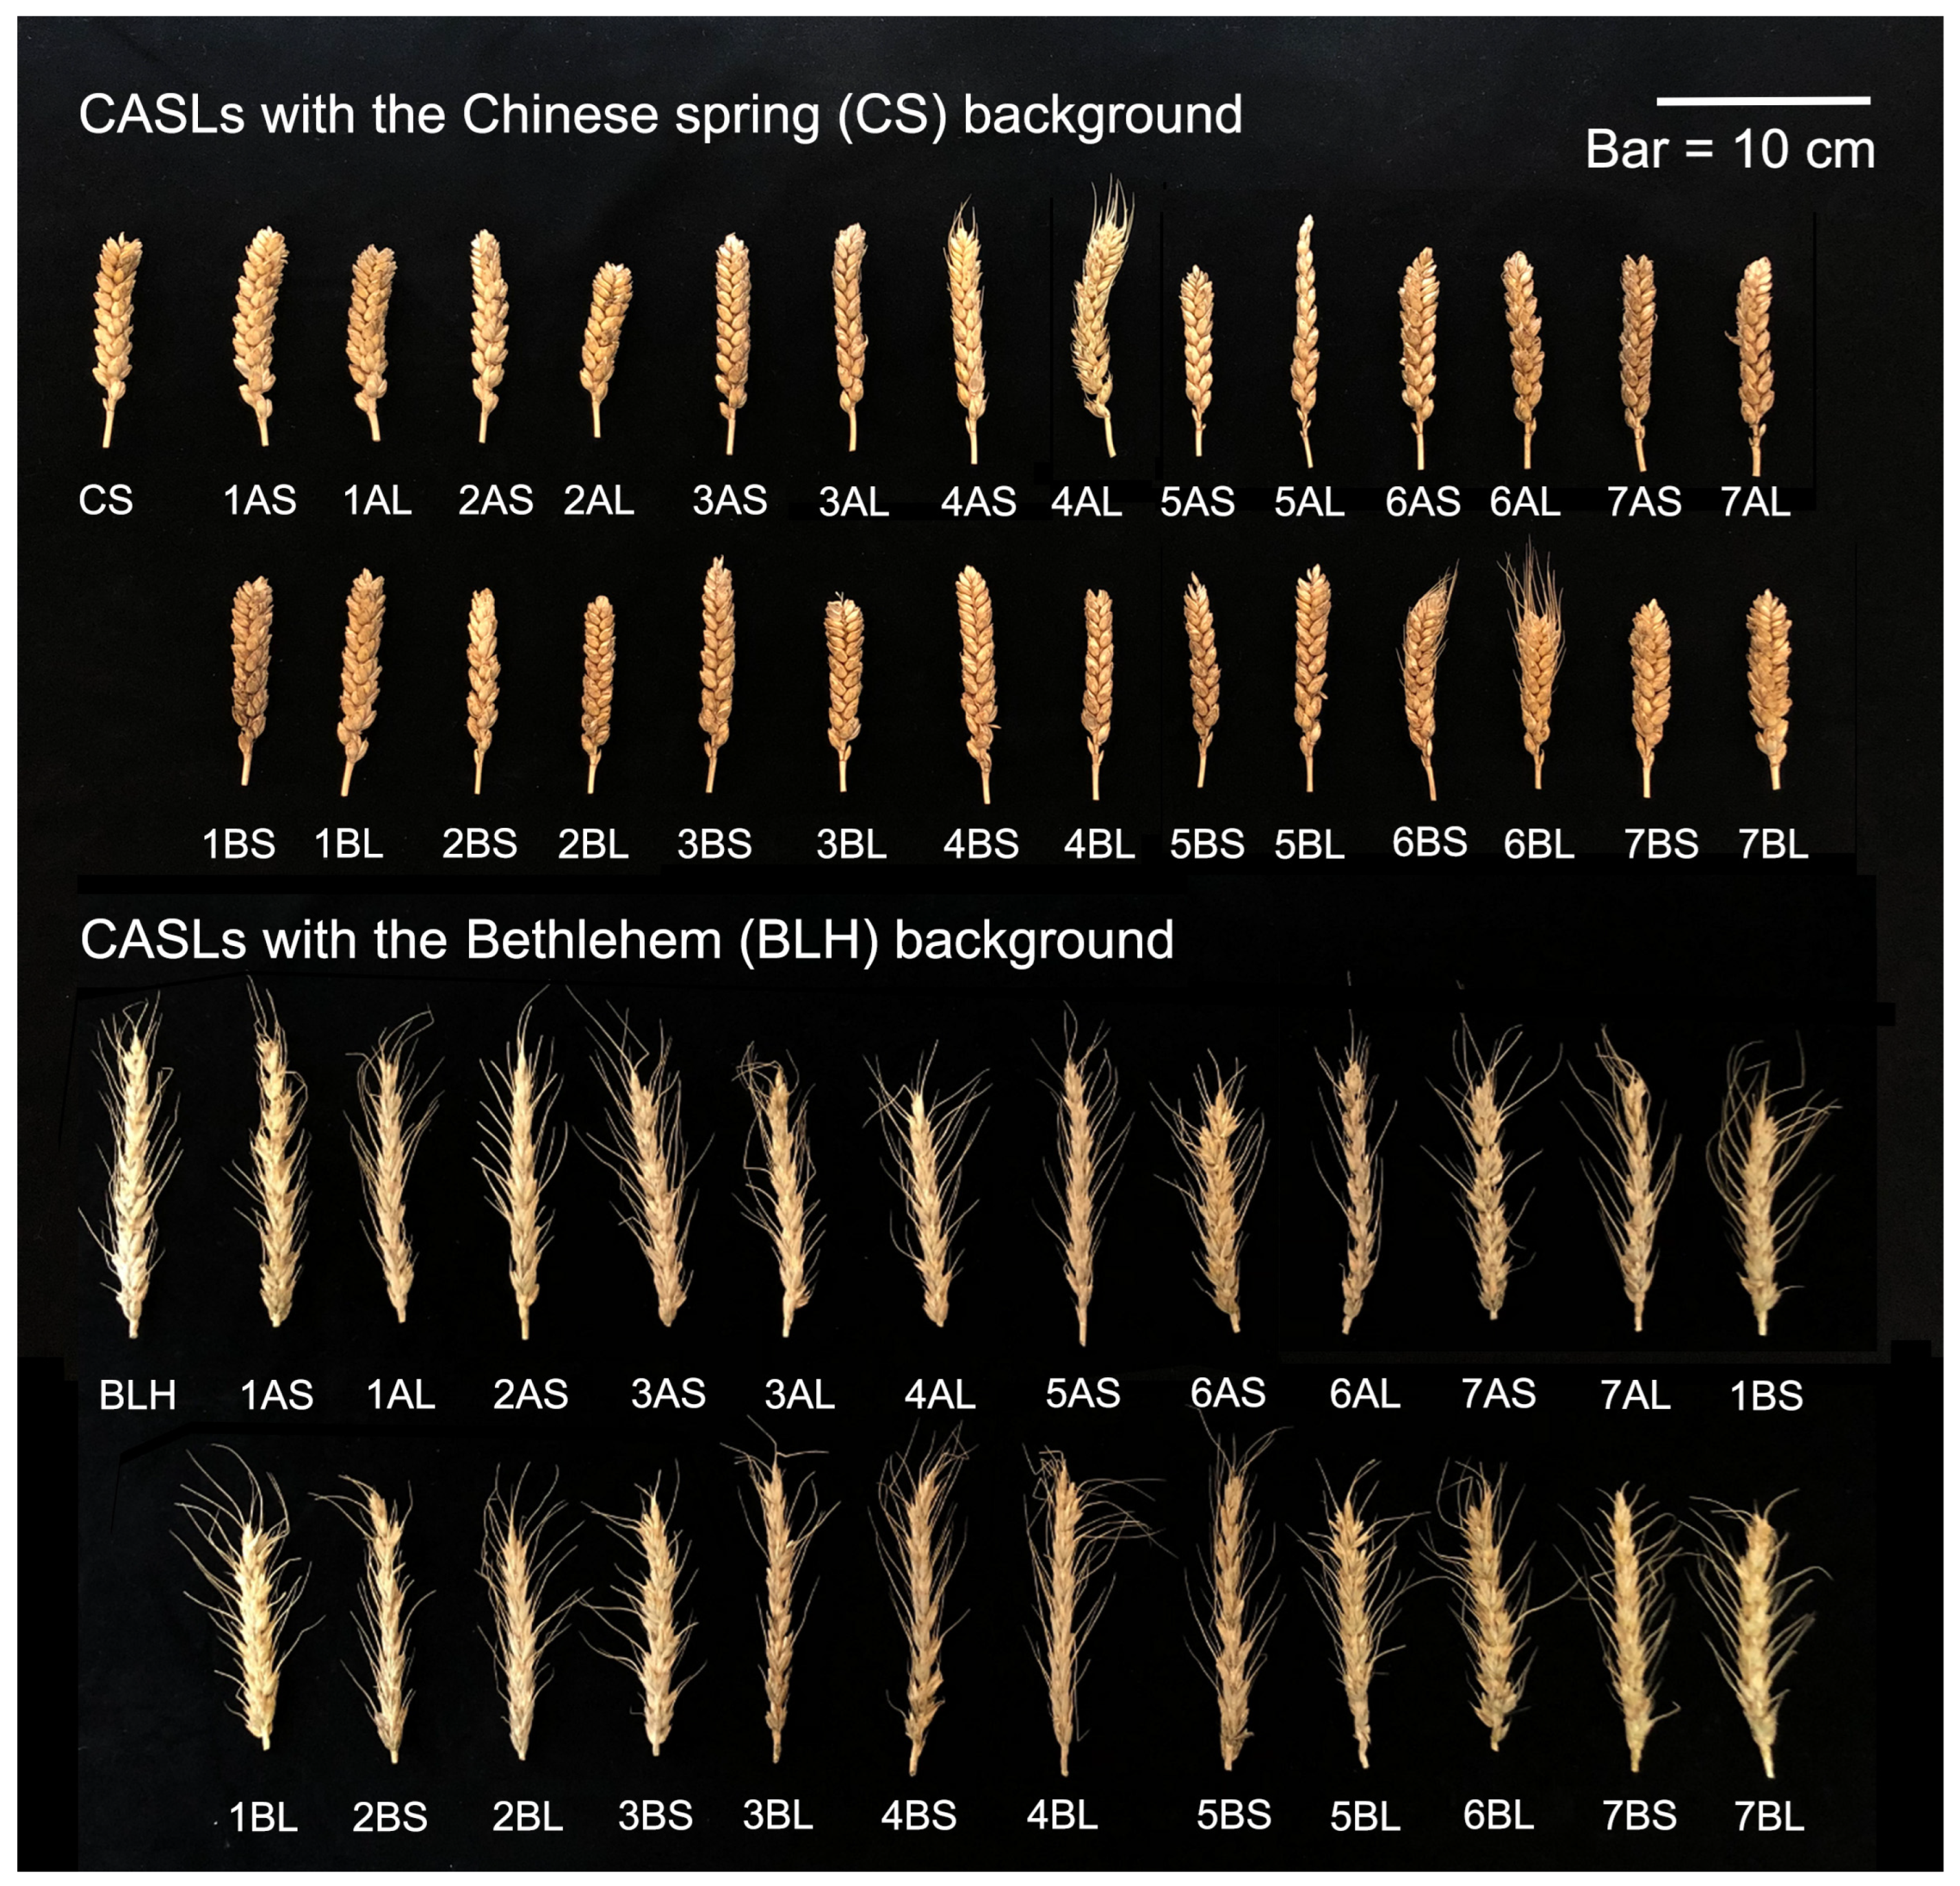
2.7. Spike Trait Survey

The primary characteristics of spikes encompassed several key indicators: length (measured from the peduncle to the awn base), total spikelet count (including both fertile and sterile units), fertile spikelet frequency, panicle morphology, and awn dimensions. Spikelet quantification involved recording all floral structures per spike, with specific documentation of grain-bearing units. Kernel production was assessed by harvesting and threshing 30 randomly selected spikes per CASL, using triplicate measurements to calculate the average grain yield per spike. Awn typology and spike morphology classifications followed the criteria outlined in Table 2 and Table 3, respectively.

3. Results

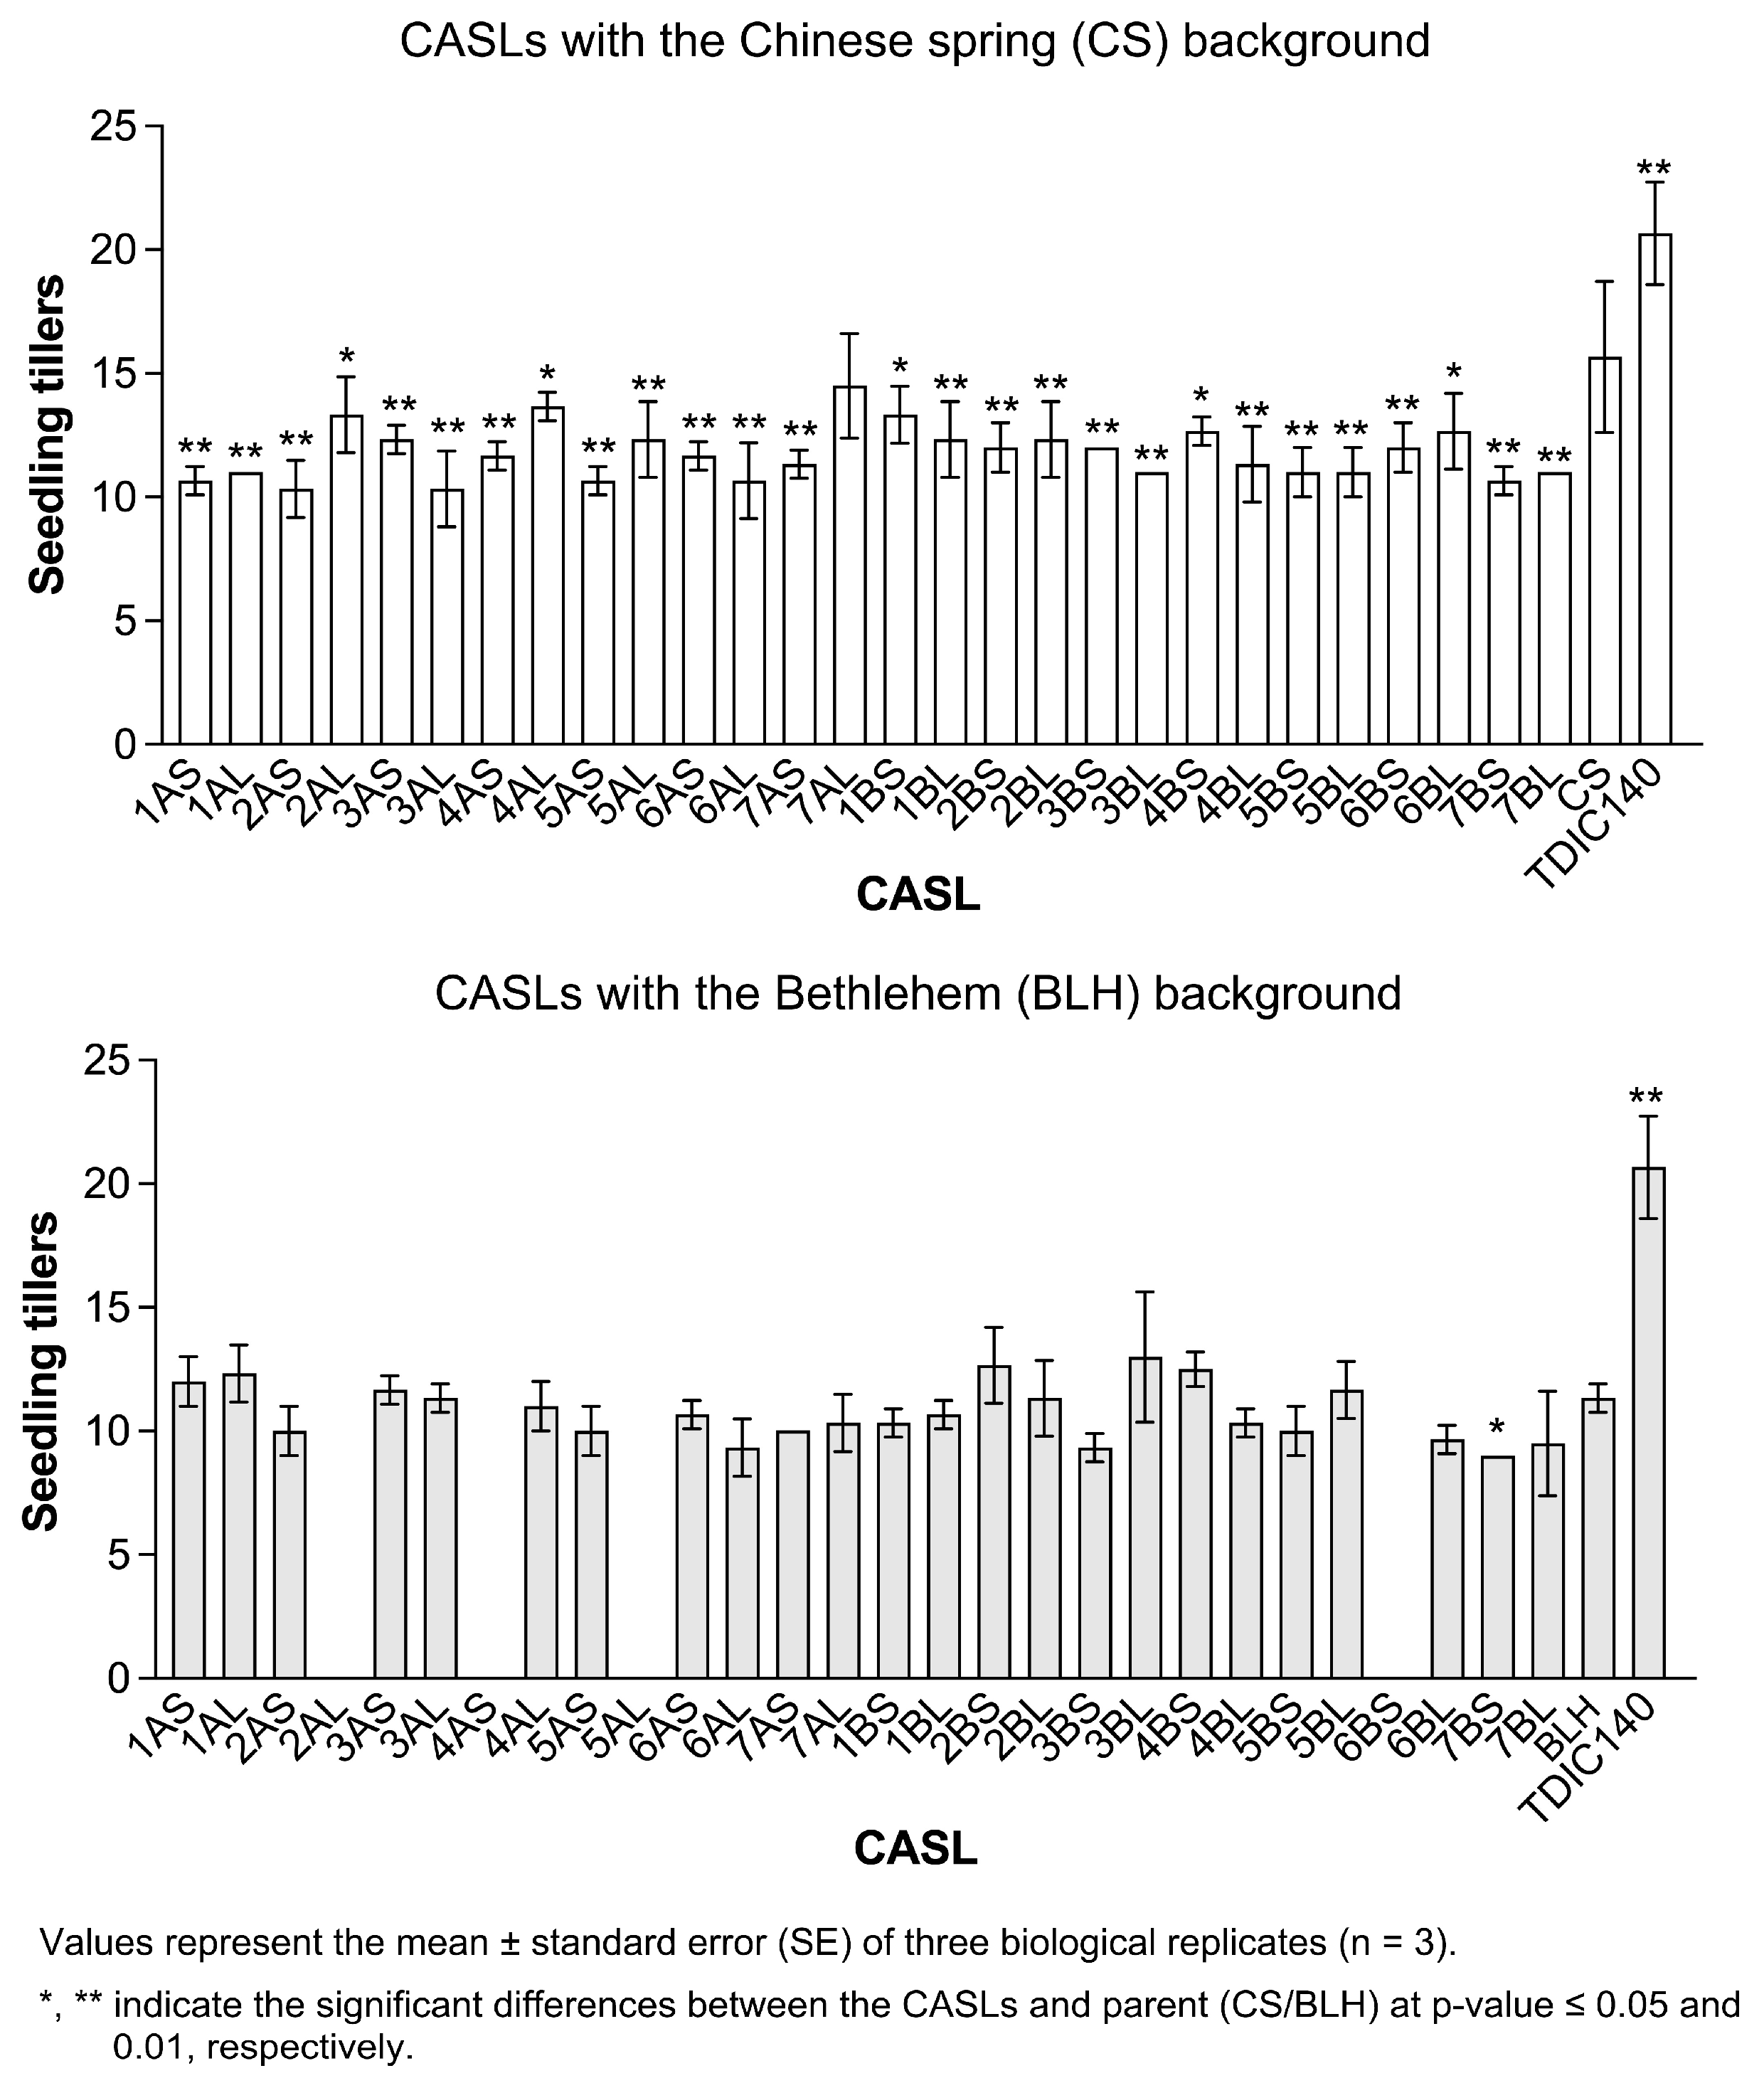
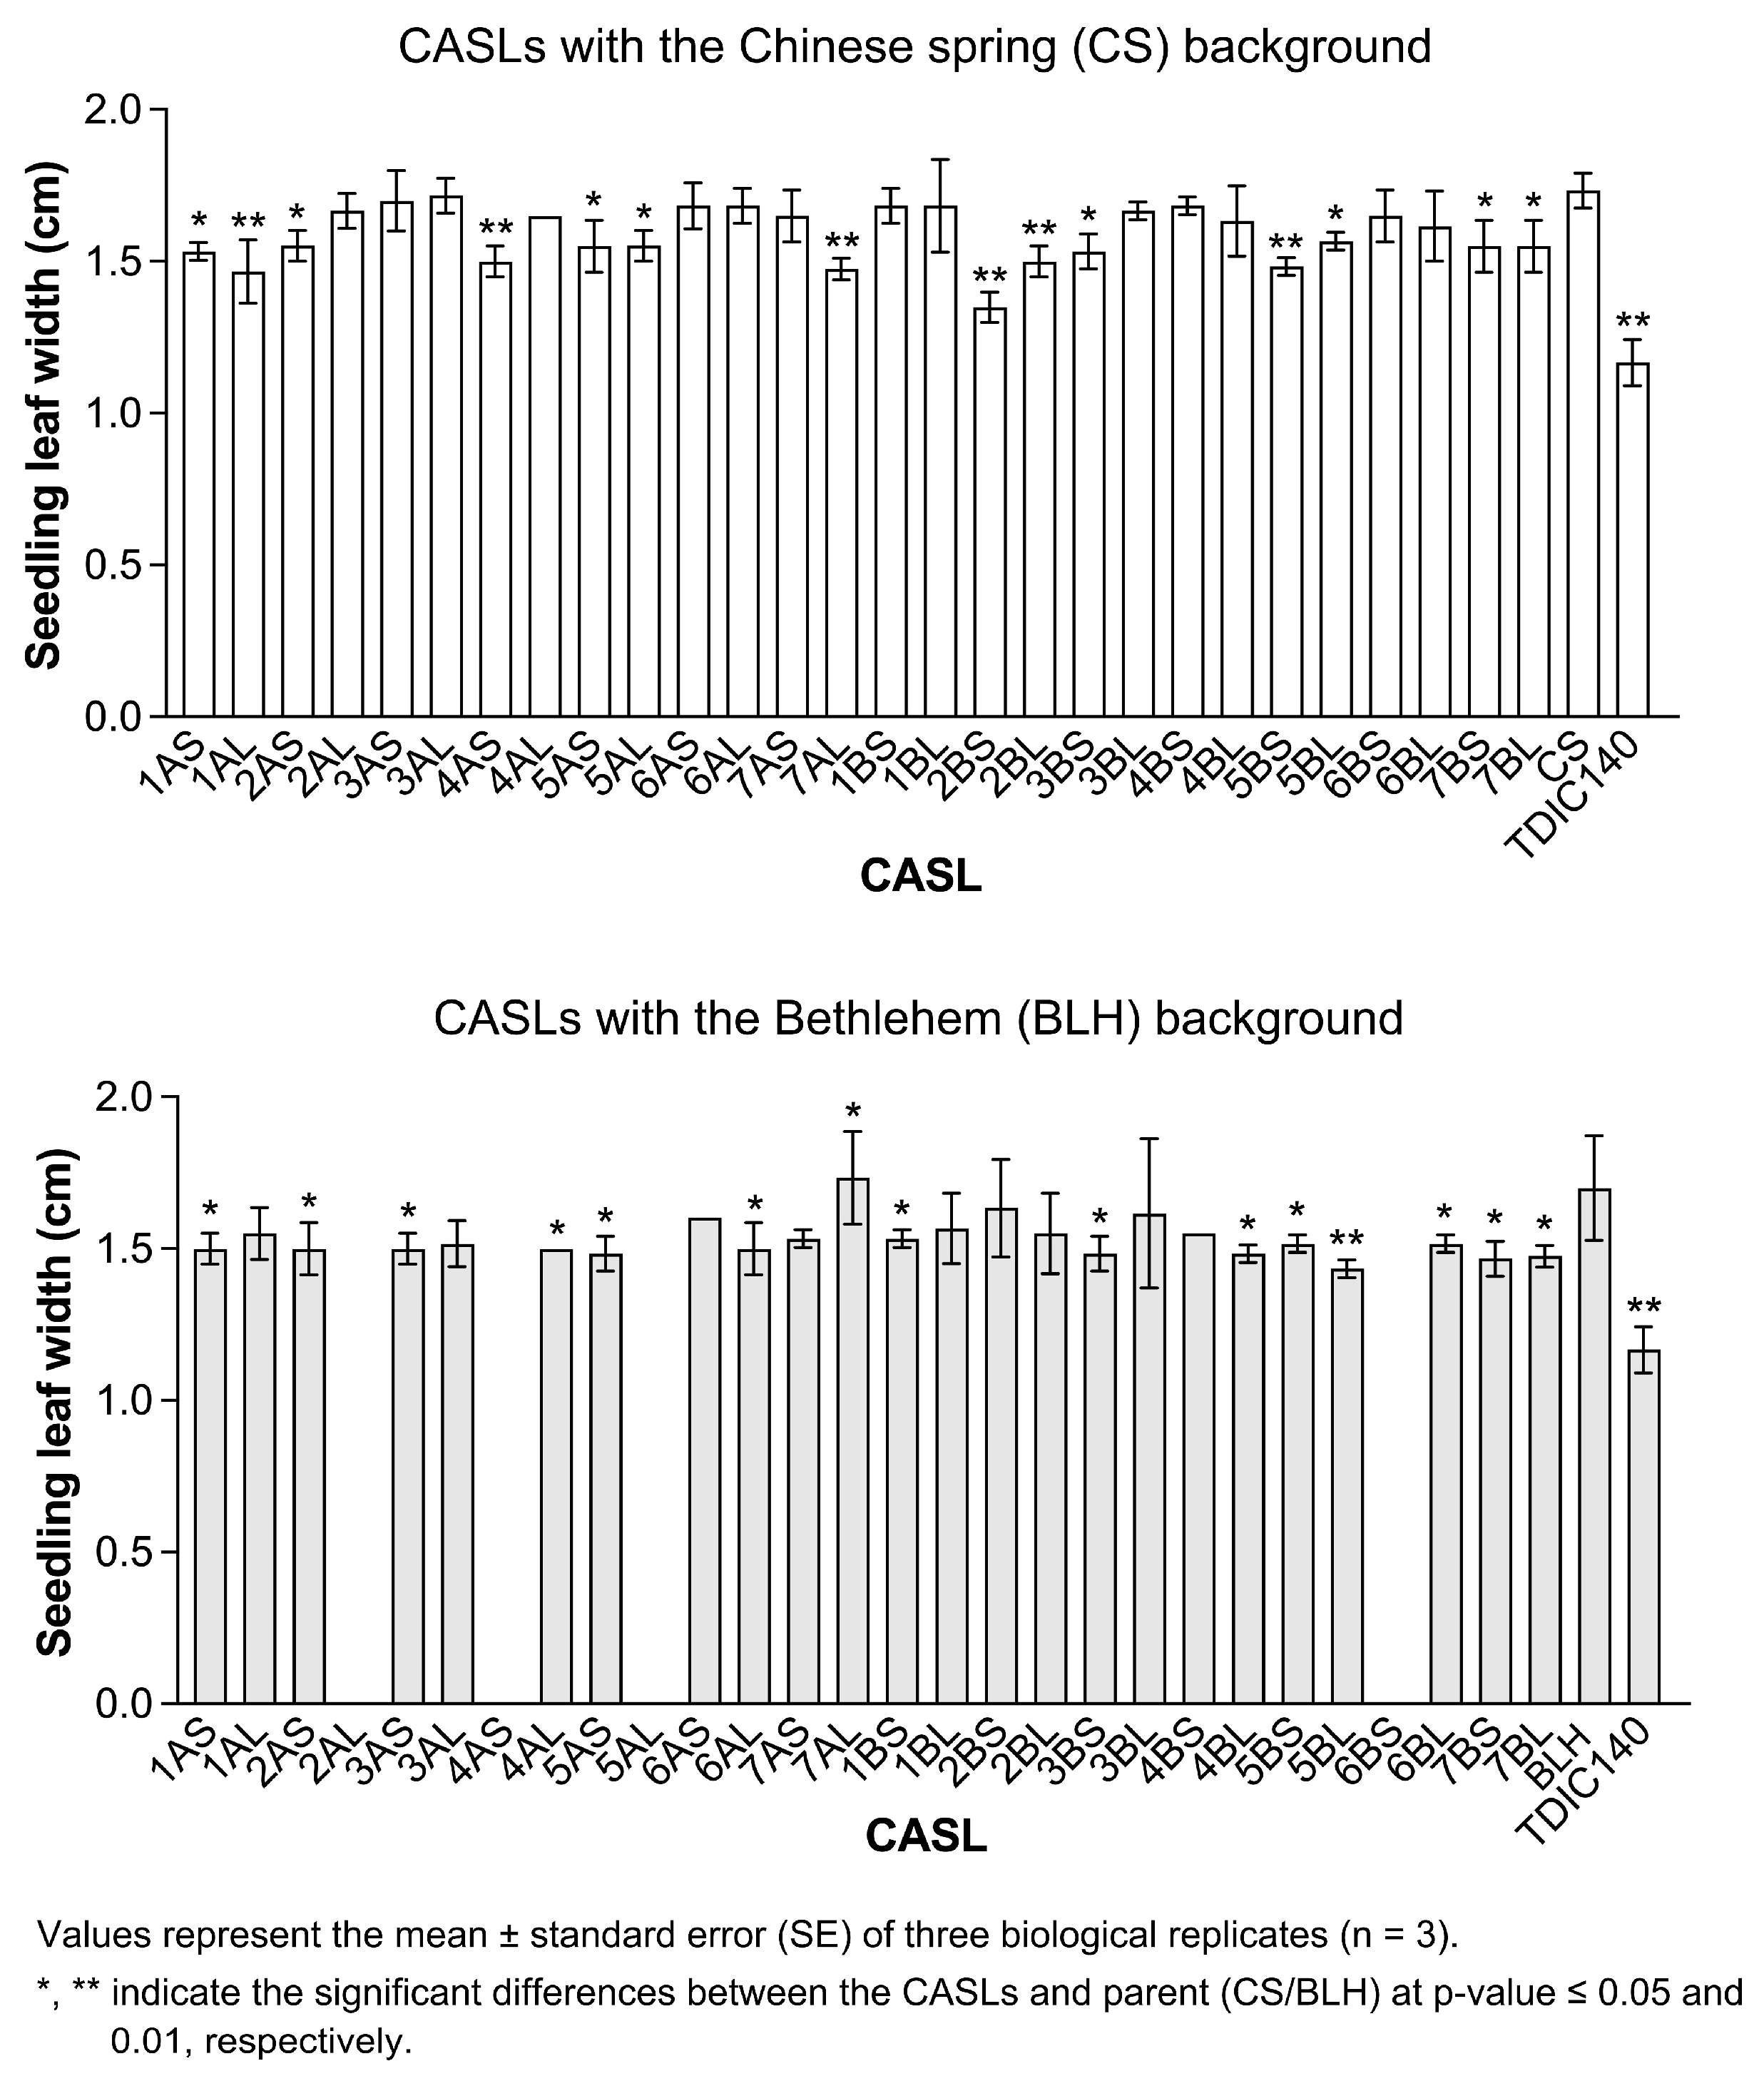
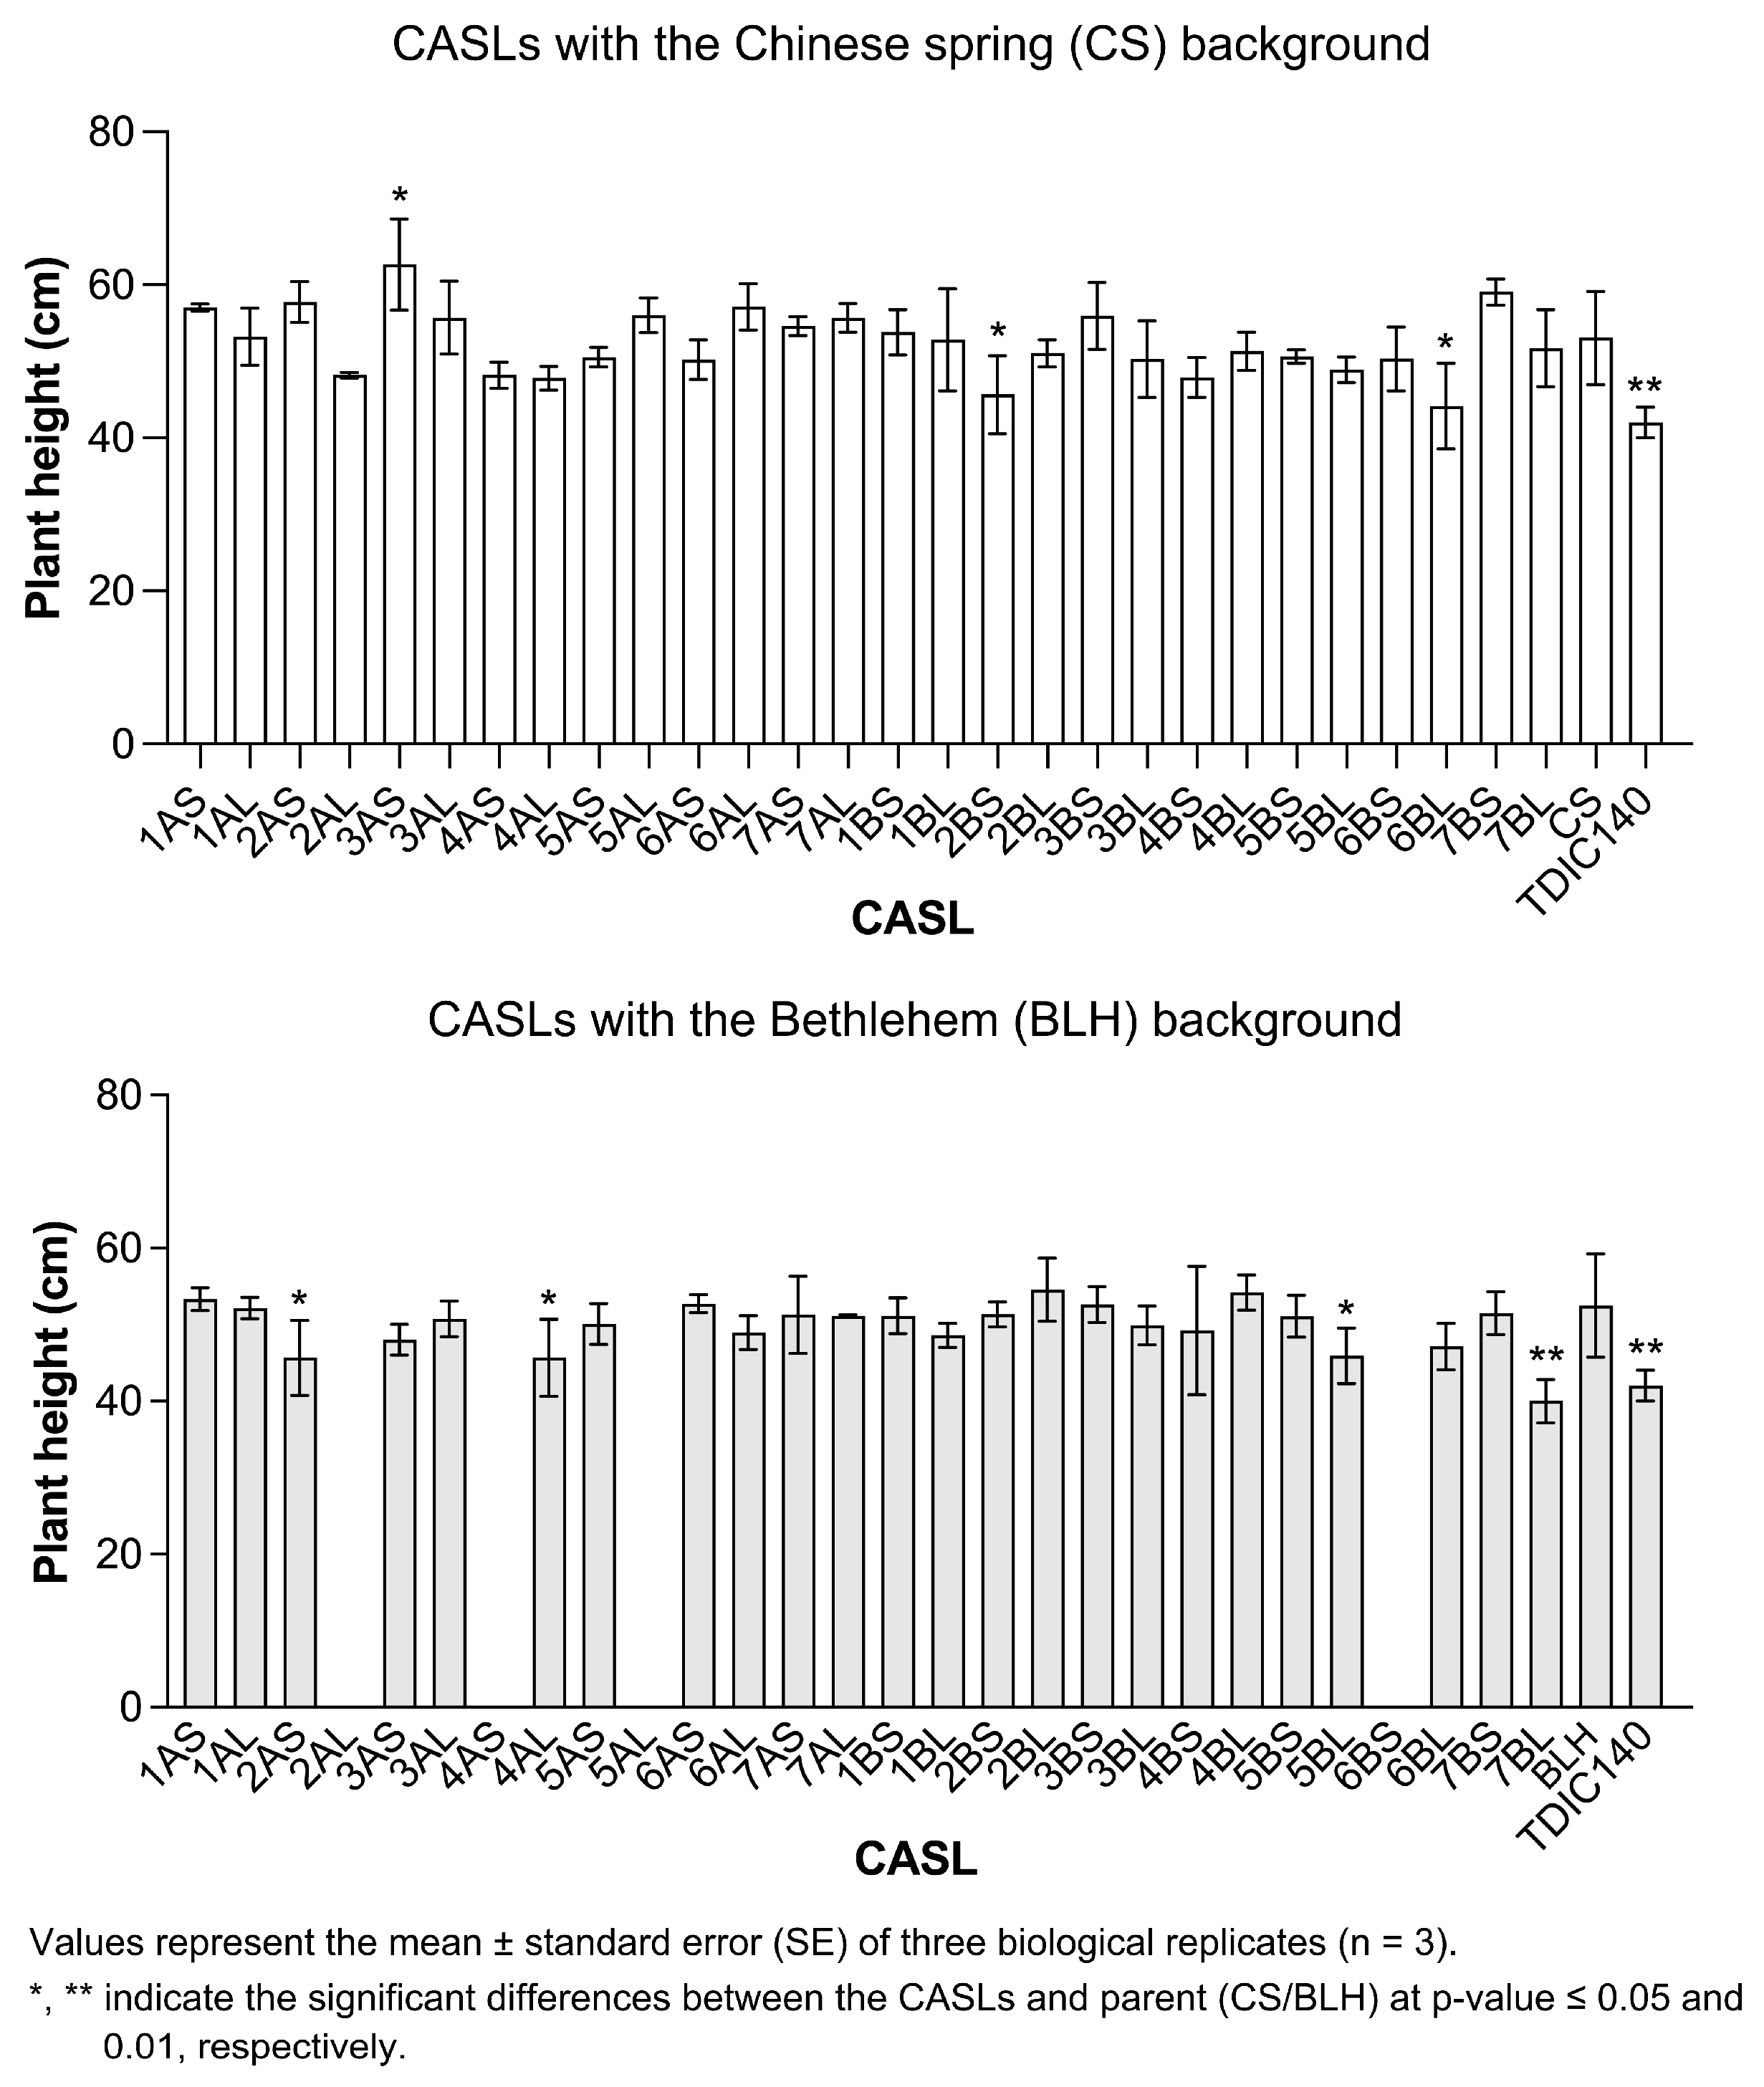
3.1. Statistical Analysis of Agronomic Traits During the Seedling Stage

Seedling Tiller Number: Tiller numbers at the seedling stage were statistically compared across two sets of CASLs, their respective parents (BLH and CS), and the wild wheat accession TDIC140 (Figure 1). TDIC140 displayed the highest mean tiller number (20.7 ± 0.8), significantly greater than both sets of CASLs and their parents (p < 0.01). Notably, all CASLs showed significant tiller reduction relative to corresponding parents, with the CS background demonstrating more severe suppression: 100% of CS-background CASLs had lower tiller counts than the parents (Figure 1). Fifteen CASLs exhibited mean tiller numbers below 11.67, suggesting possible gene pyramiding effects. Specifically, CASL7BS displayed significantly reduced tiller numbers across both backgrounds compared to the parents.
Seedling Leaf Width: Seedling leaf width was analyzed for statistical significance (Figure 2). TDIC140 displayed the narrowest leaf width (<1.17 cm), being significantly narrower than those of both parental varieties BLH (1.73 cm) and CS (1.73 cm), as well as their CASLs. In the BLH background, all CASLs except CASL7AL, which maintained leaf width equivalent to BLH, showed significantly narrower leaves than the parent. Twenty of these CASLs exhibited average leaf widths below 1.57 cm. In the CS background, all CASLs demonstrated significantly narrower leaves than the CS parent, with six CASLs (CASL2BS, CASL1AL, CASL7AL, CASL5BS, CASL4AS, and CASL2BL) displaying average widths under 1.50 cm.
Seedling Height: Seedling height was analyzed for statistical significance (Figure 3). The average seedling height of TDIC140 was 42.0 cm, while that of the BLH parent measured 52.5 cm. In the BLH background, four CASLs (CASL5BL, CASL2AS, CASL4AL, and CASL7BL) exhibited average heights below 46.0 cm and were significantly shorter than the parental height. CASL7BL attained an average height of 40.0 cm, equivalent to 76% of the parental height. In the CS background, CASL3AS (62.7 cm) showed a significantly greater seedling height than the CS parent (53.1 cm). Conversely, CASL2BS and CASL6BL had average heights below 45.7 cm, being significantly shorter than the parental.

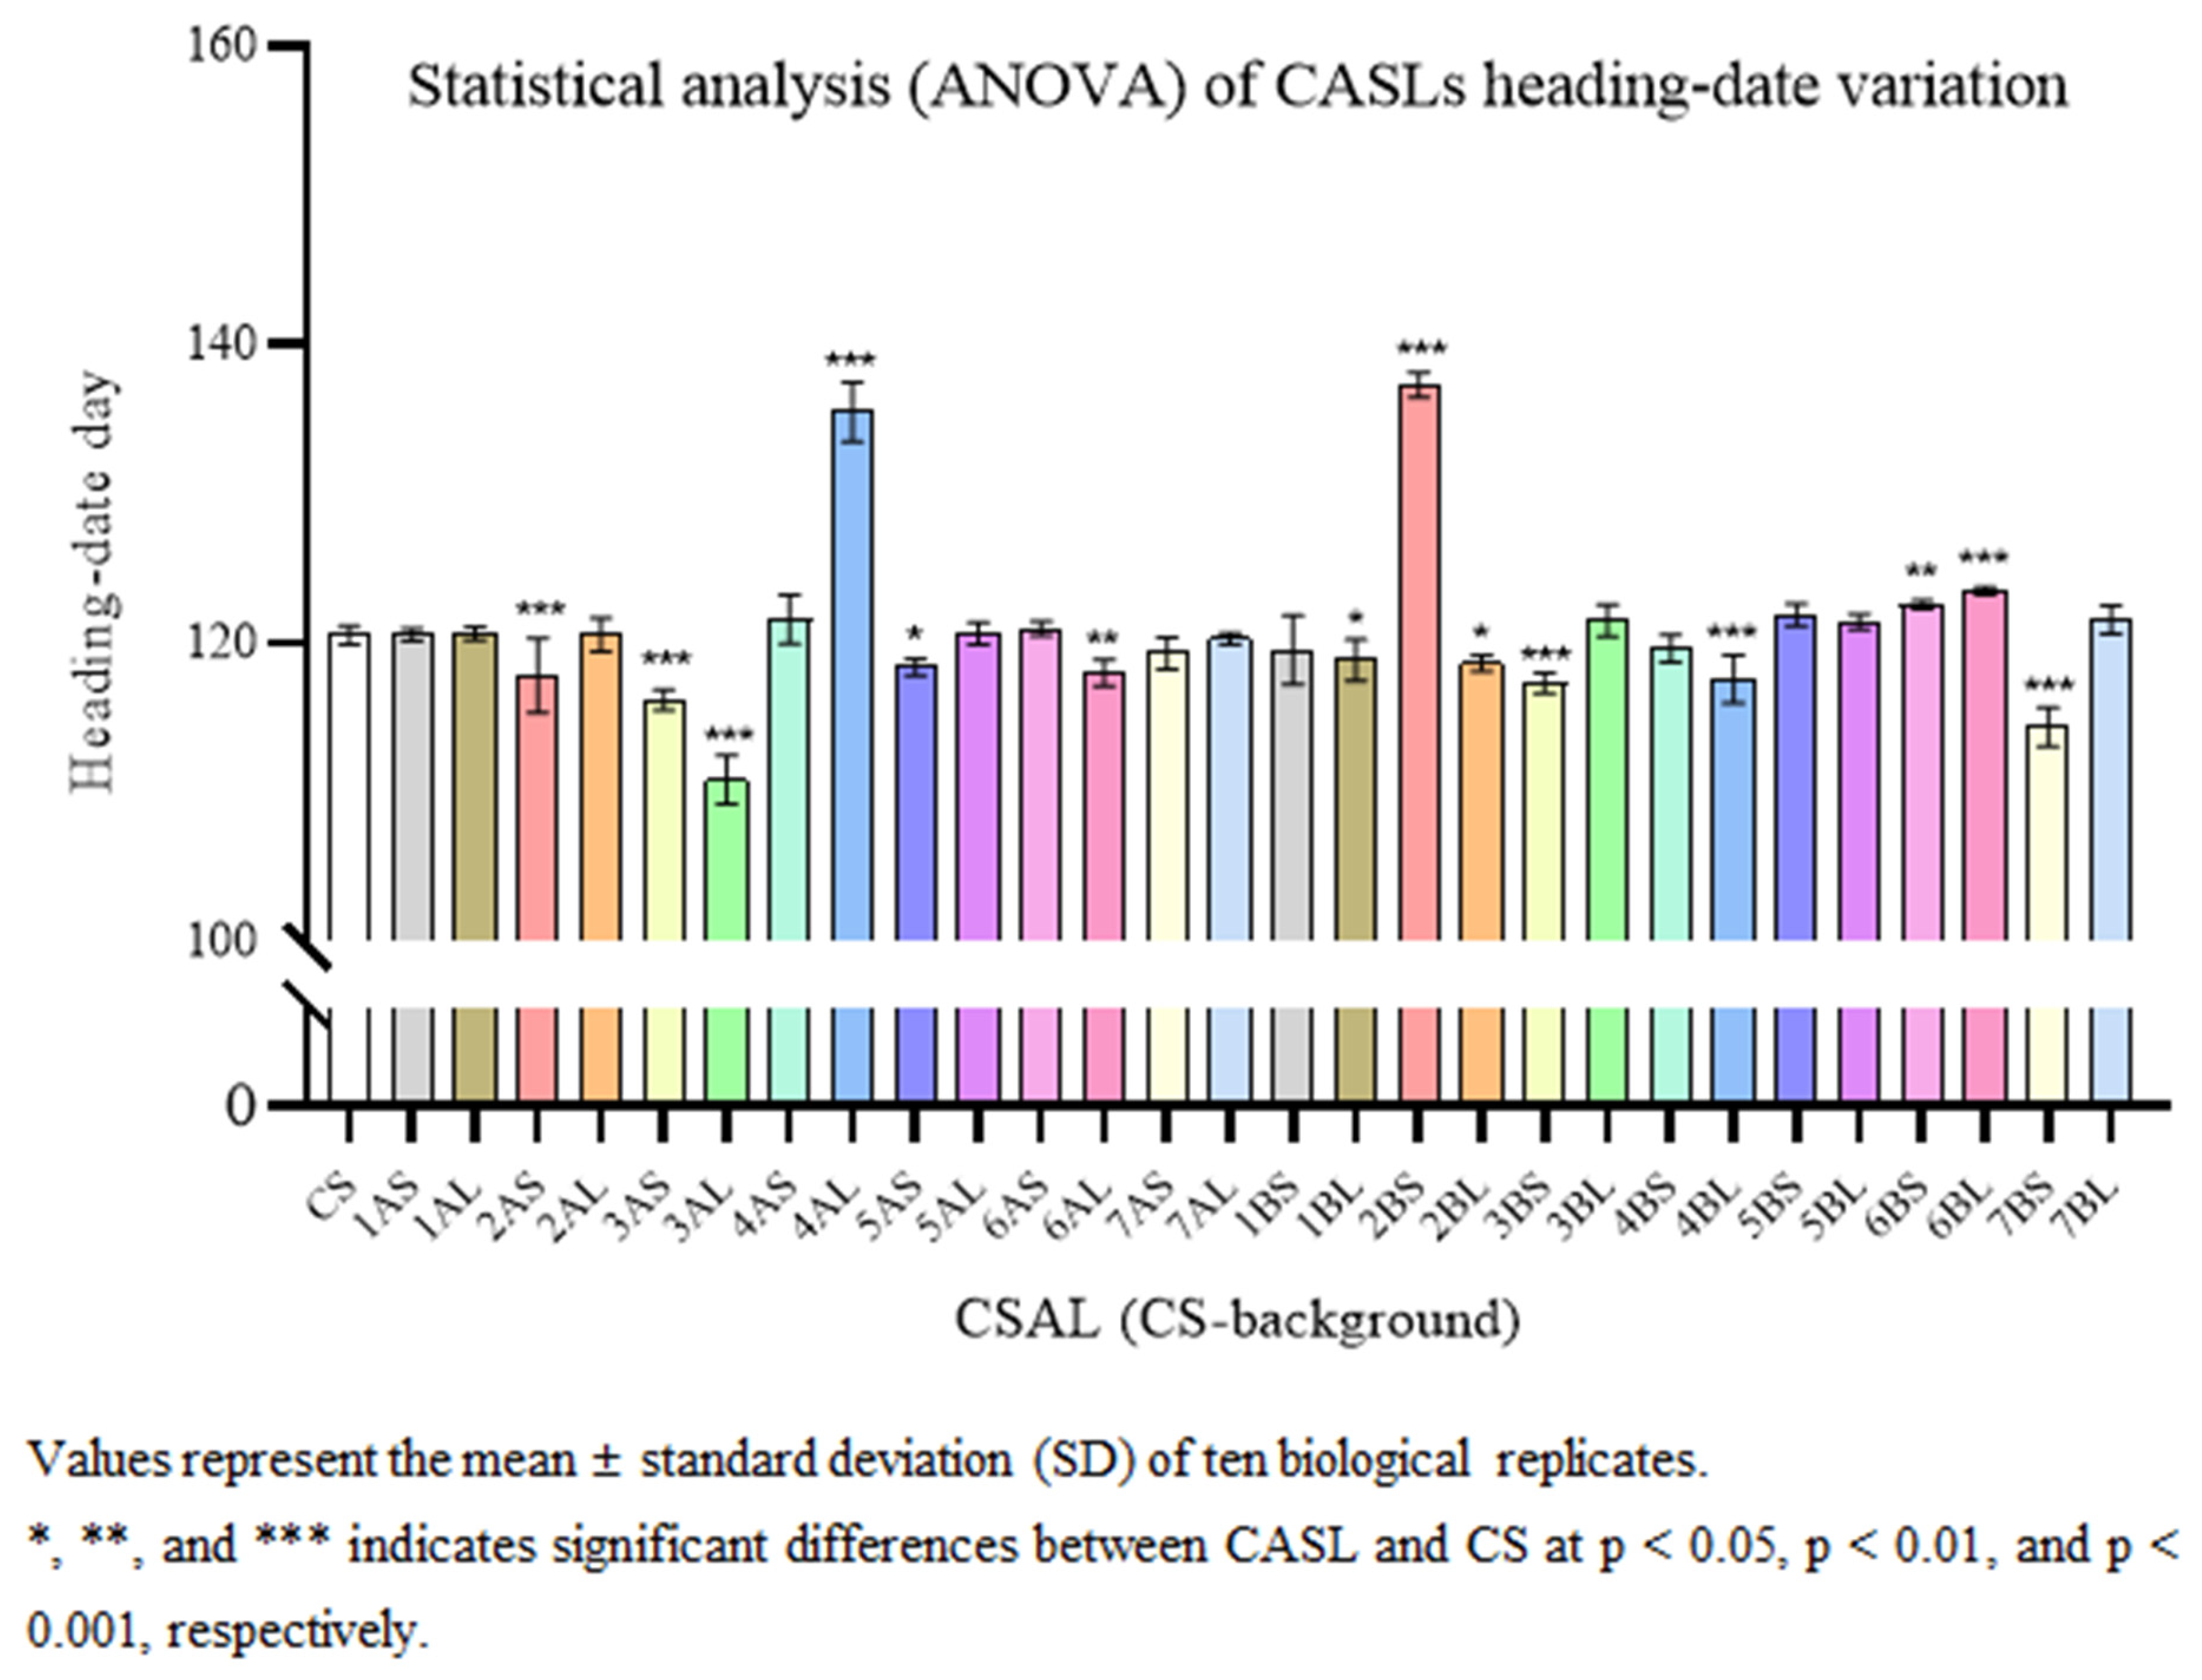
3.2. Agronomic Trait Statistical Analysis at Heading Stage

Heading date (HD) was statistically analyzed for 28 CASLs and the CS parent (Figure 4). Significant HD variations were detected among the CASLs. CASL 4AL and 2BS displayed significantly delayed heading (15-day delay relative to CS; p < 0.01), whereas substitutions on 3AL, 7BS, and 3AS caused earlier heading (4–9 days before CS; p < 0.01). These results indicate that HD-regulating genes contributing to late maturity are located on 4AL and 2BS, while early-maturity genes are positioned on 3AL, 7BS, and 3AS. Seedling traits (leaf width, plant height, tiller number) were quantified in late-maturing (CASL4AL, CASL2BS) and early-maturing (CASL3AL, CASL7BS, CASL3AS), along with CS and TDIC140. Selected from 28 CS-background CASLs based on HD, these lines showed significant trait differences (Figure 5 and Figure 6). Late-maturing CASLs generally had narrower leaves, shorter plants, and greater tiller numbers compared to early-maturing types.

3.3. Investigation and Data Analysis of Grain Traits

Grayscale and RGB Values: Grayscale, red (R), green (G), and blue (B) values were quantified in 28 CASLs and the CS parental line (Table 4). Significant variations in color parameters were detected among the CASLs. CASL4AL and CASL2BS displayed 4–5% higher grayscale values than those of the CS parent, whereas CASL7AL showed a 4% lower grayscale value (p < 0.05). Four substitution lines (CASL2BS, CASL4AS, CASL2BL, and CASL1AL) exhibited elevated red (R) values compared to the parental line. For green (G) values, CASL4AL and CASL2BS demonstrated 5–6% increases relative to CS, contrasting with 6% reductions in CASL7AL and CASL4BL (p < 0.01). CASL7BS uniquely displayed a 14% decrease in blue (B) values compared to the parental control (p < 0.01).
Grayscale Value: The grayscale value of each pixel in an image ranges from 0 to 255, representing the brightness level. It can also be expressed as the percentage of coverage by black ink (from 0% to 100%). RGB Value: Refers to the three primary colors: red, green, and blue. Each color channel has a value from 0 (black) to 255 (white), representing the brightness level of that color.
Grain Length, Grain Width, Grain Thick, and Thousand-Grain Weight: Analysis of variance revealed significant differences in grain length (GL), grain width (GW), grain thick (GT), and thousand-grain weight (TKW) between the CS parent and the 28 CASLs (Table 5). Grain length showed ranges of 6.57 to 8.34 mm, with 22 CASLs exceeding parental values. CASL6AS, CASL2AS, CASL4BL, and CASL1BL exhibited significantly longer grains. Six CASLs had reduced lengths, including CASL3BL, CASL6BS, and CASL2BL, with GL below 92% of the parental value. Grain width (2.98–3.73 mm) was significantly increased in CASL2AS and CASL1BL compared to the parent. For grain thickness (2.12–2.82 mm), six CASLs (CASL4BL, CASL3BL, CASL2BL, CASL7AS, CASL4AS, and CASL7BS) showed significant enhancements. Grain projected area (17.20–23.41 mm2) was significantly larger in eight CASLs. TKW values (26.63 to 35.48 g). Fifteen CASLs had greater TKW than the parent. These findings indicate potential QTLs on specific chromosome arms governing these grain traits.
Correlation Analysis: Correlation analysis revealed significant associations between grain traits and HD (Table 6). HD demonstrated strong positive correlations with grain red (R) value (r = 0.56, p < 0.01), grayscale value (GV) (r = 0.51, p < 0.01), and green (G) value (r = 0.47, p < 0.05), but showed negative correlations with grain thickness (GT) (r = −0.51, p < 0.01) and thousand-grain weight (TKW) (r = −0.48, p < 0.01). TKW is highly negatively correlated with grayscale and RGB values, and significantly positively correlated with grain length, width, and projected area at the 1% level (p < 0.01), as well as significantly positively correlated with grain thickness at the 5% level.

3.4. Statistical Analysis of Spike Traits

Spike length, spikelet number, and TKW are key yield-related traits in wheat. These traits exhibited complex interactions, requiring multi-trait selection strategies. Single-trait selection often fails to maximize yield, whereas correlation analysis aids in identifying optimal plant ideotypes. Similar to leaves, wheat awns participate in photosynthetic activity, directly supplying assimilates to developing spikelets during grain filling. Awn morphology (presence/absence, length) serves as a key taxonomic marker (Table 2). Spike architecture was classified into five morphological types based on size and shape (Table 3). Tillers—basal branches of wheat plants—contribute differentially to yield: effective tillers bear fertile spikes, while ineffective tillers either lack spikes or produce sterile ones.
Spike Length: Spike length was measured in 28 CASLs and the CS parent (Table 7). Ranging from 6.04 to 8.68 cm (vs. 7.03 cm in CS), 18 CASLs exceeded parental values. CASL6AS (8.04 cm) and CASL5AL (8.68 cm) showed significant increases (p < 0.05), whereas CASL2AL had the shortest spikes (6.04 cm; Figure 7). Ten lines underperformed the parent, suggesting that spike length-regulating genes are on chromosome arms 6AS and 5AL.
Number of Spikelets: ANOVA revealed the number of spikelets per spike in 28 CASLs and the CS parent ranged from 15.71 to 22.16 (mean = 19.49). Six CASLs exceeded the parental value, with CASL6BL showing the highest value (22.16; p < 0.05). Twenty-two lines underperformed, including CASL2BS, CASL1AS, and CASL2AL, with significant reductions (Table 7). These results suggest the presence of a positive-effect QTL on chromosome arms 6BL and negative-effect QTLs on 2BS, 1AS, and 2AL.
Number of Grains per Spike: Among CS-background CASLs, the number of grains per spike varied from 30.13 to 51.18, compared to the parental value of 39.42. Sixteen lines exceeded parental values, particularly CASL7AL (51.18, +29.7%) and CASL3AS (49.77, +26.3%). Conversely, CASL1AS (30.57) and CASL3BS (30.13) displayed reductions of >23.6% (Table 7). Significant differences (p < 0.01) indicate potential grain number-enhancing QTLs on 7AL/3AS and suppressing QTLs on 1AS/3BS.
Correlation Analysis of Spike-related Traits: Correlation analysis of spike-related traits in the substitution lines (Table 8) revealed a strongly significant positive correlation between spike length and the number of fertile grains (p < 0.01). A weak but positive correlation was observed between the number of fertile tillers and both spike length and the number of fertile grains (p < 0.05).

3.5. Statistical Analysis of Other Field Agronomic Traits

Plant Height: Plant height was determined at the post-anthesis stage (Zadoks growth stage 69) for 52 CASLs, their parental lines (BLH, CS), and wild-type wheat accessions (TDIC140). Measurements were conducted on ten plants per genotype using standardized protocols (ground level to the tip of the spike), with data presented as the mean ± SD (Table 9). Significant variation (p < 0.01) was observed among BLH-background CASLs, ranging from 76.87 cm to 91.92 cm. Eight CASLs exhibited plant heights exceeding 89.73 cm, significantly taller than the BLH parent (86.26 cm; p < 0.01). Conversely, seven CASLs showed significantly reduced heights below 82.12 cm compared to the BLH parent. Notably, the wild-type accessions (TDIC140) displayed the shortest stature (73.46 cm), markedly shorter than all CASLs and parental lines. Within the CS background, eight CASLs were significantly taller than the CS parent (>121.37 cm; p < 0.01), whereas twelve CASLs had reduced heights compared to the parent, though these differences were not statistically significant. All CS-background CASLs exceeded 101 cm in height, while BLH-background CASLs remained below 92 cm, indicating a consistently shorter phenotype in the BLH background.
Spike Morphology: Spike morphology was assessed for both genetic backgrounds in accordance with national wheat classification standards (Table 9). Wild-type wheat accessions (TDIC140) exhibited fusiform spikes. In the BLH background, all CASLs displayed elliptical spikes, consistent with the BLH parent. Similarly, most CS-background CASLs also showed elliptical spikes, aligning with the CS parent. Notably, CASL1AS, 3AS, and 3BS exhibited rectangular-shaped spikes, whereas CASL1AL and 2AL displayed clavate (club-shaped) spikes, and CASL5AL showed pyramid-shaped spikes (Figure 8). These results suggest that chromosome regions 1AS, 3AS, 3BS, 1AL, 2AL, and 5AL harbor genes regulating spike morphology. Specifically, a gene on chromosome 5AL of the Chinese Spring parent may suppress the pyramid-shaped spike phenotype.
Effective Tillering Number per Plant: Fertile tillers (defined as tillers bearing spikes with viable seeds) were quantified across genotypes. In CASLs, tiller numbers ranged from 6–17, compared to the CS parent’s mean of 11. Twenty CASLs exceeded parental values, with CASL5AL (17 tillers) and CASL2BL (16.33 tillers) showing significantly higher counts (p < 0.01; Table 7). Conversely, eight lines underperformed, notably CASL1AL and CASL1AS, which exhibited <58% of the parental value. These findings imply the presence of tiller-promoting QTLs on chromosomes 5AL/2BL and tiller-inhibiting genes on chromosome 1A.
Awn Types: Awn phenotypes were classified following national wheat standards (Table 9). The BLH parent displayed long awns, a trait conserved in all 24 BLH-background CASLs. In contrast, the awnless phenotype of the CS parent was retained in 24 out of 28 CS-background lines. Four CS-derived lines (4AS, 4AL, 6BS, and 6BL) exhibited dimorphic awns (short basal and long apical), suggesting the localization of awn-suppressing genes on these chromosomal regions (Figure 8).

4. Discussion

Wild emmer wheat (Triticum dicoccoides) is a valuable genetic resource for wheat improvement due to its robust resistance to diseases and rich genetic diversity. This study investigates the agronomic traits of CASLs derived from wild emmer wheat in the backgrounds of common wheat varieties Bethlehem (BLH) and Chinese Spring (CS). The results provide insights into the genetic control of key traits and highlight the potential for utilizing wild emmer wheat in breeding programs.

4.1. The Utilization of Wild Emmer Wheat in Breeding

Wild emmer wheat is the progenitor of tetraploid and hexaploid wheat and is known for its resistance to various diseases and abiotic stresses [11]. The genetic diversity within wild emmer wheat offers a rich pool of alleles that can enhance traits such as grain yield and protein content in cultivated wheat [12,21]. The study found that specific chromosomal arms from wild emmer wheat can significantly influence traits like tiller number, leaf width, plant height, and spike morphology. For instance, CASL7BS exhibited reduced tiller numbers, while CASL2BS showed narrower leaves and shorter plant height in the CS background. These findings suggest that genes controlling these traits are located on the respective substituted chromosomal arms.
The genetic resources from wild emmer wheat have been extensively utilized to broaden the germplasm pool of common wheat. For example, the high-protein, disease-resistant wheat variety Lainong 998,013 was developed using wild emmer wheat, demonstrating significant improvements in yield and quality [22,23]. The successful introgression of wild emmer wheat into cultivated varieties has led to the creation of synthetic hexaploid varieties such as Syn022 and Syn086 [22,23]. These examples highlight the potential of wild emmer wheat as a source of beneficial genes for wheat breeding.
Gene identification and mapping are essential for effectively harnessing the beneficial traits of wild emmer. Numerous agronomically important genes have been identified, primarily associated with disease resistance and grain quality. For instance, powdery mildew resistance genes like Pm36, Pm41, Ml3D232, MlWE27, MlIW172, and MlIW30 have been identified [24]. Additionally, genes such as Yr36 and Yr15, which confer broad-spectrum resistance to stripe rust pathogens, have been mapped [25,26,27,28]. Regarding quality-related genes, a gene named TaNAM that increases protein, zinc, and iron content has been located [29]. The identification of these genes is crucial for targeted breeding efforts to improve wheat resistance and quality.

4.2. The Important Agronomic Traits and Their Controlling Candidate Chromosomal Regions Analyses in CASLs

Seedling-stage traits such as tiller number, leaf biomass, and plant height are heritable indicators of wheat growth status and correlate with other plant traits [30,31]. These traits are valuable for understanding growth dynamics and predicting yield potential. The study found significant correlations between seedling traits and mature-stage yield components, such as spike grain number, spike length, and TKW [32]. For example, late-maturing CASLs exhibited narrower leaves and shorter plant height compared to early-maturing lines, indicating the presence of genes controlling these traits on specific chromosomal arms. These findings suggest that seedling traits can be used as selection criteria for breeding high-yielding wheat varieties.
The study also revealed complex interactions between traits, such as the positive correlation between grain size and grain weight and seedling vigor [17,33,34,35,36,37,38,39] and the negative correlation between grain number and grain weight [39,40]. This complexity underscores the challenges in improving yield through manipulation of individual traits challenging [17,33,41,42]. Seedling-stage traits have been linked to mature-plant traits such as spike grain number, spike length, and 1000-grain weight [43]. Coleoptile and first leaf length at the seedling stage are positively correlated with mature plant height and flag leaf length but negatively correlated with flag leaf width [44]. Principal component analysis has highlighted the direct contribution of grains per plant and 1000-grain weight to yield, suggesting their utility as selection criteria. In our study, we discovered that the heading date (HD) is significantly positively correlated with grain thick and significantly negatively correlated with thousand-grain weight (TKW) (p < 0.01). Furthermore, TKW is highly negatively correlated with grayscale and RGB values (p < 0.01) and significantly positively correlated with grain length, width, and projected area. Therefore, predicting mature-stage traits based on seedling-stage characteristics appears feasible. Future research should focus on understanding the genetic mechanisms underlying these interactions and identifying additional genes that contribute to yield and quality. The use of advanced genomic tools, such as high-density SNP linkage maps, can facilitate the identification and mapping of these genes.

4.3. CASLs Offer a Powerful Tool for Dissecting the Genetic Control of These Complex Traits and Understanding Their Interactions

Seedling traits, including tiller number, leaf width, plant height, and HD, along with yield components (GL, GW, and TKW) and spike characteristics (length, spikelet number, grains per spike, awn type, and spike type), are key morphological indicators with significant impacts on wheat growth and yield. However, relatively few genes controlling these traits have been successfully transferred from wild emmer to cultivated wheat. CASLs offer a powerful tool for dissecting the genetic control of these complex traits and understanding the interactions between chromosomal arms and the distribution and effects of genes within them. In this study, we characterized agronomic traits in a set of CASLs, analyzing correlations between early and late-maturing lines based on seedling traits (tiller number, leaf width, and plant height) and examining spike and grain traits at maturity. These results suggest the presence of genes controlling seedling-stage physiological traits and spike morphology on the respective substituted chromosomal arms. These CASLs are valuable not only for mapping quality traits but also for identifying genes underlying complex quantitative traits like tiller number, leaf width, plant height, grain morphology, spike shape, and awn type. Our findings highlight the close relationship between seedling traits and HD and mature-stage yield components, warranting further investigation into the underlying mechanisms. In conclusion, this study highlights the potential of wild emmer wheat as a valuable genetic resource for wheat improvement. In addition to the ultimate goal of identifying agronomically important functional genes for wheat breeding, CASLs are also ideal and valuable materials for fundamental research, such as studies on heterosis. Recently, Zhao and Reif utilized 1604 populations generated from crosses among 135 elite parental breeding lines to propose a quantitative genetic framework for investigating the genetic basis of heterosis across 11 different environments [45]. On average, these hybrids outperformed the midparents by 10%, with epistatic effects contributing more significantly to wheat yield heterosis than dominance effects. In our laboratory, preliminary studies on CASLs within the genetic backgrounds of CS and BL have shown that several F1 hybrids, derived from crosses between specific CASLs and either CS or BL, surpassed both parent lines in performance. Currently, there are no reports on heterosis in wheat lines carrying single alien chromosome arms, and such studies could offer valuable insights into the potential application of heterosis in wheat breeding. The identification of specific chromosomal arms controlling key agronomic traits provides a foundation for targeted breeding efforts. Further research into the genetic mechanisms underlying these traits and their interactions will be crucial for developing high-yielding, high-quality wheat varieties suited for cultivation in diverse environments.

5. Conclusions

This study dissected agronomic traits in CASLs of Triticum dicoccoides introgressed into common wheat (BLH and CS backgrounds). Key chromosomal arms were identified to modulate tiller number, leaf width, plant height, and spike morphology, with CS-background CASLs showing distinct spike variations. Seedling traits (e.g., tiller number, leaf width) correlated strongly with mature-stage yield components (spike length, grain weight), highlighting their predictive value. Our findings reinforce the conserved roles of 2BS, 4AL, 3AL, 3AS, and 7BS in HD regulation and spike architecture, aligning with Zhou et al. and Millet et al. [17,18]. However, we extend these insights by linking HD-associated loci to seedling traits (e.g., tiller number, leaf width), revealing background-specific expression of spike and awn traits, and identifying novel loci for awn development (4AS, 6BS) and seedling architecture (2BS, 7BS). These results highlight the importance of genetic background and pleiotropy in shaping trait variation, offering new targets for wheat improvement. T. dicoccoides reaffirms its role as a genetic reservoir for enhancing disease resistance, stress tolerance, and yield in cultivated wheat. The CASLs serve as pivotal resources for gene mapping, functional studies, and heterosis exploration, with preliminary F1 hybrid vigor warranting mechanistic investigations. Leveraging genomic tools (SNP linkage maps, CRISPR) could expedite gene deployment.

Author Contributions

Conceptualization, J.R.; methodology, Y.Z.; software, X.W.; validation, J.R., X.H. and Y.Z.; formal analysis, Y.J.; investigation, Y.Z.; resources, J.R.; data curation, X.W. and Y.J.; writing—original draft preparation, Y.Z.; writing—review and editing, X.H. and Y.Z.; visualization, Y.J.; supervision, J.R.; funding acquisition, J.R. All authors have read and agreed to the published version of the manuscript.

Funding

This research was funded by Zhejiang Science and Technology Major Program on Agricultural New Variety Breeding (2021C02064-3–4), the Zhejiang Provincial Natural Science Foundation of China (LY19C060003) and the National Natural Science Foundation of China (31671684).

Data Availability Statement

The original contributions presented in this study are included in the article. Further inquiries can be directed to the corresponding author.

Acknowledgments

The 52 CASLs and their parents (CS and BLH) were kindly provided by M. Feldman, Weizmann Institute of Science, Israel.

Conflicts of Interest

The authors declare no conflicts of interest.

References

  1. Kumar, A.; Mantovani, E.; Simsek, S.; Jain, S.; Elias, E.; Mergoum, M. Genome wide genetic dissection of wheat quality and yield related traits and their relationship with grain shape and size traits in an elite × non-adapted bread wheat cross. PLoS ONE 2019, 14, e0221826. [Google Scholar] [CrossRef] [PubMed]
  2. Yuli, J.; Tiantian, G.; Hong, L.; Diaoguo, A. Research progress on the wheat powdery mildew resistance gene Pm2. Chin. J. Eco-Agric. 2022, 30, 779–786. [Google Scholar]
  3. Ye, X.; Lin, Z.; Wang, K.; Tang, H.; Han, Z. Annual progress on new gene characterization and novel technology development for wheat genetic improvement in 2023. Sci. Technol. Rev. 2024, 42, 174–187. [Google Scholar]
  4. Millet, E.; Rong, J.; Qualset, C.; McGuire, P.; Bernard, M.; Sourdille, P.; Feldman, M. Production of chromosome-arm substitution lines of wild emmer in common wheat. Euphytica 2013, 190, 1–17. [Google Scholar] [CrossRef]
  5. Feldman, M. Historical aspects and significance of the discovery of wild wheats. Stadler Symp. 1977, 9, 121–146. [Google Scholar]
  6. Feldman, M.; Sears, E. The wild gene resources of wheat. Sci. Am. 1981, 244, 102–112. [Google Scholar] [CrossRef]
  7. Feldman, M.; Millet, E. Methodologies for identification, allocation and transfer of quantitative genes from wild emmer into cultivated wheat. In Proceedings of the 8th International Wheat Genetics Symposium, Beijing, China, 20–25 July 1993; pp. 19–27. [Google Scholar]
  8. Millet, E.; Rong, J.; Qualset, C.; Mcguire, P.; Bernard, M.; Sourdille, P.; Feldman, M. Grain yield and grain protein percentage of common wheat lines with wild emmer chromo some-arm substitutions. Euphytica 2014, 195, 69–81. [Google Scholar] [CrossRef]
  9. Orlovskaya, O.; Leonova, I.; Solovey, L.; Dubovets, N. Molecular cytological analysis of alien introgressions in common wheat lines created by crossing of Triticum aestivum with T. dicoccoides and T. dicoccum. Vavilov J. Genet. Breeding 2023, 27, 553–564. [Google Scholar] [CrossRef]
  10. Almadi, H.; Nazarian, F. The inheritance and chromosomal location of morphological traits in wildwheat, Triticum turgidum L. ssp. dicoccoides. Euphytica 2007, 158, 103–108. [Google Scholar]
  11. Zheng, Q.; Zhao, L.; Li, B.; Li, H.; Wan, J.; Zhang, X. Wheat wide hybridization and chromosome engineering breeding in China. Hereditas 2025, 47, 289–299. [Google Scholar] [CrossRef]
  12. Xie, W.; Nevo, E. Wild emmer: Genetic resources, gene mapping and potential for wheat improvement. Euphytica 2008, 164, 603–614. [Google Scholar] [CrossRef]
  13. Simmonds, J.; Fish, L.; Leverington-Waite, M.; Wang, Y.; Howell, P.; Snape, J. Mapping of a gene (Vir) for a non-glaucous, viridescent phenotype in bread wheat derived from Triticum dicoccoides, and its association with yield variation. Euphytica 2008, 159, 333–341. [Google Scholar] [CrossRef]
  14. Joppa, L.; Cantrell, R. Chromosome location of genes for grain protein content of wildtetraploid wheat. Crop Sci. 1990, 30, 1059–1064. [Google Scholar]
  15. Kumar, N.; Kulwal, P.; Balyan, H.; Gupta, P. QTL mapping for yield and yield contributing traits in two mapping populations of bread wheat. Mol. Breed. 2007, 19, 163–177. [Google Scholar] [CrossRef]
  16. Feldman, M.; Millet, E.; Abbo, S. Exploitation of wild emmer wheat to increase yield and protein content in durum and common wheat. In Proceedings of the EUCARPIA Meeting of the Genetic Resources Section, Clermont-Ferrand, France, 15–18 March 1994. [Google Scholar]
  17. Zhou, W.; Jiang, Y.; Zhang, W.; Xu, G.; Rong, J. Characterization of Large Chromosome Segment Introgressions from Triticum turgidum subsp. dicoccoides into Bread Wheat with Simple Sequence Repeat Markers. Crop Sci. 2013, 53, 1555–1565. [Google Scholar]
  18. Rong, J.; Millet, E.; Manisterski, J.; Feldman, M. A new powdery mildew resistance gene: Introgression from wild emmer into common wheat and rflp-based mapping. Euphytica 2000, 115, 121–126. [Google Scholar]
  19. Yu, J.; Zhao, Y.; Ding, M.; Yu, Z.; Jiang, Y.; Ma, W.; Rong, J. Wild emmer chromosome arm substitution lines: Useful resources for wheat genetic study and breeding. Crop Sci. 2020, 60, 1761–1769. [Google Scholar]
  20. Zhao, Y.; Miao, Y.; Cao, Y.; Rong, J. Investigation on the Seed Germination and Seedling Growth of Chromosome Arm Substitution Lines of Triticum dicoccoidesin the Background of T. aestivum. J. Triticeae Crops 2017, 37, 287–294. [Google Scholar]
  21. Merchuk-Ovnat, L.; Fahima, T.; Ephrath, J.; Krugman, T.; Saranga, Y. Ancestral QTL alleles from wild emmer wheat enhance root development under drought in modern wheat. Front. Plant Sci. 2017, 8, 703. [Google Scholar] [CrossRef]
  22. Kunert, A.; Naz, A.; Dedeck, O.; Pillen, K.; Leon, J. AB-QTL, analysis imn winter wheat: I. Synthetichexaploid wheat (T. tugidum ssp., dicoccoides × T. tauschii) as a source of favourable alleles for millingand baking quality traits. Theor. Appl. Genet. 2007, 115, 683–695. [Google Scholar] [CrossRef]
  23. Naz, A.; Kunert, A.; Lind, V.; Pillen, K.; Leon, J. AB-QTL, analysis in winter wheat: Il. Genetic analysisof seedling and field resistance against leafrust in a wheat advanced backcross, population. Theor. Appl. Genet. 2008, 116, 1095–1104. [Google Scholar] [CrossRef] [PubMed]
  24. Blanco, A.; Gadaleta, A.; Cenci, A.; Carluccio, A.; Abdelbacki, A.; Simeone, R. Molecular mapping of the novel powdery mildew resistance gene Pm36 introgressed from Triticum turgidumvar. dicoccoides in durum wheat. Theor. Appl. Genet. 2008, 117, 135–142. [Google Scholar] [CrossRef] [PubMed]
  25. Fu, D.; Uauy, C.; Distelfeld, A.; Blechl, A.; Epstein, L.; Chen, X.; Dubcovsky, J. A kinase-start gene confers temperaturedependent resistance to wheat stripe rust. Science 2009, 323, 1357–1360. [Google Scholar] [CrossRef] [PubMed]
  26. Klymiuk, V.; Yaniv, E.; Huang, L.; Raats, D.; Fatiukha, A.; Chen, S.; Fahima, T. Cloning of the wheat Yr15 resistance gene sheds light on the plant tandem kinase-pseudokinase family. Nat. Commun. 2018, 9, 3735. [Google Scholar]
  27. Qie, Y.; Liu, Y.; Wang, M.; Li, X.; See, D.; An, D.; Chen, X. Development, validation, and re-selection of wheat Lines with pyramided genes Yr64 and Yr15 linked on the short arm of chromosome 1B for resistance to stripe rust. Plant Dis. 2019, 103, 51–58. [Google Scholar]
  28. Yaniv, E.; Raats, D.; Ronin, Y.; Korol, A.; Grama, A.; Bariana, H.; Fahima, T. Evaluation of marker-assisted selection for the stripe rust resistance gene Yr15, introgressed from wild emmer wheat. Mol. Breed. 2015, 35, 43. [Google Scholar] [CrossRef]
  29. Uauy, C.; Distelfeld, A.; Fahima, T.; Blechl, A.; Dubcovsky, J.A. NAC gene regulating senescence improves grain protein, zinc, and iron content in wheat. Science 2006, 314, 1298–1301. [Google Scholar]
  30. Khan, M.; Anwar, S.; Khan, M. Genetic variability for seedling traits in wheat (Triticum aestivum L.) under moisture stress conditions. Asian J. Plant Sci. 2002, 1, 588–590. [Google Scholar] [CrossRef]
  31. Salih, A. SNP Markers for Seedling Traits Revealed by Association Analysis Andgenetic Variation in Durum Wheat Accessions (Triticum turgidum L. ssp. durum Desf.). Ph.D. Dissertation, Huazhong Agricultural University, Wuhan, China, 2016. [Google Scholar]
  32. Meles, B.; Genetic, V. Correlation and path analysis of yield and grain quality traits in bread wheat (Tritium aestivum L.) genotypes at Axum, Northern Ethiopia. J. Plant Breed. Crop Sci. 2017, 9, 175–185. [Google Scholar]
  33. Bavec, M.; Bavec, F.; Varga, B.; Kovačević, V. Relationships among yield, it’s quality and yield components in winter wheat (Triticum aestivum L.) cultivars affected by seeding rates. Die Bodenkult. 2002, 53, 143–151. [Google Scholar]
  34. Botwright, T.; Condon, A.; Rebetzke, G.; Richards, R. Field evaluation of early vigour for genetic improvement of grain yield in wheat. Aust. J. Agric. Res. 2002, 53, 1137–1145. [Google Scholar]
  35. Gegas, V.; Nazari, A.; Griffiths, S.; Simmonds, J.; Fish, L.; Orford, S.; Sayers, L.; Doonan, J.; Snape, J. A genetic framework for grain size and shape variation in wheat. Plant Cell 2010, 22, 1046–1056. [Google Scholar] [CrossRef] [PubMed]
  36. Farahani, H.; Moaveni, P.; Maroufi, K. Effect of seed size on seedling production in wheat (Triticum aestivum L.). Adv. Environ. Biol. 2011, 5, 1711–1715. [Google Scholar]
  37. Russo, M.; Ficco, D.; Laido, G.; Marone, D.; Papa, R.; Blanco, A.; Gadaleta, A.; Vita, P.; Mastrangelo, A. A dense durum wheat × T. dicoccum linkage map based on SNP markers for the study of seed morphology. Mol Breed 2014, 34, 1579–1597. [Google Scholar] [CrossRef]
  38. Kumar, A.; Mantovani, E.; Seetan, R.; Soltani, A.; Echeverry-Solarte, M.; Jain, S.; Simsek, S.; Doehlertm, D.; Alamri, M.; Elias, E. Dissection of Genetic Factors underlying Wheat Kernel Shape and Size in an Elite × Nonadapted Cross using a High Density SNP Linkage Map. Plant Genome 2016, 9, 1–22. [Google Scholar] [CrossRef]
  39. Feng, F.; Han, Y.; Wang, S.; Yin, S.; Peng, Z.; Min, Z.; Gao, W.; Wen, X.; Qin, X.; Siddique, K. The Effect of Grain Position on Genetic Improvement of Grain Number and Thousand Grain Weight in Winter Wheat in North China. Front. Plant Sci. 2018, 9, 129. [Google Scholar] [CrossRef]
  40. Guy, G.; Idan, A.; Aviad, P.; Zimran, G.; Peleg, Z. GNI-A1 mediates trade-off between grain number and grain weight in tetraploid wheat. TAG Theor. Appl. Genet. 2019, 132, 2353–2365. [Google Scholar]
  41. Slafer, G.; Calderini, D.; Miralles, G. Yield components and compensation in wheat: Opportunities for future increasing yield potential. In Increasing Yield Potential in Wheat: Breaking the Barriers; Reynolds, M.P., Rajaram, S., Eds.; CIMMYT: Ciudad Obregón, Mexico, 1996; pp. 101–133. [Google Scholar]
  42. Wu, Q.; Chen, Y.; Zhou, S.; Fu, L.; Chen, J.; Xiao, Y.; Zhang, D.; Ouyang, S.; Zhao, X.; Cui, Y. High-Density Genetic Linkage Map Construction and QTL Mapping of Grain Shape and Size in the Wheat Population Yanda1817×Beinong6. PLoS ONE 2015, 12, e0118144. [Google Scholar]
  43. Xu, Y. Response of Seedling Biomass and Agronomic Traitsin Maturity in Stage of Wheat Nitrogen, Phosphorus and Potassium Deficiency and It’s Genetican Alysis. Master’s Thesis, Shandong Agricultural University, Tai’an, China, 2022. [Google Scholar]
  44. Sun, N.; Zhou, Q.; Zhi, L.; Qiao, P.; Mou, L.; Ni, S.; Chen, L. Identification of Drought Resistance at Seedling Stage and Correlation Analysisbetween Drought Resistance Indexes and lmportant Agronomic Characters of 240 Wheat Materials. Acta Agric. Boreali-Occident. Sin. 2022, 2, 147–156. [Google Scholar]
  45. Jiang, Y.; Schmidt, R.; Zhao, Y.; Reif, J. A quantitative genetic framework highlights the role of epistatic effects for grain-yield heterosis in bread wheat. Nat. Genet. 2017, 49, 1741–1746. [Google Scholar] [CrossRef]
Figure 1. Statistical analysis for seedling tillers of CASLs.
Agronomy 15 00752 g001
Figure 2. Statistical analysis for seedling leaf width of CASLs.
Agronomy 15 00752 g002
Figure 3. Statistical analysis for seedling height of CASLs.
Agronomy 15 00752 g003
Figure 4. Statistical analysis of CASLs heading-date variation.
Agronomy 15 00752 g004
Figure 5. Statistical analysis of leaf width, plant height, and tiller number between late- and early-maturing CASLs.
Agronomy 15 00752 g005
Figure 6. Phenotypic differences at seedling and heading stages between late- and early-maturing CASLs.
Agronomy 15 00752 g006
Figure 7. Comparison of panicle-type variations showing statistically significant differences (p < 0.05) in CS-background CASLs.
Agronomy 15 00752 g007
Figure 8. Panicle type and awn length characteristics of CASLs at Zadoks growth stage 29.
Agronomy 15 00752 g008
Table 1. Common wheat-wild emmer arm of chromosome substitution lines.
BLH BackgroundCS Background
Homologous GroupA(L)A(S)B(L)B(S)Homologous GroupA(L)A(S)B(L)B(S)
1++++1++++
2 +++2++++
3++++3++++
4+++4++++
5+++5++++
6+++6++++
7++++7++++
“+”: backcross fertile; “−”: backcross sterile; A and B: A and B genome; L: long arm; S: short arm.
Table 2. Awn types grading standard of wheat.
Awn TypeAwn Length and Position
No Awn Completely without awns or awns are extremely short.
Top Awn Awns present at the top of the spike, with a length of <5 mm, no awns at the lower part of the spike.
Curved Awn The base of the awn is swollen and curved.
Short Awn Awns present both at the top and bottom of the spike, with a length < 40 mm.
Long Awn Awn length > 40 mm.
Table 3. Spike types grading standard of wheat.
Spike Type Phenotype Description
Spindle-shaped The ear is pointed at both ends, with the middle slightly larger.
Oval-shaped The middle is wide, with both ends slightly smaller, resembling an ellipse.
Rectangular-shaped The ear is relatively short, and the shape is consistent in the upper, middle, and lower parts, appearing column-like.
Club-shaped The ear is smaller at the bottom and larger at the top, with tightly clustered spikelets at the upper part, resembling a big head.
Conical-shaped (Pagoda-shaped) The ear is larger at the bottom and smaller at the top, resembling a cone.
Table 4. Statistical analysis of the gray value, RGB value of CASL in CS background to CS.
CASLGrayscale ValueCASLR ValueCASLG ValueCASLB Value
4AL142.28 ± 2.73 *2BS180.8 ± 4.24 **4AL138.78 ± 3.96 **2BL82.9 ± 6.93
2BS141.08 ± 1.61 *4AS179.37 ± 8.16 **2BS137.98 ± 0.35 **2AL79.62 ± 2.11
2BL140.75 ± 2.072BL177.75 ± 3.44 **2BL135.07 ± 3.945BL78.37 ± 1.1
2AL139.72 ± 0.681AL176.92 ± 0.79 **2AL133.8 ± 0.481BS78.12 ± 4.77
1AL138.73 ± 2.872AL175.9 ± 3.381AL132.38 ± 3.614AL77.88 ± 4.54
5BL136.97 ± 1.461BS172.58 ± 0.83AS131.63 ± 3.46CS77.87 ± 2.92
3AS136.83 ± 3.63AS172.35 ± 5.035BL131.48 ± 1.236BS77.13 ± 4.92
6BS136.07 ± 1.845BL171.77 ± 2.2CS131.33 ± 2.162BS76.22 ± 4.53
1AS135.8 ± 2.162AS171.75 ± 2.396BS130.75 ± 4.295AL75.53 ± 6.76
CS135.4 ± 2.431BL171.7 ± 0.881AS130.72 ± 2.964AS75.5 ± 2.05
1BS135.38 ± 2.271AS171.47 ± 0.783AL130.12 ± 0.421AL75.47 ± 5.39
4AS135.28 ± 0.94BS171.42 ± 3.054AS130.08 ± 1.637BL75.05 ± 1.48
7AS135.17 ± 0.286BS170.7 ± 2.597AS130.02 ± 0.463AS74.9 ± 1.73
3AL134.65 ± 0.733BS170.58 ± 6.721BS128.4 ± 2.423AL73.93 ± 2.28
4BS133.32 ± 1.587BS170.5 ± 1.983BL127.17 ± 3.057AS73.38 ± 4.87
3BL133.22 ± 2.247AS170.32 ± 1.435AL126.93 ± 0.961AS73 ± 3.55
5AL132.95 ± 0.513BL169.65 ± 0.594BS126.92 ± 1.343BL72.88 ± 3.01
3BS132.38 ± 1.316AS169.28 ± 0.466BL125.62 ± 4.24BL72.82 ± 3.27
2AS132.25 ± 2.696BL168.72 ± 6.183BS125.6 ± 4.736AL72.72 ± 1.99
1BL131.72 ± 1.013AL168.37 ± 2.492AS125.48 ± 3.083BS70.8 ± 5.55
6BL131.7 ± 2.795AL168.22 ± 2.056AS125.35 ± 2.436BL70.55 ± 4.67
6AS131.45 ± 2.34AL167.78 ± 3.196AL125.1 ± 3.894BS70.33 ± 1.38
6AL131.33 ± 3.585AS167.78 ± 3.197BL124.69 ± 2.675BS69.97 ± 2.55
7BS131.08 ± 0.446AL167.47 ± 3.745AS124.5 ± 3.561BL69.38 ± 2.42
7BL130.83 ± 2.77CS167.12 ± 4.745BS124.33 ± 47AL69.17 ± 5.59
5AS130.37 ± 2.515BS166.68 ± 1.971BL124.3 ± 0.946AS67.97 ± 6.75
5BS130.33 ± 2.134BL166.63 ± 3.047BS124.3 ± 0.792AS67.62 ± 2.34
4BL130.07 ± 2.577BL165.77 ± 3.717AL123.77 ± 1.03 **5AS67 ± 6.22
7AL129.53 ± 0.34 *7AL165.68 ± 4.314BL123.35 ± 2.19 **7BS66.83 ± 3.73 **
*, **, indicate the significant differences between the CASLs and CS at p < 0.05, p < 0.01, respectively; mean ± SD: The average value ± standard deviation.
Table 5. Statistical analysis of the grain length, width, size, and weight of CASL.
CASLLength/mmCASLWidth/mmCASLThickness/mmCASLProjected Area/mm2CASLTGW
6AS8.34 ± 0.16 *2AS3.73 ± 0.01 *4BL2.82 ± 0.08 *2AS23.41 ± 0.1 *7AL35.48 ± 1.16 *
2AS8.34 ± 0.21 *1BL3.7 ± 0.1 *3BL2.78 ± 0.19 *1BL22.65 ± 0.65 *7AS34.89 ± 1.01 *
4BL8.28 ± 0.07 *3BS3.67 ± 0 2BL2.75 ± 0.07 *6AS22.27 ± 0.38 *4BS32.99 ± 1.36
1BL8.14 ± 0.13 *7AL3.66 ± 0.077AS2.74 ± 0.09 *7AL22.04 ± 0.81 *6AL32.65 ± 0.79
7AL8.03 ± 0.13AS3.66 ± 0.044AS2.7 ± 0.13 *4BL21.96 ± 0.99 *6AS32.56 ± 1.47
5AS7.91 ± 0.165AS3.65 ± 07BS2.7 ± 0.05 *5AS21.74 ± 0.59 *1BL32.54 ± 0.98
3AS7.82 ± 0.142AL3.64 ± 0.012AS2.65 ± 0.053AS21.56 ± 0.56 *7BL32.3 ± 1.15
5AL7.82 ± 0.255BS3.63 ± 0.013AS2.65 ± 0.127BL21.56 ± 0.26 *2AS32.29 ± 1.49
2BS7.81 ± 0.064BS3.63 ± 0.077AL2.65 ± 0.022AL21.51 ± 0.421AL32.28 ± 1.36
7AS7.8 ± 0.224BL3.62 ± 0.113AL2.64 ± 03BS21.32 ± 0.163AL32.25 ± 1.51
6AL7.7 ± 0.151AL3.61 ± 0.015AS2.64 ± 0.035BS21.27 ± 0.173AS31.97 ± 1.91
3AL7.68 ± 0.157BS3.59 ± 0.023BS2.57 ± 03AL21.1 ± 0.545BS31.78 ± 1.38
7BL7.68 ± 0.423AL3.57 ± 0.092BS2.56 ± 0.047AS21.09 ± 0.344BL31.61 ± 1.57
3BS7.66 ± 0.166AS3.57 ± 0.02 CS2.55 ± 0.045AL21.07 ± 0.725AS31.56 ± 1.67
4BS7.64 ± 0.227BL3.57 ± 0.051BL2.55 ± 0.024BS21.06 ± 0.383BL31.44 ± 1.19
2AL7.62 ± 0.262BL3.56 ± 0.095AL2.55 ± 0.032BS20.74 ± 0.17CS31.28 ± 1.13
5BL7.62 ± 0.265BL3.54 ± 0.037BL2.54 ± 0.027BS20.65 ± 0.424AS30.95 ± 1.6
1BS7.61 ± 0.215AL3.53 ± 0.046BL2.53 ± 0.075BL20.63 ± 0.31AS30.78 ± 1.13
1AL7.61 ± 07AS3.53 ± 0.026AL2.53 ± 0.016AL20.46 ± 0.611BS30.76 ± 2.02
1AS7.59 ± 0.066AS3.52 ± 0.045BL2.52 ± 0.011AL20.42 ± 0.365AL30.45 ± 1.15
5BS7.59 ± 0.27CS3.47 ± 0.026BS2.51 ± 0.01CS20.42 ± 0.277BS30.29 ± 1.37
6BL7.58 ± 0.261BS3.47 ± 0.072AL2.48 ± 0.021BS19.54 ± 1.113BS30.23 ± 1.37
CS7.52 ± 0.114AS3.46 ± 0.045BS2.47 ± 0.034AS19.47 ± 1.172BS29.22 ± 0.95
4AS7.42 ± 0.222BS3.45 ± 0.131AL2.46 ± 0.054AL18.96 ± 0.8 *2BL29.22 ± 0.79
4AL7.28 ± 0.343BL3.42 ± 0.094BS2.45 ± 0.052BL18.95 ± 0.73 *5BL29.18 ± 1
7BS7.08 ± 0.764AL3.34 ± 01BS2.45 ± 0.073BL18.87 ± 0.34 *6BL28.83 ± 1.81
3BL6.96 ± 0.59 *1AS3.28 ± 01AS2.43 ± 0.04 *1AS18.19 ± 0.31 *2AL28.65 ± 0.96
6BS6.74 ± 0.67 *6BS3.17 ± 0.06 *6AS2.39 ± 0.04 *6BS17.73 ± 0.1 *6BS27.05 ± 1.15 *
2BL6.57 ± 0.67 *6BL2.98 ± 0.03 *4AL2.12 ± 0.02 *6BL17.2 ± 0.14 *4AL26.63 ± 1.66 *
*, indicates the significant differences between the CASLs and CS at p < 0.05; mean ± SD: the average value ± standard deviation.
Table 6. Simple correlation coefficients (r) between the investigated grain traits.
CASLsHeading PeriodR ValueG ValueB ValueGrayscale ValueWidth/mmLength/mmGrain ThicknessProjected Area/mm2TGW
Heading Period1
R Value0.56 **1
G Value0.47 *0.78 **1
B Value0.290.49 **0.79 **1
Grayscale Value0.51 **0.88 **0.98 **0.78 **1
Width/mm−0.350.02−0.28−0.34−0.211
Length/mm−0.14−0.28−0.49 **−0.58 **−0.47 **0.54 **1
Grain Thickness−0.51 **−0.34−0.32−0.14−0.330.240.071
Projected Area/mm2−0.29−0.12−0.40 *−0.51 **−0.350.90 **0.84 **0.191
TGW−0.48 **−0.54 **−0.54 **−0.51 **−0.58 **0.48 **0.55 **0.38 *0.57 **1
** Correlation is significant at the 0.01 level (2-tailed); * correlation is significant at the 0.05 level (2-tailed).
Table 7. Statistical analysis of Panicle length, spikelet number, tiller number, grain number per spike of CASL under CS background.
CASLSpike Length (cm)CASLSpikelet NumberCASLNumber of Effective TillersCASLGrain Number per Panicle
6AS8.04 ± 0.41 *6BL22.16 ± 0.89 *5AL17.00 ± 1.73 *7AL51.18 ± 5.18 *
5AL8.68 ± 1.56 *4BS21.83 ± 1.62BL16.33 ± 1.53 *3AS49.77 ± 4.05 *
4AL8.04 ± 0.384AS20.86 ± 0.933BS15.33 ± 0.582AS47.12 ± 3.64
4BS7.77 ± 0.795BL20.52 ± 1.297AS15.00 ± 2.585BL46.07 ± 4.67
2AS8.03 ± 0.317BS20.48 ± 2.015BL14.33 ± 2.211BS45.8 ± 5.53
3AS7.77 ± 0.341BL19.72 ± 2.211BS14.00 ± 1.363BL45.73 ± 2.69
3BL8.02 ± 0.61CS19.49 ± 1.072AS13.67 ± 2.081BL45.13 ± 5.74
7AL7.91 ± 0.483BS19.43 ± 1.37AL13.67 ± 2.696BL44.54 ± 1.47
4AS7.49 ± 0.025AL19.39 ± 1.973AS13.33 ± 2.523AL43.11 ± 3.29
3AL7.43 ± 0.057AL19.38 ± 1.373AL13.33 ± 2.527BS42.98 ± 1.75
6AL7.62 ± 0.297BL19.09 ± 0.664AL13.33 ± 2.524BS42.81 ± 1.11
1BL7.62 ± 0.375AS18.95 ± 2.054BS13.33 ± 1.086AL42.03 ± 3.21
5AS7.45 ± 0.16BS18.84 ± 0.996BS13.33 ± 0.587BL41.47 ± 1.93
5BL7.7 ± 0.281BS18.83 ± 15AS12.33 ± 1.535AL41.43 ± 5.63
4BL7.22 ± 0.194AL18.82 ± 0.491BL12.00 ± 1.615BS40.74 ± 3.88
1AL6.71 ± 0.266AS18.61 ± 2.763BL12.00 ± 14AL40.49 ± 5.93
1BS7.42 ± 0.557AS18.51 ± 1.864BL12.00 ± 1.61CS39.42 ± 2.86
7BL6.91 ± 0.72BL17.75 ± 1.416AS11.67 ± 2.062AL38.58 ± 2.73
CS7.03 ± 0.65BS17.62 ± 2.047BS11.67 ± 1.532BL38.48 ± 3.84
7AS7.06 ± 0.382AS17.36 ± 1.016AL11.33 ± 0.584BL38.46 ± 2.63
3BS6.62 ± 0.436AL17.26 ± 1.13CS11.00 ± 1.006BS37.55 ± 3.65
7BS6.7 ± 0.553BL17.19 ± 0.442AL10.67 ± 1.796AS36.36 ± 3.6
6BL7.02 ± 0.164BL17.11 ± 1.082BS10.00 ± 1.007AS36.3 ± 4.86
1AS6.57 ± 0.141AL17.08 ± 0.637BL10.00 ± 1.042BS34.29 ± 3.28
2BL6.62 ± 0.763AL16.78 ± 0.544AS9.67 ± 1.434AS33.97 ± 2.19
5BS6.87 ± 0.323AS16.7 ± 1.745BS9.00 ± 0.731AL32.81 ± 2.76
2BS6.74 ± 0.352BS16.37 ± 1.03 *6BL9.00 ± 1.655AS31.28 ± 3.04
6BS6.38 ± 0.031AS16.2 ± 0.9 *1AL6.33 ± 1.53 *1AS30.57 ± 2.41 *
2AL6.04 ± 0.382AL15.71 ± 1.52 *1AS6.00 ± 1.00 *3BS30.13 ± 2.75 *
* indicates the significant differences between the CASLs and CS at p < 0.05; mean ± SD: the average value ± standard deviation.
Table 8. Simple correlation coefficients (r) between the investigated agronomic traits.
CASLSpike LengthEffective GrainsEffective Tiller Spikelet NumberTGW
Spike Length1
Effective Grains0.54 **1
Effective Tiller0.41 *0.33 *1
Spikelet Number0.230.170.191
TGW0.230.210.00−0.031
** Correlation is significant at the 0.01 level (2-tailed); * correlation is significant at the 0.05 level (2-tailed).
Table 9. Statistical analysis of plant height, panicle type, type of mountain of CASL.
BLH BackgroundCS Background
CASLPlant Height (cm)Panicle TypeType of Spike AwnCASLPlant Height (cm)Panicle TypeType of Spike Awn
5BS91.92 ± 2.44 **Elliptic-typeLong awn2BS136.19 ± 3.81 **Elliptic-typeNo awn
7AL91.74 ± 2.83 **Elliptic-typeLong awn4AL126.52 ± 3.48 **Elliptic-typeBase short awn
Top long awn
1AL91.10 ± 2.03 **Elliptic-typeLong awn7AL124.47 ± 3.53 **Elliptic-typeNo awn
5BL90.89 ± 2.50 **Elliptic-typeLong awn1BL122.67 ± 4.33 **Elliptic-typeNo awn
1BS90.87 ± 2.55 **Elliptic-typeLong awn4BL122.98 ± 4.02 **Elliptic-typeNo awn
6AS90.70 ± 2.93 **Elliptic-typeLong awn1AS122.08 ± 4.92 **RectangleNo awn
1AS89.73 ± 2.86 **Elliptic-typeLong awn1AL121.53 ± 3.47 **Clavate-typeNo awn
7AS89.73 ± 2.86 **Elliptic-typeLong awn1BS121.37 ± 3.63 **Elliptic-typeNo awn
2AS87.93 ± 2.4Elliptic-typeLong awn4AS120.13 ± 3.87Elliptic-typeBase short awn
Top long awn
2BS87.87 ± 2.55Elliptic-typeLong awn3AS117.62 ± 5.38RectangleNo awn
BLH86.26 ± 1.67Elliptic-typeLong awn7BS117.02 ± 2.98Elliptic-typeNo awn
3AL86.07 ± 2.1Elliptic-typeLong awn6AS116.01 ± 3.99Elliptic-typeNo awn
2BL85.74 ± 2.84Elliptic-typeLong awn5AS115.24 ± 4.76Elliptic-typeNo awn
3BL84.52 ± 3.33Elliptic-typeLong awn7BL114.04 ± 3.96Elliptic-typeNo awn
3AS84.13 ± 1.95Elliptic-typeLong awn5AL113.82 ± 4.18cone modelNo awn
5AS84.02 ± 2.2Elliptic-typeLong awn6BS113.13 ± 3.87Elliptic-typeBase short awn
Top long awn
3BS83.96 ± 2.33Elliptic-typeLong awnCS112.61 ± 2.39Elliptic-typeNo awn
4BL83.87 ± 2.54Elliptic-typeLong awn2AS111.97 ± 3.03Elliptic-typeNo awn
4BS82.12 ± 1.98 **Elliptic-typeLong awn4BS111.82 ± 3.18Elliptic-typeNo awn
4AL81.92 ± 2.42 **Elliptic-typeLong awn5BL110.59 ± 4.41Elliptic-typeNo awn
7BS81.71 ± 2.9 **Elliptic-typeLong awn6AL109.83 ± 5.17Elliptic-typeNo awn
6BL80.26 ± 1.67 **Elliptic-typeLong awn3AL109.16 ± 5.84Elliptic-typeNo awn
6AL80.02 ± 2.2 **Elliptic-typeLong awn6BL109.25 ± 3.75Elliptic-typeBase short awn
Top long awn
1BL78.03 ± 2.18 **Elliptic-typeLong awn3BS108.46 ± 4.54RectangleNo awn
7BL76.87 ± 2.55 **Elliptic-typeLong awn5BS108.74 ± 3.26Elliptic-typeNo awn
TTD73.46 ± 1.54 **Spindle-typeLong awn3BL105.08 ± 2.92Elliptic-typeNo awn
7AS103.69 ± 3.31Elliptic-typeNo awn
2AL102.99 ± 4.01Clavate-typeNo awn
2BL101.37 ± 3.63Elliptic-typeNo awn
TTD 73.46 ± 1.54 **Spindle-typeLong awn
** indicates the significant differences between the CASLs and parental lines at p < 0.01; mean ± SD: the average value ± standard deviation.
Disclaimer/Publisher’s Note: The statements, opinions and data contained in all publications are solely those of the individual author(s) and contributor(s) and not of MDPI and/or the editor(s). MDPI and/or the editor(s) disclaim responsibility for any injury to people or property resulting from any ideas, methods, instructions or products referred to in the content.

