Article

Engineering Soil Quality and Water Productivity Through Optimal Phosphogypsum Application Rates

1
Yunnan Phosphate Chemical Croup Co., Ltd., National Engineering and Technology Center for the Development & Utilization of Phosphorous Resources, Kunming 650600, China
2
School of Ecology, Hainan University, Haikou 570228, China
3
Key Laboratory of Agricultural Soil and Water Engineering in Arid and Semiarid Areas, Ministry of Education, Northwest A&F University, Yangling 712100, China
4
Faculty of Modern Agricultural Engineering, Kunming University of Science and Technology, Kunming 650500, China
5
Yunnan Provincial Field Scientific Observation and Research Station on Water-Soil-Crop System in Seasonal Arid Region, Kunming University of Science and Technology, Kunming 650500, China
*
Author to whom correspondence should be addressed.
Agronomy 2025, 15(1), 35; https://doi.org/10.3390/agronomy15010035
Submission received: 17 November 2024 / Revised: 23 December 2024 / Accepted: 24 December 2024 / Published: 27 December 2024
(This article belongs to the Section Farming Sustainability)

Abstract

:
Water scarcity and soil degradation pose challenges to sustainable agriculture. Phosphogypsum, a low-cost solid waste, shows potential as a soil amendment, but its impact on water saving and soil quality need further study. This research assessed the effects of phosphogypsum application rates (CK: no phosphogypsum, 0.075%, 0.15%, 0.3% and 0.6%) on soil infiltration, water retention, salinity, soil quality, crop yield and irrigation water productivity (IWP) to identify the optimal rate. Phosphogypsum application altered pore structure and water potential gradients, slowing wetting front migration, increasing infiltration duration (102 to 158 min), cumulative infiltration (17.37 to 27.44 cm) (p < 0.05) and soil water content (18.25% to 24.33%) (p < 0.05) as the rate increased from CK to 0.6%. It also enhanced water retention by enhancing soil aggregation and reducing evaporation.By promoting the formation and stabilization of soil aggregates, phosphogypsum application (CK to 0.6%) reduced bulk density from 1.20 g/cm3 to 1.12 g/cm3 (p < 0.05), while porosity, available nitrogen and urease activity increased by 3.70%, 39.42% and 82.61%, respectively (p < 0.05). These enhancements provided a strong foundation for improved crop performance. Specifically, phosphogypsum enhanced yield through three pathways: (1) improving soil physical properties, which influenced soil nutrients and then improved enzyme activities; (2) directly affecting soil nutrients, which impacted enzyme activities and increased yield; and (3) directly boosting enzyme activities, leading to increased yield. The comprehensive benefits of phosphogypsum initially increased and then decreased, with an optimal application rate of 0.45% determined through TOPSIS, a method that ranks alternatives based on their proximity to an ideal solution, considering factors including soil quality, crop yield and IWP. These findings confirm the feasibility of phosphogypsum as an effective resource to enhance water efficiency and soil quality, promoting sustainable agricultural practices.

1. Introduction

Water scarcity and soil degradation were major challenges to sustainable agriculture [1]. According to FAO, 30% of land faced water scarcity and 33% suffered from moderate to severe degradation [2]. Issues like salinization, nutrient loss and reduced biological activity directly affected crop yield, water use efficiency (WUE) and ecosystem stability [2]. Innovative soil management strategies are urgently needed to address these problems and ensure agricultural sustainability.
In recent years, soil amendments have been widely recognized as an effective approach to improving soil quality, water conditions, crop yield and WUE [3,4,5]. Amendments like biochar, polyacrylamide (PAM), silicate minerals and sodium alginate optimized soil water retention and nutrient availability by enhancing soil physical structure, nutrient effectiveness and biological activity [6]. Zeolite reduced bulk density, increased porosity and improved soil aeration and water retention, providing a stable supply of water and nutrients to crop roots [7]. Albalasmeh et al. [8] reported that PAM increased WUE under drought conditions by stabilizing soil aggregates and enhancing permeability. Biochar, with its porous structure and high cation exchange capacity, excelled at improving soil fertility, water holding capacity and microbial activity, promoting nutrient metabolism and significantly increasing crop yield [9,10]. However, the high costs and energy demands of these inputs, especially at higher application rates, limit their feasibility in some regions [11,12]. This highlighted the urgent need for low-cost, sustainable soil amendments to support efficient and sustainable agricultural production.
Phosphogypsum, a by-product generated from the phosphorus (P) fertilizer industry, is primarily composed of calcium sulfate dihydrate (CaSO4·2H2O) [13,14]. Currently, the global annual production of phosphogypsum is approximately 300 million t, with production continuing to rise [15]. However, the utilization efficiency of phosphogypsum remains low, with around 58% being stored or landfilled, 28% discharged into coastal waters and only 14% being recycled [16,17]. The piles of phosphogypsum not only occupies large areas of land but also poses significant environmental risks to surrounding ecosystems, including groundwater, the atmosphere and soil [18,19,20,21]. These risks are primarily due to its content of natural radioisotopes, such as radon (Rn), radium (Ra) and thorium (Th), which arise from the decay of uranium (U) present in phosphate minerals [22]. Additionally, phosphogypsum often contains toxic heavy metals like arsenic (As), lead (Pb), mercury (Hg) and cadmium (Cd), which could leach into the environment, contaminating soils and both surface and groundwater resources [23,24]. Therefore, the exploration of efficient utilization methods for phosphogypsum, particularly its resource recovery in other fields, needs to be urgently addressed [13].
Phosphogypsum shares certain similarities in its physicochemical properties with other soil amendments. Once phosphogypsum undergoes harmless treatment, it becomes viable for use in soils and crops where these elements are deficient [25]. Physically, it optimizes soil pore distribution by increasing micropores, which improves water infiltration, redistribution and storage capacity [26]. Enhanced pore distribution deepens water penetration, reduces surface runoff and evaporation losses and creates favorable conditions for microbial activity and enzyme reactions, which further boost enzyme activity [27,28]. Li et al. [26] demonstrated that phosphogypsum altered the soil microbial environment, enhancing the activity of sucrose and urease, which played crucial roles in nitrogen (N) cycling, carbon decomposition and antioxidant metabolism. Chemically, phosphogypsum provided soluble calcium ion (Ca2⁺) and sulfate ion (SO42⁻). Ca2⁺ could displace sodium ion (Na⁺) through cation exchange, thereby improving soil structure and enhancing the availability of nutrients, ultimately improving nutrient use efficiency in crops. Bossolani et al. [29] demonstrated that long-term application of phosphogypsum reduced 15N loss and improved 15N recovery by regulating soil nutrient availability, crop growth and N cycling genes. Ca2⁺ in the soil could form relatively stable calcium phosphate (Ca3(PO4)2) compounds with phosphate ions, thereby reducing the risk of P loss while providing a continuous P source for crops [30]. Additionally, phosphogypsum provided abundant sulfur (S) to the soil, an essential nutrient in the form of SO42⁻ that is often over-looked [25,31]. The increased nutrient concentration stimulated the metabolic potential of soil microbes, significantly enhancing enzyme activity. For example, the increase in P in the soil stimulated phosphatase activity, accelerating the decomposition and transformation of organic P [32]. The rise in N promoted N mineralization through urease activity, increasing plant absorption of ammonium and nitrate [33]. Overall, phosphogypsum optimized water movement and storage at the physical level while enhancing soil fertility through chemical and biological pathways, establishing its role as an efficient and economical soil amendment [33,34,35]. Furthermore, unlike traditional amendments, phosphogypsum improved soil water conditions and nutrient supply while offering unique environmental and economic advantages [25]. Its reutilization reduced the environmental burden of phosphogypsum waste storage, and its low cost made large-scale agricultural applications feasible [36].
Based on previous studies, we hypothesized that phosphogypsum application could improve soil water movement, enhance soil properties, crop yield and irrigation water productivity (IWP), thereby promoting sustainable agricultural production in arid regions. Therefore, this study systematically evaluated the effects of different phosphogypsum application rates on soil infiltration, water retention, soil physical properties, nutrients, microbial activity as well as crop yield and IWP, and determined the optimal application rate through a comprehensive multi-indicator analysis. The findings provide valuable insights for the resource utilization of phosphogypsum and contribute to the sustainable development of agriculture.

2. Materials and Methods
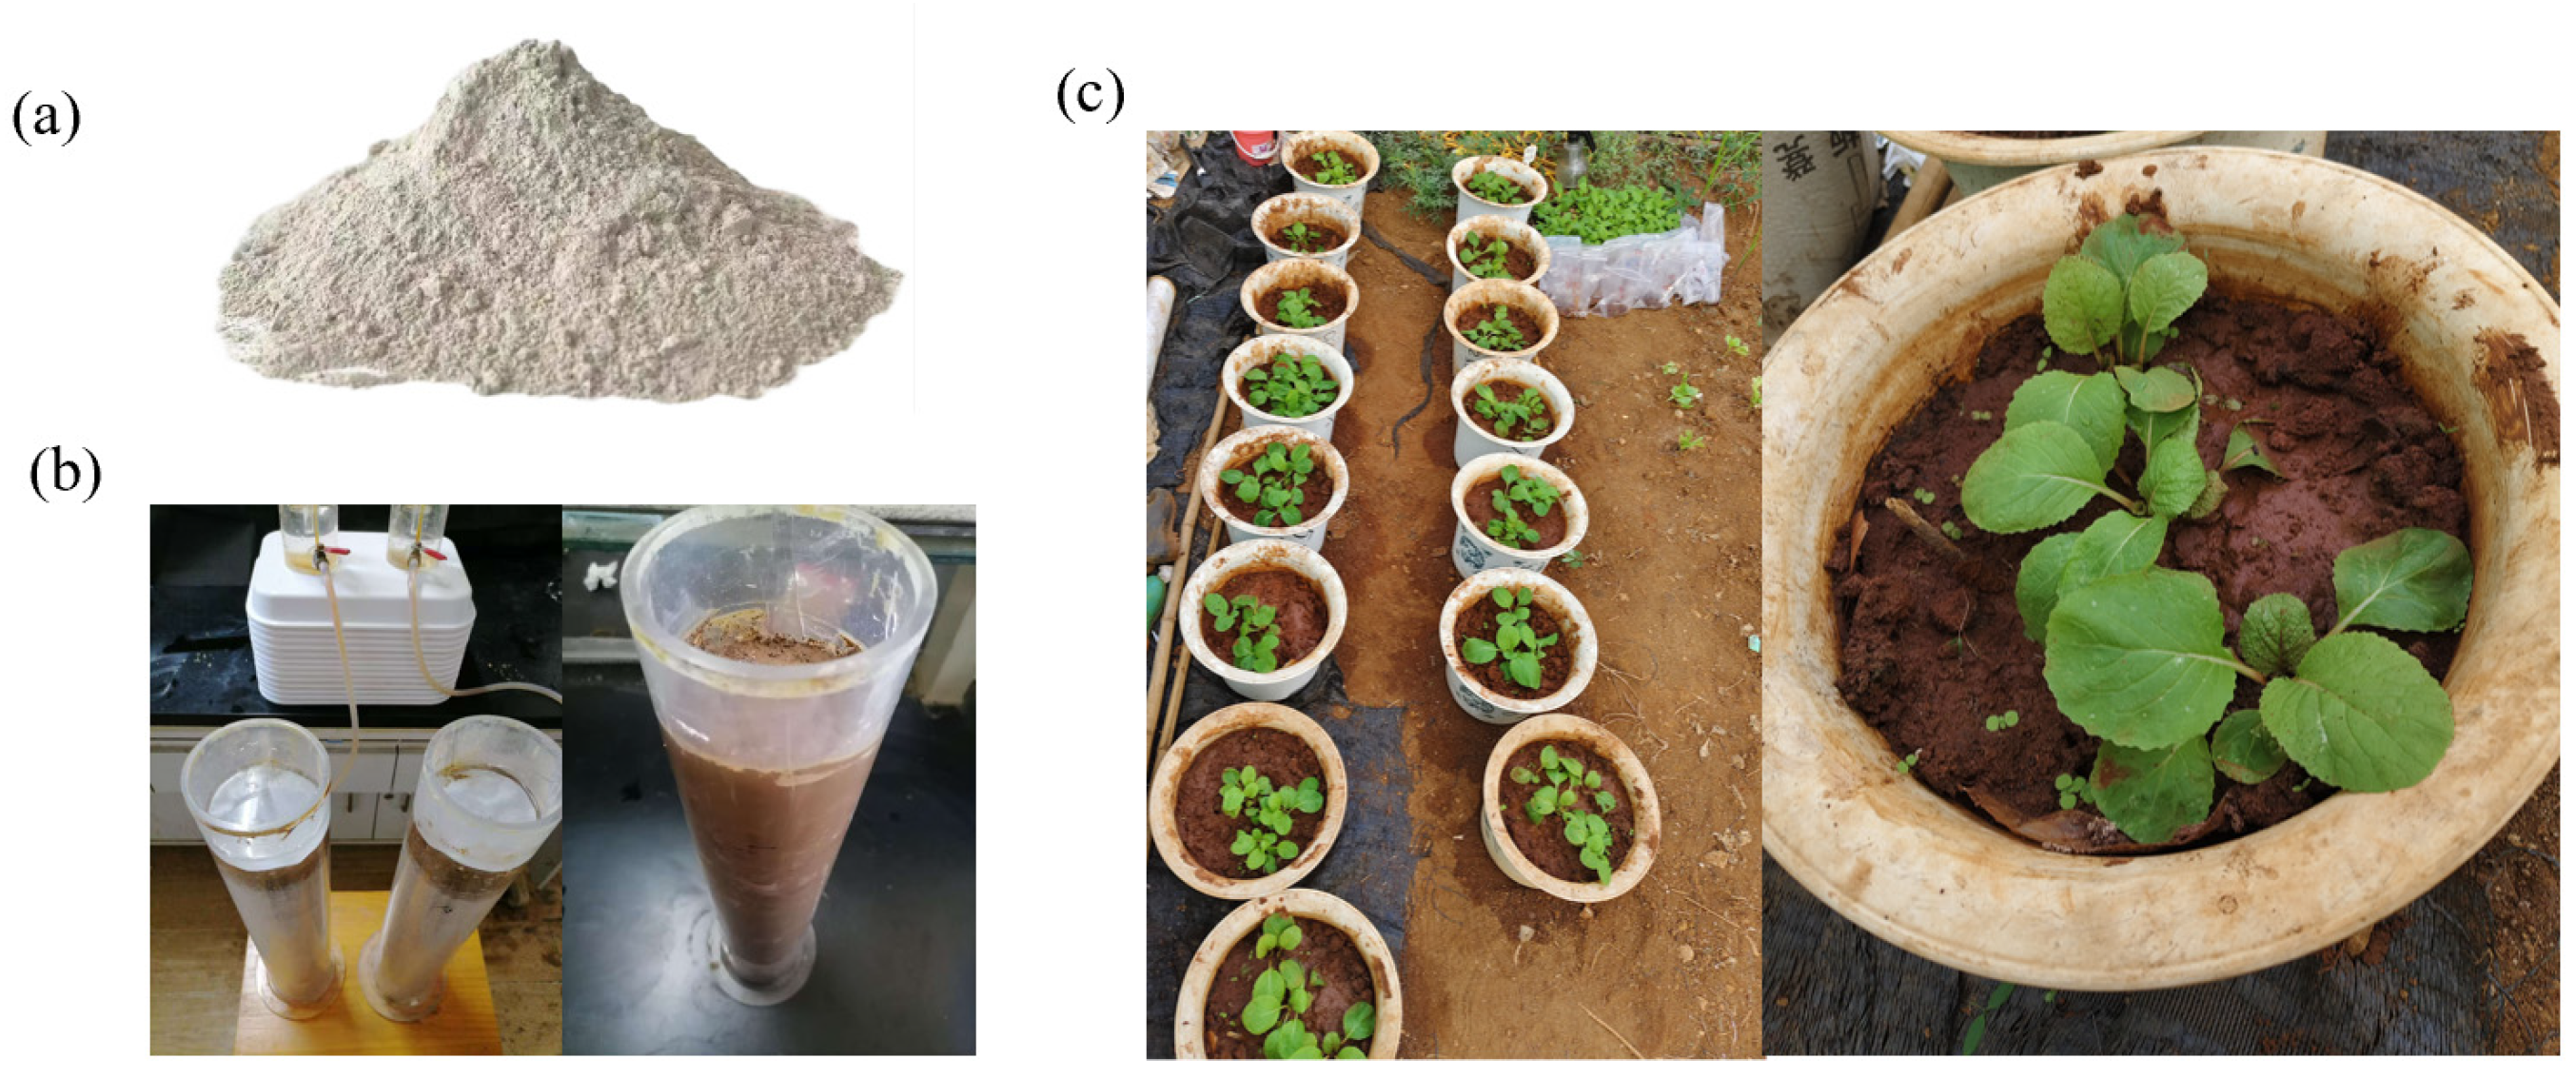
2.1. Materials

Yunnan is one of the main phosphogypsum production areas in China. In this study, the phosphogypsum was sourced from the phosphate slag of Yunnan Phosphate Chemical Group in Yunnan Province, China (Figure 1a) [37]. To prevent the hazards posed by radiation and heavy metals, the phosphogypsum used underwent harmless treatment, ensuring its safe use in agriculture and preventing the risk of soil and water contamination. The contents of As and Hg were determined using atomic fluorescence spectrometry. Dried 0.2 g samples were wetted with a small amount of water and digested with 10 ml aqua regia. The analysis was conducted with a fluorescence spectrophotometer using a reducing agent and a carrier solution. The contents of Pb, Cd, chromium (Cr) and nickel (Ni) were analyzed using atomic absorption spectrometry. Samples (0.2 g) were wetted in a 50 ml crucible with a small amount of water, digested in a hydrochloric acid (HCl) solution, and heated at low temperature on an electric heating plate in a ventilation cabinet. The final determination was performed using an atomic absorption spectrophotometer. Referring to the Chinese standard “Soil Environmental Quality—Risk Control Standard for Soil Contamination of Agricultural Land” (GB15618 [38]), the heavy metal content of the phosphogypsum used in this study was within the safe range and did not cause soil contamination (Table 1). The main components of phosphogypsum are CaSO4 and silicon dioxide (SiO2), collectively comprising roughly 80% of its overall mass. Additionally, phosphogypsum also contained minor amounts of phosphorus pentoxide (P2O5), aluminum oxide (Al2O3), soluble fluorine (F), iron oxide (Fe2O3), organic substances and other impurities. The detailed chemical composition of phosphogypsum and heavy metals content is presented in Table 1 and the pH of phosphogypsum was 4.2.

2.2. Soil Infiltration with Phosphogypsum

The infiltration experiment focused on the effects of different phosphogypsum application rates on the water infiltration rate and cumulative infiltration (Figure 1b). Cumulative infiltration measured the total water absorbed by the soil (cm), while the infiltration rate reflected the speed of water entry in a given period. The experiment involved five phosphogypsum application levels: CK (no phosphogypsum), 0.075%, 0.15%, 0.3% and 0.6%. The soil used for the experiment was a clay loam with 36.5% sand, 22.8% clay, 40.7% silt, a bulk density of 1.32 g/cm3, an electrical conductivity of 263.2 µS/cm and a pH of 7.2. The experimental unit for the infiltration experiment consisted of acrylic soil columns and Mariotte’s bottles. The acrylic soil columns measured 50 cm in height and 6 cm in diameter, while the Mariotte’s bottles were 40 cm high and 5 cm in diameter. Water was supplied to the soil column from the Mariotte’s bottle via a rubber tube. According to the experimental design, phosphogypsum was mixed with soil in different proportions to form a phosphogypsum–soil mixture. Subsequently, the mixture was filled and compacted in layers to a thickness of 5 cm, carefully filling the soil column to a height of 40 cm [39]. Each treatment was replicated three times, resulting in a total of 15 experimental units. To create a homogeneous mixture and ensure consistent compaction throughout the column, the surface of the previously compacted layer was stirred before adding each new layer to prevent distinct layering. The infiltrated water source was tap water, with a pH of 7.02, electrical conductivity of 172.3 µS/cm and total dissolved solids of 234 mg/L. Moreover, to minimize irrigation surface effects and prevent fine particle loss, filter paper was placed at the top and bottom of the soil layers [40,41]. A 50 cm tape measure was attached vertically to the outer wall of each soil column to monitor the position of the wetting front during infiltration. Infiltration experiments under constant head conditions maintained the water level 2 cm above the soil surface. A stopwatch recorded time intervals, with observations at 0.5, 1, 1.5, 2, 3, 4, 5, 6, 8, 10, 12, 14, 16, 19, 22, 25, 28, 32, 36, 40, 45, 50, 55, 60, 70, 80, 90, 100, 120, 140 and 160 min, until the wetting front reached 40 cm [42]. Additional time recordings were made at wetting front depths of 20 cm and 40 cm. Cumulative infiltration was tracked using a mariotte bottle scale. Each treatment was repeated three times to ensure reliability and consistency. After infiltration, the columns were left to rest for 12 h, after which samples were taken every 2 cm to measure soil electrical conductivity and soil moisture content. Soil electrical conductivity was measured using a conductivity meter (DDS-307), while soil water content was determined using the oven-drying method with the following formula:
Soil moisture content (%) = (Ws − Ds)/Ds × 100
where Ws is the weight of the wet soil (g); Ds is the weight of the dry soil (g).

2.3. Infiltration Models

2.3.1. Wetting Front Propulsion Model [39]

The advancement of the wetting front during infiltration follows a power function [43], with its depth estimated using the following formula:
Fz = AtB
where FZ represents the wetting front depth (cm), with A and B as fitting parameters.

2.3.2. Cumulative Infiltration Model

Cumulative infiltration was evaluated using the Lewis, Philip and Horton models [39,44], with the following formulas:
(1)
Lewis equation:
I = Ktα
where I is the cumulative infiltration (cm), K and α are fitting parameters, t is the infiltration time (min).
(2)
Philip infiltration model:
I = St0.5
In this equation, S is the sorptivity (cm/min0.5).
(3)
Horton infiltration model:
I = at + (b − a)(1 − e−ct)/c
where a and b denote the assumed final and initial infiltration rates (cm/min), respectively, with c as an empirical constant.

2.3.3. Model Parameters Calculation

The model parameters were calculated by fitting equations to the measured data using a regression analysis approach. Specifically, the measured data points were used to establish the functional relationship between the variables. The parameters were obtained by minimizing the residual sum of squares between the observed and predicted values through an iterative optimization process by the least-squares method.

2.3.4. Evaluating Indices of Models

The model’s effectiveness was assessed using various statistical criteria, including mean absolute error (MAE), relative root mean square error (RRMSE), coefficient of residual mass (CRM) and coefficient of efficiency (CE), with the following formulas [45]:
MAE = i = 1 n Y i o b i s Y i s i m n
RRMSE = n 1 i = 1 n ( Y i o b i s Y i s i m ) 2
CRM = i = 1 n Y i o b i s Y i s i m · 100 i = 1 n Y i o b i s
CE = 1 i = 1 n ( Y i o b i s Y i s i m ) 2 i = 1 n ( Y i o b i s Y m e a n ) 2
where Yiobs and Yisim are the ith observed and simulated values, Ymean denotes the average of the measured values, and n represents the total number of data points. At CK, 0.75%, 0.3% and 0.6% treatments, the n values were 28, 29, 30, 30 and 31, respectively.

2.4. Field Experiment

Phosphogypsum has the potential to improve soil quality, crop yield and IWP, with its effectiveness closely linked to application rate. To evaluate the effects of phosphogypsum application rates on soil quality, cabbage yield as well as IWP, field experiments were conducted from April to July 2023 in Kunming, Yunnan (Figure 1c). The experiments included five treatments with varying the phosphogypsum application rate, consistent with the infiltration experiment levels: no phosphogypsum (CK), 0.075%, 0.15%, 0.3% and 0.6%. To ensure the scientific validity and reproducibility of the data, each treatment was replicated three times. Each treatment received the same irrigation amount, which was based on the local conventional irrigation rate, totaling 260 mm of irrigation throughout the entire growth period. The irrigation water source was also local tap water. Fifty days after transplanting, soil and mature plant samples were collected from each treatment.
Yield was determined using the weighing method. Fresh soil samples were collected near the roots of the cabbage, with plant residues such as roots removed. The following soil properties were determined: soil bulk density, porosity, soil organic matter (SOM), available nitrogen (AN), available phosphorus (AP), available potassium (AK) and the activities of urease, invertase and catalase. Soil bulk density was quantified using the cylinder method. Porosity was calculated by evaluating both bulk density and particle density [46]. The SOM was measured using the potassium dichromate external heating technique. AN, AP and AK were determined through the alkali-hydrolyzed diffusion approach, sodium bicarbonate-molybdenum-antimony colorimetric method and the ammonium acetate-flame photometer technique, respectively [47]. Urease activity was analyzed by incubating 5.0 g of field-moist soil with 2.5 mL of 80 mM urea solution at 37 °C for 2 h, with deionized water used for controls. The released ammonium was extracted using 50 mL Potassium chloride (KCl) solution and measured at 690 nm against a reagent blank with a digital UV–Vis spectrophotometer [48,49]. Invertase activity was assessed by incubating a sucrose solution as a substrate at 37 °C for 24 h, followed by colorimetric measurement of the resulting glucose [50]. Soil catalase activity was measured through potassium permanganate titration [51]. IWP was calculated using the following formula:
IWP = Y/IA
where Y represents the cabbage yield (g), and IA is the total irrigation amount during the growth period (mm).

2.5. Comprehensive Evaluation

In this study, multiple indicators were analyzed, including soil bulk density, porosity, SOM, AN, AP, AK, urease, invertase, catalase, cabbage yield and IWP. To comprehensively assess the impact of phosphogypsum addition on soil quality, yield and IWP, the Technique for Order of Preference by Similarity to Ideal Solution (TOPSIS) was applied across different treatments to determine the optimal management practices for phosphogypsum application. The specific calculation process followed the methods described by Liu et al. [52] as follows.
A comprehensive evaluation of soil bulk density, porosity, SOM, AN, AP, AK, urease, invertase, catalase, cabbage yield and IWP under different treatments was conducted using TOPSIS to obtain the best management practices for phosphogypsum. Due to the number of evaluation objects and indicators, the decision matrix can be formed and normalized by using following formula:
a h j = x h j / h = 1 o x h j 2
where ahj is the jth indicator in the hth evaluation objects.
v h j is calculated as follows:
v h j = w h × a h j
where w h is the weight determined by the entropy weight method.
The positive ideal solution values (A+) and negative ideal solution values(A) are determined by the following formula:
A + = max v h j A + = v 1 , + , v 2 , + , , v j , +
A = min v h j A = v 1 , , v 2 , , , v j ,
With the help of Equations (15) and (16), the Euclidian distance between A+ and A is calculated.
D h + = j = 1 m ( A j + v h j ) 2
D h = j = 1 m ( A j v h j ) 2
The closeness index (CI) is given by Equation (17). The higher the CI, the better the object is relative to others.
C I h = D h / D h + + D h ,       h = 1 , 2 , , o .

2.6. Statistical Analysis

Experimental data were analyzed using SPSS software (version 26) and MATLAB 2020a (MathWorks, Natick, MA, USA), with statistical significance set at 0.05 [53]. Correlation analysis and cluster analysis were conducted to explore the relationships among soil properties, enzyme activities and nutrient availability. Pearson correlation analysis was used to examine these relationships, with significance levels evaluated using t-tests. Cluster analysis was applied to group similar variables based on their correlation patterns, using Ward’s method and Euclidean distance as the linkage and dissimilarity measures. Partial least squares path modeling (PLS–PM) was constructed using the SmartPLS (v 3.3.9). Data visualization was conducted with Origin 2023a (OriginLab, Northampton, MA, USA).

3. Results

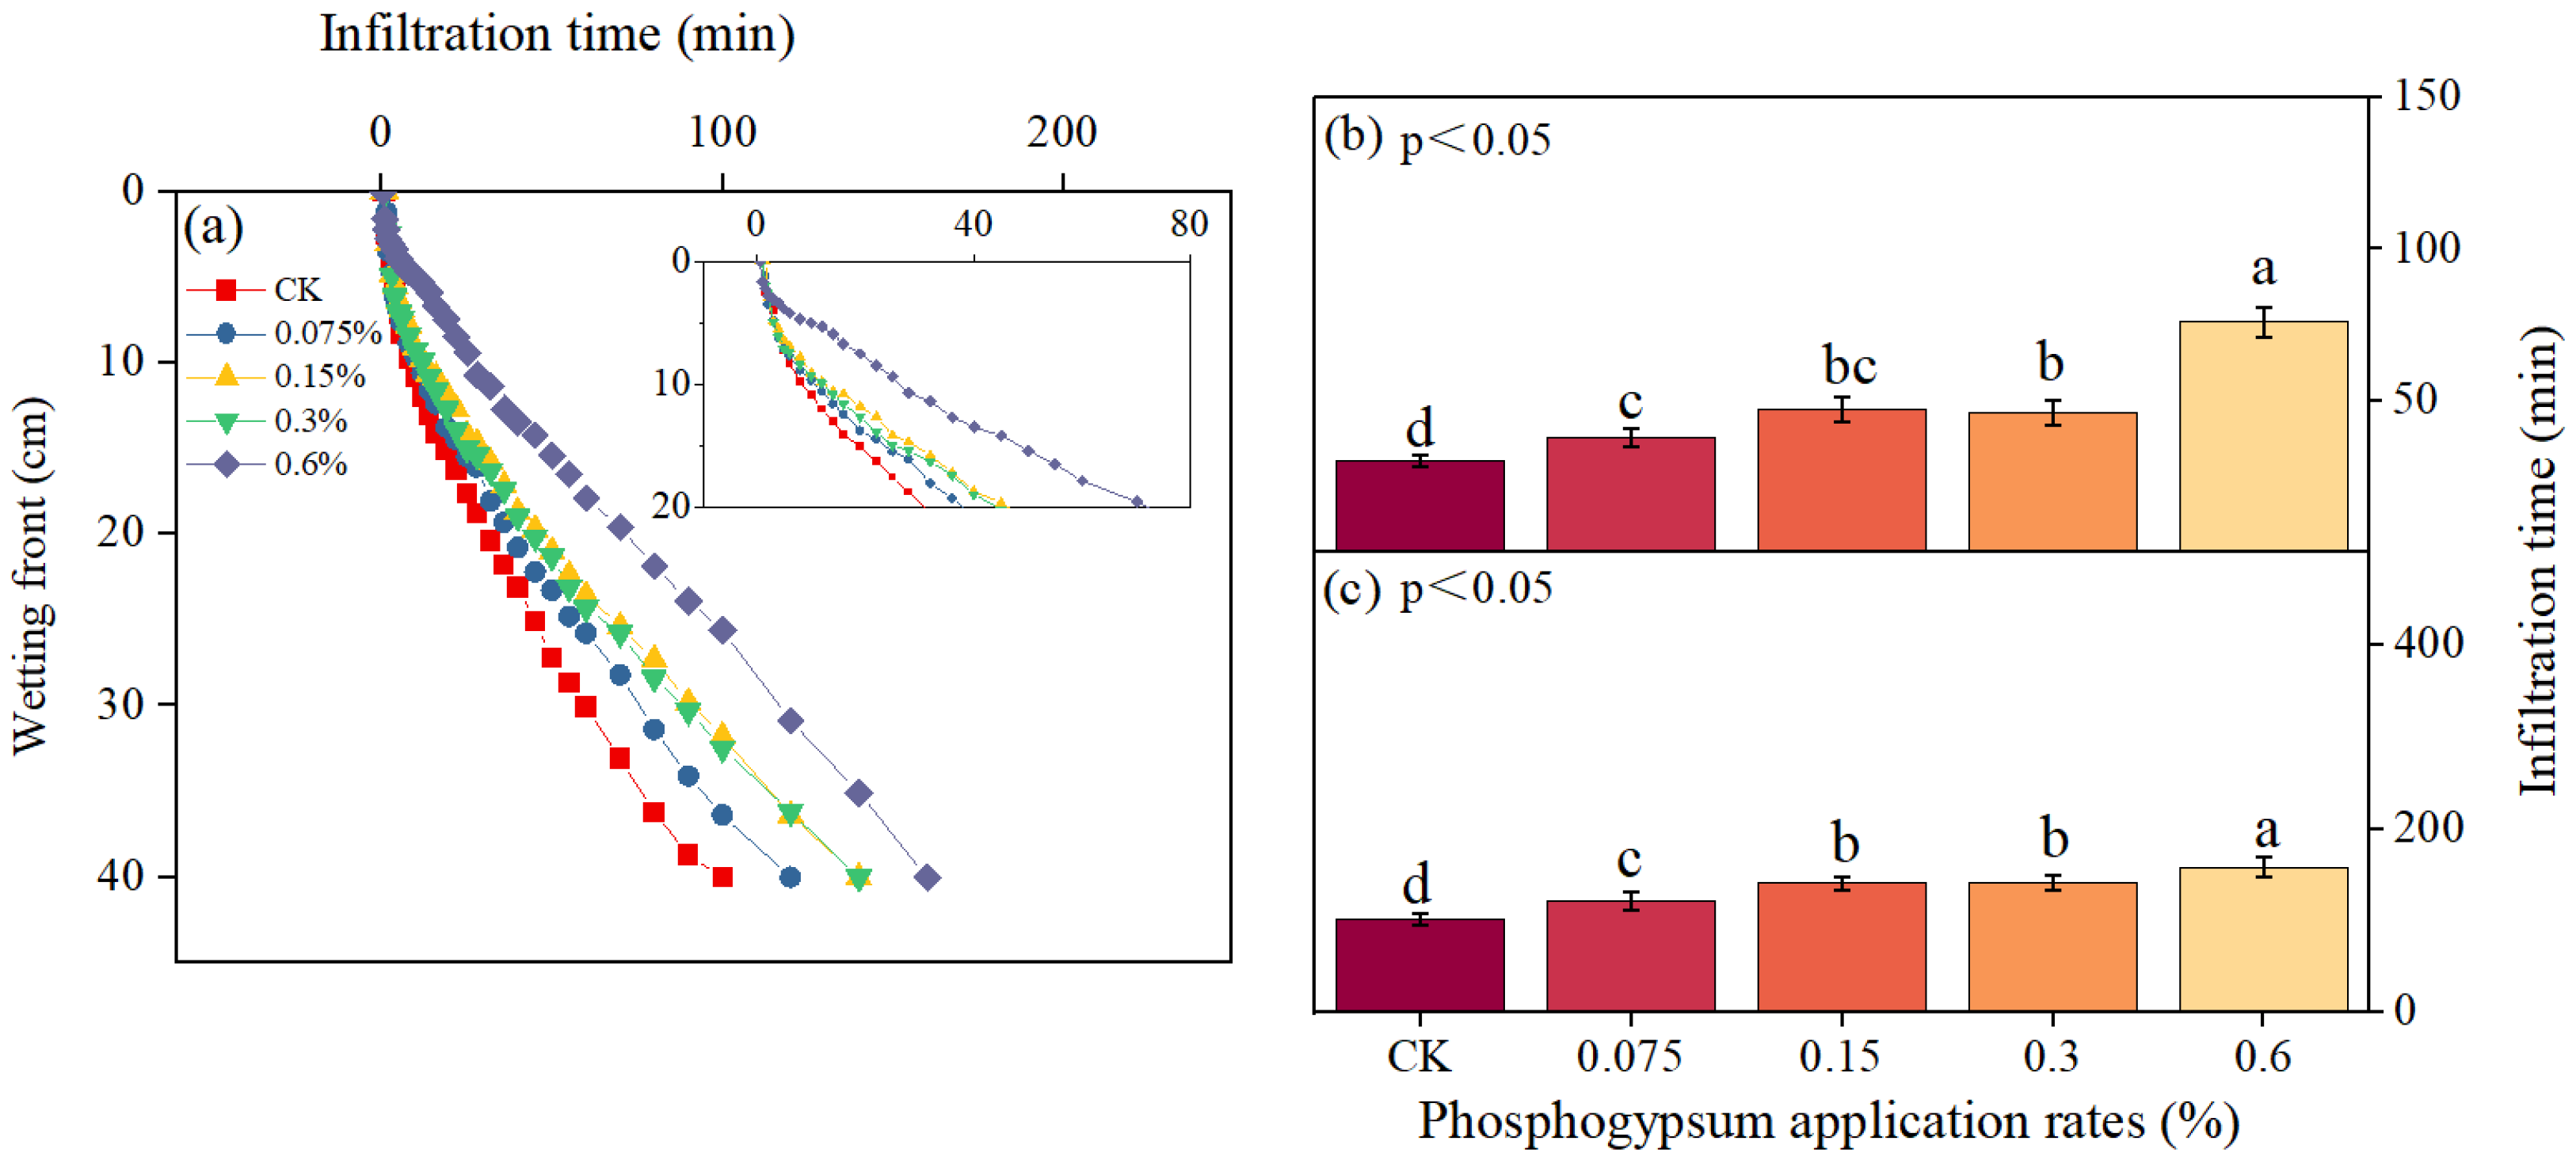
3.1. Dynamic Changes of Wetting Front

The dynamic infiltration characteristics of the wetting front under different phosphogypsum application rates are shown in Figure 2. The wetting front depth increased with infiltration time for all treatments under the effects of soil matric suction and gravity. During the initial infiltration phase, the wetting front migrated rapidly, with similar depths across treatments, as the adhesive properties of phosphogypsum had not yet influenced water migration. Over time, the differences in infiltration time to reach the same depth became more pronounced (Figure 2a). For a 20 cm depth, infiltration times were 30, 38, 46, 47 and 76 min for CK, 0.075%, 0.15%, 0.3% and 0.6%, respectively (Figure 2b). CK exhibited the shortest infiltration time, while 0.6% required the longest. In the later infiltration stage, at a depth of 40 cm, infiltration times were 102, 121, 141, 143 and 158 min, respectively (Figure 2c). Significant differences were observed between most treatments (p < 0.05), except between 0.15% and 0.3%. These findings indicated that phosphogypsum slowed wetting front migration, with higher application rates resulting in longer infiltration times and more pronounced reductions.

3.2. Soil Water Cumulative Infiltration and Infiltration Rate

The cumulative infiltration increased over time and differences among the treatments varied with time (Figure 3). Initially, cumulative infiltration curves exhibited steep slopes, reflecting high infiltration rates, and no significant differences were observed. Within the first 5 min, cumulative infiltration for CK, 0.075%, 0.15%, 0.3% and 0.6% treatments were 5.31, 4.98, 4.81, 4.06 and 1.88 cm, respectively, with corresponding average infiltration rates of 1.06, 1.00, 0.96, 0.81 and 0.38 cm/min (Figure 3b). CK showed the highest infiltration rate, with significant differences noted between most treatments (p < 0.05). As infiltration progressed, lower application rates resulted in shorter infiltration durations, while higher rates prolonged the process, leading to increased cumulative infiltration. By the end of infiltration, cumulative infiltration reached 17.37, 19.25, 23.38, 24.50 and 27.44 cm for CK, 0.075%, 0.15%, 0.3% and 0.6%, respectively, indicating a positive correlation with phosphogypsum application rate (Figure 3a). However, higher application rates extended infiltration time, affecting final infiltration rates. At the end of infiltration, the rates were 0.174, 0.160, 0.167, 0.175 and 0.172 cm/min for CK, 0.075%, 0.15%, 0.3% and 0.6%, respectively (Figure 3c). Notably, the 0.3% treatment achieved a final infiltration rate comparable to CK, significantly higher than the other treatments (p < 0.05). In summary, phosphogypsum increased cumulative infiltration, but excessive application rates reduced infiltration efficiency. The 0.3% application rate is recommended to balance cumulative infiltration and the infiltration rate effectively.

3.3. Soil Water Infiltration Models

Table 2 summarizes the wetting front infiltration model parameters (A and B) and accuracy metrics (MAE, RRMSE, CRM and CE) for different phosphogypsum application rates. Significant differences in A and B values among treatments highlighted phosphogypsum’s pronounced impact on infiltration dynamics. As the application rate increased, the A value decreased from 2.537 (CK) to 0.819 (0.6%), indicating a substantial reduction in the wetting front progression rate. The B value peaked at 0.758 (0.6%), suggesting the significant influence of higher phosphogypsum rates on wetting front behavior. In terms of model accuracy, MAE ranged from 0.553 to 0.620, reflecting low prediction errors. RRMSE values were lowest for CK (0.044) and slightly higher for 0.6% (0.061), indicating a minor increase in relative error at higher phosphogypsum levels. The CRM values were close to zero for all treatments, further confirming the model’s predictions closely matched the observed values without systematic over-estimation or underestimation. Notably, the CRM for the highest phosphogypsum treatment (0.6%) was negative, suggesting a slight over-estimation of wetting front progression. CE values exceeded 0.990 for all treatments, indicating excellent model fit. In summary, the wetting front infiltration model exhibited stable accuracy and strong fitting performance across varying phosphogypsum levels, providing valuable insights for optimizing irrigation management.
Table 2 also evaluates the applicability of three commonly used cumulative infiltration models (Lewis, Philip and Horton) under varying phosphogypsum application rates. The Lewis model demonstrated strong adaptability and accuracy, with K and α parameters ranging from 0.427 to 2.571 and 0.431 to 0.820, reflecting changes in soil hydraulic conductivity and infiltration rates. MAE values ranged from 0.239 to 0.482, and RRMSE increased slightly from 0.034 to 0.074, while CRM remained near zero and CE ranged from 0.990 to 0.999, indicating reliable predictions across all application rates. In contrast, the Philip model showed reduced accuracy at higher application rates, with MAE and RRMSE increasing and CE declining from 0.987 to 0.921, highlighting its limited applicability under elevated phosphogypsum levels. Similarly, the Horton model exhibited decreased fitting accuracy at 0.3% and 0.6%, with MAE and RRMSE reaching 0.815 and 0.426, respectively, though CRM remained close to zero and CE values (0.992–0.997) indicated reasonable stability. Overall, the Lewis model outperformed the Philip and Horton models across all application rates, providing the highest predictive accuracy and stability, as evidenced by its consistent MAE, RRMSE and CE values. This made it the most suitable model for predicting cumulative infiltration under varying phosphogypsum treatments.

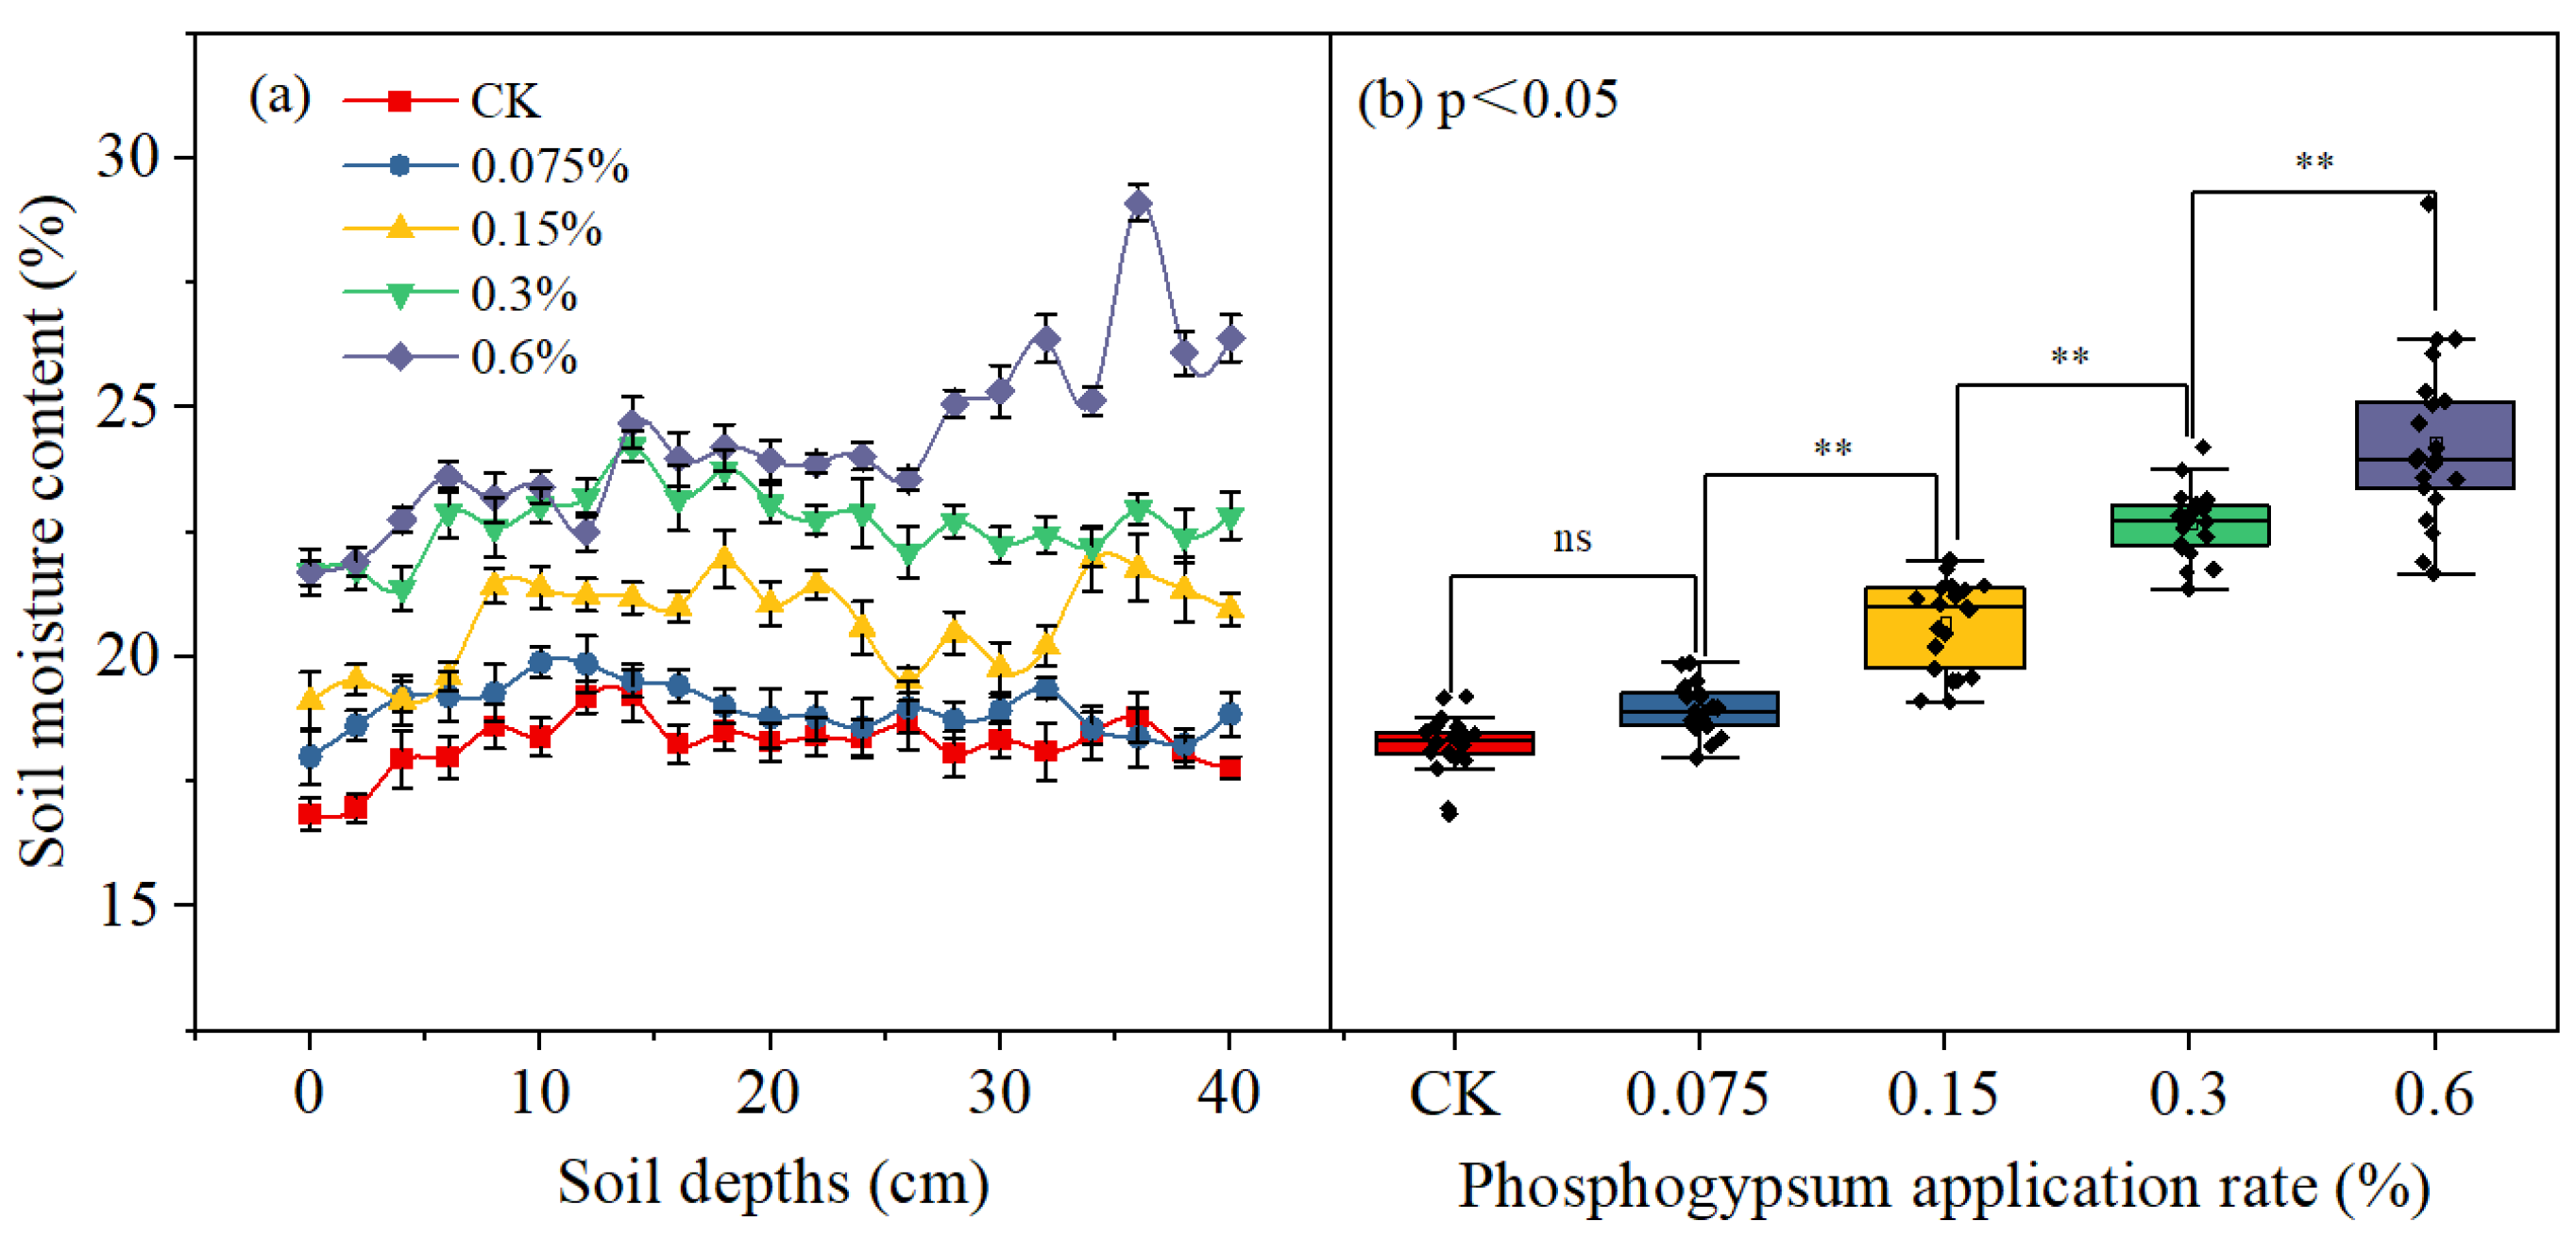
3.4. Water Retention Capacity and Soil Salt Content
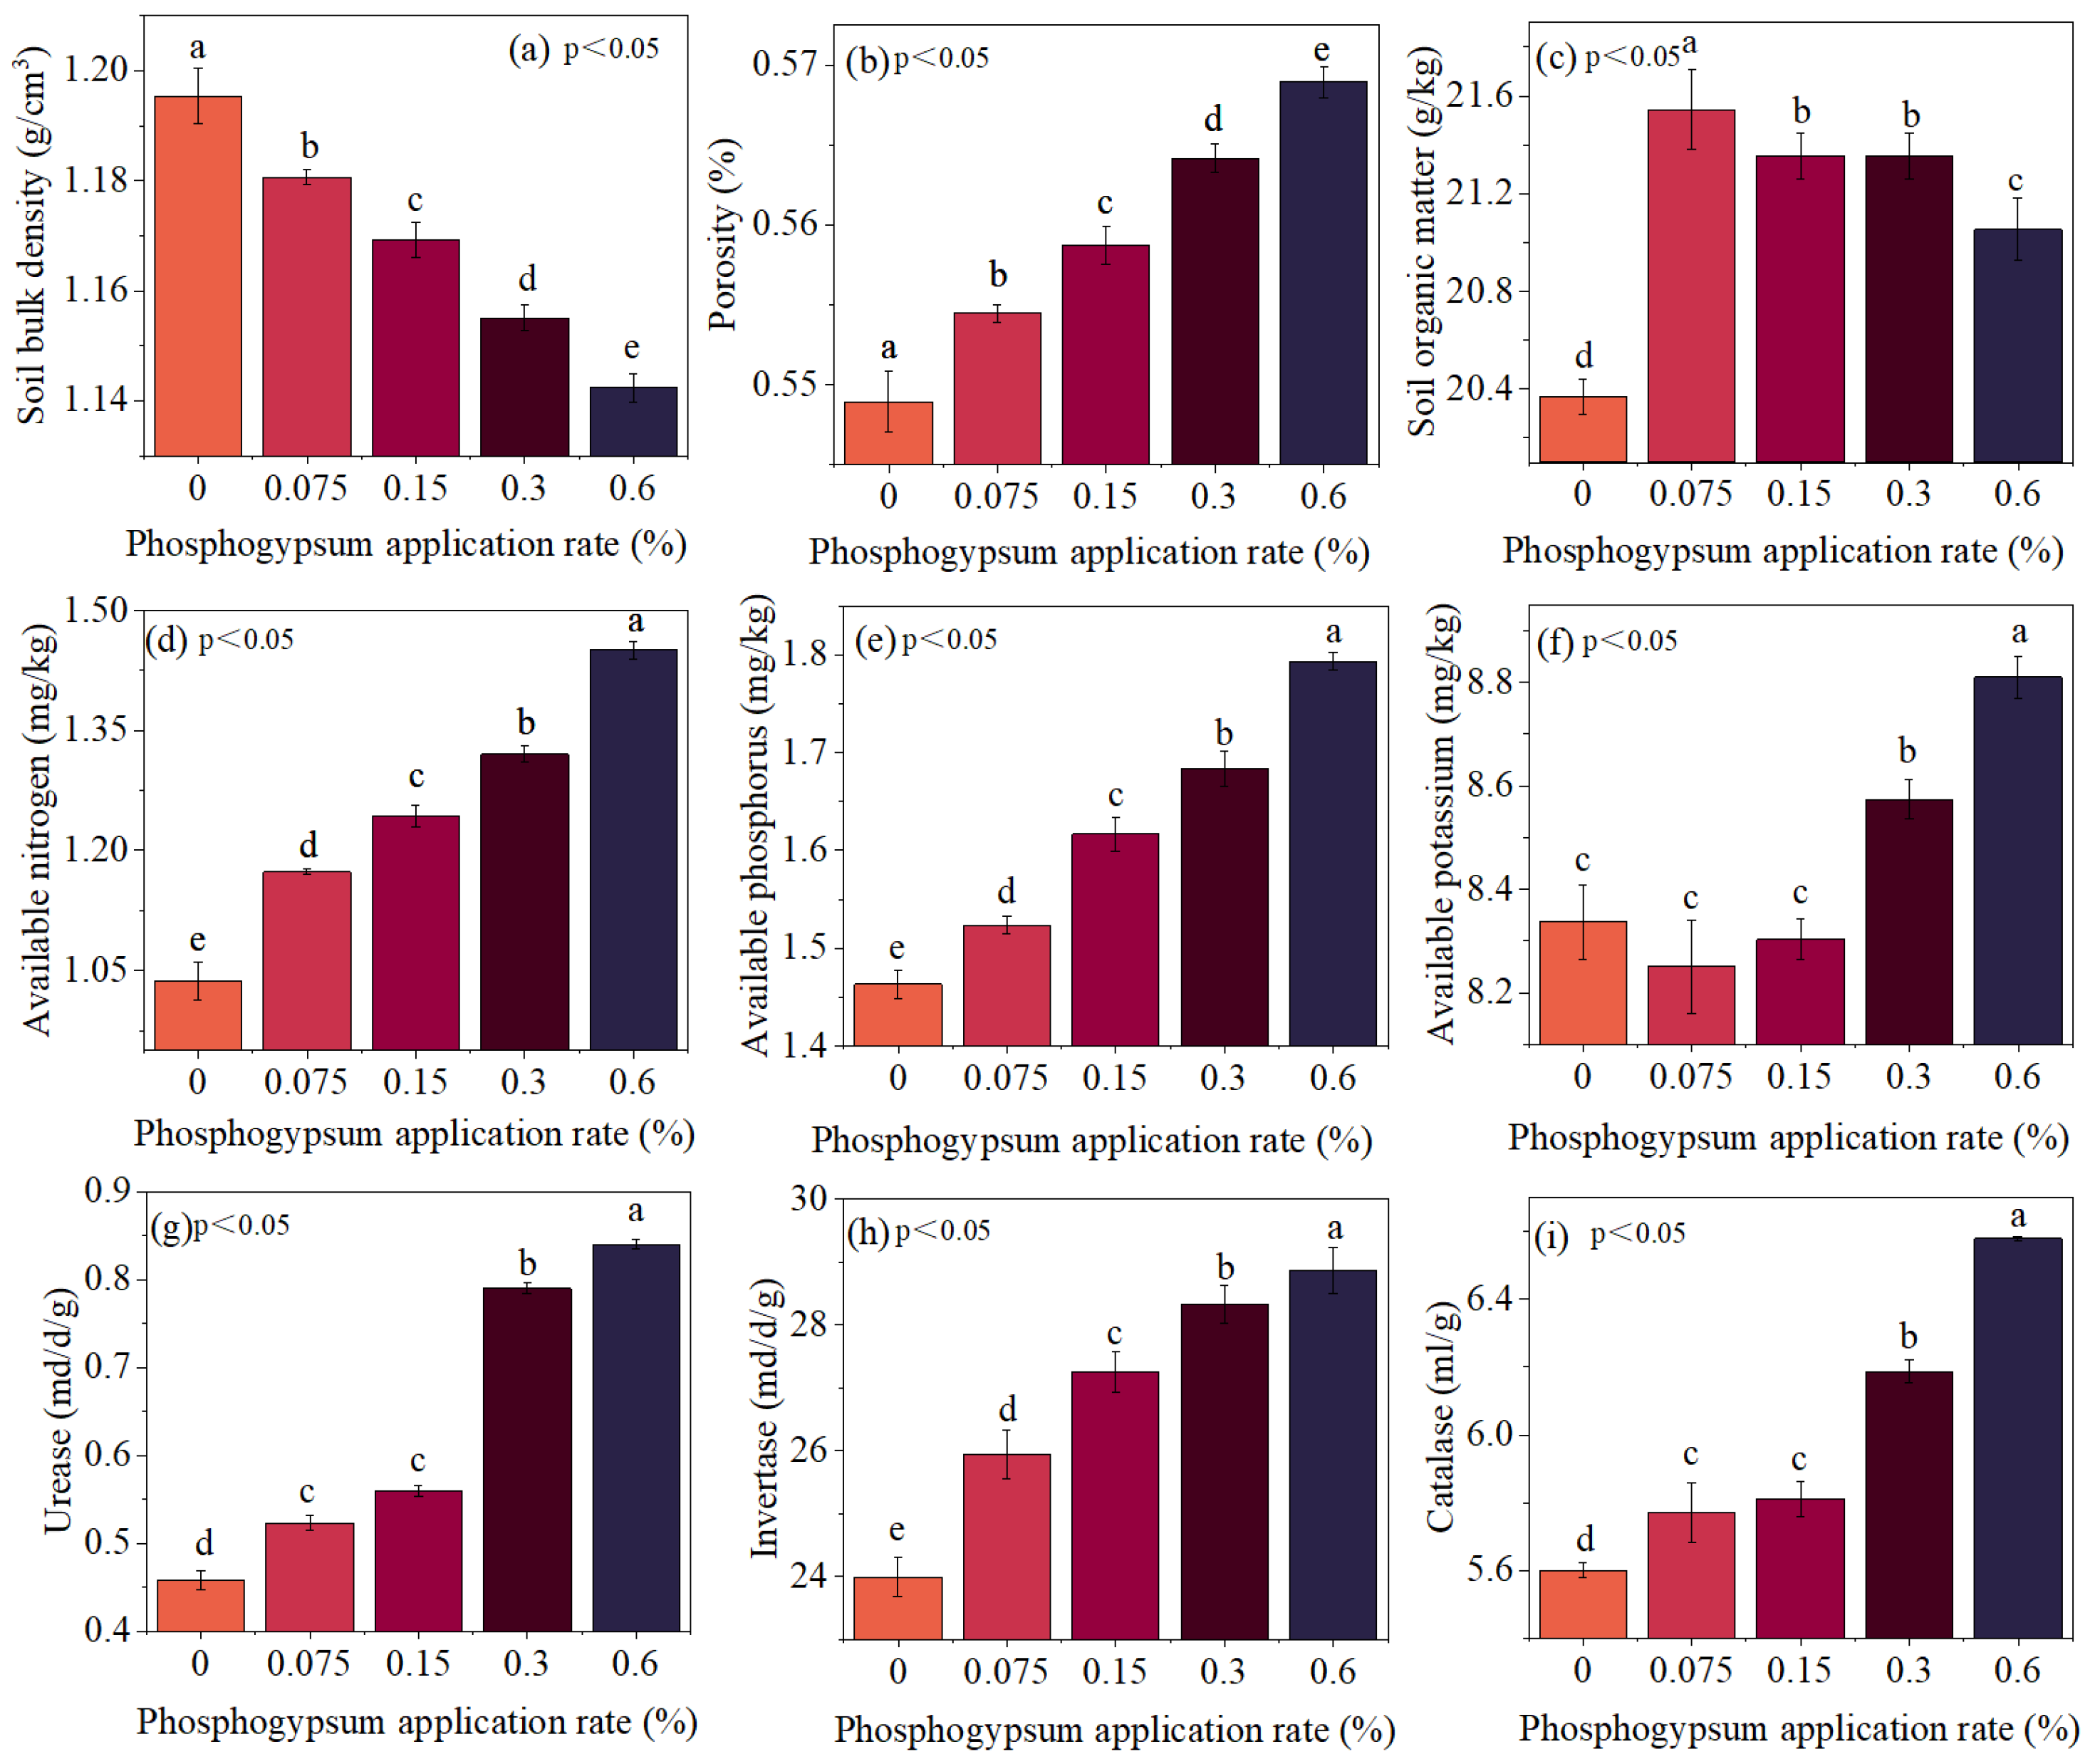
Under different phosphogypsum application rates, soil moisture content exhibited distinct patterns (Figure 4a). In the surface layer (0–6 cm), although soil moisture was generally lower due to evaporation, it increased with higher phosphogypsum application rates. In the 0–6 cm layer, it rose from 18.00% (0.075%) to 22.68% (0.6%), all exceeding CK. Similarly, in the 6–40 cm layer, soil moisture content ranged from 16.84% to 19.23% in CK, increased to 18.00–19.89% (0.075%) and peaked at 21.69–29.12% under 0.6%. Notably, the coefficients of variation for soil moisture content in the 0–40 cm layer were 3.09%, 2.55%, 4.37%, 2.87% and 6.91% for CK, 0.075%, 0.15%, 0.3% and 0.6%, respectively, indicating relatively low variability. This suggested that the effect of phosphogypsum addition on soil moisture content was consistent across different depths.
Higher phosphogypsum application rates significantly increased average soil moisture content, demonstrating enhanced water retention capacity (p < 0.05) (Figure 4b). The average soil moisture content under CK, 0.075%, 0.15%, 0.3% and 0.6% was 18.25%, 18.97%, 20.70%, 22.69% and 24.33%, respectively. Significant differences were observed among treatments, except between CK and 0.075%. Further analysis revealed a significant difference in moisture increment with each 1% increase in the phosphogypsum application rate. Specifically, 1% phosphogypsum addition resulted in average moisture content increases of 9.54%, 11.56%, 6.63% and 1.90% under 0.075%, 0.15%, 0.3% and 0.6% application rates, respectively. The incremental moisture benefit per unit of phosphogypsum diminished at higher rates, likely due to the soil nearing saturation and the moisture retention effect plateauing. In conclusion, the higher the phosphogypsum application rate, the greater the soil moisture content, but the lower the per unit efficiency, requiring a balance between effectiveness and efficiency.
Soil electrical conductivity is an indicator of soil salinity. Phosphogypsum significantly increased electrical conductivity across all soil layers, with greater application rates resulting in higher electrical conductivity (p < 0.05) (Figure 5). The average electrical conductivity in the CK was 274.0 μS/cm, while increasing phosphogypsum rates led to average values of 282.2, 418.8, 547.0 and 962.1 μS/cm for the 0.075%, 0.15%, 0.3% and 0.6%, respectively. Significant differences were observed between treatments, except CK and 0.075%. Notably, electrical conductivity in 0.6% was over three times higher than that in CK. Moreover, the variation in electrical conductivity with depth exhibited distinct patterns across treatments. In CK, electrical conductivity ranged from 183.5 to 454.0 μS/cm in the 0–40 cm soil layer, with relatively low values and a stable pattern with depth. The 0.075% treatment exhibited a similar trend. In contrast, in the 0.15% treatment, electrical conductivity increased from 196.7 μS/cm at the surface to 669.0 μS/cm at deeper layers, with a difference of 491.4 μS/cm, indicating more pronounced salt accumulation in deeper layers as application rates increased (Figure 5a). This deep salt accumulation effect was particularly prominent in the high application treatment. In the 0.6% treatment, electrical conductivity surged from 736.0 μS/cm at the surface to 1334.0 μs/cm at deeper layers, with a difference of 598.0 μS/cm. Although phosphogypsum significantly increased soil electrical conductivity, salts were leached downward under irrigation, concentrating in deeper layers. This process effectively reduced salt accumulation in the root zone, mitigating potential salt stress on crop roots.

3.5. Soil Quality

Phosphogypsum application significantly enhanced soil physical and available nutrients, as well as enzyme activity (p < 0.05) (Figure 6). As application rates increased, bulk density significantly decreased while porosity increased. The highest bulk density (1.20 g/cm3) and lowest porosity (54.0%) were observed in CK. At 0.075%, bulk density dropped to 1.18 g/cm3 and porosity increased to 54.5%. Further application at 0.15%, 0.3% and 0.6% significantly reduced bulk density to 1.16, 1.14 and 1.12 g/cm3 (p < 0.05), while porosity noticeably increased to 55.0%, 55.5% and 56.0% (p < 0.05), respectively, indicating more pronounced improvements with higher rates. Phosphogypsum also significantly enhanced SOM, with values peaking at 21.54 g/kg under 0.075%, then slightly declining to 21.05 g/kg at 0.6%, though still significantly higher than CK (p < 0.05). AN rose from 1.04 mg/kg in CK to 1.45 mg/kg at 0.6%, while AP and AK similarly increased, particularly at higher rates, demonstrating significant potential for enhancing soil fertility and improving soil quality. Enzyme activities, including urease, invertase and catalase, significantly improved with increasing phosphogypsum rates (p < 0.05). Urease activity, measured as the milligrams of urea decomposed per day per gram of soil (md/d/g), increased from 0.46 md/d/g in CK to 0.84 md/d/g at 0.6%, with increments of 13.04%, 21.74%, 71.74% and 82.61% at 0.075%, 0.15%, 0.3% and 0.6%, respectively. Similar trends were observed for invertase and catalase, particularly at 0.6%. These findings indicated that phosphogypsum could significantly optimize soil structure, enhance nutrient availability and boost enzyme activity, creating a synergistic improvement in soil quality. This provided a superior soil environment for crop growth and offered a scientific basis for the rational application of the phosphogypsum application rate [25].
The correlation analysis revealed significant relationships among soil bulk density, porosity, SOM, available nutrients (AN, AP and AK) and soil enzyme activities (urease, invertase and catalase) (p < 0.05) (Figure 7). Soil bulk density showed a significant negative correlation with porosity, nutrient content and enzyme activities, indicating that reducing soil compaction can enhance porosity, nutrient levels and microbial activity, thereby benefiting soil quality. Porosity was positively correlated with nutrient content and enzyme activities, suggesting that higher porosity promotes nutrient cycling and biological processes. Although SOM had a lower correlation with invertase activity, the strong correlations among available nutrients and their positive correlation with enzyme activities indicated that rich nutrient soils support higher biological activity [54]. The strong correlations among urease, invertase and catalase suggest that these enzyme systems may have synergistic roles, aiding in nutrient transformation and utilization [55]. Overall, these findings indicated a close relationship between soil structure, nutrient content and microbial activity.
Cluster analysis further revealed functional groupings among different soil properties and enzyme activities. Soil bulk density and porosity formed a group with a significant opposing relationship, indicating that lower soil compaction was closely associated with higher porosity, thus defining an independent soil structure group. Available nutrients and enzyme activities clustered together, forming another highly correlated functional group. AN, AP and AK formed a tight cluster and were strongly related to enzyme activities. This clustering relationship suggested that nutrient-rich soils enhanced enzyme activity, promoting nutrient decomposition and cycling. Correlation analysis also further supported this, with AN showing correlations of R2 = 0.93 and R2 = 0.94 with urease and invertase, respectively. Thus, this cluster was defined as the nutrient-biological activity group. Additionally, SOM showed some association with nutrients and enzyme activities in the cluster analysis but was relatively apart, forming a secondary subgroup. The moderate positive correlation between SOM and invertase suggested that SOM might promote soil enzyme activity to some extent, though its influence was relatively weak. This was likely because SOM primarily functioned by providing a carbon source for microorganisms through slow decomposition, indirectly impacting soil biological functions. Overall, the cluster analysis results aligned with those from the correlation analysis, revealing functional groupings of the soil structure group and the nutrient-biological activity group.

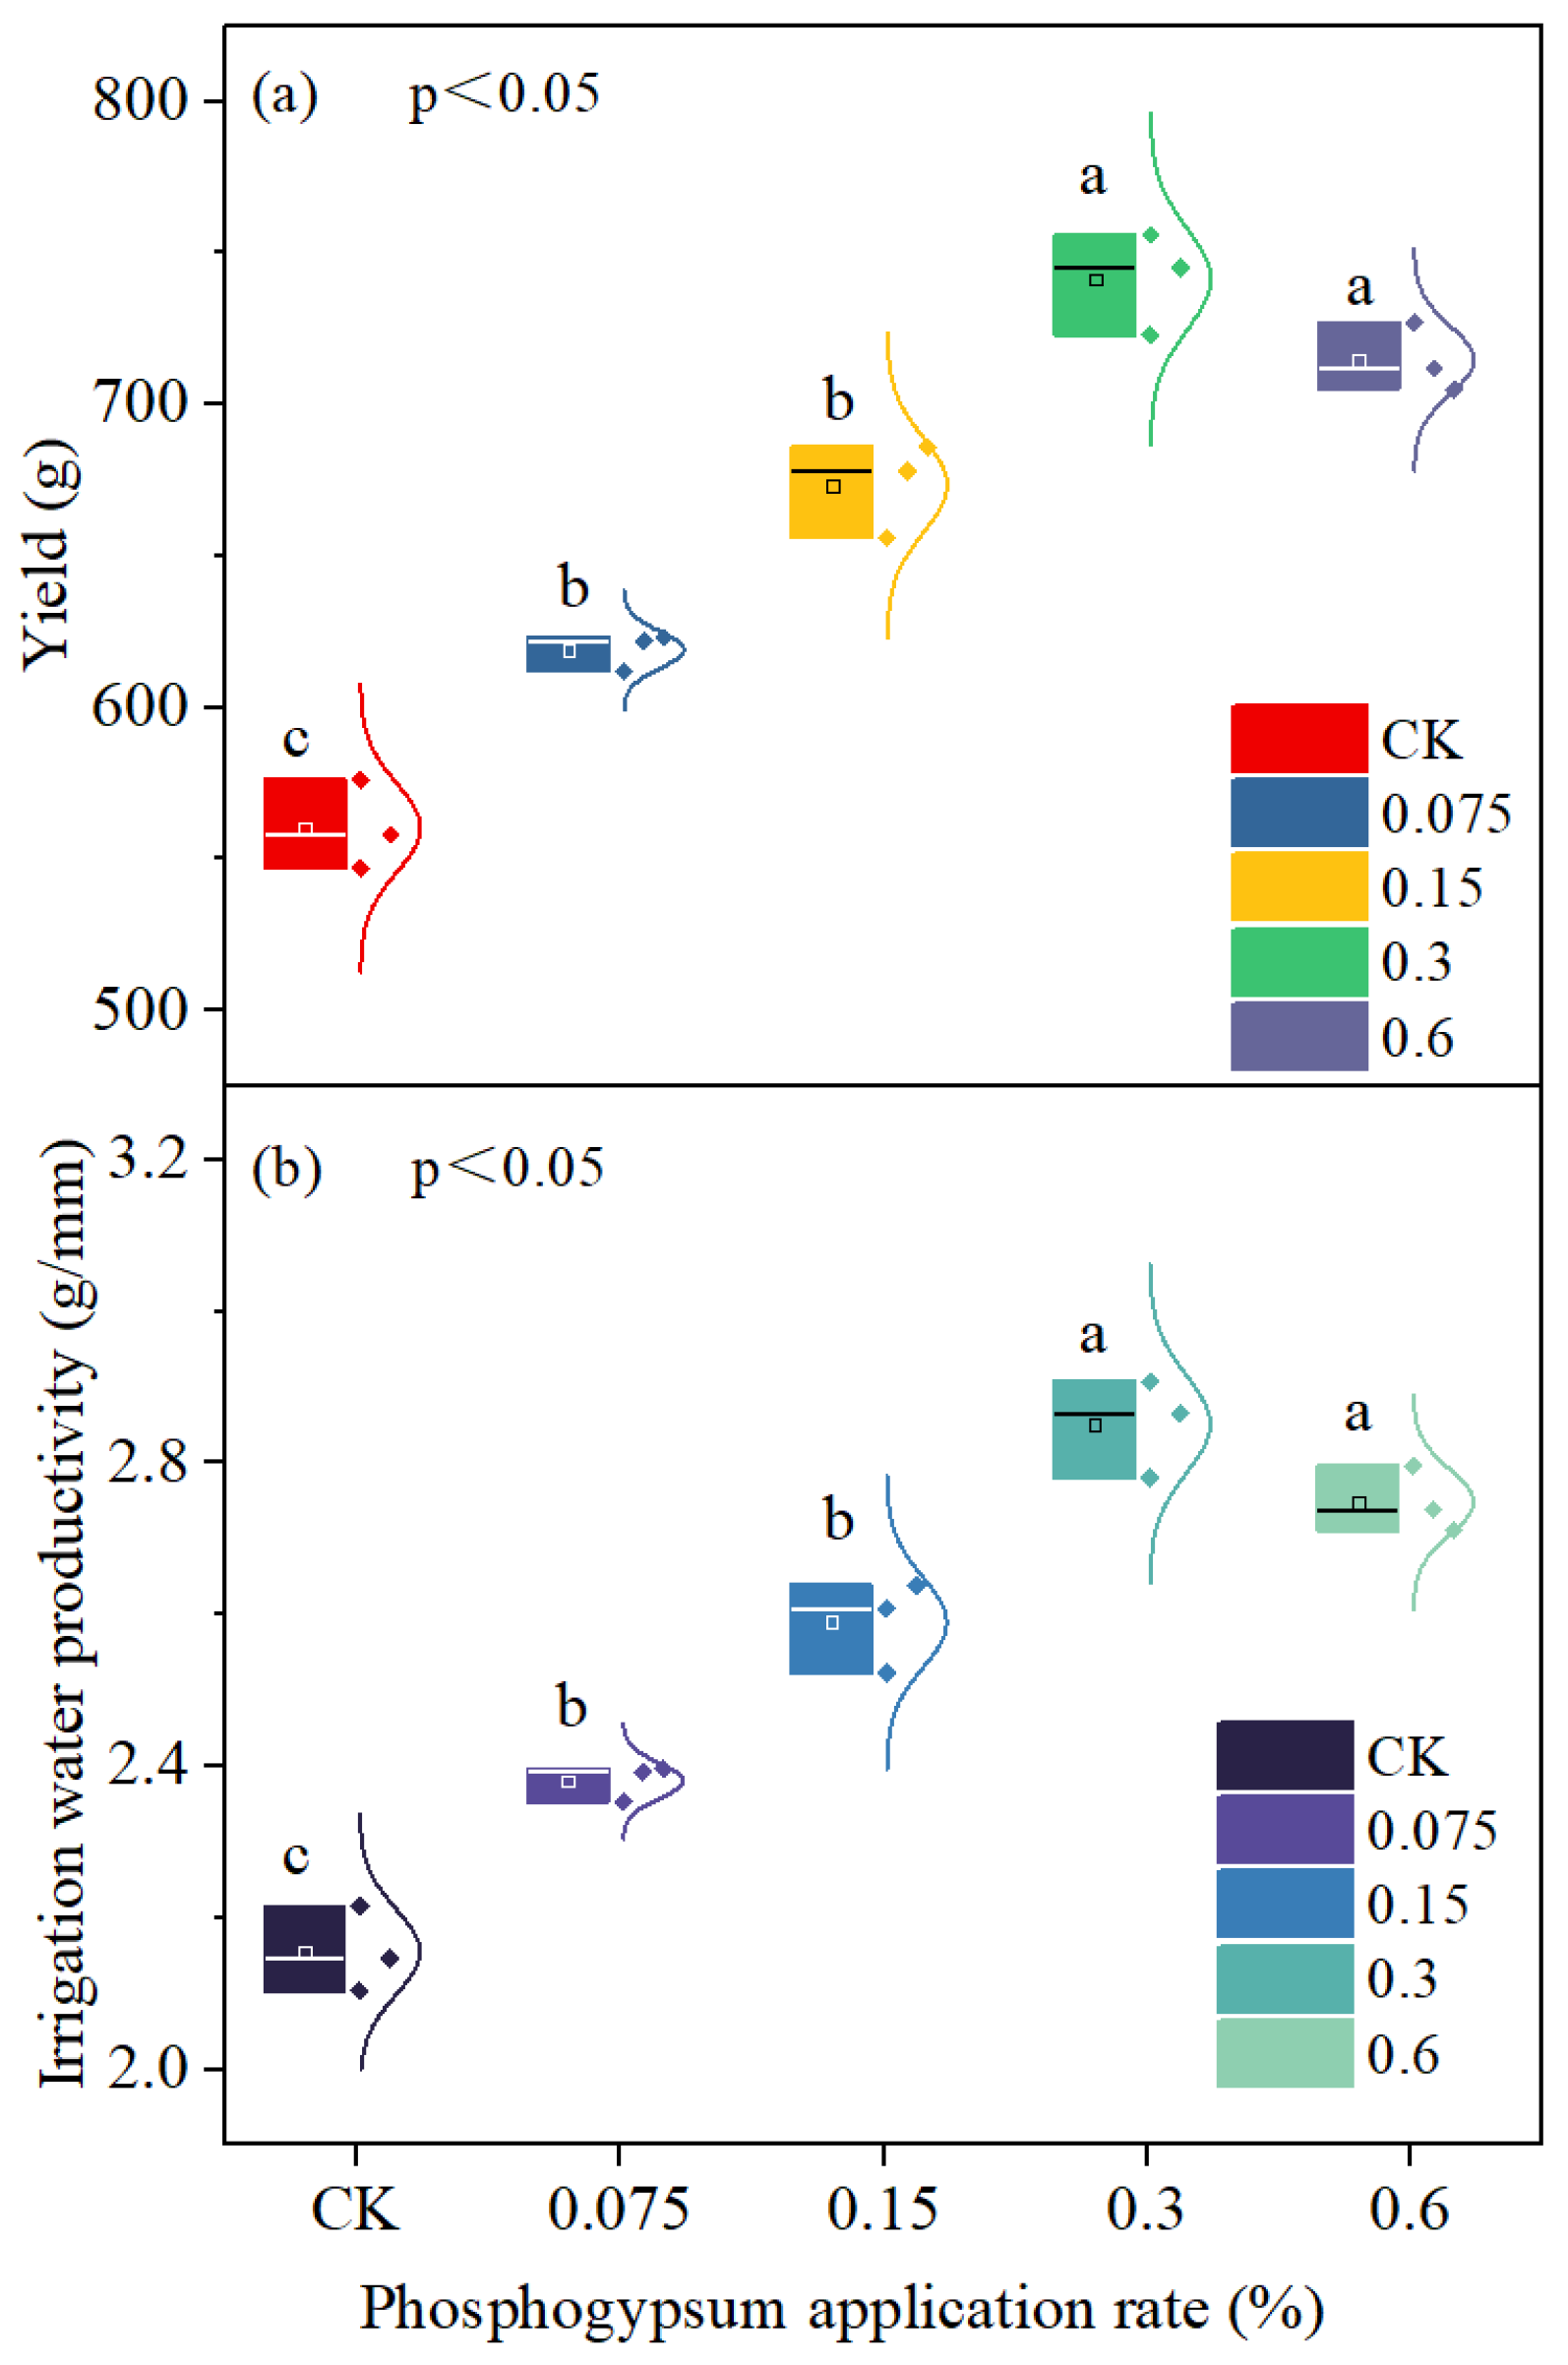
3.6. Yield and Irrigation Water Productivity

Phosphogypsum significantly influenced crop yield and IWP (p < 0.05) (Figure 8). CK recorded the lowest yield at approximately 600 g, significantly lower than all phosphogypsum treatments. Application rates of 0.075% and 0.15% increased yields to 650 g and 680 g, respectively, reflecting gains of 10.47% and 20.16% over CK, demonstrating that even low phosphogypsum rates significantly boosted yield. Higher application rates of 0.3% and 0.6% further increased yields to 750 g and 740 g, respectively, significantly outperforming the 0.075% and 0.15% treatments. It was evident that higher phosphogypsum application rates resulted in better yield performance. However, excessive phosphogypsum led to a decline in yield. IWP followed a similar trend. Phosphogypsum application at 0.075% and 0.15% increased IWP to 2.38 and 2.59 g/mm, respectively. At 0.3% and 0.6%, IWP further increased to 2.85 and 2.75 g/mm, representing gains of 32.39% and 27.54% compared to CK. Overall, phosphogypsum application significantly enhanced both crop yield and IWP, with optimal performance observed at application rates at 0.3%.

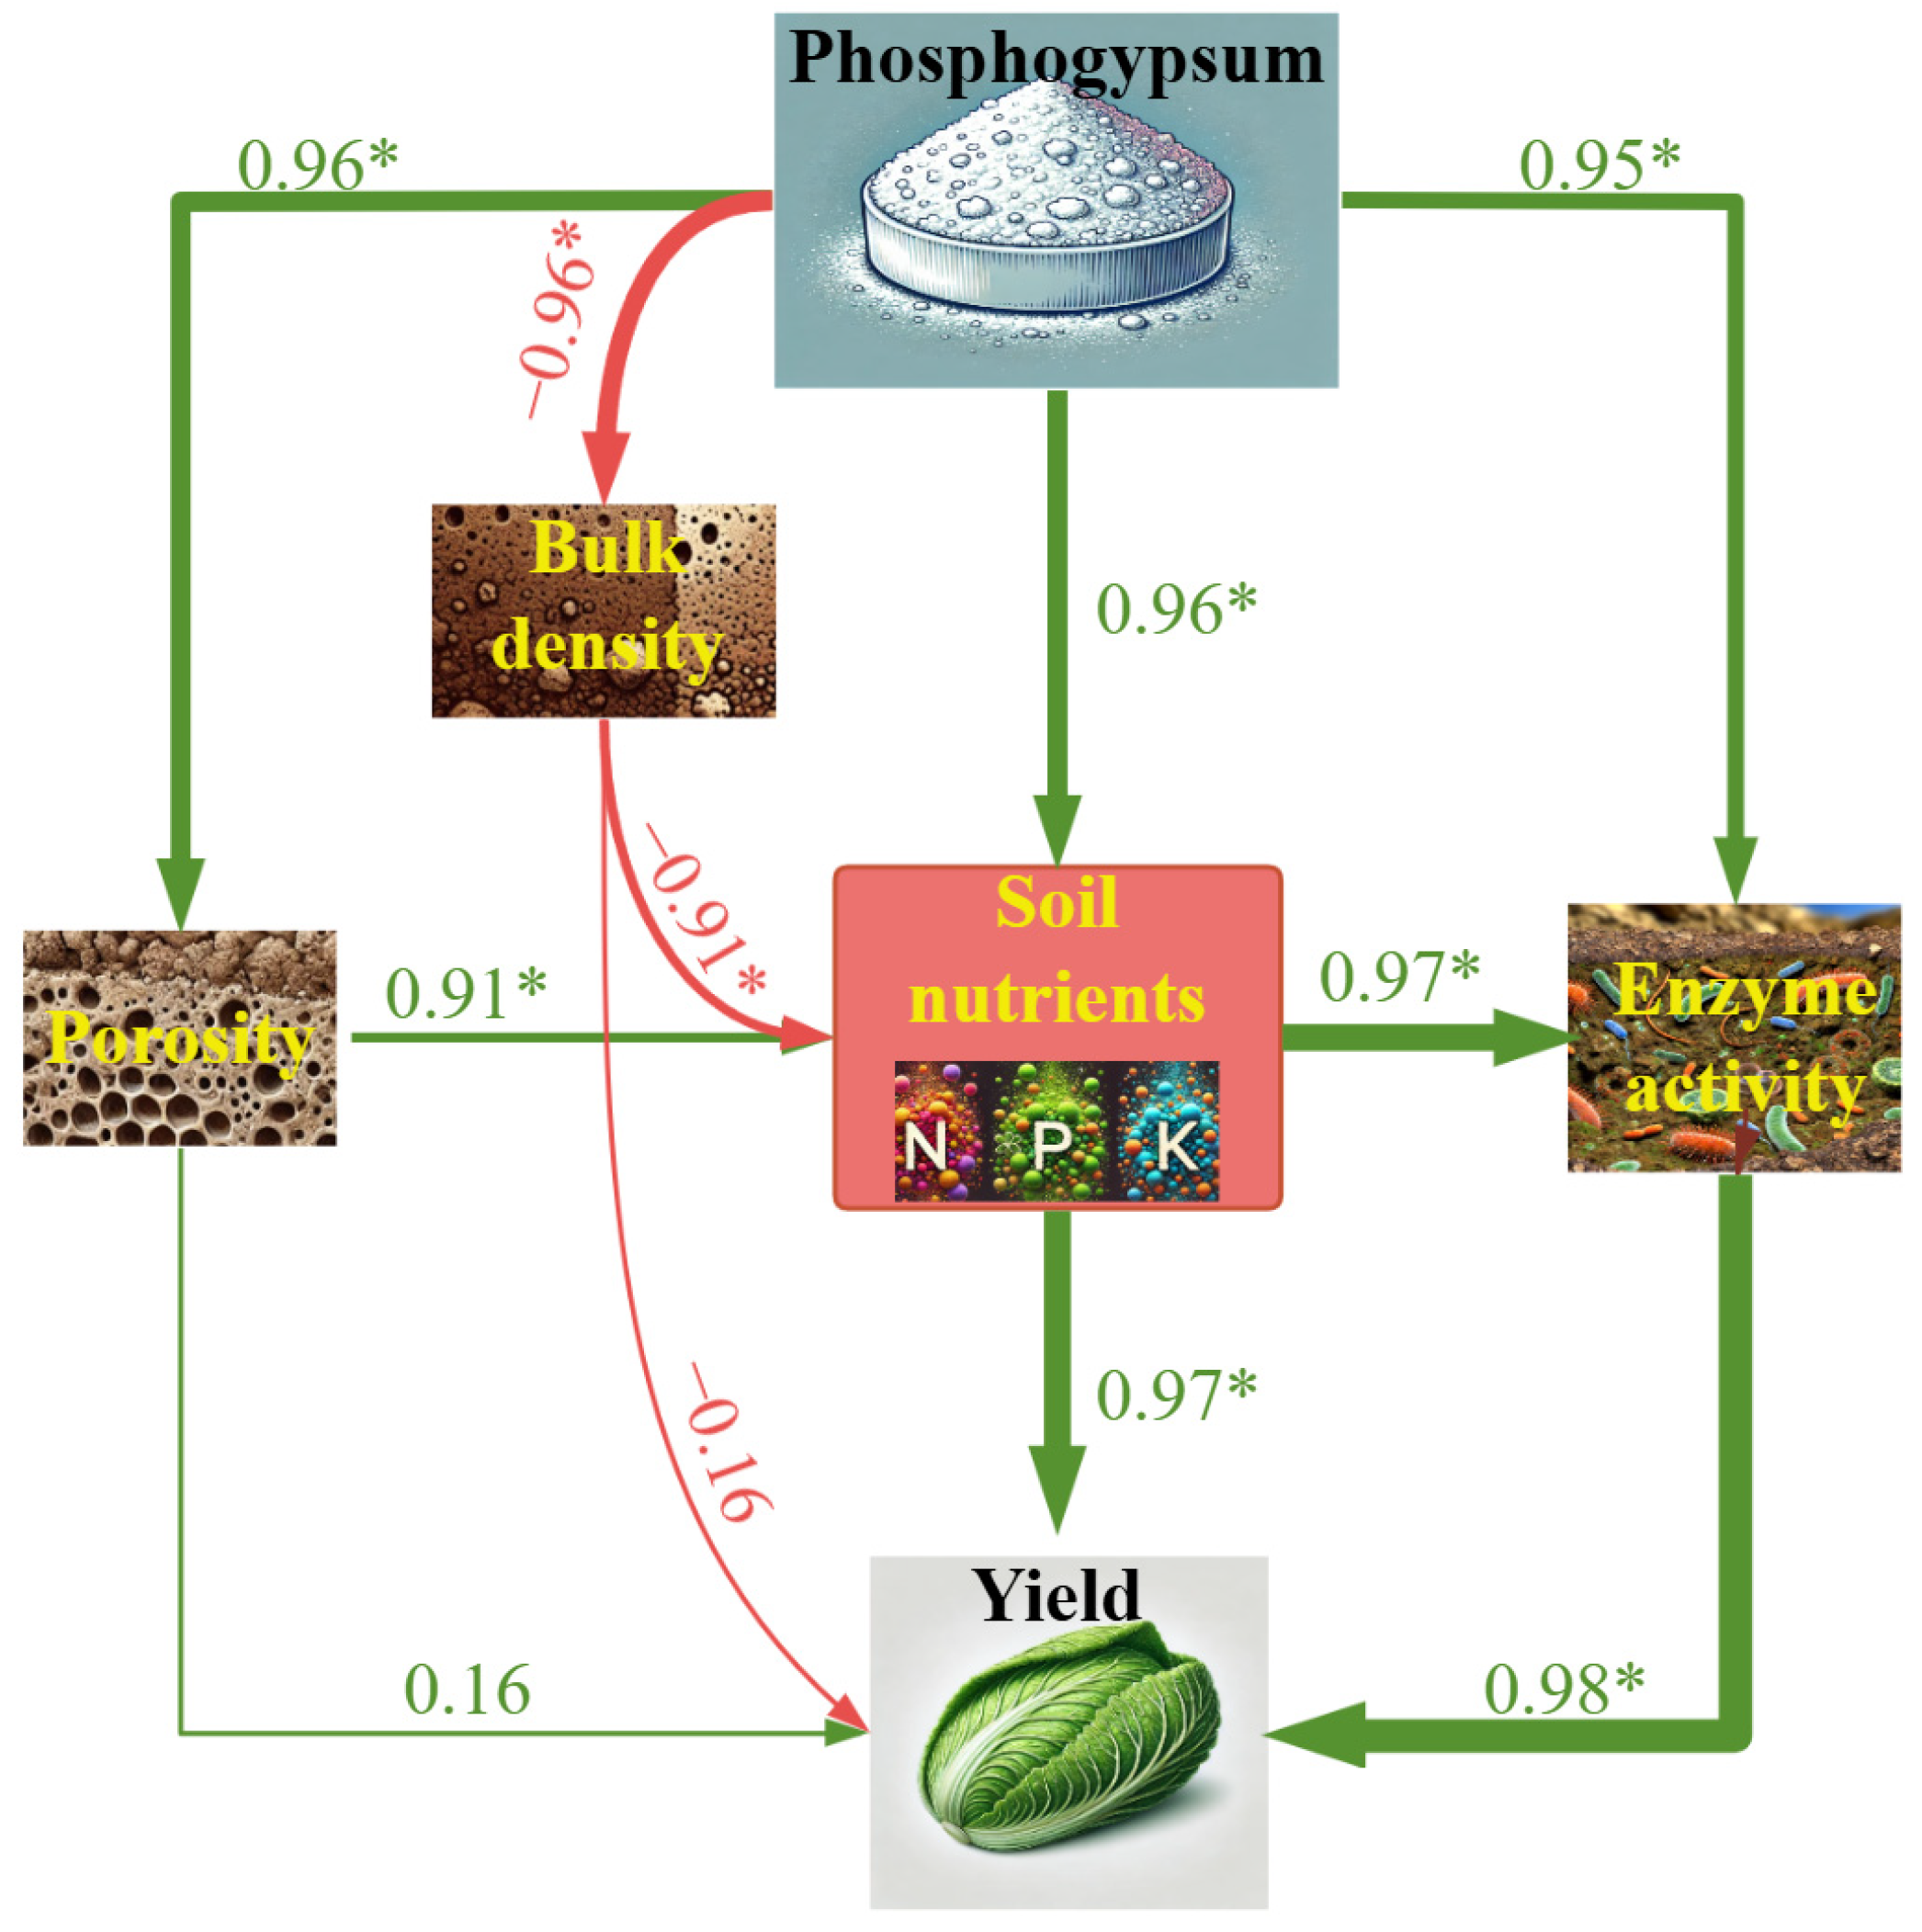
3.7. Partial Least Squares Path Model

PLS path analysis revealed the impact pathways of phosphogypsum application on yield (Figure 9). Phosphogypsum significantly impacted soil nutrients and enzyme activity, with path coefficients of 0.96 and 0.95, respectively (p < 0.05). These results indicate that phosphogypsum not only directly improved soil nutrients but also enhanced soil functionality by promoting microbial enzyme activity. Both soil nutrients and enzyme activity had direct and significant positive effects on yield, with path coefficients of 0.96 and 0.98, respectively (p < 0.05). In terms of soil physical properties, although porosity and bulk density did not have a significant direct impact on yield, they significantly influenced soil nutrients with path coefficients of 0.91 and 0.91, respectively (p < 0.05). By improving nutrient retention and supply capacity, porosity and bulk density indirectly influenced yield. Furthermore, soil nutrients promoted enzyme activity (path coefficient of 0.97, p < 0.05), and this indirect relationship also played a critical role in yield improvement by enhancing soil biological activity. Overall, the PLS analysis clearly illustrated the impact pathways of phosphogypsum on crop yield, including the following: (1) phosphogypsum → soil physical properties → soil nutrients → enzyme activity → yield; (2) phosphogypsum → soil nutrients → enzyme activity → yield; and (3) phosphogypsum → enzyme activity → yield. These findings highlight that phosphogypsum application enhanced crop yield through integrated improvements in soil physical properties, soil nutrients and biological activity.

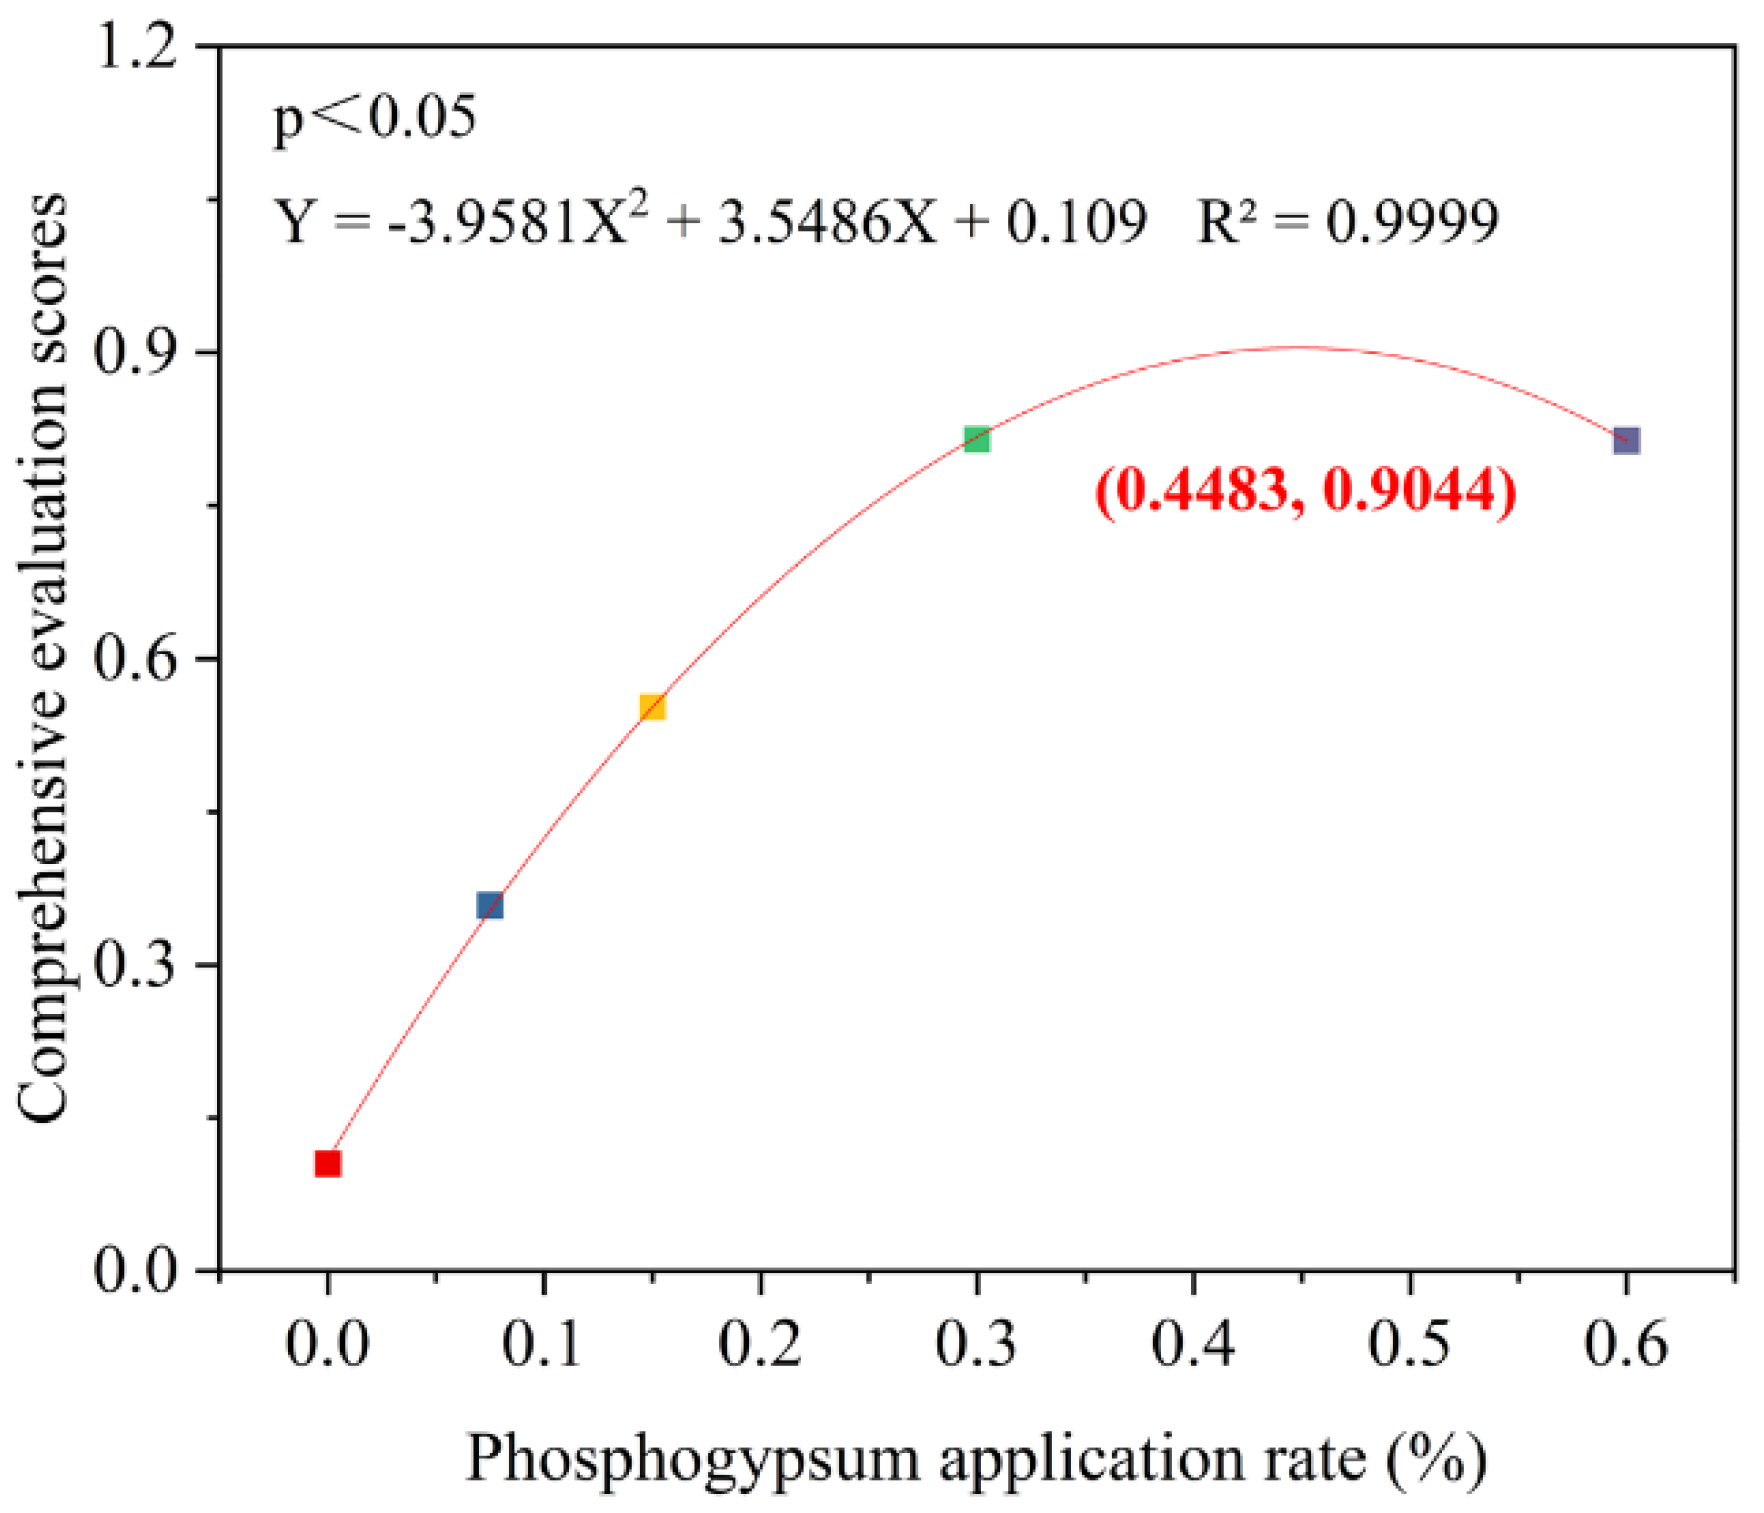
3.8. Optimal Phosphogypsum Application Rate Based on Comprehensive Evaluations

Phosphogypsum application significantly influenced overall benefits (p < 0.05) (Figure 10). At 0.075% and 0.15%, comprehensive evaluation scores were 0.358 and 0.553, respectively, significantly higher than CK. At 0.3% and 0.6%, comprehensive evaluation scores reached 0.815 and 0.814, reflecting better performance in enhancing overall benefits. Regression analysis revealed a significant quadratic relationship between phosphogypsum application rates and the comprehensive evaluation scores, peaking at 0.45% with a maximum score of 0.904. This optimal rate provided the best integrated benefits for soil quality, crop yield and IWP.

4. Discussion

4.1. Effects of Phosphogypsum on Soil Water Infiltration, Water Retention Capacity and Soil Salt Content

The dynamic migration of the wetting front is crucial for understanding soil water movement, optimizing irrigation and enhancing WUE. This process is influenced by soil matric potential, gravity and structure, which can be significantly modulated by soil amendments [34,56,57]. He et al. [58] found a positive correlation between the water retaining agent application rate and both infiltration duration and cumulative infiltration, which increased from 161 min to 750 min and 22.6 cm to 31.1 cm, respectively, as the application rate rose from 0% to 0.60%. Phosphogypsum, as a potential soil amendment, influenced soil water infiltration and distribution by altering pore structure and water potential gradients [59]. In this study, the migration depth of the wetting front increased with infiltration time across all treatments, but the infiltration rate gradually slowed. Additionally, higher application rates resulted in slower wetting front advancement. This phenomenon was not pronounced during the initial infiltration stage, as the high water potential gradient caused by surface dryness dominated water movement, while the effects of phosphogypsum on pore structure and binding were not yet evident [60]. As infiltration progressed, differences among treatments became evident, with high application rates markedly extending infiltration time. For instance, at a depth of 40 cm, the 0.6% required 158 min, considerably longer than 102 min for the CK. This aligns with the findings of Kong et al. [60] on attapulgite, where high application rates notably slowed wetting front advancement and effectively suppressed its rapid progression.
Phosphogypsum also significantly influenced cumulative infiltration and the average infiltration rate. High application rates initially resulted in lower cumulative infiltration, but later surpassed lower rates (Figure 3). This was attributed to increased microporosity at higher phosphogypsum levels, which enhanced soil water retention and cumulative infiltration [9]. Similarly, Wang et al. [61] found that high biochar application delayed water infiltration by improving soil water storage efficiency. In contrast, low application rates had higher initial cumulative infiltration but significantly lower final values due to shorter infiltration periods, indicating limited water retention capacity. Additionally, notable differences in average infiltration rate were observed across treatments. During the early infiltration stage, higher application rates showed slower infiltration rates. However, by the end, infiltration rates ranked as 0.3% > CK > 0.6% > 0.15% > 0.075%. The 0.3% application rate achieved a balance between cumulative infiltration and the infiltration rate, enhancing cumulative infiltration while preventing excessively low infiltration rates.
The water retention properties of phosphogypsum simultaneously increased soil moisture content after infiltration (Figure 4). Soil moisture significantly increased with higher phosphogypsum application rates across all soil layers. In the surface soil (0–6 cm), moisture content was generally low due to high evaporation rates [60]. However, even under such evaporative conditions, moisture levels in the surface soil improved markedly with increasing phosphogypsum application. This could be attributed to the introduction of divalent cations (Ca2⁺), which replaced monovalent cations (Na⁺, K⁺), promoting soil aggregation and micropore formation, retaining water molecules and reducing evaporation [60]. In deeper layers (6–40 cm), the effect was more pronounced, with phosphogypsum-treated soils consistently showing higher moisture than CK. The coefficient of variation for moisture content across the 0–40 cm soil profile was relatively small, indicating that phosphogypsum uniformly improved moisture content throughout the soil profile. This finding further validated the effectiveness of phosphogypsum as an amendment for optimizing soil water distribution. However, the improvement in soil moisture did not increase linearly with application rates. Lower application rates provided greater moisture gains. As the application rate increased to 0.3% and 0.6%, the marginal increase in moisture per unit of phosphogypsum diminished. This trend likely reflects a saturation effect, where the soil’s water retention capacity approached its maximum, reducing the incremental benefits of additional phosphogypsum [62]. These findings highlight the need to optimize phosphogypsum application rates to maximize efficiency and cost effectiveness.
Another noteworthy point is that phosphogypsum application increased soil electrical conductivity. This was primarily due to the enhanced soil water retention capacity, retaining more dissolved salts and nutrients, thereby raising electrical conductivity [63]. The positive correlation between soil moisture content and electrical conductivity further confirmed this (Figure 11). Additionally, the soluble ions in phosphogypsum might have contributed to the increase in electrical conductivity. Fortunately, due to water movement, electrical conductivity increased with soil depth, and proper water management could effectively leach out salt caused by phosphogypsum application.

4.2. Effects of Phosphogypsum on Soil Quality, Crop Yield and Irrigation Water Productivity

Improving soil quality is essential for sustainable agriculture [64,65,66]. Phosphogypsum significantly enhanced soil physical, nutrients and biological properties, with effects intensifying at higher application rates. In terms of soil physical properties, phosphogypsum markedly reduced bulk density and increased porosity, primarily by promoting the formation and stabilization of soil aggregates, which enhanced microporosity [13]. Outbakat et al. [67] similarly reported that phosphogypsum positively influenced the hydraulic properties, total porosity and bulk density of saline–alkali soils. Regarding soil nutrients, phosphogypsum enhanced nutrient availability. At higher application rates, nutrient levels were significantly higher than those in lower application rates, attributed to ion exchange and nutrient release [25,29]. Activities of urease, invertase and catalase increased with application rates, peaking at 0.6%. This enhancement was attributed to improved soil structure, which facilitated the transport and distribution of water and gases, thereby creating favorable conditions for microbial activity and enzyme reactions [68]. Additionally, the high available nutrients under phosphogypsum treatment stimulated microbial metabolic potential, further enhancing enzyme activity [26]. In summary, phosphogypsum optimized soil physical and nutrients conditions, providing a conducive environment for microbial metabolism. This facilitated nutrient cycling, improving nutrient availability and supply capacity, thereby supporting sustainable soil management and crop productivity [69].
Correlation and cluster analyses were essential tools for revealing interrelationships among soil properties. In this study, correlation analysis demonstrated significant associations among bulk density, porosity, available nutrients and enzyme activity (Figure 7). Bulk density negatively correlated with porosity, nutrient contents and enzyme activities, indicating that reducing soil compaction significantly enhanced soil nutrients and biological functions. This aligned with Li et al. [26], who noted that improving soil structure increased nutrient availability and created more favorable conditions for soil microbes [70]. Additionally, porosity positively correlated with nutrient contents and enzyme activities. Soil with higher porosity offered better aeration and moisture conditions, which promoted nutrient availability and enzymatic reactions [71,72]. The strong correlation between AP, AK and enzyme activity further confirmed the nutrient–enzyme synergy, suggesting that phosphogypsum treatment simultaneously enhanced soil nutrient and biological functions. Cluster analysis revealed functional groupings among soil properties. Bulk density and porosity formed an independent structural group, highlighting their pivotal role in soil physical characteristics. Lower bulk density and higher porosity improved soil aeration and created a more conducive environment for microbial activity and nutrient cycling [73]. Meanwhile, available nutrients and enzyme activities clustered into a nutrient-biological activity group, indicating that higher nutrient levels significantly promoted enzyme activity, enhancing soil metabolic functions [29].
Enhancing yield and IWP was vital for achieving sustainable agricultural development [74]. This study demonstrated that phosphogypsum application significantly impacted both crop yield and IWP. Low to moderate application rates led to marked improvements, demonstrating that even minimal phosphogypsum usage could substantially boost crop productivity. Higher phosphogypsum application rates demonstrated superior performance in both yield and IWP. A slight decline was observed at the 0.6% rate compared to 0.3%, indicating reduced effectiveness at excessive levels. This decline might have resulted from nutrient imbalances or disruptions in microbial communities at excessive phosphogypsum levels, potentially inhibiting crop performance. Therefore, it was essential to carefully evaluate the overall benefits when applying phosphogypsum.

4.3. Effects of Phosphogypsum Management on Overall Benefits

Soil amendments were widely applied in agricultural systems due to the ability to improve soil quality, enhance IWP, mitigate the adverse effects of water scarcity [75]. Amendments performance heavily depended on the application rate. Laghari et al. [76] reported that 22 t/ha was the optimal biochar application rate for achieving high yields. While Fu et al. [77] recommended a higher rate of 60 t/ha based on soil water retention curves, field capacity, permanent wilting point and available water content. The variability in result was closely linked to the factors considered, highlighting the need for a comprehensive approach in soil amendment and field management strategies. Phosphogypsum could improve yield and IWP (Figure 8). However, the effects of phosphogypsum application on crop yield and IWP showed a clear trend of initially increasing benefits followed by a decline. Excessive application rates reduced overall efficiency (Figure 9). Similar diminishing returns have been observed with other amendments, such as biochar, where high application rates not only reduced effectiveness in ameliorating saline–alkali soils but also led to economic and resource inefficiencies and adverse impacts on soil quality and crop growth [78,79]. In this study, a comprehensive analysis using the TOPSIS method, which evaluated multiple key indicators such as nutrient availability, soil enzyme activity, crop yield and IWP, showed that the overall performance score initially increased with rising phosphogypsum application rates before declining. This decline was attributed to reductions in SOM, yield and IWP at higher application rates. Fitting analysis indicated that the optimal application rate was 0.45%, at which point the integrated optimization of yield, IWP and soil quality was achieved.

4.4. Limitations

Phosphogypsum primarily consisted of CaSO4, widely recognized as a key amendment for saline–alkali soils. CaSO4 facilitated ion exchange by displacing adsorbed sodium ions, which were subsequently leached out with irrigation water, thereby reducing sodium toxicity to crop roots. Notably, sodium ions posed greater toxicity to crops, whereas calcium ions supported root development and cell wall stability, enhancing salt tolerance [80]. However, although phosphogypsum elevated electrical conductivity, further studies were needed to validate its efficacy under different soil salt conditions. Such studies would provide scientific evidence to support phosphogypsum’s broader agricultural application.
While this study highlighted the benefits of phosphogypsum in improving soil quality, its improper application could pose significant risks due to the presence of natural radioisotopes and heavy metals. These contaminants could leach into soil and water, leading to severe environmental consequences, such as groundwater contamination and long-term soil degradation. Additionally, exposure to these toxic substances could pose serious health risks to humans and animals, including heavy metal poisoning and radiation-related illnesses. Without proper treatment and management, the use of untreated phosphogypsum has the potential to cause irreversible damage to ecosystems and agricultural productivity. To mitigate these risks, phosphogypsum underwent harmless treatment before use to ensure safety. Moreover, the mobility and release of heavy metals, influenced by factors like soil pH, moisture and microbial activity, can vary over time, making it critical to understand their behavior in soil. Phosphogypsum’s potential to release heavy metals, particularly under acidic conditions or with excessive rainfall, underscores the need for further research into its long-term impact on soil and crops. Though treated phosphogypsum is safer, more studies are needed to optimize its use under different environmental conditions. In summary, while phosphogypsum showed great potential for sustainable agriculture, its safe use required rigorous decontamination, careful management and a comprehensive understanding of the migration and release characteristics of heavy metals in the soil to balance its benefits with the severe risks it could pose if misused.

5. Conclusions

Phosphogypsum is a promising soil amendment for sustainable agriculture. This study investigated the effects of different phosphogypsum application rates on soil properties, crop yield and IWP. Phosphogypsum significantly reduced wetting front transport and infiltration rate while enhancing cumulative infiltration and water retention capacity. Although phosphogypsum increased soil salinity, the excess salts were leached to deeper soil layers with water movement. More importantly, phosphogypsum significantly improved soil bulk density, porosity, available nutrients and enzyme activities, which showed strong correlations. These improvements promoted yield and IWP through direct and indirect pathways. Considering soil quality, yield and IWP, the overall benefits of phosphogypsum increased with application rate, peaking at the recommended rate of 0.45%, before gradually declining. It is worth noting that phosphogypsum must undergo harmless treatment prior to use to avoid potential environmental and health risks associated with radiation and heavy metals. Overall, these findings highlight phosphogypsum’s potential as a useful resource for improving water efficiency and supporting sustainable agricultural practices.

Author Contributions

A.L. and J.L. (Jun Li) conceived and designed the experiments. A.L. performed the experiments, analyzed and interpreted the data and results and wrote the original manuscript. Y.X. and Z.H. performed the experiments, and analyzed and interpreted the data and results. A.L. and J.L. (Jiaping Liang) provided materials, instrument facilities and monitored the experimental works. J.L. (Jun Li) revised the manuscript and included valuable inputs. All authors have read and agreed to the published version of the manuscript.

Funding

This research was funded by the Open Fund of National Engineering and Technology Research Center for Development & Utilization of Phosphate Resources (NECP2023-09).

Data Availability Statement

The data presented in this study are available on request from the corresponding author.

Conflicts of Interest

Authors Anrong Luo and Yanan Xiao were employed by the company Yunnan Phosphate Chemical Croup Co., Ltd. The remaining authors declare that the research was conducted in the absence of any commercial or financial relationships that could be construed as a potential conflict of interest.

Abbreviations

FAOFood and Agriculture OrganizationMAEMean absolute error
WUEWater use efficiencyRRMSERelative root mean square error
PAMPolyacrylamideCRMCoefficient of residual mass
CaSO4·2H2OCalcium sulfate dihydrateCECoefficient of efficiency
Ca2Calcium ionYiobs ith observed value
SO42Sulfate ionYisimith simulated value
Na⁺Sodium ionSOMSoil organic matter
NNitrogenANAvailable nitrogen
PPhosphorusAPAvailable phosphorus
SSulfurAKAvailable potassium
Ca3(PO4)2Calcium phosphateYCabbage yield
IWPIrrigation water productivityIATotal irrigation amount
SiO2Silicon dioxide CKNo phosphogypsum
P2O5Phosphorus pentoxideTOPSISTechnique for Order of Preference by Similarity to Ideal Solution
FFluorineahjjth indicator in the hth evaluation objects
Fe2O3Iron oxideoNumber of object
Al2O3Aluminum oxidemNumber of indicator
AInitial condition of the wetting front propagation rateVhjWeighted normalized value of the jth indicator for the ith evaluation object
BTime dependency of wetting front advancementWhWeight
ICumulative infiltrationA+Positive ideal solution values
tInfiltration timeANegative ideal solution values
KInitial soil water conductivityD+Distance to Positive Ideal Solution
αNon-linear relationship between cumulative infiltration and timeDDistance to Negative Ideal Solution
SSorptivitynTotal number of data points
aFinal infiltration rateCICloseness index
bInitial infiltration ratePLS-PMPartial least squares path modeling
cDecay constant WsWeight of the wet soil
DsWeight of the dry soilKClPotassium chloride
RnRadonAsArsenic
RaRadiumPbLead
ThThoriumHgMercury
UUraniumCdCadmium
CrChromiumNiNickel
HClHydrochloric Acid

References

  1. Falk, D.; Winowiecki, L.A.; Vågen, T.-G.; Lohbeck, M.; Ilstedt, U.; Muriuki, J.; Mwaniki, A.; Bargués Tobella, A. Drivers of field-saturated soil hydraulic conductivity: Implications for restoring degraded tropical landscapes. Sci. Total Environ. 2024, 907, 168038. [Google Scholar] [CrossRef]
  2. FAO. The State of the World’s Land and Water Resources for Food and Agriculture—Systems at Breaking Point. Main Report; FAO: Rome, Italy, 2022. [Google Scholar]
  3. Mwafulirwa, L.; Sizmur, T.; Daymond, A.; Atuah, L.; Quaye, A.K.; Coole, S.; Robinson, S.; Hammond, J.; Awudzi, G.; Awunyo-Vitor, D.; et al. Cocoa pod husk-derived organic soil amendments differentially affect soil fertility, nutrient leaching, and greenhouse gas emissions in cocoa soils. J. Clean. Prod. 2024, 479, 144065. [Google Scholar] [CrossRef]
  4. Yang, F.; Wang, W.; Wu, Z.; Peng, J.; Xu, H.; Ge, M.; Lin, S.; Zeng, Y.; Sardans, J.; Wang, C.; et al. Fertilizer reduction and biochar amendment promote soil mineral-associated organic carbon, bacterial activity, and enzyme activity in a jasmine garden in southeast China. Sci. Total Environ. 2024, 954, 176300. [Google Scholar] [CrossRef]
  5. Saraugi, S.S.; Routray, W. Advances in sustainable production and applications of nano-biochar. Sci. Total Environ. 2024, 955, 176883. [Google Scholar] [CrossRef]
  6. Wang, C.; Zhao, Y.; Hao, S.; Chen, J.; Chen, S.; Liu, J.; Liu, H.; Zhu, X.; Li, X.; Zhang, A. Effects of composted straw, biochar, and polyacrylamide addition on soil permeability and dynamic leaching characteristics of pollutants in loessial soil in urban greenbelts according to indoor simulation experiments. Agronomy 2024, 14, 1958. [Google Scholar] [CrossRef]
  7. Mondal, M.; Biswas, B.; Garai, S.; Sarkar, S.; Banerjee, H.; Brahmachari, K.; Bandyopadhyay, P.K.; Maitra, S.; Brestic, M.; Skalicky, M.; et al. Zeolites enhance soil health, crop productivity and environmental safety. Agronomy 2021, 11, 448. [Google Scholar] [CrossRef]
  8. Albalasmeh, A.A.; Hamdan, E.H.; Gharaibeh, M.A.; Hanandeh, A.E. Improving aggregate stability and hydraulic properties of Sandy loam soil by applying polyacrylamide polymer. Soil Tillage Res. 2021, 206, 104821. [Google Scholar] [CrossRef]
  9. Zou, Y.; Zhang, S.; Shi, Z.; Zhou, H.; Zheng, H.; Hu, J.; Mei, J.; Bai, L.; Jia, J. Effects of mixed-based biochar on water infiltration and evaporation in aeolian sand soil. J. Arid Land 2022, 14, 374–389. [Google Scholar] [CrossRef]
  10. Han, Y.; Zhang, J.; Chen, P.; Li, H.; Li, W.; Liu, J.; Zong, R.; Wang, D.; Liang, Y.; Wang, Z. Biochar improves water and nitrogen use efficiency of cotton under mulched drip irrigation in arid regions. Ind. Crops Prod. 2024, 222, 119830. [Google Scholar] [CrossRef]
  11. Patel, M.R.; Panwar, N.L. Evaluating the agronomic and economic viability of biochar in sustainable crop production. Biomass Bioenergy 2024, 188, 107328. [Google Scholar] [CrossRef]
  12. Ullah, M.S.; Malekian, R.; Randhawa, G.S.; Gill, Y.S.; Singh, S.; Esau, T.J.; Zaman, Q.U.; Afzaal, H.; Du, D.L.; Farooque, A.A. The potential of biochar incorporation into agricultural soils to promote sustainable agriculture: Insights from soil health, crop productivity, greenhouse gas emission mitigation and feasibility perspectives—A critical review. Rev. Environ. Sci. Biotechnol. 2024, 23, 1105–1130. [Google Scholar] [CrossRef]
  13. Pang, Y.; Li, N.; Fan, M.; Jiang, P.; Zhou, A.; Wang, W. Soil utilization of solid waste: Small-strain dynamic properties and microscopic mechanism of phosphogypsum-modified coastal cement soil. J. Mater. Res. Technol. 2024, 33, 4265–4279. [Google Scholar] [CrossRef]
  14. Chen, T.; Wang, L.; He, B.; Peng, X.; Nie, X.; Ma, F.; Han, P.; Bai, X. Study on the solidification/stabilization of cadmium-contaminated soil by red mud-assisted blast furnace slag under excitation conditions. J. Clean. Prod. 2024, 435, 140505. [Google Scholar] [CrossRef]
  15. Wang, Y.; Chen, B.; Liu, N.; Jiang, Z. Utilization of waste phosphogypsum in high-strength geopolymer concrete: Performance optimization and mechanistic exploration. J. Build. Eng. 2024, 98, 111253. [Google Scholar] [CrossRef]
  16. Bilal, E.; Bellefqih, H.; Bourgier, V.; Mazouz, H.; Dumitraş, D.-G.; Bard, F.; Laborde, M.; Caspar, J.P.; Guilhot, B.; Iatan, E.-L.; et al. Phosphogypsum circular economy considerations: A critical review from more than 65 storage sites worldwide. J. Clean. Prod. 2023, 414, 137561. [Google Scholar] [CrossRef]
  17. Zhang, D.; Luo, H.; Zheng, L.; Wang, K.; Li, H.; Wang, Y.; Feng, H. Utilization of waste phosphogypsum to prepare hydroxyapatite nanoparticles and its application towards removal of fluoride from aqueous solution. J. Hazard. Mater. 2012, 241–242, 418–426. [Google Scholar] [CrossRef] [PubMed]
  18. Wang, Z.; Shui, Z.; Sun, T.; Li, X.; Zhang, M. Recycling utilization of phosphogypsum in eco excess-sulphate cement: Synergistic effects of metakaolin and slag additives on hydration, strength and microstructure. J. Clean. Prod. 2022, 358, 131901. [Google Scholar] [CrossRef]
  19. Reijnders, L. Cleaner phosphogypsum, coal combustion ashes and waste incineration ashes for application in building materials: A review. Build. Environ. 2007, 42, 1036–1042. [Google Scholar] [CrossRef]
  20. Gázquez, M.J.; Mantero, J.; Bolívar, J.P.; García-Tenorio, R.; Vaca, F.; Lozano, R.L. Physico-chemical and radioactive characterization of TiO2 undissolved mud for its valorization. J. Hazard. Mater. 2011, 191, 269–276. [Google Scholar] [CrossRef] [PubMed]
  21. Rashad, A.M. Phosphogypsum as a construction material. J. Clean. Prod. 2017, 166, 732–743. [Google Scholar] [CrossRef]
  22. Silva, L.F.O.; Oliveira, M.L.S.; Crissien, T.J.; Santosh, M.; Bolivar, J.; Shao, L.; Dotto, G.L.; Gasparotto, J.; Schindler, M. A review on the environmental impact of phosphogypsum and potential health impacts through the release of nanoparticles. Chemosphere 2022, 286, 131513. [Google Scholar] [CrossRef] [PubMed]
  23. Liu, Y.; Zhang, L.; Xue, B.; Chen, L.; Wang, G.; Wang, J.; Wan, H.; Lin, X.; Zhu, G. Simulation of red mud/phosphogypsum-based artificial soil engineering applications in vegetation restoration and ecological reconstruction. Sci. Total Environ. 2024, 951, 175656. [Google Scholar] [CrossRef]
  24. Wang, C.; Wang, Z.; Huang, D.; Huang, Q.; Chen, Y.; Zhang, H.; Shui, Z. Recovery and recycling core of phosphogypsum: Characteristic hazardous elements risk assessment and analysis. Process Saf. Environ. Prot. 2023, 170, 738–756. [Google Scholar] [CrossRef]
  25. Shi, X.; Zeng, A.; Duan, H.; Zhang, H.; Yang, J. Status and development trends of phosphogypsum utilization in China. Circ. Econ. 2024, 3, 100116. [Google Scholar] [CrossRef]
  26. Li, C.; Dong, Y.; Yi, Y.; Tian, J.; Xuan, C.; Wang, Y.; Wen, Y.; Cao, J. Effects of phosphogypsum on enzyme activity and microbial community in acid soil. Sci. Rep. 2023, 13, 6189. [Google Scholar] [CrossRef] [PubMed]
  27. Hartmann, M.; Six, J. Soil structure and microbiome functions in agroecosystems. Nat. Rev. Earth Environ. 2023, 4, 4–18. [Google Scholar] [CrossRef]
  28. Philippot, L.; Chenu, C.; Kappler, A.; Rillig, M.C.; Fierer, N. The interplay between microbial communities and soil properties. Nat. Rev. Microbiol. 2024, 22, 226–239. [Google Scholar] [CrossRef] [PubMed]
  29. Bossolani, J.W.; Crusciol, C.A.C.; Mariano, E.; Fonseca, M.; Moretti, L.G.; Momesso, L.; Portugal, J.R.; Costa, N.R.; Calonego, J.C.; Kuramae, E.E. Long term co-application of lime and phosphogypsum increases 15 N recovery and reduces 15 N losses by modulating soil nutrient availability, crop growth and N cycle genes. Eur. J. Agron. 2023, 149, 126907. [Google Scholar] [CrossRef]
  30. Michalovicz, L.; Tormena, C.A.; Lopes Müller, M.M.; Dick, W.A.; Cervi, E.C. Residual effects of phosphogypsum rates and machinery traffic on soil attributes and common-bean (Phaseolus vulgaris) yield in a no-tillage system. Soil Tillage Res. 2021, 213, 105152. [Google Scholar] [CrossRef]
  31. Costa, R.F.; Firmano, R.F.; Colzato, M.; Crusciol, C.A.C.; Alleoni, L.R.F. Sulfur speciation in a tropical soil amended with lime and phosphogypsum under long-term no-tillage system. Geoderma 2022, 406, 115461. [Google Scholar] [CrossRef]
  32. Turner, B.L.; Haygarth, P.M. Phosphatase activity in temperate pasture soils: Potential regulation of labile organic phosphorus turnover by phosphodiesterase activity. Sci. Total Environ. 2005, 344, 27–36. [Google Scholar] [CrossRef] [PubMed]
  33. Chen, H.; Li, D.; Zhao, J.; Xiao, K.; Wang, K. Effects of nitrogen addition on activities of soil nitrogen acquisition enzymes: A meta-analysis. Agric. Ecosyst. Environ. 2018, 252, 126–131. [Google Scholar] [CrossRef]
  34. Basset, C.; Abou Najm, M.; Ghezzehei, T.; Hao, X.; Daccache, A. How does soil structure affect water infiltration? A meta-data systematic review. Soil Tillage Res. 2023, 226, 105577. [Google Scholar] [CrossRef]
  35. Hasana, H.; Beyene, S.; Kifilu, A.; Kidanu, S. Effect of phosphogypsum amendment on chemical properties of sodic soils at different incubation periods. Appl. Environ. Soil Sci. 2022, 2022, 9097994. [Google Scholar] [CrossRef]
  36. Duan, G.; Liu, M.; Liang, Z.; Wang, M.; Yang, H.; Xu, Y.; Yu, T.; Jin, Y.; Hu, J.; Liu, J. Amendments of severe saline-sodic paddy land: Optimal combination of phosphogypsum, farmyard fertilizer, and wood peat. Agronomy 2023, 13, 1364. [Google Scholar] [CrossRef]
  37. Lin, R.; Huang, G.; Ma, F.; Pan, T.; Wang, X.; Han, Y.; Liao, Y. Investigation of phosphogypsum-based cementitious materials: The effect of lime modification. Dev. Built Environ. 2024, 18, 100477. [Google Scholar] [CrossRef]
  38. GB15618; Soil Environmental Quality—Risk Control Standard for Soil Contamination of Agricultural Land. Ministry of Ecology and Environment of the People’s Republic of China: Beijing, China, 2018.
  39. Liu, Z.; Cai, L.; Dong, Q.; Zhao, X.; Han, J. Effects of microplastics on water infiltration in agricultural soil on the Loess Plateau, China. Agric. Water Manag. 2022, 271, 107818. [Google Scholar] [CrossRef]
  40. Li, G.; Wang, L.; Zhen, Q.; Zheng, J. Petroleum induces soil water repellency and impedes the infiltration and evaporation processes in sandy soil. J. Hydrol. 2024, 643, 131990. [Google Scholar] [CrossRef]
  41. Nepal, J.; Xin, X.; Maltais-Landry, G.; Barra Netto-Ferreira, J.; Wright, A.L.; He, Z. Water dispersible carbon nanomaterials reduced N, P, and K leaching potential in sandy soils: A column leaching study. Sci. Total Environ. 2024, 954, 176755. [Google Scholar] [CrossRef] [PubMed]
  42. Sun, Y.; Wang, X.; Wu, Q.; Zong, T.; Xin, X.; Xie, J.; Yang, J. Use of rice straw nano-biochar to slow down water infiltration and reduce nitrogen leaching in a clayey soil. Sci. Total Environ. 2024, 948, 174956. [Google Scholar] [CrossRef] [PubMed]
  43. Liu, L.; Fei, L.; Zhu, H.; Hao, K.; Jie, F. Study on the influence of fertilizer solution concentration on soil water and nitrogen transport characteristics under film hole irrigation. J. Mater. Res. Technol. 2021, 21, 1653–1665. [Google Scholar] [CrossRef]
  44. Swartzendruber, D. Revised attribution of the power form infiltration equation. Water Resour. Res. 1993, 29, 2455–2456. [Google Scholar] [CrossRef]
  45. Feng, Z.; Nie, W.; Ma, Y.; Li, Y.; Ma, X.; Zhu, H. Effects of urea solution concentration on soil hydraulic properties and water infiltration capacity. Sci. Total Environ. 2023, 898, 165471. [Google Scholar] [CrossRef]
  46. Sasal, M.C.; Andriulo, A.E.; Taboada, M.A. Soil porosity characteristics and water movement under zero tillage in silty soils in Argentinian Pampas. Soil Tillage Res. 2006, 87, 9–18. [Google Scholar] [CrossRef]
  47. Xu, S.; Zhang, W.; Goodwin, P.H.; Wang, Y.; Zheng, S.-J.; Li, X. Effect of cover crop on soil fertility and bacterial diversity in a banana plantation in southwestern China. Soil Tillage Res. 2024, 240, 106092. [Google Scholar] [CrossRef]
  48. Adetunji, A.T.; Ncube, B.; Meyer, A.H.; Olatunji, O.S.; Mulidzi, R.; Lewu, F.B. Soil Ph, nitrogen, phosphatase and urease activities in response to cover crop species, termination stage and termination method. Heliyon 2021, 7, e05980. [Google Scholar] [CrossRef] [PubMed]
  49. Kandeler, E.; Gerber, H. Short-term assay of soil urease activity using colorimetric determination of ammonium. Biol. Fertil. Soils 1988, 6, 68–72. [Google Scholar] [CrossRef]
  50. Gu, Y.; Wang, P.; Kong, C.H. Urease, invertase, dehydrogenase and polyphenoloxidase activities in paddy soil influenced by allelopathic rice variety. Eur. J. Soil Biol. 2009, 45, 436–441. [Google Scholar] [CrossRef]
  51. Johnson, J.L.; Temple, K.L. Some variables affecting the measurement of “catalase activity” in soil. Soil Sci. Soc. Am. J. 1964, 28, 207–209. [Google Scholar] [CrossRef]
  52. Liu, X.; Peng, Y.; Yang, Q.; Wang, X.; Cui, N. Determining optimal deficit irrigation and fertilization to increase mango yield, quality, and WUE in a dry hot environment based on TOPSIS. Agric. Water Manag. 2021, 245, 106650. [Google Scholar] [CrossRef]
  53. Pushpalatha, K.; Sherubha, P.; Sasirekha, S.P.; Kumar Anguraj, D. A constructive delay-aware model for opportunistic routing protocol in MANET. Expert Syst. Appl. 2024, 255, 124527. [Google Scholar] [CrossRef]
  54. Holatko, J.; Brtnicky, M.; Kintl, A.; Baltazar, T.; Malicek, O.; Mustafa, A.; Skladanka, J.; Kucerik, J.; Alamri, S.; Lochman, J.; et al. Effect of alfalfa-grass mixed culture and inoculation with Azotobacter and Rhizobium on soil biological properties and nutrient transformation activities. Eur. J. Soil Biol. 2024, 122, 103651. [Google Scholar] [CrossRef]
  55. Hu, D.; Zhou, X.; Ma, G.; Pan, J.; Ma, H.; Chai, Y.; Li, Y.; Yue, M. Increased soil bacteria-fungus interactions promote soil nutrient availability, plant growth, and coexistence. Sci. Total Environ. 2024, 955, 176919. [Google Scholar] [CrossRef] [PubMed]
  56. Jia, A.; Song, X.; Li, S.; Liu, Z.; Liu, X.; Han, Z.; Gao, H.; Gao, Q.; Zha, Y.; Liu, Y.; et al. Biochar enhances soil hydrological function by improving the pore structure of saline soil. Agric. Water Manag. 2024, 306, 109170. [Google Scholar] [CrossRef]
  57. Fouladidorhani, M.; Shayannejad, M.; Mosaddeghi, M.R.; Shariatmadari, H.; Arthur, E. Biochar, manure and superabsorbent improve the physical quality of saline-sodic soil under greenhouse conditions. Soil Sci. Soc. Am. J. 2023, 87, 1003–1017. [Google Scholar] [CrossRef]
  58. He, Z.; Liang, J.; Lu, Y.; Yang, Q.; Lu, C.; Wu, D. Enhanced soil moisture management using waste green algae-derived polymers: Optimization of application rate and mixing depth. Agronomy 2023, 13, 2335. [Google Scholar] [CrossRef]
  59. Qi, J.; Zhu, H.; Zhou, P.; Wang, X.; Wang, Z.; Yang, S.; Yang, D.; Li, B. Application of phosphogypsum in soilization: A review. Int. J. Environ. Sci. Technol. 2023, 20, 10449–10464. [Google Scholar] [CrossRef]
  60. Kong, L.; Fan, X.; Li, X.; Zhai, B.; Tian, Z.; Hong, Y.; Jiang, P.; Zhang, J.; Wang, J. Water infiltration and evaporation process with ATP addition in newly reclaimed soil. Agronomy 2024, 14, 2628. [Google Scholar] [CrossRef]
  61. Wang, J.; Shi, D.; Li, Y.; Chen, A.; Feng, S.; Liu, C. A study on infiltration characteristics and one-dimensional algebraic model simulation in reclaimed soil with biochar. Water 2023, 15, 2985. [Google Scholar] [CrossRef]
  62. Sun, X.; Ding, Z.; Bi, Y.; Wang, X. Water-holding properties of clinoptilolite/sodium polyacrylate-modified compacted clay cover of Tailing Pond. Int. J. Environ. Res. Public Health 2022, 19, 15554. [Google Scholar] [CrossRef]
  63. Brevik, E.C.; Fenton, T.E.; Lazari, A. Soil electrical conductivity as a function of soil water content and implications for soil mapping. Precis. Agric. 2006, 7, 393–404. [Google Scholar] [CrossRef]
  64. Ankit; Prakash, D.; Sheoran, S.; Yadav, P.K.; Raj, D.; Rachna; Gupta, R.K.; El-Hendawy, S.; Mattar, M.A. Sustainable cropping sequences to improve soil fertility and microbiological properties. Sustainability 2024, 16, 9821. [Google Scholar] [CrossRef]
  65. Khan, M.A.; Basir, A.; Shah, S.T.; Rehman, M.U.; Hassan, M.u.; Zheng, H.; Basit, A.; Székely, Á.; Jamal, A.; Radicetti, E.; et al. Sustainable soil management in alkaline soils: The role of biochar and organic nitrogen in enhancing soil fertility. Land 2024, 13, 1869. [Google Scholar] [CrossRef]
  66. Tao, W.-Q.; Wu, Q.-Q.; Zhang, J.; Chang, T.-T.; Liu, X.-N. Effects of applying organic amendments on soil aggregate structure and tomato yield in facility agriculture. Plants 2024, 13, 3064. [Google Scholar] [CrossRef] [PubMed]
  67. Outbakat, M.B.; El Mejahed, K.; El Gharous, M.; El Omari, K.; Beniaich, A. Effect of phosphogypsum on soil physical properties in moroccan salt-affected soils. Sustainability 2022, 14, 13087. [Google Scholar] [CrossRef]
  68. Guenet, B.; Lenhart, K.; Leloup, J.; Giusti-Miller, S.; Pouteau, V.; Mora, P.; Nunan, N.; Abbadie, L. The impact of long-term CO2 enrichment and moisture levels on soil microbial community structure and enzyme activities. Geoderma 2012, 170, 331–336. [Google Scholar] [CrossRef]
  69. Ren, Y.; Su, L.; Hou, X.; Shao, J.; Liu, K.; Shen, Q.; Zhang, R.; Xun, W. Rhizospheric compensation of nutrient cycling functions dominates crop productivity and nutrient use efficiency. Appl. Soil Ecol. 2023, 182, 104722. [Google Scholar] [CrossRef]
  70. Lu, L.; Tong, C.; Liu, Y.; Yang, W. Analysis of physicochemical properties, enzyme activity, microbial diversity in rhizosphere soil of coconut (Cocos nucifera L.) under organic and chemical fertilizers, irrigation conditions. Agriculture 2024, 14, 1937. [Google Scholar] [CrossRef]
  71. Zhang, J.; Amonette, J.E.; Flury, M. Effect of biochar and biochar particle size on plant-available water of sand, silt loam, and clay soil. Soil Tillage Res. 2021, 212, 104992. [Google Scholar] [CrossRef]
  72. Niu, M.; Chen, X.; Pan, Y.; Wang, S.; Xue, L.; Duan, Y.; Ahmad, S.; Zhou, Y.; Zhao, K.; Peng, D. Biochar effectively promoted growth of ardisia crenata by affecting the soil physicochemical properties. Plants 2024, 13, 1736. [Google Scholar] [CrossRef]
  73. Burrell, L.D.; Zehetner, F.; Rampazzo, N.; Wimmer, B.; Soja, G. Long-term effects of biochar on soil physical properties. Geoderma 2016, 282, 96–102. [Google Scholar] [CrossRef]
  74. Antony, E.; Singandhupe, R.B. Impact of drip and surface irrigation on growth, yield and WUE of capsicum (Capsicum annum L.). Agric. Water Manag. 2004, 65, 121–132. [Google Scholar] [CrossRef]
  75. Xu, M.; Liu, Y.; Xi, J.; Li, S.; Li, Z. Optimization of soil hydrological properties in degraded grasslands by soil amendments. J. Hydrol. 2024, 643, 131946. [Google Scholar] [CrossRef]
  76. Laghari, M.; Mirjat, M.S.; Hu, Z.; Fazal, S.; Xiao, B.; Hu, M.; Chen, Z.; Guo, D. Effects of biochar application rate on sandy desert soil properties and sorghum growth. CATENA 2015, 135, 313–320. [Google Scholar] [CrossRef]
  77. Fu, Q.; Zhao, H.; Li, T.; Hou, R.; Liu, D.; Ji, Y.; Zhou, Z.; Yang, L. Effects of biochar addition on soil hydraulic properties before and after freezing-thawing. CATENA 2019, 176, 112–124. [Google Scholar] [CrossRef]
  78. Wang, X.; Li, Y.; Feng, H.; Yu, Q.; Fan, X.; Liu, C.; Chen, J.; Yang, Z.; Biswas, A. Combining biochar with cotton-sugarbeet intercropping increased water-fertilizer productivity and economic benefits under plastic mulched drip irrigation in Xinjiang, China. Ind. Crops Prod. 2023, 192, 116060. [Google Scholar] [CrossRef]
  79. Guan, R.; Li, Y.; Jia, Y.; Jiang, F.; Li, L. Acidified biochar one-off application for saline-alkali soil improvement: A three-year field trial evaluating the persistence of effects. Ind. Crops Prod. 2024, 222, 119972. [Google Scholar] [CrossRef]
  80. Bachani, J.; Mahanty, A.; Aftab, T.; Kumar, K. Insight into calcium signalling in salt stress response. S. Afr. J. Bot. 2022, 151, 1–8. [Google Scholar] [CrossRef]
Figure 1. (a) Phosphogypsum, (b) Soil infiltration with phosphogypsum, (c) Field experiment.
Agronomy 15 00035 g001
Figure 2. Effects of different phosphogypsum application rates on wetting front. (a) Characterization of the wetting front with time under different phosphogypsum application rates. (b) Elapsed time for the wetting front to reach 20 cm under different phosphogypsum application rates. (c) Elapsed time for the wetting front to reach 40 cm under different phosphogypsum application rates. Different letters on the bars indicate significant differences at p = 0.05 level, determined using the Duncan method.
Agronomy 15 00035 g002
Figure 3. Effects of different phosphogypsum application rates on cumulative infiltration. (a) Characterization of cumulative infiltration with time under different phosphogypsum application rates. (b) Average infiltration rate in the first 5 min at different phosphogypsum application rates. (c) Average infiltration rate at the end of infiltration at different phosphogypsum application rates. Different letters on the bars indicate significant differences at p = 0.05 level, determined using the Duncan method.
Agronomy 15 00035 g003
Figure 4. Effects of different phosphogypsum application rates on soil moisture content. (a) Soil moisture content across different soil depths under varying phosphogypsum application rates. (b) Average soil moisture content in the 0–40 cm soil layer under different phosphogypsum application rates. The significance of treatments was determined using the Duncan method. ns, p > 0.05; **, p < 0.01.
Agronomy 15 00035 g004
Figure 5. Effects of different phosphogypsum application rates on electric conductivity. (a) Electric conductivity across different soil depths under varying phosphogypsum application rates. (b) Average electric conductivity in the 0–40 cm soil layer under different phosphogypsum application rates. The significance of treatments was determined using the Duncan method. ns, p > 0.05; **, p < 0.01.
Agronomy 15 00035 g005
Figure 6. Effects of phosphogypsum application rates on soil physical and available nutrients and enzyme activity. (a) Bulk density; (b) Porosity; (c) Soil organic matter; (d) Available nitrogen; (e) Available phosphorus; (f) Available potassium; (g) Urease activity; (h) Invertase activity; (i) Catalase activity. Different letters on the bars indicate significant differences at p = 0.05 level, determined using the Duncan method.
Agronomy 15 00035 g006
Figure 7. Clustered correlation heatmap of soil property and enzyme activity. Blue indicates a positive correlation and red a negative correlation. The degree of correlation is highlighted in color—the stronger the correlation, the darker the color. The significance of Pearson correlation was determined using t-tests. The ** in different colors have the same meaning and indicate significant differences at p = 0.01.
Agronomy 15 00035 g007
Figure 8. Effects of phosphogypsum application rates on (a) yield and (b) irrigation water productivity. Different letters on the bars indicate significant differences at p = 0.05 level, determined using the Duncan method.
Agronomy 15 00035 g008
Figure 9. Partial least squares pathway analysis of phosphogypsum effects on yield. The width of the arrows indicates the strength of the standardized path coefficients. The green and red arrows indicate positive and negative flows of causality, respectively. The significance of standardized path coefficients was determined using t-tests. *, p < 0.05.
Agronomy 15 00035 g009
Figure 10. Effects of phosphogypsum application rates on comprehensive evaluation scores. The different colors of the dots in the figure represent varying phosphogypsum application rates.
Agronomy 15 00035 g010
Figure 11. The relationship between soil moisture content and electric conductivity. The square colors represent ranges of soil moisture content and electric conductivity, from yellow (low) to blue (high).
Agronomy 15 00035 g011
Table 1. Chemical composition, heavy metals content and pH of phosphogypsum.
Chemical Composition (%)Heavy Metals Content (mg/kg)Heavy Metals Standard Value (mg/kg)pH
Calcium sulfate62.72Arsenic6.89304.2
Silicon dioxide14.55Lead1.8170
Phosphorus pentoxide0.81Cadmium0.160.30
Aluminum oxide0.49Mercury0.130.50
Soluble fluorine0.42Chromium11.21150
Iron oxide0.175Nickel2.65200
Table 2. Fitting parameters of wetting front propulsion model and cumulative infiltration model.
Treatments
Performance ParametersCK0.0750.1500.30.600
Wetting front propulsion model A2.5372.4192.3432.0580.819
B0.6040.5920.5960.5610.758
MAE0.5530.5810.6200.6160.594
RRMSE0.0440.0490.0560.0500.061
CRM0.0070.0040.0040.005−0.015
CE0.9960.9950.9940.9950.995
Cumulative infiltration modelLewisK2.5712.0271.4920.9540.427
α0.4310.4880.5660.6570.820
MAE0.4610.4180.3830.4820.239
RRMSE0.0740.0590.0480.0570.034
CRM−0.088−0.052−0.0110.0370.046
CE0.9900.9930.9950.9940.999
PhilipS3.8003.3803.0613.1342.475
MAE1.5091.2481.2290.9952.340
RRMSE0.0990.0940.1030.0760.231
CRM0.0450.0400.0430.0310.087
CE0.9780.9810.9780.9870.921
Hortona0.3100.2650.2270.1990.228
b1.6511.6501.4261.3741.361
c0.1230.1430.1320.1040.315
MAE0.5200.5700.5750.8150.426
RRMSE0.0380.0420.0480.0620.041
CRM0.0020.0030.003−0.002−0.001
CE0.9970.9960.9950.9920.997
Note: MAE: Mean Absolute Error; RRMSE: Relative Root Mean Square Error; CRM: Coefficient of Residual Mass; CE: Coefficient of Efficiency. A reflected the initial condition of the wetting front propagation rate, while B characterized the time dependency of wetting front advancement. K represented the initial soil water conductivity, and α described the non-linear relationship between cumulative infiltration and time. S quantified the soil’s water absorption ability due to capillary forces. a was the final infiltration rate, b was the initial infiltration rate and c was a decay constant that controlled the transition from b to a.
Disclaimer/Publisher’s Note: The statements, opinions and data contained in all publications are solely those of the individual author(s) and contributor(s) and not of MDPI and/or the editor(s). MDPI and/or the editor(s) disclaim responsibility for any injury to people or property resulting from any ideas, methods, instructions or products referred to in the content.

