Article

High-Density Genetic Map Construction and QTL Detection for Cotyledon Color in Faba Bean Based on Double Digest Restriction-Site Associated DNA Sequencing (ddRAD-Seq)

1
Academy of Agriculture and Forestry Sciences, Qinghai University, Xining 810016, China
2
National Crop Germplasm Duplicate Bank, Xining 810016, China
3
State Key Laboratory of Plateau Ecology and Agriculture, Qinghai University, Xining 810016, China
*
Author to whom correspondence should be addressed.
These authors contributed equally to this work.
Agronomy 2025, 15(1), 193; https://doi.org/10.3390/agronomy15010193
Submission received: 11 December 2024 / Revised: 11 January 2025 / Accepted: 13 January 2025 / Published: 15 January 2025
(This article belongs to the Section Crop Breeding and Genetics)

Abstract

:
Cotyledon color is one of the important indices for identifying faba bean variety purity and measuring processing quality. Therefore, an in-depth study of the genetic mechanism of cotyledon color is vital for promoting faba bean industry development. We used the yellow cotyledon variety Qingcan 16 and the green cotyledon variety Qingcan 17 as parent plants to construct hybrid combinations. F1-, F2-, BC1F1-, and BC2F1-generation single-plant cotyledon colors were counted to clarify cotyledon color inheritance. F2-generation individuals were genotyped using ddRAD-Seq to construct a genetic linkage map and identify QTLs for cotyledon color. Green cotyledons were controlled by one pair of recessive nuclear genes. Using the screened 1991 SNP markers, a high-density linkage map was constructed, with a coverage length of 1476.95 cM and an average map distance of 0.96 cM. The green cotyledon trait was located using WinQTL Cart, and a vfGC candidate interval explaining 34.30 to 49.40% of the phenotypic variation was identified at LG02 (101.952 cM to 115.493 cM) and at LOD = 16.0, corresponding to chr1L 1,077,051,302 bp to 1,636,400,339 bp (559.35 Mb). The above interval contained 2021 genes, 20 of which were involved in photosynthesis, but no SGR or genes with similar functions were identified. However, the published faba bean vfSGR was located within the vfGC candidate interval, confirming that our localization interval was reliable. The above findings provided further clues for the fine localization of genes regulating green cotyledons and the development of molecular linked markers in faba bean.

1. Introduction

Faba bean (Vicia faba L.) is an important legume crop as well as a plant protein source, nutritious healthy vegetable, high-quality protein forage (feed), and green fertilizer. Galactose is the major monosaccharide in faba bean, and its content in the green-cotyledon type is about twice that in the yellow-cotyledon type [1]. The screening and identification of green-cotyledon genotypes with ideal quality traits will help to expand the faba bean market share [2]. In long-term agricultural production, a pattern of predominantly creamy-seed-coat and yellow-cotyledon varieties has developed, and only individual green-cotyledon varieties have been bred [3,4,5], creating a huge gap in the market. With improved economic levels and dietary structural changes, the demand for broad beans has diversified and become multi-purpose, and the green-cotyledon variety of faba bean has gradually become favored by the public for its unique appearance and special edible characteristics [6]. Accelerating the utilization of green-cotyledon faba bean germplasm resources and variety selection have become a hot research direction in faba bean breeding.
Green-cotyledon mutants are a type of stay-green mutant in which chlorophyll is degraded and impaired during leaf senescence and seed maturation, and the stay-green genes of some legume mutants have been resolved, e.g., those of the common bean (Phaseolus vulgaris L.) [7], pea (Pisum sativum L.) [8], alfalfa (Medicago sativa L.) [9], and soybean (Glycine max (L.) Merr.) [10,11]. The degradation of chlorophyll and chlorophyll-binding proteins plays an important role in plant senescence [12]. Meanwhile, chlorophyll degradation is closely related to crop production. Delayed chlorophyll degradation in crops increases photosynthetic capacity at late stages, leading to an increase in crop production [13]. In higher plants, chlorophyll metabolism is mainly catalyzed by PaO (pheophorbide a oxygenase), and therefore the chlorophyll degradation pathway is referred to as the PaO pathway [14]. The PaO pathway also includes a series of enzymes catalyzed by chlorophyllase, namely, Mg-dechelatase and RCCR (red chlorophyll catabolite reductase), and abnormal activity of any one of these enzymes may affect chlorophyll metabolism, resulting in slow or even no degradation [15]. There are three possible pathways through which stay-green genes have roles in chlorophyll degradation: (1) through chlorophyllase regulation, which in turn controls chlorophyll a degradation; (2) through the regulation of the stability of the protein inside chlorophyll a, which in turn controls chlorophyll a degradaion; and (3) through PaO activity regulation, which controls chlorophyll degradation [16,17].
High-density genetic linkage maps are important in genetics and genomics research, especially for the fine localization of genes, map cloning, and marker-assisted selective breeding. For legume crops like chickpea (Cicer arietinum L.), cowpea (Vigna unguiculata (L.) Walp.), mung bean (Vigna radiata L.), and the common bean (Phaseolus vulgaris L.), relatively saturated genetic maps have been constructed so far [18,19,20,21]. The construction of a genetic linkage map for faba bean has lagged behind, mainly due to this plant’s large genome (about 13,000 Mb) [22]. Van de Ven et al. [23] constructed the first faba bean genetic linkage map, and then other scholars successively utilized isozymes, morphological markers, RFLPs (restriction fragment length polymorphisms), RAPD (random amplified polymorphic DNA), AFLPs (amplified fragment length polymorphisms), SSRs (simple sequence repeats), ISSRs (inter-simple sequence repeats), SNPs (single-nucleotide polymorphisms), and other markers to construct several faba bean genetic maps [24,25,26,27,28].
The emergence of the above faba bean genetic linkage maps has contributed to the development of faba bean molecular genetics to a certain extent, but these low-quality maps and their usefulness are limited. RRGS (reduced-representation genome sequencing) is a sequencing strategy that utilizes restriction endonuclease to interrupt genomic DNA and the high-throughput sequencing of specific segments to obtain a large number of genetic polymorphism tags in order to adequately represent species genome-wide information [29]. ddRAD-seq is a simplified genome sequencing technology based on whole-genome enzymatic sites developed on the basis of second-generation sequencing. The central step involves using two restriction endonucleases to perform double digestion on genomic DNA, thereby generating DNA fragments of specific sizes. The chosen enzymes should exhibit a broad distribution of recognition sites within the target genome to ensure comprehensive coverage. The EcoRI/NlaIII combination is frequently employed because it yields a suitable density of recognition sites across the genome. In this method, genomic DNA is first digested with restriction enzymes and then ligated with barcoded P1 adapters. Fragments from different samples can be pooled and then digested with a second restriction enzyme. Next, the fragments are size-selected and purified, followed by ligation with P2 primers and amplification. This method, through double digestion, improves the selectivity and accuracy of fragment selection and allows for combinatorial indexing, thus supporting the processing of multiple samples. Compared with conventional RAD technology, this method has a simple technical process and is not limited by the reference genome, which can greatly simplify genome complexity, reduce experimental costs, and allow the acquisition of tens of thousands of polymorphic markers through one sequencing run [30]. Presently, it is widely used in the study of biological population evolution, population history, genetic linkage map construction, and gene localization [31,32,33,34,35].
The yellow/green cotyledon polymorphism (I/i) in peas was first reported by Gregor Mendel in 1866, and then the stay-green gene was identified in Pisum sativum by using classical and molecular genetics and comparative genomics [36]. Due to the complex and large genome of the faba bean, molecular genetic research on traits like cotyledon color has been carried out relatively slowly. Fortunately, Jayakodi et al. [37] assembled the first faba bean genome at the chromosome level, which accelerated the process of breeding faba bean based on molecular genetics. However, the SNP markers that have been developed so far are very limited, and only a few have been used in exploratory attempts in genetic studies. Given the current insufficient understanding of the genetic mechanisms underlying cotyledon color in faba bean, we constructed an F2 genetic population and employed ddRAD-Seq technology to genotype the offspring, aiming to thoroughly investigate the inheritance of cotyledon color in faba bean. Concurrently, we successfully constructed a high-density genetic linkage map and further identified the QTLs controlling cotyledon color. The outcomes of this study will provide a solid theoretical foundation for the fine mapping of genes controlling cotyledon color and the development of functional markers.

2. Materials and Methods

2.1. Construction of Populations and Phenotypic Data Analysis

The parent plants for experimentation were all provided by Academy of Agriculture and Forestry Sciences, Qinghai University. The female parent plant was Qingcan 16, which has the characteristics of a finite growth habit, a yellow cotyledon, concentrated pods, consistent maturity, and suitability for mechanized production; the male parent plant was Qingcan 17, which has the characteristics of an indefinite growth type, a green cotyledon, and processing specificity (Figure 1). The hybrid combination was constructed in June 2016 to obtain F1-generation seeds; F1-generation seeds were planted and subjected to cross-testing in April 2017, and F2- and BC1-generation seeds were harvested in August; The F2- and BC1-generation seeds were planted in March 2018. The cotyledon colors of single plants of each generation were investigated at the maturity stage, and a Chi-square test of the cotyledon color trait was tested using the following formula:
χ 2 = i = 1 n ( O i E i ) 2 E i
In the formula, Oi is the observed value, and Ei is the expected value.
The plants of different generations were planted in the breeding base of Qinghai Academy of Agriculture and Forestry Sciences (36°43′ N, 101°45′ E, 2268.4 m) under conventional management conditions.

2.2. The ddRAD-Seq Library Construction and High-Throughput Sequencing

Faba bean genomic DNA was extracted from single plants of the F2 population and parent plants using the CTAB method and measured to obtain concentrations. After DNA extraction, the DNA quality was assessed via 0.8% agarose gel electrophoresis, and its concentration was quantified using Qubit 3.0 (Life Technologies, Carlsbad, CA, USA). The DNA was then diluted to 50 ng/μL with ddH2O for library preparation. The DNA samples that passed the quality control test were used to construct pair-end libraries with lengths ranging from 300–500 bp using the ddRAD library construction method. The specific experimental protocol is as follows: 1. A total of 500 ng of genomic DNA was taken, and 0.6 U EcoRI (NEB), T4 DNA ligase (NEB), ATP (NEB), and EcoRI junctions (containing index sequences to distinguish the samples) were added, reacted at 37 °C for 3 h, and annealed at 65 °C for 1 h. Then restriction endonuclease NlaIII (NEB) and NlaIII junction were added and reacted for 3 h at 37 °C. At the end of the reaction, the endonuclease was inactivated by placing it in a PCR instrument at 65 °C for 30 min. 2. Agarose gel electrophoresis was used to select fragments of ligated products, and 400–600 bp of recovered digests were selected. 3. Qubit 3.0 (Life Technologies) was used to quantify DNA from recovered products, and 24 samples were mixed in equal quantities. 4. DNA libraries were constructed from mixed products using an Illumina TruSeq Kit. All the library construction and online sequencing processes were performed by Genepioneer Biotechnologies Co. Ltd., Nanjing, China.
Raw sequencing data from the Illumina NovaSeq 6000 platform were assessed using FastQC (https://www.bioinformatics.babraham.ac.uk/projects/fastqc/, accessed on 15 May 2019). We ensured high-quality data were obtained by filtering out low-quality reads, adapter sequences, and reads containing ‘N’ bases using the process_radtags program of Stacks v2.54. The resulting clean data were then characterized by metrics, including the number of filtered reads, Q30 quality scores, and GC content.

2.3. Development of Polymorphic ddRAD Markers and Construction of High-Density Genetic Map

The raw reads obtained from sequencing were identified to obtain the raw reads of each sample, and these reads were used for tag development and genotyping using Stacks. The specific steps of the analysis process were as follows: 1. ustacks was used to develop each sample tag, using the parameters -m 3 -M 3 -d -R. 2. cstacks was used for inter-sample tag clustering and constructing a catalog, using the following parameter: -n 4. 3. sstacks was used to compare each sample against the catalog to detect SNPs in the samples, using the default parameters. For subsequent genetic linkage analysis, SNPs were filtered for completeness and depth, using the following parameters: --max-missing 0.5 --min-mean DP 5. SNP markers were genotyped according to the genotypes of parent plants, and aa × bb type markers were screened for genetic linkage map construction.
Genetic linkage maps were constructed using HighMap software V1.0 [38]. Firstly, the recombination rate and LOD value between markers were estimated via two-point analysis, and the markers were classified into six linkage groups by mLOD value. Then, various methods such as improved Gibbs sampling method, spatial sampling method, and simulated annealing algorithm, were used to determine the order of markers and estimate their genetic distances [39,40]. SMOOTH [41] was used to correct the marker typing according to the genotypical contribution of parent plants. K-nearest neighbor [42] method was used to estimate the missing genotypes. Through the cycle of mapping–correction–mapping, the recombination rate was converted to genetic distances using Kosambi [43], and finally a high-quality genetic map of faba bean was obtained.

2.4. QTL Detection for Cotyledon Color and Candidate Gene Annotation

QTLs (quantitative trait loci) associated with green-cotyledon trait in faba bean were identified using the composite interval mapping (CIM) model of WinQTL Cart V2.0. The LOD threshold for determining the presence or absence of QTLs was determined through 1000 permutations. Five markers were used as cofactors, and the window size was set to 10 cM. The LOD (logarithm of odds) was calculated as the common logarithm of the ratio of the maximum likelihoods under two competing hypotheses. The formula is expressed as LOD = log 10 ( L a ) log 10 ( L o ) , where La denotes the maximum likelihood under the alternative hypothesis (i.e., a QTL is present at the scanned locus), and Lo denotes the maximum likelihood under the null hypothesis. For a QTL, the formula for calculating the proportion of explained variance (Expl.) is Expl. = V G V P , where Expl. represents the proportion of variance explained, VG is the genetic variance of the QTL, and VP is the phenotypic variance.
Since green-cotyledon trait was controlled by a single gene, the LOD was raised to 16.0 to screen for QTL intervals. The sequences of molecular markers in and flanking the QTL intervals were blasted using an online tool for the faba bean genome (https://galaxy-web.ipk-gatersleben.de/, accessed on 3 August 2024), and the most significant results returned by “blastn” were used to infer the physical location of the QTL. In order to increase the reliability of the mapping intervals, 100 kb of each flanking sequence was added as candidate intervals.
The “Hedin/2” genome (https://projects.au.dk/fabagenome/genomics-data, accessed on 10 August 2024) was used as the reference genome, and the candidate genes within the candidate interval were extracted. The candidate genes were annotated using Mercator4 V7.0 [44,45] (https://www.plabipd.de/mercator_main.html, accessed on 13 November 2024).

3. Results

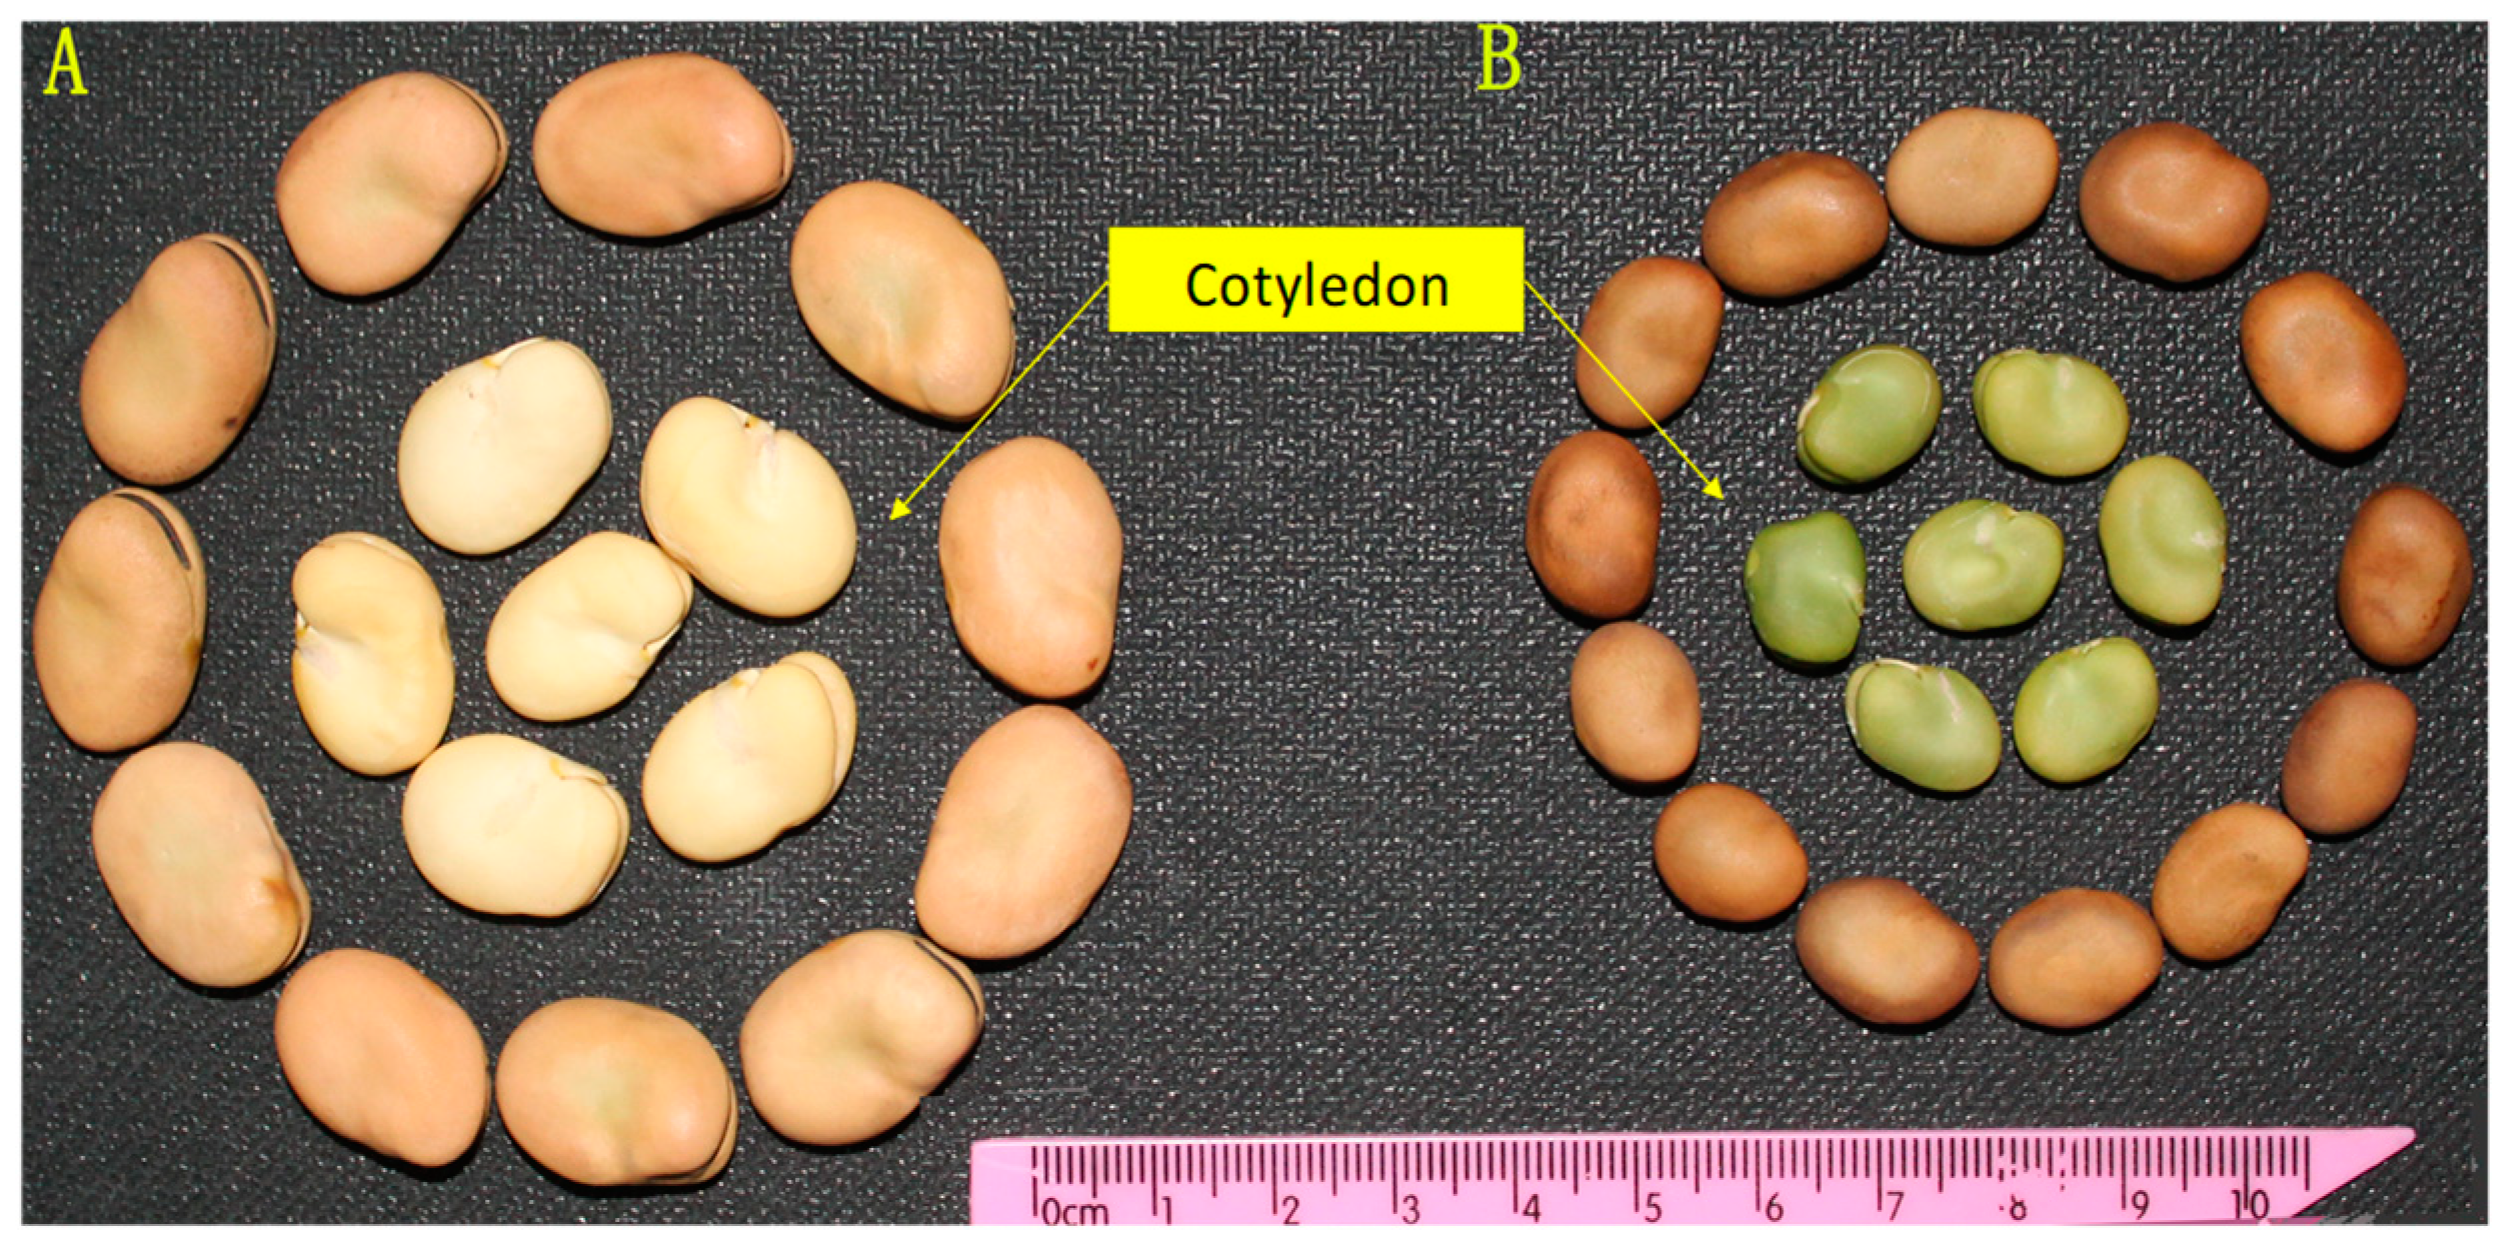
3.1. Analysis of the Heredity of Green-Cotyledon Trait in Faba Bean

The F1, F2, and BC populations were constructed using Qingcan 16 and Qingcan 17. The results showed that all 32 plants of the F1 population were phenotypically consistent with Qingcan 16. There were 19 yellow cotyledons and 0 green cotyledons in the BC1P1 population. There were 23 yellow cotyledons and 19 green cotyledons in the BC1P2 population, and the segregation ratio was determined to be 1:1 using the chi-square test ( χ 2 = 0.381 < χ 2 0.05 = 3.84, P = 0.5371). The F2 population totaled 180 individuals, including 137 with yellow cotyledons and 43 with green cotyledons, with a separation ratio of 3:1 determined via the chi-square test ( χ 2 = 0.1185 < χ 2 0.05 = 3.84, P = 0.7306), conforming to Mendel’s law of inheritance and indicating that the green-cotyledon trait was controlled by one pair of recessive nuclear genes (Table 1).

3.2. Analysis of Sequencing Data

Through the establishment of a ddRAD library and high-throughput sequencing, a total of 352.70 Gb worth of sequencing data were obtained, with a total sequencing number of 1,224,650,974. The total number of sequences for the female parent plants was 17,021,877, totaling 4.90 Gb, with a Q30 of 90.61%, a GC content of 37.88%, and a tag count of 2,369,555, and the average sequencing depth was 12.86; the total number of sequences of the male parent plants was 21,725,660 for 6.26 Gb, with a Q30 of 89.50%, a GC content of 37.71%, 2,744,194 labels, and an average sequencing depth of 14.24. The total number of sequences of the 180 individuals of the F2 population ranged from 4,445,289 to 4,766,502, with a mean of 6,588,352; total data ranged from 1,372,752,576 to 2,920,042,080, with an average of 1,897,445,449; the GC content ranged from 35.66% to 38.47%, with an average of 36.98%; the Q30 ranged from 82.21% to 92.30%, with an average of 88.72%; the number of tags ranged from 1,072,269 to 2,018,618, with an average of 1,573,245; and the average sequencing depth ranged from 5.81× to 11.82×, with an average of 6.92× (Table S1). The above sequencing assessment indicated that the sequencing quality was high and that the results could be used for subsequent data analysis.

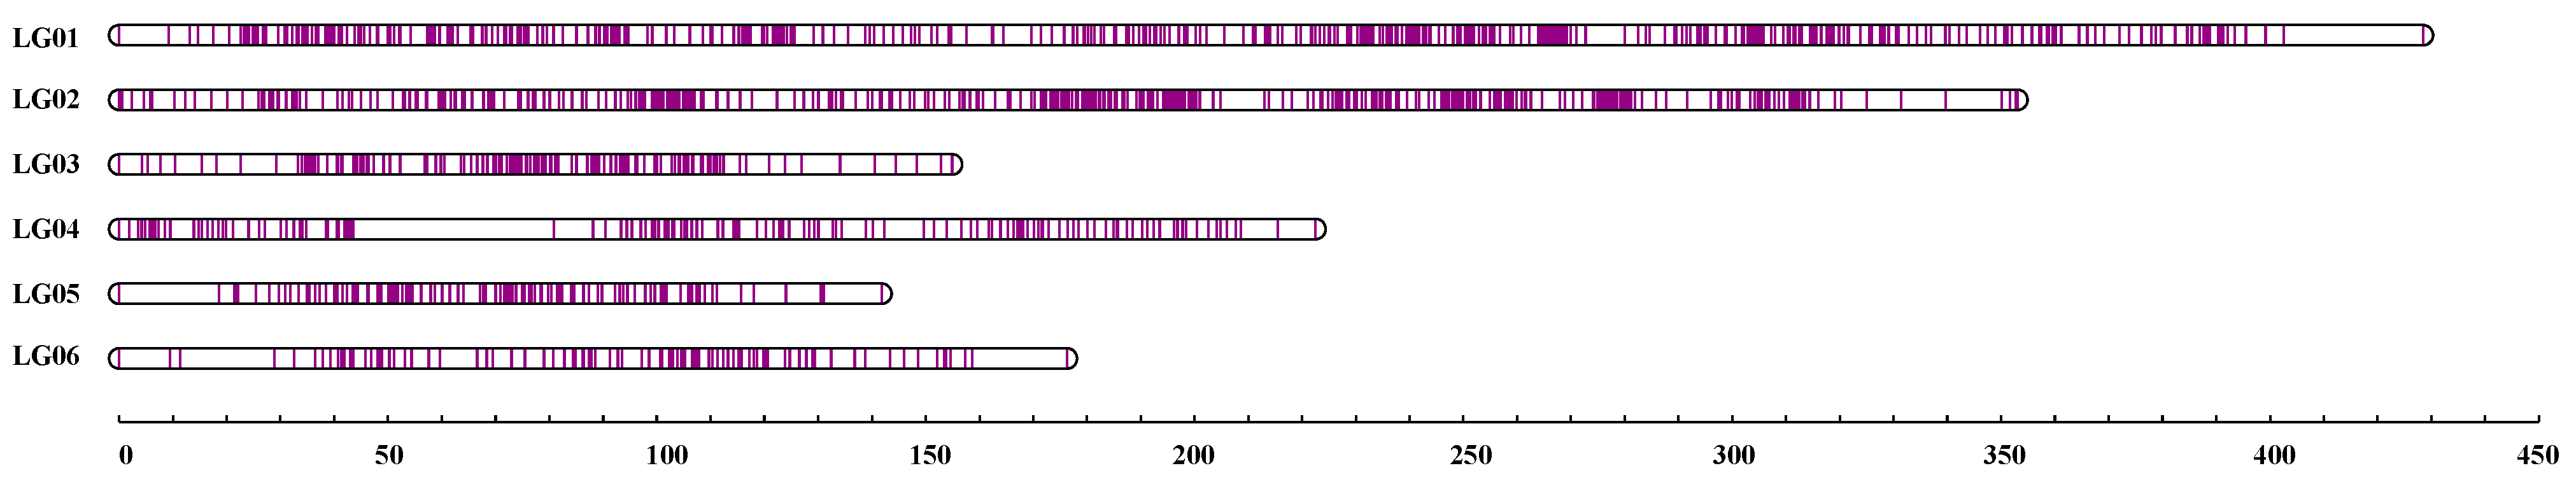
3.3. Development of SNP Markers and Construction of a High-Density Genetic Map

GATK software V4.0 was used for SNP detection. After matching, a total of 1,343,915 SNPs were detected between the parent plants. Among them, 849,835 SNPs (63.24%) were transitions, and 494,080 (36.76%) were transversions. There were 160,733 and 689,375 heterozygous SNPs in the female and male parents, accounting for 11.96% and 51.30%, respectively (Table S2). Since the F2 population was derived from the hybridization of two highly homozygous parent plants, and the genotype of the two parents was either aa or bb. The markers with a segregation pattern of aa × bb were selected for the construction of the genetic map in this study. A genetic map consisting of six linkage groups was constructed by calculating the m LOD value between two markers, which contained 1191 SNP markers developed from 1129 ddRAD tags (Table S3), covering a length of 1476.95 cM, with an average distance between markers of 0.74 cM (Table 2, Figure 2). The largest linkage group was LG01, consisting of 729 SNP markers with a length of 428.45 cM; the smallest linkage group was LG06, consisting of 109 SNP markers with a length of 176.28 cM. The maximum gap reflected the uniformity of linkage among the markers on the genetic map, and the smaller the value, the more uniform the map. In this genetic map, the maximum gap was 37.25 cM, located in LG04, and the minimum was 7.16 cM, located in LG03. This result indicates that the distribution of SNPs was not completely uniform, and some chromosomal segments had more SNPs, while others had fewer.

3.4. QTL Mapping for Cotyledon Color of Faba Bean

The CIM program of WinQTL Cart software V2.5 was used to identify the QTL of the cotyledon color trait in faba bean, and QTL segments with LOD values ≥3.0 were selected (Table S4). When a QTL for a trait was detected, if multiple QTL clusters were detected at the same or similar locations, they were called QTL clusters, named ‘QTL-cluster + sequence number’. A total of four QTL clusters for cotyledon color were detected, which were distributed in LG02 and LG04, with LOD values ranging from 3.16 to 26.30, and they had an explained variance rate ranging from 7.90% to 49.40% (Table 3, Figure 3). Among them, QTL-cluster1 located on LG02 contained the most significant SNPs (79), and QTL-cluster3 located on LG04 contained the least significant SNPs (3). Since the green-cotyledon trait in faba bean was controlled by a single gene, the QTL-cluster1 was initially targeted by considering the LOD, explained variance rate, and number of significant SNPs.

3.5. Candidate Regions and Genes for Cotyledon Color

Since cotyledon color was a quality trait, in order to further narrow the QTL interval, a core QTL cluster was screened in the LG02 101.952 cM~115.493 cM (13.541 cM) interval with an LOD = 16.0, which was defined as vfGC. The interval contained 48 SNPs (corresponding to 26 ddRAD tags), LOD values ranged from 16.24 to 26.30, and the explained variance rate was between 34.30% and 49.40%. Subsequently, we blasted the 26 ddRAD tags with the faba bean reference genome (Table S5), and the results showed that 20 tag sequences could be anchored in Chr1L 1,077,051,302 bp to 1,636,400,339 bp (559.35 Mb). To enhance the reliability of the results, we added 100 kb to each of the flanking sequences to obtain a new candidate interval Chr1L 1,076,951,302~1,636,500,339 (559.55 Mb) containing 2021 genes. The gene annotation results showed that Prot-Scriber annotated 1797 genes, accounting for 88.92%, and 224 genes were unannotated; Swiss-Prot annotated 1285 genes, accounting for 63.58%, and 736 genes were unannotated; Mercator4v6.0 annotated 1037 genes, accounting for 51.31%, and 984 genes were not annotated with respect to encoding unknown proteins; 1804 genes were annotated in at least one database, and 217 genes were not annotated in three databases (Table 4). Statistics on the distribution of 2021 genes in metabolic pathways revealed that 1037 genes were involved in 30 metabolic pathways, of which 20 genes were involved in photosynthesis (Table S5), but no genes were annotated for SGR or similar functions.
Therefore, we hypothesized that no SGR or similar genes were identified in the faba bean genome published by Jayakodi et al. [37]. In order to verify our hypothesis, we used the protein sequence of VfSGR obtained by Chen et al. [46] via homologous cloning to blast the “Hedin/2” genome. According to the results, VfSGR belonged to a segment of chr1L, located between Vfaba.Hedin2.R1.1g384160 (chr1L: 1,196,229,405...1,196,230,597) and Vfaba.Hedin2.R1.1g384240 (chr1L: 1,196,898,240...1,196,900,680), yet it has not been anchored to a specific gene sequence on the “Hedin/2” genome (Table 5). This also confirmed the reliability of the mapping results of this study and laid a theoretical foundation for the gene cloning of the green cotyledon color in faba bean.

4. Discussion

4.1. Construction of a High-Density Linkage Map for Faba Bean

We found that faba bean has a large genome (about 13 Gb), which to some extent constrained basic molecular genetic research on it and resulted in fewer genetic maps that could be utilized. Van de Ven et al. [23] constructed the first genetic linkage map of faba bean, which consisted of seven linkage groups (2314 cM) containing seven RFLP markers, three isozyme markers, three RAPD markers, and four morphological markers. Subsequently, researchers from various countries constructed genetic linkage maps of faba bean based on RAPD and SSR markers, respectively, which improved the quality of the maps and the number of markers to a certain extent, but there were more linkage groups, and the average distance was larger [47,48,49,50,51]. With the rapid development of biotechnology, SNP markers were quickly applied to the construction of a genetic map of faba bean. Kaur et al. [52] utilized transcriptome sequencing to genotype RILs and constructed a genetic linkage map that contained 687 SNP markers (1403.8 cM) and six linkage groups and had an average distance of 2.04 cM. Subsequently, with the help of map integration, the number of markers, map length, and the average distance of the genetic map were improved to different degrees, which greatly contributed to the excellent gene mapping [53,54,55]. Recently, Lou et al. [56] and Zhang et al. [57] constructed genetic linkage maps containing 3012 SNP markers with a coverage length of 4089.13 cM and an average distance of 1.36 cM and 947 SNP markers with a coverage length of 1395.2 cM and an average distance of 1.5 cM, respectively. The high-density maps were mostly constructed by integrating maps, and the maps constructed using a single population had deficiencies in the number of markers, coverage length, and average distance and were not widely used.
The genetic linkage map constructed based on ddRAD-seq in this study contains 1991 SNP markers, covering a length of 1476.95 cM and an average distance of 0.74 cM. The average distance was smaller than that of 1.36 cM constructed by Lou et al. [56] and 1.5 cM constructed by Zhang et al. [57], and it remains the smallest average distance among markers constructed using a single population. However, the population used for the construction of the genetic linkage map in this study differed significantly from that of populations constructed by other researchers, making the integration of the subsequent maps a big obstacle. In addition, the genome of faba bean is huge, and it is necessary to continue to improve the density of genetic linkage maps in order to carry out research on QTL localization, gene cloning, and molecular marker-assisted selection breeding in faba bean.

4.2. Identification of QTL for Green-Cotyledon Trait in Faba Bean

Cotyledon color is an important morphological marker and evolutionary trait of faba bean, playing an important role in the identification of variety purity, the determination of the outcrossing rate, the screening of F1 generation hybrids, and the measurement of nutritional quality. Green cotyledons were rich in anthocyanins, chlorophyll, and alkaloids and especially mineral elements (P, Mg, Fe, Zn, and Mn content), protein, and other nutrients. The content of protein in the green-cotyledon type plants was higher than that of the yellow-cotyledon type [58,59], which indicates that green-cotyledon varieties are more marketable. In 1994, a faba bean germplasm resource with a green cotyledon and stable inheritance was found in a landrace in Yunnan, China, and the inheritance information indicated that the green-cotyledon trait was controlled by a pair of recessive nuclear genes [60], a result consistent with the results of this study. The formation of a green cotyledon in faba bean was due to the blockage of chlorophyll degradation during the seed maturation stage.
SGR has been shown to be a key gene involved in chlorophyll degradation, encoding a Mg-chelatase, and the mutation of this gene results in the blockage of chlorophyll degradation, which leads to the retention of the green coloration of the plant seeds for a longer period of time and the production of a green cotyledon [15]. There is very little information about the localization of green-cotyledon genes in faba bean: Sha [6] obtained nine SSR markers related to cotyledon color traits in an F2 population using the BSA method and initially localized the green-cotyledon gene to LG5 but did not obtain any candidate genes. Chen et al. [46] used the protein sequence encoded by the pea cotyledon color gene SGR to blast the transcriptome sequence of faba bean, and they obtained the sequence of the homologous gene VfSGR of faba bean, which confirmed that VfSGR was related to the senescence and chlorophyll degradation of faba bean. A dCAPS marker (dCAPS-VfSGR) was developed and verified that the marker was closely linked to the cotyledon color trait of faba bean. The results of dCaps marker analysis further indicated that VfSGR was the key candidate gene that controls the color of the cotyledons of faba bean. On the other hand, this dCAPS marker could be used as an effective tool in selecting green cotyledon varieties of faba bean through back-cross breeding because the recessive mutant vfsgr in heterozygous yellow-cotyledon seeds could not be selected using visual observation.
In this study, a high-density linkage map was constructed based on ddRAD-seq to search for the green-cotyledon gene of faba bean in the area from Chr1L 1,076,951,302 to 1,636,500,339 (559.55 Mb), which contained 2021 genes, 20 of which were involved in photosynthesis, but no SGR or genes with similar functions were identified. Meanwhile, the VfSGR in faba bean obtained by Chen et al. [46] through homologous cloning was also anchored from Chr1L 1,076,951,302 to 1,636,500,339, but not to specific gene, which confirmed the reliability of the localization results in this study. In the future, we can continue to develop polymorphic SSR or InDel (Insertion/Deletion) markers within the candidate regions to further narrow down the localization intervals, thereby facilitating the mining of target genes. At the same time, it is also essential to consider high-quality reference genomes.
Nevertheless, the functional explanation of the green-cotyledon gene is still insufficient, as it is still unclear how the 20 genes associated with photosynthesis in this region contribute to the green-cotyledon feature. This process may involve more unidentified genes or regulatory components, which calls for more research and analysis. In the future, we can mine the green-cotyledon genes in faba bean by using multi-omics technologies such as transcriptomics, metabolomics, and genomes. This method will enable a thorough examination of the molecular processes underlying the regulation of cotyledon color and chlorophyll degradation. We can build an entire regulatory network by identifying the genes and proteins that interact with these processes. The resulting thorough comprehension will offer a more robust theoretical foundation and technological tools for faba bean variety improvement.

5. Conclusions

In this study, a high-density linkage map was constructed for the first time by using the ddRAD-seq technique, and a QTLcluster vfGC was localized at LG02. This cluster could explain 34.30% to 49.40% of the variance contribution in the green-cotyledon trait, corresponding to Chr1L 1,076,951,302 to 1,636,500,339 (559.55 Mb) with 2021 genes, 20 of which were involved in photosynthesis, but no SGR or genes with similar functions were identified. Meanwhile, this study also confirmed that VfSGR, which was obtained via homologous cloning by the previous authors, was also located in the region from Chr1L 1,076,951,302 to 1,636,500,339, demonstrating the reliability of our results. This study provides theoretical support for the map cloning of candidate genes regulating the green-cotyledon trait in faba bean. However, due to the large number of candidate genes in the interval focused on in this study, further in-depth research is needed to reveal the mechanism of green-cotyledon formation in faba bean.

Supplementary Materials

The following supporting information can be downloaded at https://www.mdpi.com/article/10.3390/agronomy15010193/s1. Table S1: Statistics of sequencing data and ddRAD tags in different samples. Table S2: Data statistics of ddRAD tags. Table S3: Distribution of 1191 SNP markers in ddRAD tags. Table S4: QTL analysis of cotyledon color in faba bean. Table S5: The results of 26 ddRAD tags blasted with the faba bean reference genome. Table S6: Statistics of annotation analysis of 2021 genes.

Author Contributions

Conceptualization, C.T and Y.L; formal analysis, X.Z., W.H., and P.L.; writing—original draft preparation, C.T. and H.Z.; writing—review and editing, C.T., H.Z., and Y.L. All authors have read and agreed to the published version of the manuscript.

Funding

This research was funded by the High-Density Genetic Map Construction and Closely Interlinked Markers Development for Growth Habit in Faba Bean (2020-ZZ-02), the Thousand Talents Program for High-end Innovation Talents of Qinghai Province (2016), the Genetic Analysis and Regulation Mechanism of Different Flower Colors in Faba Bean (2021-NKY-04), the Laboratory for Research and Utilization of Qinghai Tibet Plateau Germplasm Resources (2022-ZJ-Y01), and China Agriculture Research System of MOF and MARA—Food Legumes (CARS-08).

Data Availability Statement

The original contributions presented in this study are included in the article and Supplementary Material. Further inquiries can be directed toward the corresponding author.

Acknowledgments

The authors would like to express their gratitude to EditSprings (https://www.editsprings.cn, accessed on 29 October 2024) for the expert linguistic services provided.

Conflicts of Interest

The authors declare no conflicts of interest.

References

  1. Luo, Y.W.; Li, J. Soluble sugars and myo-inositol phosphates during germination and seedling growth of green and white faba bean (Vicia faba L.). Legume Res. 2017, 40, 47–54. [Google Scholar] [CrossRef]
  2. Landry, E.J.; Fuchs, S.J.; Hu, J.G. Carbohydrate composition of mature and immature faba bean seeds. J. Food Compos. Anal. 2016, 50, 55–60. [Google Scholar] [CrossRef]
  3. Chen, X.Z. Variety Annals of Food Legumes in China, 2nd ed.; Science Press: Beijing, China, 2023; pp. 294–353. ISBN 9787030740120. [Google Scholar]
  4. Ma, J.R.; Jia, X.L.; Guo, Y.P.; Li, L.; Zhang, L.S. A new green cotyledon variety of spring faba bean—‘Lincan No.11’. China Seed Ind. 2016, 2, 71. (In Chinese) [Google Scholar]
  5. Guo, X.L.; Liu, Y.J.; Duo, X.L. A green cotyledon and suitable for processing faba bean variety—‘Qingcan No.19’. China Seed Ind. 2022, 1, 102–103. (In Chinese) [Google Scholar]
  6. Sha, W.C. Study on SSR Markers of Cotyledon Colour Traits in Faba Bean. Master’s Thesis, Qinghai University, Xining, China, 2017. (In Chinese). [Google Scholar]
  7. Ronning, C.M.; Bouwkamp, J.C.; Solomos, T. Observations on the senescence of a mutant non-yellowing genotype of Phaseolus vulgaris L. J. Exp. Bot. 1991, 42, 235–241. [Google Scholar] [CrossRef]
  8. Thomas, H.; Schellenberg, M.; Vicentini, F.; Matile, P. Gregor Mendel’s green and yellow pea seeds. Bot. Acta 1996, 109, 3–4. [Google Scholar] [CrossRef]
  9. Zhou, C.; Han, L.; Pislariu, C.; Nakashima, J.; Fu, C.; Jiang, Q.; Quan, L.; Blancaflor, E.B.; Tang, Y.; Bouton, J.H.; et al. From model to crop: Functional analysis of a STAY-GREEN gene in the model legume Medicago truncatula and effective use of the gene for alfalfa improvement. Plant Physiol. 2011, 157, 1483–1496. [Google Scholar] [CrossRef]
  10. Guiamét, J.J.; Schwartz, E.; Pichersky, E.; Noodén, L.D. Characterization of cytoplasmic and nuclear mutations affecting chlorophyll and chlorophyll-binding proteins during senescence in soybean. Plant Physiol. 1991, 96, 227–231. [Google Scholar] [CrossRef]
  11. Guiamet, J.J.; Giannibelli, M.C. Nuclear and cytoplasmic “stay-green” mutations of soybean alter the loss of leaf soluble proteins during senescence. Physiol. Plant. 1996, 96, 655–661. [Google Scholar] [CrossRef]
  12. Kohzuma, K.; Sato, Y.; Ito, H.; Okuzaki, A.; Watanabe, M.; Kobayashi, H.; Nakano, M.; Yamatani, H.; Masuda, Y.; Nagashima, Y.; et al. The non-Mendelian green cotyledon gene in soybean encodes a small subunit of photosystem II. Plant Physiol. 2017, 173, 2138–2147. [Google Scholar] [CrossRef]
  13. Zhang, H.S.; Cheng, Y.X.; Wang, D.Q.; Xiang, S.H.; Gao, M.; Wang, X.F.; Niu, J.G. Correlation analysis of variation in chlorophyll content and yield in pod period of soybean. Soybean Sci. 2011, 4, 275–279. (In Chinese) [Google Scholar]
  14. Hörtensteiner, S. Update on the biochemistry of chlorophyll breakdown. Plant Mol. Biol. 2012, 82, 505–517. [Google Scholar] [CrossRef] [PubMed]
  15. Shi, D.Y.; Liu, Z.X.; Jin, W.W. Biosynthesis, catabolism and related signal regulations of plant chlorophyll. Hereditas 2009, 31, 698–704. [Google Scholar] [CrossRef]
  16. Sato, Y.S.; Morita, R.; Katsuma, S.; Nishimura, M.; Tanaka, A.; Kusaba, M. Two short-chain dehydrogenase/reductases, NON-YELLOW COLORING 1 and NYC1-LIKE, are required for chlorophyll b and light-harvesting complex II degradation during senescence in rice. Plant J. 2009, 57, 120–131. [Google Scholar] [CrossRef] [PubMed]
  17. Sato, Y.; Morita, R.; Nishimura, M.; Yamaguchi, H.; Kusaba, M. Mendel’s green cotyledon gene encodes a positive regulator of the chlorophyll-degrading pathway. Proc. Natl. Acad. Sci. USA 2007, 104, 14169–14174. [Google Scholar] [CrossRef] [PubMed]
  18. Yadava, Y.K.; Chaudhary, P.; Yadav, S.; Rizvi, A.H.; Kumar, T.; Srivastava, R.; Soren, K.R.; Bharadwaj, C.; Srinivasan, R.; Singh, N.K.; et al. Genetic mapping of quantitative trait loci associated with drought tolerance in chickpea (Cicer arietinum L.). Sci. Rep. 2023, 13, 17623. [Google Scholar] [CrossRef] [PubMed]
  19. Li, J.S.; Gong, D.; Wang, S.H.; Chen, H.L.; Chen, X.Z.; Xiong, T.; Wang, L.X. Construction of SNP high-density genetic map and QTL analysis of agronomic traits in cowpea (Vigna unguiculata (L.) Walp.). Acta Agron. Sin. 2022, 48, 2475–2482. (In Chinese) [Google Scholar]
  20. Chen, T.X.; Hu, L.L.; Wang, S.H.; Wang, L.X.; Cheng, X.Z.; Chen, H.L. Construction of high-density genetic map and identification of a bruchid resistance locus in mung bean (Vigna radiata L.). Front. Genet. 2022, 13, 903267. [Google Scholar] [CrossRef] [PubMed]
  21. Li, X.M.; Tang, Y.S.; Wang, L.F.; Chang, Y.J.; Wu, J.; Wang, S.M. QTL mapping and identification of genes associated with the resistance to Acanthoscelides obtectus in cultivated common bean using a high-density genetic linkage map. BMC Plant Biol. 2022, 22, 260–274. [Google Scholar] [CrossRef]
  22. Johnston, J.S.; Bennett, M.D.; Rayburn, A.L.; Galbraith, D.W.; Price, H.J. Reference standards for determination of DNA content of plant nuclei. Am. J. Bot. 1999, 86, 609–613. [Google Scholar] [CrossRef] [PubMed]
  23. van de Ven, W.T.G.; Waugh, R.; Duncan, N.; Ramsay, G.; Dow, N.; Powell, W. Development of a genetic linkage map in Vicia faba using molecular and biochemical techniques. Asp. Appl. Biol. 1991, 27, 49–54. [Google Scholar]
  24. Satovic, Z.; Avila, C.M.; Cruz-Izquierdo, S.; Díaz-Ruíz, R.; García-Ruíz, G.M.; Palomino, C.; Gutiérrez, N.; Vitale, S.; Ocaña-Moral, S.; Gutiérrez, M.V.; et al. A reference consensus genetic map for molecular markers and economically important traits in faba bean (Vicia faba L.). BMC Genom. 2013, 14, 932–946. [Google Scholar] [CrossRef] [PubMed]
  25. Webb, A.; Cottage, A.; Wood, T.A.; Khamassi, K.; Hobbs, D.H.; Gostkiewicz, K.; White, M.P.; Khazaei, H.; Ali, M.; Street, D.; et al. A SNP-based consensus genetic map for synteny-based trait targeting in faba bean (Vicia faba L.). Plant Biotechnol. J. 2015, 14, 177–185. [Google Scholar] [CrossRef]
  26. Hou, W.W.; Zhang, X.J.; Yan, Q.B.; Li, P.; Sha, W.C.; Tian, Y.Y.; Liu, Y.J. Linkage map of a gene controlling zero tannins (zt-1) in faba bean (Vicia faba L.) with SSR and ISSR markers. Agronomy 2018, 8, 80. [Google Scholar] [CrossRef]
  27. El-Rodeny, W.M.; Kimura, M.; Hirakawa, H.; Sabah, A.; Shirasawa, K.; Sato, S.; Tabata, S.; Sasamoto, S.; Watanabe, A.; Kawashima, K.; et al. Development of EST-SSR markers and construction of a linkage map in faba bean (Vicia faba). Breed. Sci. 2014, 64, 252–263. [Google Scholar] [CrossRef]
  28. Zhao, N.; Xue, D.; Miao, Y.M.; Wang, Y.Q.; Zhou, E.Q.; Zhou, Y.; Yao, M.N.; Gu, C.Y.; Wang, K.H.; Li, B.; et al. Construction of a high-density genetic map for faba bean (Vicia faba L.) and quantitative trait loci mapping of seed-related traits. Front. Plant Sci. 2023, 14, 1201103–1201116. [Google Scholar] [CrossRef] [PubMed]
  29. Ma, B.Q.; Liao, L.; Peng, Q.; Fang, T.; Zhou, H.; Korban, S.S.; Han, Y.P. Reduced representation genome sequencing reveals patterns of genetic diversity and selection in apple. J. Integr. Plant Biol. 2017, 59, 190–204. [Google Scholar] [CrossRef] [PubMed]
  30. Peterson, B.K.; Weber, J.N.; Kay, E.H.; Fisher, H.S.; Hoekstra, H.E. Double digest RADseq: An inexpensive method for de novo SNP discovery and genotyping in model and non-model species. PLoS ONE 2012, 7, e37135. [Google Scholar] [CrossRef]
  31. Yol, E.; Basak, M.; Kızıl, S.; Lucas, S.J.; Uzun, B. A high-density SNP genetic map construction using ddRAD-Seq and mapping of capsule shattering trait in sesame. Front. Plant Sci. 2021, 12, 679659–679671. [Google Scholar] [CrossRef]
  32. Wang, G.P.; Lai, H.; Bi, S.; Guo, D.L.; Zhao, X.P.; Chen, X.L.; Liu, S.; Liu, X.G.; Su, Y.Q.; Yi, H.D.; et al. ddRAD-Seq reveals evolutionary insights into population differentiation and the cryptic phylogeography of Hyporhamphus intermedius in Mainland China. Ecol. Evol. 2022, 12, e9053. [Google Scholar] [CrossRef]
  33. Zhu, H.; Liu, J.; Gao, M.R.; Yue, C.L.; Li, H.P. Population genetic assessment of Viburnum japonicum in China using ddRAD-seq. Front. Genet. 2023, 14, 1150437–1150444. [Google Scholar] [CrossRef]
  34. Liu, Y.; Zhou, X.M.; Yan, M.; Wang, P.F.; Wang, H.; Xin, Q.; Yang, L.Y.; Hong, D.F.; Yang, G.S. Fine mapping and candidate gene analysis of a seed glucosinolate content QTL, qGSL-C2, in rapeseed (Brassica napus L.). Theor. Appl. Genet. 2019, 133, 479–490. [Google Scholar] [CrossRef]
  35. Luo, H.Y.; Guo, J.B.; Yu, B.; Chen, W.G.; Zhang, H.; Zhou, X.J.; Chen, Y.N.; Huang, L.; Liu, N.; Ren, X.P.; et al. Construction of ddRADseq-based high-density genetic map and identification of quantitative trait loci for trans-resveratrol content in peanut seeds. Front. Plant Sci. 2021, 12, 644402–644412. [Google Scholar] [CrossRef] [PubMed]
  36. Armstead, I.; Donnison, I.; Aubry, S.; Harper, J.; Hortensteiner, S.; James, C.; Mani, J.; Moffet, M.; Ougham, H.; Roberts, L.; et al. Cross-species identification of Mendel’s I locus. Science 2007, 315, 73. [Google Scholar] [CrossRef]
  37. Jayakodi, M.; Golicz, A.A.; Kreplak, J.; Fechete, L.I.; Angra, D.; Bednář, P.; Bornhofen, E.; Zhang, H.L.; Boussageon, R.; Kaur, S.; et al. The giant diploid faba genome unlocks variation in a global protein crop. Nature 2023, 615, 652–659. [Google Scholar] [CrossRef] [PubMed]
  38. Liu, D.Y.; Ma, C.X.; Hong, W.G.; Huang, L.; Liu, M.; Liu, H.; Zeng, H.P.; Deng, D.J.; Xin, H.G.; Song, J.; et al. Construction and analysis of high-density linkage map using high-throughput sequencing data. PLoS ONE 2014, 9, e98855. [Google Scholar] [CrossRef]
  39. Jansen, J.; de Jong, A.G.; van Ooijen, J.W. Constructing dense genetic linkage maps. Theor. Appl. Genet. 2001, 102, 1113–1122. [Google Scholar] [CrossRef]
  40. van Ooijen, J.W. Multipoint maximum likelihood mapping in a full-sib family of an outbreeding species. Genet. Res. 2011, 93, 343–349. [Google Scholar] [CrossRef] [PubMed]
  41. van Os, H.; Stam, P.; Visser, R.G.F.; van Eck, H.J. SMOOTH: A statistical method for successful removal of genotyping errors from high-density genetic linkage data. Theor. Appl. Genet. 2005, 112, 187–194. [Google Scholar] [CrossRef]
  42. Huang, X.H.; Zhao, Y.; Wei, X.H.; Li, C.Y.; Wang, A.H.; Zhao, Q.; Li, W.J.; Guo, Y.L.; Deng, L.W.; Zhu, C.R.; et al. Genome-wide association study of flowering time and grain yield traits in a worldwide collection of rice germplasm. Nat. Genet. 2012, 44, 32–39. [Google Scholar] [CrossRef]
  43. Kosambi, D.D. The estimation of map distances from recombination values. Ann. Eugen. 1943, 12, 172–175. [Google Scholar] [CrossRef]
  44. Schwacke, R.; Ponce-Soto, G.Y.; Krause, K.; Bolger, A.M.; Arsova, B.; Hallab, A.; Gruden, K.; Stitt, M.; Bolger, M.E.; Usadel, B. MapMan4: A refined protein classification and annotation framework applicable to multi-omics data analysis. Mol. Plant 2019, 12, 879–892. [Google Scholar] [CrossRef] [PubMed]
  45. Bolger, M.; Schwacke, R.; Usadel, B. MapMan visualization of RNA-seq data using Mercator4 functional annotations. In Solanum Tuberosum: Methods in Molecular Biology; Humana: New York, NY, USA, 2021; pp. 195–212. [Google Scholar] [CrossRef]
  46. Chen, J.B.; Zhou, H.M.; Yuan, X.X.; He, Y.M.; Yan, Q.; Lin, Y.; Wu, R.R.; Liu, J.; Xue, C.C.; Chen, X. Homolog of pea SGR controls Stay-Green in faba bean (Vicia faba L.). Genes 2023, 14, 1030. [Google Scholar] [CrossRef]
  47. Torres, A.M.; Weeden, N.F.; Martín, A. Linkage among isozyme, RFLP and RAPD markers in Vicia faba. Theor. Appl. Genet. 1993, 85, 937–945. [Google Scholar] [CrossRef] [PubMed]
  48. Vaz Patto, M.C.V.; Torres, A.M.; Koblizkova, A.; Macas, J.; Cubero, J.I. Development of a genetic composite map of Vicia faba using F2 populations derived from trisomic plants. Theor. Appl. Genet. 1999, 98, 736–743. [Google Scholar] [CrossRef]
  49. Román, B.; Torres, A.M.; Rubiales, D.; Cubero, J.I.; Satovic, Z. Mapping of quantitative trait loci controlling broomrape (Orobanche crenata Forsk.) resistance in faba bean (Vicia faba L.). Genome 2002, 45, 1057–1063. [Google Scholar] [CrossRef] [PubMed]
  50. Ma, Y.; Bao, S.Y.; Yang, T.; Hu, J.G.; Guan, J.P.; He, Y.H.; Wang, X.J.; Wan, Y.L.; Sun, X.L.; Jiang, J.Y.; et al. Genetic linkage map of Chinese native variety faba bean (Vicia faba L.) based on simple sequence repeat markers. Plant Breed. 2013, 132, 397–400. [Google Scholar] [CrossRef]
  51. Yang, T.; Jiang, J.Y.; Zhang, H.Y.; Liu, R.; Strelkov, S.; Hwang, S.F.; Chang, K.F.; Yang, F.; Miao, Y.M.; He, Y.H.; et al. Density enhancement of a faba bean (Vicia faba) genetic linkage map based on simple sequence repeats markers. Plant Breed. 2019, 138, 207–215. [Google Scholar] [CrossRef]
  52. Kaur, S.; Kimber, R.B.E.; Cogan, N.O.I.; Materne, M.; Forster, J.W.; Paull, J.G. SNP discovery and high-density genetic mapping in faba bean (Vicia faba L.) permits identification of QTLs for ascochyta blight resistance. Plant Sci. 2014, 217–218, 47–55. [Google Scholar] [CrossRef]
  53. Sudheesh, S.; Kimber, R.B.E.; Braich, S.; Forster, J.W.; Paull, J.G.; Kaur, S. Construction of an integrated genetic linkage map and detection of quantitative trait loci for ascochyta blight resistance in faba bean (Vicia faba L.). Euphytica 2019, 215, 42–57. [Google Scholar] [CrossRef]
  54. Carrillo-Perdomo, E.; Vidal, A.; Kreplak, J.; Duborjal, H.; Leveugle, M.; Duarte, J.; Desmetz, C.; Deulvot, C.; Raffiot, B.; Marget, P.; et al. Development of new genetic resources for faba bean (Vicia faba L.) breeding through the discovery of gene-based SNP markers and the construction of a high-density consensus map. Sci. Rep. 2020, 10, 6790–6803. [Google Scholar] [CrossRef] [PubMed]
  55. Li, M.W.; He, Y.H.; Liu, R.; Li, G.; Wang, D.; Ji, Y.S.; Yan, X.; Huang, S.X.; Wang, C.Y.; Ma, Y.; et al. Construction of SNP genetic maps based on targeted next-generation sequencing and QTL mapping of vital agronomic traits in faba bean (Vicia faba L.). J. Integr. Agric. 2023, 22, 2648–2659. [Google Scholar] [CrossRef]
  56. Lou, S.B.; Teng, C.C.; Hou, W.W.; Zhou, X.L.; Zhang, H.Y.; Liu, Y.J. Quantitative trait loci mapping of first pod height in faba bean based on genotyping-by-sequencing (GBS). Agronomy 2024, 14, 2013. [Google Scholar] [CrossRef]
  57. Zhang, H.L.; Fechete, L.I.; Himmelbach, A.; Poehlein, A.; Lohwasser, U.; Börner, A.; Maalouf, F.; Kumar, S.; Khazaei, H.; Stein, N.; et al. Optimization of genotyping-by-sequencing (GBS) for germplasm fingerprinting and trait mapping in faba bean. Legume Sci. 2024, 6, e254. [Google Scholar] [CrossRef]
  58. Yang, Y.Z.; Gu, Z.C.; Yang, L.M. Cultivation techniques of ‘Touxinlv’ broad bean in Baoshan. Rural. Pract. Sci. Technol. 2006, 6, 16. (In Chinese) [Google Scholar]
  59. Xu, J.; Liu, G.; Ou, Q.H.; Zhao, S.Q.; Ren, J.; Hu, X.F. Infrared spectrum analysis and elements determination of broad bean of different colors. Hubei Agric. Sci. 2015, 54, 3244–3247. (In Chinese) [Google Scholar]
  60. Duc, G.; Moussy, F.; Zong, X.X.; Ding, G. Single gene mutation for green cotyledons as a marker for the embryonic genotype in faba bean, Vicia faba. Plant Breed. 1999, 118, 577–578. [Google Scholar] [CrossRef]
Figure 1. Cotyledon colors of the hybrid parents: (A) the cotyledon color of Qingcan 16; (B) the cotyledon color of Qingcan 17.
Agronomy 15 00193 g001
Figure 2. High-density genetic linkage map of faba bean (Vicia faba L.) based on ddRAD markers. Note: X-axis represents genetic distance (cM); Y-axis represents linkage groups; purple is a valid SNP marker.
Agronomy 15 00193 g002
Figure 3. Linkage map locations of QTL for cotyledon color in faba bean.
Agronomy 15 00193 g003
Table 1. Genetic segregation of cotyledon color of individual plants.
GenerationTotal of PlantsCotyledon ColorExpected RatioObserved Ratio χ 2
YellowGreen
P125250 -
P220020 -
F132320 -
F2180137433:1137:430.1185
BC1P119190 -
BC1P24223191:123:190.381
Note: Value χ 2 > χ 2 0.05 = 3.841 represents significant difference.
Table 2. Basic information statistics for faba bean genetic map.
LGNo. of MarkersDistance (cM)Average Distance (cM)No. of Gaps
(<5 cM)
Max. Gap (cM)
LG01729428.450.59425.91
LG02613353.050.58410.4
LG03213154.910.7337.16
LG04189222.51.18537.25
LG05138141.771.03418.62
LG06109176.281.63417.65
Total19911476.950.7424
Table 3. Distribution of QTL clusters for cotyledon color in F2 populations (LOD≥3.0).
LGQTL ClustersNo. of SNPs2-LOD Confidence IntervalLODAddDomExpl. (%)
Left-Side
Marker Name
(Position/cM)
Right-Side
Marker Name
(Position/cM)
LG02QTL-cluster179un_106165709 (86.132)un_7144751 (130.042)3.20~26.300.2629~0.7278−0.6547~−0.21547.90–49.40
LG04QTL-cluster24un_29953217 (24.058)un_109876029 (27.159)3.16~3.640.2914~0.3383−0.5922~−0.53487.90–9.00
LG04QTL-cluster33un_2266011 (38.537)un_109876101 (38.838)3.510.3317−0.49858.7
LG04QTL-cluster422un_51389317 (88.124)un_102388622 (103.219)3.19~5.600.3095~0.3642−0.3207~−0.11967.90–13.50
Note: LG, Add, Dom, and Expl. are abbreviations for linkage group, additive effect, dominance effect, and explained variance, respectively.
Table 4. Statistics of gene annotations.
DatabaseFunctional GenesUnknown Genes
Prot-Scriber1797224
Swiss-Prot1285736
Mercator4v6.01037984
Prot-Scriber ∪ Swiss-Prot ∪ Mercator4v6.01804217
Table 5. Location of VfSGR in the genome of “Hedin/2” determined via tblastn.
ChromosomePercentage of Identical MatchesAlignment LengthStartEndE-ValueBit Score
Chr1L61.9832421,196,354,9631,196,355,6883.95 × 10−78264
Chr1L98.0771041,196,354,4061,196,354,7173.79 × 10−62218
Chr1L48.276581,237,744,6601,237,744,8241.15 × 10−657
Chr253.12564792,668,091792,668,2738.69 × 10−1272.4
Chr246.9888374,072,56574,072,8041.46 × 10−965.9
Chr249.2967174,137,27774,137,4801.98 × 10−965.5
Chr251.0249792,667,442792,667,5885.85 × 10−758.2
Chr248.33360792,668,407792,668,5861.54 × 10−656.6
Chr547.88771181,755,951181,756,1543.12 × 10−964.7
Chr546.47971181,777,262181,777,4655.22 × 10−861.2
Chr541.77279531,003,825531,004,0527.14 × 10−860.8
Chr446.154781,390,849,9931,390,850,2173.59 × 10−964.7
Chr447.887711,390,761,3331,390,761,5363.72 × 10−964.7
Chr443.03879969,946,743969,946,9701.22 × 10−863.2
Chr447.14370970,018,899970,019,0992.56 × 10−759.3
Chr447.14370970,038,677970,038,8772.56 × 10−759.3
Chr440.506791,225,324,6091,225,324,8364.32 × 10−758.5
Chr440.506791,225,303,9841,225,304,2112.01 × 10−656.6
Chr647.887711,140,361,2211,140,361,4241.12 × 10−863.2
Chr647.887711,140,342,9931,140,343,1961.63 × 10−862.8
Chr647.059511,445,004,9901,445,005,1423.71 × 10−552.8
Chr346.47971920,577,449920,577,6527.75 × 10−860.8
Chr342.25471920,556,707920,556,9191.11 × 10−657.4
Chr341.77279764,135,754764,135,9811.15 × 10−760.1
Chr241.772791,209,841,4311,209,841,6581.60 × 10−759.7
Chr552.083481,237,512,3701,237,512,5134.90 × 10−449.3
Disclaimer/Publisher’s Note: The statements, opinions and data contained in all publications are solely those of the individual author(s) and contributor(s) and not of MDPI and/or the editor(s). MDPI and/or the editor(s) disclaim responsibility for any injury to people or property resulting from any ideas, methods, instructions or products referred to in the content.

