Abstract
The domestication and breeding of wheat genotypes through the years has led to the loss in their genetic variation, making them more prone to different abiotic stresses. Boron (B) toxicity is one of the stresses decreasing the wheat cultivars’ yield in arid and semi-arid regions around the world. Wild wheat progenitors, such as Triticum urartu Thumanian ex Gandilyan, possess a broader gene pool that harbors several genes conferring tolerance to various biotic and abiotic stresses. Unfortunately, T. urartu is not well-explored at the molecular level for its tolerance towards B toxicity in soil. In this study, for the first time, we compared the transcriptomic changes in the leaves of a high B-tolerant T. urartu genotype, PI662222, grown in highly toxic B (10 mM B in the form of boric acid) with the ones grown in the control (3.1 μM B) treatment in hydroponic conditions. The obtained results suggest that several mechanisms are involved in regulating the response of the studied T. urartu genotype toward B toxicity. All the growth parameters of T. urartu genotype, including root–shoot length, root fresh weight, and root–shoot dry weight, were less affected by high boron (10 mM) as compared to the boron-tolerant bread wheat cultivar. With a significant differential expression of 654 genes, 441 and 213 genes of T. urartu genotype were down- and upregulated, respectively, in the PI662222 leaves in high B in comparison to the control treatment. While key upregulated genes included those encoding RNA polymerase beta subunit (chloroplast), ATP synthase subunit gamma, chloroplastic, 60S ribosomal protein, and RNA-binding protein 12-like, the main downregulated genes included those encoding photosystem II protein D, ribulose bisphosphate carboxylase small subunit, and peroxidase 2-like. Interestingly, both Gene Ontology enrichment and KEGG pathways emphasized the possible involvement of the genes related to the photosynthetic process and apparatus in the high B tolerance of the T. urartu genotype. The further functional characterization of the identified potential T. urartu genes will facilitate their utilization in crop improvement programs for B toxicity stress.
1. Introduction
To feed the world population in 2050, world food production must increase by approximately 70%. As one of the three predominant cereal crops, wheat represents the most extensively cultivated cereal grain on a global scale, constituting approximately one-third of the worldwide cereal output. It occupies a critical position in the maintenance of global food and nutritional security, contributing approximately one-fifth of the worldwide caloric intake and protein sources. [1]. Global wheat production was recorded to be over 781 million metric tons in the marketing year 2022–2023. However, based on the current population growth, an added 132 million metric tons per year is required by 2050 to fulfill the wheat consumption needs. Unfortunately, agriculture suffers from various climate change-related environmental concerns. Wheat productivity is threatened by the unpredictable frequency of acute climatic events, such as drought, heat, salinity, high CO2, and nutritional deficiencies or toxicities [2]. The adverse effects of these factors on the global wheat economy and wheat quality and yield are a major concern for several wheat breeders [3].
In soil, mobile boron (B) exists in the form of boric acid and borates. Boron enters into plants and then passes through the phospholipid membrane to become distributed [4,5]. While passive diffusion is the method of B entry into plants at normal to high B concentrations, boric acid channels and borate exporters are required to facilitate its movement under low B supply [5,6,7]. Boron transporters participate significantly in the exclusion of boron from various tissues under conditions characterized by boron toxicity during growth [8]. The uptake of boron and its subsequent loading into the xylem are governed by the channels and transporters located in the root system, whereas the regulation of intracellular boron levels within these tissues is modulated by transporters found in seeds and anthers [9,10]. Aquaporins, especially nodulin-26-like intrinsic proteins (NIPs), actively participate in regulating B transport in plants. These maintain B homeostasis by facilitating B permeation across cell membranes in its molecular form as boric acid [11]. A decrease in the expression levels of specific aquaporins under B toxicity increases the tolerance of plants towards a high B supply [12,13]. As B mostly moves across the xylem due to transpirational force, it becomes accumulated at the tips of the leaves and leads to the chlorosis and necrosis of the edges of the mature leaves when present in excess [14]. In roots, B toxicity has a diminishing effect on length [15]. B toxicity disturbs the physiological and molecular mechanisms in plants by impairing antioxidant defense mechanisms, carbohydrate metabolism, cell division, cell wall stability, and photosynthesis [6,16]. Stunted root–shoot development, nutrient imbalance, and the necrosis of leaf tips are some of the observable symptoms of excessive B supply [17,18]. Though B deficiency in the soil can be handled up to a certain extent by the application of fertilizers, the handling of B toxicity is difficult as the artificial leaching of B toxic soils at a large scale is not realistic [19]. Hence, it is crucial to develop B toxicity-tolerant genotypes that can be grown in these high B-affected regions.
Boron (B) toxicity in the soil represents a significant abiotic stressor that adversely impacts wheat production globally, particularly within arid and semi-arid agricultural zones [20]. Nations including Turkey, Syria, Serbia, Russia, Peru, Pakistan, Morocco, Mexico, Malaysia, Libya, Jordan, Italy, Israel, Iraq, India, Hungary, Egypt, Chile, Australia, and the United States are documented as experiencing detrimental effects from soil B toxicity [21,22]. In Turkey, 25% of the agricultural soils in the Salihli, Menemen, Bursa Kemalpaşa plains, as well as in the Central Anatolia region and Iğdır plains, which are irrigated by rivers, especially the Gediz and are fed by the Simav Mountains where boron deposits are located, have boron toxicity, causing a loss of around 50% in wheat yield. In dry regions, the B present near the roots cannot be leached due to water deficiency and, thus, becomes accumulated on the top soil, leading to B toxicity symptoms in plants [5].
Due to homogeneity in modern cultivars, wheat wild relatives (WWRs) can serve as an important resource for the introgression of boron toxicity tolerance traits in wheat breeding programs [18]. In order to fully exploit their potential, it is crucial to identify the genes that could be involved in conferring tolerance to increased levels of boron. Unfortunately, there exists a paucity of research focused on the assessment of WWRs under B-toxic growing conditions [18,20,23,24]. Triticum urartu Thumanian ex Gandilyan, also known as wild einkorn or red wild einkorn, is a diploid wild wheat species and the A genome donor of durum and bread wheat. It is native to the Fertile Crescent region, which includes modern-day Turkey, Iran, Iraq, and Syria. Several successful attempts of the interspecific crossing of T. urartu with tetraploid and hexaploid wheat genotypes have been previously reported [25], which makes it an even more beneficial candidate for the breeding programs. Interestingly, despite being a potential genetic resource, T. urartu has not been thoroughly studied for boron toxicity tolerance to date. Thus, aiming to fill this gap in the literature, we successfully identified a T. urartu genotype, PI662222, that exhibits a high tolerance to boron following an extensive screening of over 150 accessions involving several wild and neglected wheat species.
Furthermore, we developed the hypothesis that the genes expressing differentially under boron toxicity can possibly be involved in providing tolerance to the identified boron-tolerant T. urartu genotype. Consequently, in this study, for the first time, we conducted the transcriptome analysis of the leaves of the boron-tolerant T. urartu genotype (PI662222) to identify the genes that are differentially expressed under high boron (10 mM boron) as compared to the control (3.1 μM B) treatment.
2. Materials and Methods
2.1. Plant Material, B Toxicity Treatment, and Measurement of Growth Parameters
Initially, in a thorough screening, the boron toxicity tolerance of 158 accessions comprising wild and neglected wheat species was compared with that of the well-known B-tolerant bread wheat (Triticum aestivum L.) cultivar Bolal-2973. Bolal-2973 is a Turkish bread wheat genotype whose B toxicity tolerance has been identified in a number of previous studies [26]. As a result, a high B-tolerant T. urartu genotype (PI662222) that was received from NSGC, USDA (National Small Grains Collection, U.S. Department of Agriculture), was identified. Furthermore, in the year 2021, the experiments were carried out in Selcuk University, Turkey, and seeds of both the accessions (Bolal and PI662222) were kept in dark for 3 days to germinate. After 3 days of growth, when they turned into seedlings, three biological replicates each of the B-tolerant T. urartu and T. aestivum genotypes were transferred to hydroponic pots containing 1/5th Hoagland’s solution. Moreover, after a four-day growth period, during which the plants attained the 3–4-leaf stage, the plants were subjected to a control treatment [1/5th Hoagland with 3.1 μM B] as well as a toxic boron treatment [10 mM B], which persisted for a duration of seven days [17,20,21]. Boron was incorporated into the Hoagland solution in the form of boric acid (H3BO3). The growing conditions within the hydroponic chamber were maintained at a light intensity of 16,000 Lx/day, a temperature of 22 ± 10 °C, a light/dark photoperiod of 16/8 h, and a humidity level ranging from 45% to 55%. The growth parameters of the harvested genotypes, which included shoot length (SL), root length (RL), shoot fresh weight (SFW), root fresh weight (RFW), shoot dry weight (SDW), and root dry weight (RDW), were assessed after the completion of seven days of treatment. Moreover, liquid nitrogen and Rnasezap (Thermo Fisher Scientific Baltics UAB, Vilnius, Lithunia) were used to collect three shoot replicates of the T. urartu genotype from both treatments for molecular analysis, and the samples were stored at −80 °C.
2.2. RNA Extraction, Construction of cDNA Library, and RNA-Sequencing of the Collected Leaf Samples of T. urartu Genotype
A manual RNA extraction protocol utilizing 1000 µL of QIAzol-Lysis Reagent (Qiagen, Hilden, Germany) was implemented to isolate RNAs from the triplicate leaf specimens of the T. urartu genotype PI662222 [22]. The resultant RNA pellet was dissolved in 100 µL of double-distilled nuclease-free water. The RNA integrity score (RIS) values, quantity, and quality of the extracted RNA samples were estimated using the QIAxcel advanced fragment analyzer (Qiagen, Hilden, Germany), nanodrop spectrophotometer (Thermoscientific, Waltham, MA, USA), and 1% agarose gel, respectively. For RNA sequencing, two samples were prepared by mixing equal amounts of RNA from all three biological replicates from the control and high B treatments of the T. urartu PI662222 genotype. The two cDNA libraries were prepared using the RNA samples with RIN values greater than 7 and A260/A280 between 2.0–2.10. The DNBseq platform (MGI Tech, Shenzhen, China) was used to conduct sequencing. Through the utilization of the oligoDT selection methodology, approximately 96 million high-fidelity paired-end reads were generated for each sample, exhibiting over 97% of Q20 bases and exceeding 90% of Q30 bases. For the reference genome mapping and quantification of transcripts, the good quality reads with a phred score >30 from both treatment samples were deployed as clean reads.
2.3. Determining Differentially Expressed Genes
The HISAT2 (Hierarchical Indexing for Spliced Alignment of Transcripts) v2.0.4 and Bowtie2 v2.2.5 software applications were employed to facilitate the alignment of high-quality reads with the T. aestivum reference genome (IWGSC_CS_RefSeq_v2.1) and corresponding reference genes, respectively. The RSEM and Cufflinks v2.2.2 software tools were utilized for the quantification of gene expression for each sample, as well as for the normalization of gene/transcript expression utilizing the FPKM (fragments per kilobase of transcript per million fragments mapped) methodology, respectively. FPKM values provide an idea of the differential fold change in the gene under stressed conditions and FDR (false discovery rate) values, where a higher fold change and significant expression difference are denoted by smaller FDR values. Genes exhibiting an adjusted p-value of ≤0.01, a false discovery rate (FDR) of ≤0.001, and a log2FoldChange of ≥1 were classified as significantly differentially expressed genes (DEGs).
2.4. Functional Annotation, Pathway Enrichment Analysis of DEGs, and DEG-Encoding Transcription Factors
The enrichment analysis identifies the genes that are substantially enriched in a particular pathway, molecular function, or biological process. Through Gene Ontology (GO) enrichment analysis, DEGs with particular biological functions are filtered out and GO functional terms that are significantly enriched in DEGs relative to their genomic background are identified. The enriched GO terms were deemed significantly enriched in DEGs if their Q value (corrected p-value) was less than 0.05. Using KEGG pathway enrichment analysis, the metabolic, signal transduction, or biochemical pathways with a Qvalue ≤ 0.05 were identified as being significantly enriched in DEGs. Additionally, the transcription factors (TFs) that encode DEGS and their family were identified.
2.5. Reverse Transcription and RT-qPCR of RNA Samples Isolated from the Leaves of T. urartu Genotype Grown Under Control and B Toxic Conditions
From the RNA sequencing results, three genes exhibiting significant expression under B toxicity in comparison to the control treatment were chosen at random, and their differential expression was confirmed using RT-qPCR. Target genes were normalized using the glyceraldehyde-3-phosphate dehydrogenase gene (TaGAP) as the internal control [27]. Primers for the chosen genes were created using the NCBI Primer-BLAST program for RT-qPCR. The purified total RNA samples from various biological replicates were reverse-transcribed into cDNA using the Transcriptor First Strand cDNA Synthesis Kit (Roche Diagnostics, Mannheim, Germany) and oligo-dT primers. Once the cDNA samples were diluted to a 1:10 ratio, 100 ng of cDNA, 2 μL (10 μM) of the forward and reverse primers, 8 μL of Maxima Sybr Green qRT-PCR Master mix (Thermo Fisher Scientific Baltics UAB, Vilnius, Lithunia)), and 6 μL of RNase free DEPC-treated water were combined to create a total volume of 20 μL for the qPCR reactions. All qPCR reactions were pre-denatured at 95 °C for 6 min, followed by 35–45 cycles of 95 °C denaturation for 10 s, 45–60 °C annealing for 30 s, and 72 °C extension for 30 s. All of this was conducted with three biological and three technical replicates. Melting curves were then obtained after a gradual heating from 50 °C at 4 °C/s to 95 °C at 0.1 °C/s. Melting curves were used to determine the standard error of mean in the expression of target and reference genes for two treatments, as well as the specificity of the individuals. The Livak and Schmittgen [28] method was used to perform the relative quantification.
3. Results
3.1. Effect of B Toxicity Stress on Physiological Growth of T. urartu PI662222 and T. aestivum Bolal 2973
Root–shoot growth parameters have been largely used to obtain the tolerance level of wheat genotypes under different stresses [26,29]. In this paper, the level of tolerance of the T. urartu genotype PI662222 towards B toxicity stress was compared with that of the high B-tolerant bread wheat genotype Bolal-2973 based on the growth parameters (Table 1 and Table S1). The T. urartu genotype showed less yellowing of leaves than the T. aestivum genotype Bolal 2973 under a high B treatment (Figure S1). Under high B, T. urartu demonstrated an increase of 8% in SL and a decrease of only 28% in RL, whereas Bolal demonstrated a decrease of 28% and 33% in SL and RL, respectively, in comparison to the control treatment (Table 1). In a similar way, under B toxicity stress, Bolal’s shoot fresh weight (SFW) and root fresh weight (RFW) dropped by 23% and 52%, respectively, while T. urartu’s decreased by 33% and 14%. The shoot dry weight (SDW) of T. urartu remained unchanged under high B, but the SDW of Bolal decreased by 1%. Comparing the B-toxic growing conditions to the control treatment, the root dry weight (RDW) of T. urartu and Bolal dropped by 7% and 36%, respectively (Table 1).

Table 1.
Percent changes in growth parameters of the check cultivar T. aestivum genotype, Bolal 2973, and Triticum urartu genotype PI662222 grown in boron (B) toxic (10 mM B) conditions as compared to the control treatment. The minus sign (−) represents the reduction in percentage.
3.2. RNA Sequencing and Genome Mapping of Sequenced Reads
In RNA sequencing, the leaf samples of the T. urartu genotype grown in boron-toxic conditions were compared to the leaf samples of the same genotype grown in the normal boron (control) growing conditions. Thus, two RNA samples were prepared by pooling leaves of 15 plants from three biological replicates of the B-tolerant T. urartu genotype from control and B toxic treatments. The DNBseq platform produced two cDNA libraries from the RNA samples of the control and high B treatments, yielding a total of 135.26 million clean reads with an average of 67 million reads each (Table S2). A total of 12.60 and 12.15 million high-quality clean reads from the two T. urartu libraries were mapped to the T. aestivum reference genome (IWGSC_CS_RefSeq_v2.1), yielding distinct mapping ratios of 4.30 and 4.02%, respectively. The control and high B treatment libraries provided a total of 26,602 and 27,981 genes, as well as 29,378 and 30,744 transcripts, respectively. RNA sequencing provides information on novel genes or transcripts that can be involved in particular stress [30]. A total of 7402 novel transcripts and 2254 novel genes were identified in this study (Table S2).
3.3. Differentially Expressed Genes of T. urartu Leaves Under B-Toxic Growing Conditions
While a total of 32,777 genes were differentially expressed in the two libraries, high B led to significant regulation changes in 654 genes of T. urartu leaves, where 213 genes were upregulated and 441 genes were found to be downregulated (Figure 1).
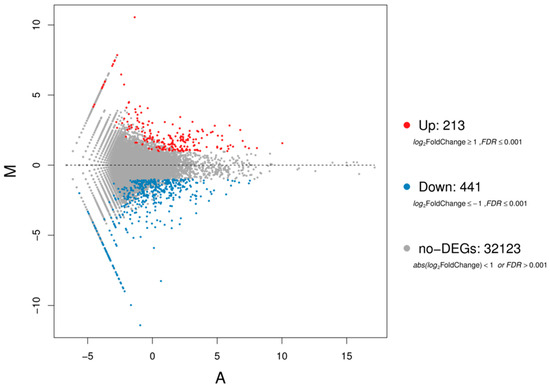
Figure 1.
The MA plot displays genes that are differentially expressed (blue and red dots) in the leaves of the T. urartu (Tu) genotype PI662222 treated with high boron (B) (TB 10 mM) as opposed to 3.1 µM B (control) treatment. The log2-transformed mean expression level is represented by the X-axis (A) and the log2-transformed fold change by the Y-axis (M).
3.4. Functional Classification of Differentially Regulated Genes via Gene Ontology (GO) Enrichment
To determine the most highly regulated pathways under B toxicity stress, the Gene Ontology Enrichment Analysis (molecular function, biological process, and cellular compartment) was conducted on differentially regulated genes (Figure 2 and Figure S2). The DEGs were classified into 20, 3, and 10 categories in biological process, cellular component, and molecular function, respectively. The most prominent GO terms in the biological process were cellular and metabolic processes with 327 and 315 DEGs, respectively (Figure 2). While cellular anatomical entity and intracellular were the most dominant GO terms in cellular components with 392 and 260 DEGs, catalytic activity and binding were dominant in molecular function with 331 and 317 DEGs, respectively (Figure 2).

Figure 2.
Gene Ontology grouping of differentially expressed genes in T. urartu leaves grown in a B toxic environment (10 Mm B) as compared to the control (3.1 μM B) treatment. While the X-axis shows the number of DEGs in different groups, the Y-axis denotes the different Gene Ontology groups.
3.5. KEGG Pathway Enrichment Analysis of Differentially Expressed Genes (DEGs)
Certain biological functions that are facilitated by the typical interaction of genes can be explored by using pathway-based analysis. The Kyoto Encyclopedia of Genes and Genomes (KEGG) database was employed to perform the pathway enrichment analysis of DEGs. Consequently, pathway annotation was observed in 865 DEGs that were grouped into five key classes, including metabolism, genetic information processing, environmental information processing, organismal systems, and cellular processes, with 97 KEGG pathways (Figure S3). The pathways with the highest number of DEGs (Table 2) included metabolic pathways, biosynthesis of secondary metabolites, oxidative phosphorylation, ribosome, and photosynthesis. In Level 2, most of the DEGs were involved in global and overview maps, energy metabolism, translation, and carbohydrate metabolism. The KEGG pathway enrichment showed a maximum enrichment ratio in photosynthesis, followed by oxidative phosphorylation (Figure 3).
Table 2.
The 10 maximum enriched KEGG pathways in the leaves of the T. urartu (Tu) genotype PI662222 grown under B toxicity. Pathway ID is the ID of the pathway. Number of genes is the number of DEGs annotated to a particular pathway.
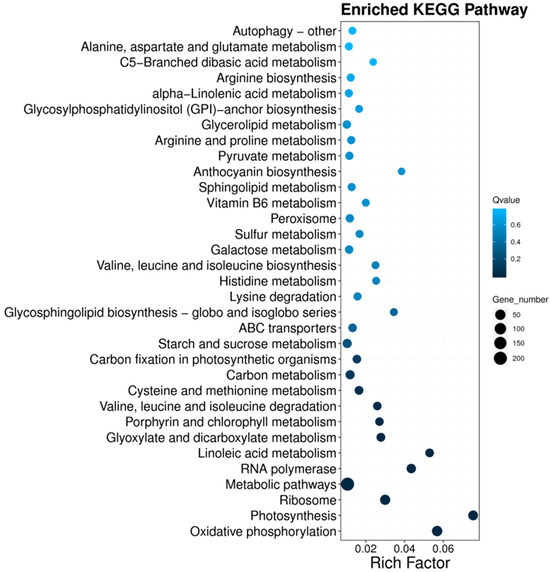
Figure 3.
KEGG pathway functional enrichment of differentially expressed genes of T. urartu leaves under a B-toxic growing environment (10 Mm B) as compared to the control (3.1 μM B) treatment. The enrichment factor is denoted on the X-axis and the name of the pathway is shown on the Y-axis. The significant enrichment is understood by a larger enrichment factor. The point size belongs to the DEG number.
3.6. Transcription Factors Regulating the DEGs
Transcription factors (TFs) bind to particular cis-acting elements of genes and control the expression of those genes. Under B toxicity stress, a number of TFs belonging to 58 TF families showed differential expression in T. urartu leaves when compared to the control treatment. The families MYB, MYB-related, AP2-EREBP, WRKY, bHLH, NAC, FAR1, and C3H had the greatest number of differentially expressed TFs. These gene families are already known for being vast and participating in the regulation of plant responses to different abiotic stresses (Figure 4).

Figure 4.
Transcription factor families of differentially expressed genes of T. urartu leaves under a B-toxic growing environment (10 mM B) as compared to the control treatment (3.1 μM B).
3.7. Validation of RNA-seq Data by RT-qPCR Analysis
The gene expression data obtained from RNA sequencing were validated via the random selection of three genes [TuαDOX-like (TraesCS3B02G549000; α-DOX), TuGDSL-like (TraesCS3B02G219300; GELP), and TuFTSH9-like (TraesCS3B02G252900; FTSH)) and confirming their level of expression via RT-qPCR (Table 3). The relative gene expression of all the genes under high B stress in RT-qPCR analysis was in agreement with the RNA sequencing results (Figure 5).
Table 3.
List of DEGs selected across the T. urartu genotype based on the transcriptome sequencing results for RT-qPCR analysis and sequences of the designed primers.
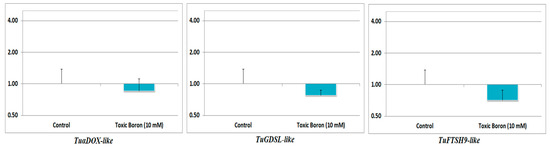
Figure 5.
Relative differential expression of TuαDOX-like, TuGDSL-like, and TuFTSH9-like genes with respect to the reference gene, TaGAP. The values are provided as average expression values of three individual replicates with the standard error mean normalized to the control.
4. Discussion
4.1. Greater B Toxicity Tolerance in T. urartu Genotype PI662222 than T. aestivum Genotype Bolal-2973
B tolerance in plants is widely predicted via changes in their growth parameters under a high B growin environment [5,18,20,26,29]. The T. urartu genotype was less affected by B toxicity in comparison to the T. aestivum genotype Bolal-2973, as it showed less symptoms of chlorosis (Figure S1) and less effect on all the growth parameters other than shoot fresh weight (Table 1). The obtained results are similar to the results of previous studies, where wild or neglected wheat species were found to be less impacted by B toxicity as compared to the check bread wheat genotype [20,22,23,24]. Our results showing a less affected RL of the tolerant T. urartu genotype under B toxicity were similar to those of Schnurbusch et al. [31] and Pallotta et al. [26]. In both of these studies, the root length of the tolerant wheat genotypes was greater than that of the susceptible genotypes and, thus, root length was considered as the potential criteria for boron toxicity tolerance.
B toxicity inhibits the cell division or cell expansion, thus restricting plant growth. It can be proposed that cell division or expansion in T. urartu is less inhibited by high B and, thus, its shoot and root length are also less affected under high B as compared to the bread wheat genotype. Root–shoot dry mass is an important indicator for the selection of tolerant genotypes towards different stresses [20,32]. Similar to our study, the shoot and root dry weights of B-tolerant Aegilops genotypes and neglected wheat species, Triticum zhukovskyi Menabde & Ericzjan were also less affected due to B toxicity as compared to the check wheat cultivar Bolal 2973 [20,22]. The SDW values of both T. urartu and Bolal-2973 were less impacted by B toxicity, even though their RDW dropped at high B. Therefore, regardless of the genotypes’ level of B tolerance, the roots appear to be more adversely impacted by high B than the shoots [22]. This is justified, as roots are the main site of B uptake. Excessive B hinders root cell division and decreases the size of root meristems, thus reducing root growth. Moreover, B toxicity decreases water uptake and its transport from roots to shoots. This declined water transport disturbs the overall plant water balance, leading to reduced transpiration rates and impaired photosynthesis in the shoots. Thus, B toxicity has a systemic nature affecting both the roots and shoots of wheat plants.
4.2. T. urartu Genes Enriched Under B Toxicity Stress via Gene Ontology Enrichment
The functioning of various upregulated and downregulated genes under B toxicity stress in T. urartu via GO enrichment revealed that genes involved in chloroplast and plastid, their thylakoids and thylakoid membranes (GO:0009507; GO:0009536; GO:0055035; GO:0009535; GO:0031976; GO:0009534), cytoplasm (GO:0005737), and ribosome (GO:0005840) were notably enriched in high B stress in cellular components. Genes linked to oxidoreductase activity, operating on NAD(P)H, quinone or a similar chemical as an acceptor (GO:0016655), qui-none binding (GO:0048038), and NADH dehydrogenase (quinone) activity (GO:0050136) were enriched in molecular function. Genes linked to the oxidation–reduction process (GO:0055114), the production of precursor metabolites and energy (GO:0006091), the electron transport chain (GO:0022900), and the reaction to photosynthesis (GO:0015979) were among the enriched genes in the biological process grouping. The most enriched GO terms in downregulated genes were cellular anatomical entity, catalytic activity, binding, cellular process, and metabolic process; in upregulated genes, the most enriched GO terms were cellular anatomical entity, cellular process, metabolic process, and intracellular processes. Similar to our results, catalytic activity was one of the well-represented molecular functions in leaf tissues of bread wheat genotypes under B toxicity in an experiment conducted by Kayihan et al. [27]; however, other molecular functions were different.
4.3. KEGG Pathways Enriched in T. urartu Under B Toxicity
The enriched metabolic pathways in KEGG pathways comprised 62 and 145 significantly up- and downregulated genes in T. urartu leaves under B-toxic growing conditions, respectively (Table 2, Figure 3). The network of indirect protein–protein interactions constitutes the metabolic pathways. These metabolic pathways are closely associated with photosynthesis, oxidative phosphorylation, and linoleic acid metabolism. The oxidative phosphorylation KEGG pathway comprised 30 and 24 significantly up- and downregulated genes in T. urartu leaves in the high B environment. In oxidative phosphorylation, nutrients are oxidized by mitochondrial cells using enzymes, and ATP is produced in the form of chemical energy. Though oxidative phosphorylation is a constructive process producing energy, it also produces reactive oxygen species (ROS) that damage different cellular components. The significant up- and downregulation of several genes of this pathway means that it may have a beneficial and a detrimental role in regulating the tolerance level of T. urartu under B stress, respectively. Several studies have reported a lower oxidative stress in tolerant plant genotypes, suggesting that this KEGG pathway needs to be the focus for developing B toxicity tolerance in different plant species [20,33]. Under high B, B toxicity-tolerant T. urartu comprised 41 and 6 significantly up- and downregulated genes in the enriched ribosome KEGG pathway, respectively. This was in agreement with the studies that highlighted the inhibitory effect of high B on translation and increased frequency of ribosomes on the stop codons under high B [34,35]. B may have a role in global translational processes as translation takes place on ribosomes. The photosynthesis KEGG pathway comprised 8 and 27 significantly up- and downregulated genes in T. urartu leaves in the high B environment. B stress is known to affect the photosynthetic activity of plants. The significant differential regulation of several genes of the photosynthesis KEGG pathway has been reported in tolerant genotypes in different studies [23,36]. As Gene Ontology enrichment also showed the enrichment of genes related to photosynthetic apparatus (chloroplast and thylakoid), genes participating in the photosynthetic pathway must be focused on to develop B toxicity tolerance in susceptible genotypes.
4.4. Enriched Transcription Factors in T. urartu Leaves Under B Toxicity Stress
Transcription factors are the proteins that bind to particular DNA sequences and regulate the transcription rate and expression of genes via either promoting or inhibiting their expression. These factors are considered an important source for the production of stress-tolerant crops via genetic engineering as they actively participate in regulating the expression of several stress-responsive genes as well. In this study, T. urartu leaves showed the maximum number of enriched TFs in MYB and MYB-related families under high B stress (Figure 4). Different physiological and biological processes, including responses to biotic and abiotic stresses, regulation of primary and secondary metabolic reactions, cell morphogenesis, plant growth and development, signal transduction, and hormone synthesis, are regulated by MYB TFs. Parallel to our outcomes, different experiments have suggested the role of MYB and related TFs in regulating the response of tolerant genotypes toward B toxicity stress [27].
A high number of enriched TFs in T. urartu leaves under B toxicity stress belonged to the APETALA2/ethylene-responsive element-binding protein (AP2/EREBP) family. The TFs of the AP2/EREBP family are known to be involved in regulating plant responses to biotic stresses and abiotic stresses, such as salinity, drought, heat, and cold [37]. Though the TFs of the AP2/EREBP family are not thoroughly studied for B toxicity stress, their role in the regulation of high B responses has been reported in some plants, including T. zhukovskyi [22], sweet cherry [38], and Triticum dicoccum (Schrank) Schübl., orth. Var. [23]. WRKY are the plant-specific TFs that regulate transcription in plants’ responses towards biotic and abiotic stresses, epigenetic modification, phytohormone production, mitogen-activated protein kinase activation, Ca2+ influx, and reactive oxygen species burst. Similar to our study, TFs in the WRKY family were enriched in the roots of T. zhukovskyi under B toxicity stress [22]. In addition, the downregulation of WRKY TFs in T. urartu leaves in this study was in line with their reduced expression in bread wheat genotypes [27] and Arabidopsis thaliana (L.) Heynh [39].
Flavonoid biosynthesis, which is controlled by the TFs of the basic helix–loop–helix (bHLH) family, maintains ROS equilibrium. Similar to the downregulation of bHLH family proteins in bread wheat cultivars [27] and T. zhukovskyi roots [22], the four enriched TFs from the bHLH family were markedly downregulated in T. urartu leaves under B toxicity. Different abiotic stresses, including drought, salinity, and cold, are regulated by plant-specific transcriptional regulators, NAC TFs [40]. The four enriched TFs from the NAC gene family were significantly downregulated in T. urartu leaves under B toxicity similar to the downregulation of the NAC-like TF gene named B EXCESS TOLERANT1 (BET1) in rice [41] and T. zhukovskyi roots [22], and contrary to barley leaves, where NAC-domain TFs were increasingly expressed [42].
4.5. Relative Expression of Genes Focused in RT-qPCR
The protein coding gene TuαDOX-like belongs to Haem peroxidase (family) is found on chromosome 3B (reverse strand). In the Gene Ontology analysis, while the molecular function of this gene is related to peroxidase activity, oxidoreductase activity, and heme binding, the biological process of this gene is related to fatty acid biosynthetic processes, response to oxidative stress, oxylipin biosynthetic processes, and cellular oxidant detoxification. The reduced expression of Tuα-DOX1 genes in T. urartu leaves in both the sequencing and RT-qPCR results suggests its possible role in regulating B toxicity tolerance. The significant differential expression of α-DOX genes in plants has been reported in different stress conditions, such as heavy metal stress, high salinity stress, herbivore attack, cellular signals mediating cell death, and bacterial infection [43]. While some of these experiments revealed upregulated expression, few reported downregulated expression. The differences in the type of expression within the same genotype were dependent on the studied α-DOX genes, target tissues (leaves or roots), and the duration of stress. For example, Tirajoh et al. [44] observed the expression of different α-DOX genes, including Leα-DOX1, Leα-DOX2, and Leα-DOX3, in tomato roots under salinity. Salinity stress decreased the expression of all the Leα-DOX isoforms after 0.5 h. However, after 2 h, it only decreased the transcript levels in Leα-DOX2 and Leα-DOX3. Contrary to our study, Leα-DOX1 showed an upregulation in roots after 8 h and 24 h of salt stress. This difference can be either due to the utilization of a completely different plant (tomato) or tissue (root) in their study. In A. thaliana, similar to our study, the expression of the Atα-DOX1 gene was downregulated under 50 mM of NaCl supply. However, it was upregulated under 100, 150, and 200 mM of NaCl supply. Moreover, the expression of the Atα-DOX1 gene was different in both root and shoot tissues. While the Atα-DOX1 gene was not expressed in shoots in any of the treatments except 250 mM salt stress, in roots, it was expressed in all the treatments. Similarly, in a study conducted by Koeduka et al. [43], the expression of α-DOX genes in rice leaves was dependent on the type and duration of stress treatment. In their experiment, while the expression of the α-DOX gene was increased under bacterial stress, methyl viologen (MV, a generator of intracellular superoxide), sodium nitroprusside (SNP, a generator of NO), CuSO4, or NiSO4, it decreased under hydrogen peroxide, ZnSO4, or CoSO4 supply. In line with our study, Abdeen et al. [45] found that the DOX1 gene of Arabidopsis plants showed 1.1-fold decreased expression under drought stress.
TuGDSL-like gene that is the GDSL esterase/lipase At4g10955-like gene encodes the fungal lipase-like domain-containing protein. The gene is located on chromosome 3B (forward strand) and belongs to the GDSL esterase/lipase protein (GELP) family. In Gene Ontology analysis, while the molecular function of this gene is related to hydrolase activity, the biological process of this gene is related to the lipid metabolic process. GDSL esterase/lipases (GELPs) are largely distributed in plants, playing vital roles in growth, development, and stress responses. In line with our study, the gene showed 1.9- and 1.6-fold downregulation in wheat leaves infected by Xanthomonas translucens and F. graminearum, respectively, as compared to the no infection condition. Likewise, Ren et al. [46] examined 12 GDSL-type lipases related to gummy stem blight resistance in gummy stem blight-resistant wild watermelon accession PI 189225 (C. amarus) and found that 9 of them were significantly downregulated after 24 h post-inoculation as compared to 0 h after inoculation.
The ATP-dependent zinc metalloprotease FTSH 9 chloroplastic/mitochondrial (LOC119276292) gene of Triticum dicoccoides is homologous to the TuFTSH9-like gene that showed reduced expression under high B in our investigation (Figure 5). The gene is located on chromosome 3B (reverse strand) and belongs to the peptidase M41 family in the C-terminal section and the AAA ATPase family in the N-terminal section. In Gene Ontology analysis, the molecular function of this gene is related to nucleotide binding, ATP-dependent peptidase activity, metalloendopeptidase activity, ATP binding, peptidase activity, metallopeptidase activity, hydrolase activity, and ATP hydrolysis activity. Similarly, its biological process is related to proteolysis and response to heat, while its cellular function is related to the cytoplasm, mitochondrion, chloroplast thylakoid, chloroplast envelope, membrane, and intracellular membrane-bounded organelle. Several previous studies showed the downregulated expression of the FTSH gene, in line with our results. In agreement with our study, the gene showed 1.5-fold downregulation in wheat leaves infected by X. translucens as compared to the no infection condition. In line with our results, ATP-dependent zinc metalloprotease FTSH chloroplastic gene showed 0.44- and 0.27-fold decreases in expression after 1 and 3 days of cold stress treatment in potato leaves, respectively [47]. However, the expression was increased by 0.77- and 0.58-fold after 5 and 7 days of cold treatment in the same genotype, respectively. Plant resilience to heat and cold stress is shown to be influenced by the ATP-dependent zinc metalloprotease FtsH family [48].
5. Conclusions
In this study, with a greater tolerance than the well-known B-toxicity-tolerant bread wheat cultivar Bolal 2973, the T. urartu genotype showed less devastating effects of B toxicity on all growth parameters, except the shoot fresh weight. Through the differential regulation of many genes, transcriptional profiling in this study was able to successfully identify putative functional candidate genes implicated in T. urartu’s tolerance to B toxicity. As Gene Ontology enrichment and KEGG pathway analyses showed the enrichment of genes related to photosynthesis and its apparatus (chloroplast and thylakoid); genes participating in the photosynthetic pathway must be focused to develop B toxicity tolerance in genotypes. As it is the first transcriptome profiling study on the B toxicity-tolerant T. urartu genotype, it is necessary to focus on the obtained outcomes and to conduct the functional characterization of important candidate genes to interpret the role of the gene in providing tolerance to B toxicity. The obtained data not only contribute to fulfilling the deficiency in the literature but also provide relevant information regarding the regulatory and molecular mechanisms underlying the genotype growth under B toxicity. The identified genes (e.g., RNA polymerase beta subunit, ATP synthase subunit gamma, photosystem II protein D) associated with B toxicity tolerance can be introgressed into modern wheat cultivars via marker-assisted selection (MAS) or gene editing (CRISPR-Cas9). Additionally, molecular markers associated to B toxicity tolerance traits can be established employing the transcriptomic data. These markers can facilitate the genomic selection of tolerant lines in breeding programs without demanding extensive field screening.
Supplementary Materials
The following supporting information can be downloaded at: https://www.mdpi.com/article/10.3390/agronomy15010191/s1, Figure S1: Picture showing the comparison of the effect of highly toxic B (10 mM B) on the growth of the T. urartu genotype PI662222 and the check cultivar (T. aestivum genotype) Bolal 2973 grown in hydroponic conditions for 7 days. Figure S2: GO classification of up- and downregulated differentially expressed genes of T. urartu leaves under a B-toxic growing environment (10 Mm B) as compared to the control treatment (3.1 μM B). Figure S3: KEGG pathway classification of differentially expressed genes of T. urartu leaves under a B-toxic growing environment (10 Mm B) as compared to the control treatment (3.1 μM B). While the number of genes is denoted by the X-axis, functional classification of KEGG is denoted by the Y-axis. Supplementary Tables: Table S1: Individual values and means with corresponding standard errors (SEMs) of six growth parameters of Triticum aestivum genotype Bolal 2973 and Triticum urartu genotype PI662222 grown in high B (10 mM boron) growing conditions and the control (3.1 μM boron) (n = 3). Significance of the effects of genotype, treatment, and genotype-treatment interaction (G×T) obtained from two-way ANOVA are indicated as **** for p < 0.0001; *** for p < 0.001; ** for p < 0.01; * for p < 0.05; and ns for p ≥ 0.05 (not significant). Table S2: Results of the quality estimate of reference genome alignment statistics and sequencing data of T. urartu (Tu) leaves grown under high B (10 mM B) growing conditions in comparison to the control treatment (3.1 µM B).
Author Contributions
The study was conceived and designed by M.K.K. and A.P. The experiments were conducted by G.S.U. under the supervision of M.K.K. The analysis was performed by A.P. and T.V. The manuscript was written by M.K.K. Investigation by M.H. (Mehmet Hamurcu) and M.H. (Mustafa Harmankaya). Funding acquisition by A.P. The manuscript was reviewed and edited by M.K.K., A.T. and S.G. All authors have read and agreed to the published version of the manuscript.
Funding
The authors thank the TUBITAK 1001 (No. 119O455) project and BAP, Selcuk University (Grant No. 22401016) for the funding delivered to support this research work.
Data Availability Statement
Data is contained within the article and Supplementary Material.
Conflicts of Interest
The authors declare no conflicts of interest.
References
- Shiferaw, B.; Smale, M.; Braun, H.-J.; Duveiller, E.; Reynolds, M.; Muricho, G. Crops that feed the world 10. Past successes and future challenges to the role played by wheat in global food security. Food Secur. 2013, 5, 291–317. [Google Scholar] [CrossRef]
- Farhad, M.; Kumar, U.; Tomar, V.; Bhati, P.K.; Krishnan, J.N.; Barek, V.; Brestic, M.; Hossain, A. Heat stress in wheat: A global challenge to feed billions in the current era of the changing climate. Front. Sustain. Food Syst. 2023, 7, 1203721. [Google Scholar] [CrossRef]
- Sehgal, A.; Sita, K.; Siddique, K.H.M.; Kumar, R.; Bhogireddy, S.; Varshney, R.K.; HanumanthaRao, B.; Nair, R.M.; Prasad, P.V.V.; Nayyar, H. Drought or/and Heat-Stress Effects on Seed Filling in Food Crops: Impacts on Functional Biochemistry, Seed Yields, and Nutritional Quality. Front. Plant Sci. 2018, 9, 1705. [Google Scholar] [CrossRef] [PubMed]
- Landi, M.; Margaritopoulou, T.; Papadakis, I.E.; Araniti, F. Boron toxicity in higher plants: An update. Planta 2019, 250, 1011–1032. [Google Scholar] [CrossRef] [PubMed]
- Khan, M.K.; Arifuzzaman, M.; Pandey, A.; Turin, M.T.S.; Hamurcu, M.; Athar, T.; Masuda, M.S.; Gokmen Yilmaz, F.; Topal, A.; Gezgin, S. Advancement in mitigating the effects of boron stress in wheat. In Abiotic Stresses in Wheat; Academic Press: Cambridge, MA, USA, 2023; pp. 329–338. [Google Scholar]
- Pandey, A.; Khan, M.K.; Hamurcu, M.; Yilmaz, F.G.; Gezgin, S. Boron Toxicity: An Insight on Its Influence on Wheat Growth. In Metal Toxicology Handbook; CRC Press: Boca Raton, FL, USA, 2020; pp. 417–432. [Google Scholar]
- Zhao, S.; Huq, M.E.; Fahad, S.; Kamran, M.; Riaz, M. Boron toxicity in plants: Understanding mechanisms and developing coping strategies; a review. Plant Cell Rep. 2024, 43, 238. [Google Scholar] [CrossRef]
- Schnurbusch, T.; Hayes, J.; Hrmova, M.; Baumann, U.; Ramesh, S.A.; Tyerman, S.D.; Langridge, P.; Sutton, T. Boron Toxicity Tolerance in Barley through Reduced Expression of the Multifunctional Aquaporin HvNIP2;1. Plant Physiol. 2010, 153, 1706–1715. [Google Scholar] [CrossRef]
- Yoshinari, A.; Takano, J. Insights into the Mechanisms Underlying Boron Homeostasis in Plants. Front. Plant Sci. 2017, 8, 1951. [Google Scholar] [CrossRef]
- Wu, M.; Ding, W.; Luo, J.; Wu, C.; Mei, L. Transcriptome and protein-protein interaction analysis reveals the tolerance of poplar to high boron toxicity regulated by transport and cell wall synthesis pathways. Environ. Exp. Bot. 2024, 226, 105922. [Google Scholar] [CrossRef]
- Bienert, M.D.; Bienert, G.P. Plant aquaporins and metalloids. In Signaling and Communication in Plants; Springer: Cham, Switzerland, 2017; pp. 297–332. [Google Scholar]
- Martinez-Ballesta, M.d.C.; Bastías, E.; Zhu, C.; Schäffner, A.R.; González-Moro, B.; González-Murua, C.; Carvajal, M. Boric acid and salinity effects on maize roots. Response of aquaporins ZmPIP1 and ZmPIP2, and plasma membrane H+-ATPase, in relation to water and nutrient uptake. Physiol. Plant. 2008, 132, 479–490. [Google Scholar] [CrossRef] [PubMed]
- Tombuloglu, H.; Ozcan, I.; Tombuloglu, G.; Sakcali, S.; Unver, T. Aquaporins in boron-tolerant barley: Identification, characterization, and expression analysis. Plant Mol. Biol. Rep. 2016, 34, 374–386. [Google Scholar] [CrossRef]
- Hamurcu, M.; Khan, M.; Pandey, A.; Avsaroglu, Z.; Elbasan, F.; Gezgin, S. Boron stress exposes differential antioxidant responses in maize cultivars (Zea mays L.). J. Elem. 2020, 25, 1291–1304. [Google Scholar]
- Wang, B.-L.; Shi, L.; Li, Y.-X.; Zhang, W.-H. Boron toxicity is alleviated by hydrogen sulfide in cucumber (Cucumis sativus L.) seedlings. Planta 2010, 231, 1301–1309. [Google Scholar] [CrossRef] [PubMed]
- Landi, M.; Degl’Innocenti, E.; Pardossi, A.; Guidi, L. Antioxidant and photosynthetic responses in plants under boron toxicity: A review. Am. J. Agric. Biol. Sci. 2012, 7, 255–270. [Google Scholar] [CrossRef]
- Çatav, Ş.S.; Genç, T.O.; Kesik Oktay, M.; Küçükakyüz, K. Effect of boron toxicity on oxidative stress and genotoxicity in wheat (Triticum aestivum L.). Bull. Environ. Contam. Toxicol. 2018, 100, 502–508. [Google Scholar] [CrossRef] [PubMed]
- Khan, M.K.; Pandey, A.; Hamurcu, M.; Germ, M.; Yilmaz, F.G.; Ozbek, M.; Avsaroglu, Z.Z.; Topal, A.; Gezgin, S. Nutrient homeostasis of Aegilops accessions differing in B tolerance level under boron toxic growth conditions. Biology 2022, 11, 1094. [Google Scholar] [CrossRef]
- Reid, R.J.; Hayes, J.E.; Post, A.; Stangoulis, J.C.R.; Graham, R.D. A critical analysis of the causes of boron toxicity in plants. Plant Cell Environ. 2004, 27, 1405–1414. [Google Scholar] [CrossRef]
- Khan, M.K.; Pandey, A.; Hamurcu, M.; Avsaroglu, Z.Z.; Ozbek, M.; Omay, A.H.; Elbasan, F.; Omay, M.R.; Gokmen, F.; Topal, A. Variability in physiological traits reveals boron toxicity tolerance in Aegilops species. Front. Plant Sci. 2021, 12, 736614. [Google Scholar] [CrossRef]
- Brdar-Jokanović, M. Boron toxicity and deficiency in agricultural plants. Int. J. Mol. Sci. 2020, 21, 1424. [Google Scholar] [CrossRef]
- Pandey, A.; Khan, M.K.; Hamurcu, M.; Brestic, M.; Topal, A.; Gezgin, S. Insight into the Root Transcriptome of a Boron-Tolerant Triticum zhukovskyi Genotype Grown under Boron Toxicity. Agronomy 2022, 12, 2421. [Google Scholar] [CrossRef]
- Khan, M.K.; Pandey, A.; Hamurcu, M.; Rajpal, V.R.; Vyhnanek, T.; Topal, A.; Raina, S.N.; Gezgin, S. Insight into the Boron Toxicity Stress-Responsive Genes in Boron-Tolerant Triticum dicoccum Shoots Using RNA Sequencing. Agronomy 2023, 13, 631. [Google Scholar] [CrossRef]
- Emon, R.; Gustafson, K.; Bebeli, P.; Jahiruddin, M.; Haque, M.; Ross, K.; Gusafson, J. Screening Aegilops-Triticum species for Boron tolerance. Afr. J. Agric. Res. 2012, 7, 1931–1936. [Google Scholar]
- Rodríguez-Suárez, C.; Ramírez, M.C.; Martín, A.; Atienza, S.G. Applicability of chromosome-specific SSR wheat markers for the introgression of Triticum urartu in durum wheat breeding programmes. Plant Genet. Resour. 2011, 9, 439–444. [Google Scholar] [CrossRef]
- Pallotta, M.; Schnurbusch, T.; Hayes, J.; Hay, A.; Baumann, U.; Paull, J.; Langridge, P.; Sutton, T. Molecular basis of adaptation to high soil boron in wheat landraces and elite cultivars. Nature 2014, 514, 88–91. [Google Scholar] [CrossRef]
- Kayıhan, C.; Öz, M.T.; Eyidoğan, F.; Yücel, M.; Öktem, H.A. Physiological, biochemical, and transcriptomic responses to boron toxicity in leaf and root tissues of contrasting wheat cultivars. Plant Mol. Biol. Report. 2017, 35, 97–109. [Google Scholar] [CrossRef]
- Livak, K.J.; Schmittgen, T.D. Analysis of relative gene expression data using real-time quantitative PCR and the 2(-Delta Delta C(T)) Method. Methods 2001, 25, 402–408. [Google Scholar] [CrossRef] [PubMed]
- Coskun, Y.; Olgunsoy, P.; Karatas, N.; Bulut, F.; Yarar, F. Mannitol application alleviates boron toxicity in wheat seedlings. Commun. Soil Sci. Plant Anal. 2014, 45, 944–952. [Google Scholar] [CrossRef]
- Safavi-Rizi, V.; Herde, M.; Stöhr, C. RNA-Seq reveals novel genes and pathways associated with hypoxia duration and tolerance in tomato root. Sci. Rep. 2020, 10, 1692. [Google Scholar] [CrossRef]
- Schnurbusch, T.; Collins, N.C.; Eastwood, R.F.; Sutton, T.; Jefferies, S.P.; Langridge, P. Fine mapping and targeted SNP survey using rice-wheat gene colinearity in the region of the Bo1 boron toxicity tolerance locus of bread wheat. Theor. Appl. Genet. 2007, 115, 451–461. [Google Scholar] [CrossRef]
- Nejad, S.G.; Savaghebi, G.; Farahbakhsh, M.; Amiri, R.M.; Rezaei, H. Tolerance of some wheat varieties to boron toxicity. Cereal Res. Commun. 2015, 43, 384–393. [Google Scholar] [CrossRef]
- de Abreu Neto, J.B.; Hurtado-Perez, M.C.; Wimmer, M.A.; Frei, M. Genetic factors underlying boron toxicity tolerance in rice: Genome-wide association study and transcriptomic analysis. J. Exp. Bot. 2017, 68, 687–700. [Google Scholar] [CrossRef]
- Uluisik, I.; Kaya, A.; Fomenko, D.E.; Karakaya, H.C.; Carlson, B.A.; Gladyshev, V.N.; Koc, A. Boron stress activates the general amino acid control mechanism and inhibits protein synthesis. PLoS ONE 2011, 6, e27772. [Google Scholar] [CrossRef]
- Sotta, N.; Chiba, Y.; Miwa, K.; Takamatsu, S.; Tanaka, M.; Yamashita, Y.; Naito, S.; Fujiwara, T. Global analysis of boron-induced ribosome stalling reveals its effects on translation termination and unique regulation by AUG-stops in Arabidopsis shoots. Plant J. 2021, 106, 1455–1467. [Google Scholar] [CrossRef] [PubMed]
- Guo, J.; Zhao, X.; Wang, X.; Jia, L.; Zhou, Y.; Xie, M.; Li, Q.; Su, E.; Fan, L. Transcriptome analysis of soybean roots in response to boron deficiency. Biotechnol. Biotechnol. Equip. 2023, 37, 2200510. [Google Scholar] [CrossRef]
- Chen, L.; Han, J.; Deng, X.; Tan, S.; Li, L.; Li, L.; Zhou, J.; Peng, H.; Yang, G.; He, G. Expansion and stress responses of AP2/EREBP superfamily in Brachypodium distachyon. Sci. Rep. 2016, 6, 21623. [Google Scholar] [CrossRef]
- Michailidis, M.; Bazakos, C.; Kollaros, M.; Adamakis, I.D.S.; Ganopoulos, I.; Molassiotis, A.; Tanou, G. Boron stimulates fruit formation and reprograms developmental metabolism in sweet cherry. Physiol. Plant. 2023, 175, e13946. [Google Scholar] [CrossRef]
- Feng, Y.; Cui, R.; Huang, Y.; Shi, L.; Wang, S.; Xu, F. Repression of transcription factor AtWRKY47 confers tolerance to boron toxicity in Arabidopsis thaliana. Ecotoxicol. Environ. Saf. 2021, 220, 112406. [Google Scholar] [CrossRef]
- Nuruzzaman, M.; Sharoni, A.M.; Kikuchi, S. Roles of NAC transcription factors in the regulation of biotic and abiotic stress responses in plants. Front. Microbiol. 2013, 4, 248. [Google Scholar] [CrossRef] [PubMed]
- Ochiai, K.; Shimizu, A.; Okumoto, Y.; Fujiwara, T.; Matoh, T. Suppression of a NAC-like transcription factor gene improves boron-toxicity tolerance in rice. Plant Physiol. 2011, 156, 1457–1463. [Google Scholar] [CrossRef]
- Öz, M.T.; Yilmaz, R.; Eyidoğan, F.; Graaff, L.D.; Yücel, M.; Öktem, H.A. Microarray analysis of late response to boron toxicity in barley (Hordeum vulgare L.) leaves. Turk. J. Agric. For. 2009, 33, 191–202. [Google Scholar] [CrossRef]
- Koeduka, T.; Matsui, K.; Hasegawa, M.; Akakabe, Y.; Kajiwara, T. Rice fatty acid α-dioxygenase is induced by pathogen attack and heavy metal stress: Activation through jasmonate signaling. J. Plant Physiol. 2005, 162, 912–920. [Google Scholar] [CrossRef] [PubMed]
- Tirajoh, A.; Aung, T.S.T.; McKay, A.B.; Plant, A.L. Stress-responsive α-dioxygenase expression in tomato roots. J. Exp. Bot. 2004, 56, 713–723. [Google Scholar] [CrossRef]
- Abdeen, A.; Schnell, J.; Miki, B. Transcriptome analysis reveals absence of unintended effects in drought-tolerant transgenic plants overexpressing the transcription factor ABF3. BMC Genom. 2010, 11, 69. [Google Scholar] [CrossRef] [PubMed]
- Ren, R.; Yang, X.; Xu, J.; Zhang, K.; Zhang, M.; Liu, G.; Yao, X.; Lou, L.; Xu, J.; Zhu, L.; et al. Genome-wide identification and analysis of promising GDSL-type lipases related to gummy stem blight resistance in watermelon (Citrullus lanatus). Sci. Hortic. 2021, 289, 110461. [Google Scholar] [CrossRef]
- Li, H.; Luo, W.; Ji, R.; Xu, Y.; Xu, G.; Qiu, S.; Tang, H. A comparative proteomic study of cold responses in potato leaves. Heliyon 2021, 7, e06002. [Google Scholar] [CrossRef]
- Luo, G.; Shen, L.; Song, Y.; Yu, K.; Ji, J.; Zhang, C.; Yang, W.; Li, X.; Sun, J.; Zhan, K. The MYB family transcription factor TuODORANT1 from Triticum urartu and the homolog TaODORANT1 from Triticum aestivum inhibit seed storage protein synthesis in wheat. Plant Biotechnol. J. 2021, 19, 1863–1877. [Google Scholar] [CrossRef] [PubMed]
Disclaimer/Publisher’s Note: The statements, opinions and data contained in all publications are solely those of the individual author(s) and contributor(s) and not of MDPI and/or the editor(s). MDPI and/or the editor(s) disclaim responsibility for any injury to people or property resulting from any ideas, methods, instructions or products referred to in the content. |
© 2025 by the authors. Licensee MDPI, Basel, Switzerland. This article is an open access article distributed under the terms and conditions of the Creative Commons Attribution (CC BY) license (https://creativecommons.org/licenses/by/4.0/).