Article

Oat Nutrition, Traits, and Yield as Affected by the Interaction of Nitrogen Rates and Plant Density in Sandy Soil

1
College of Grassland Science, Inner Mongolia University for Nationalities, Tongliao 028043, China
2
College of Forestry and Prataculture, Ningxia University, Yinchuan 750021, China
3
College of Grassland Agriculture, Northwest Agriculture and Forestry University, Xianyang 712100, China
*
Author to whom correspondence should be addressed.
These authors contributed equally to this work.
Agronomy 2025, 15(1), 150; https://doi.org/10.3390/agronomy15010150
Submission received: 17 December 2024 / Revised: 2 January 2025 / Accepted: 8 January 2025 / Published: 9 January 2025
(This article belongs to the Section Soil and Plant Nutrition)

Abstract

:
Optimizing plant density and nutrient availability is essential for sustaining high forage yields and promoting environmental health, especially in semi-arid regions with sandy soil. Nonetheless, the mechanisms by which stoichiometric features govern nutrient utilization and forage output are still unidentified. We executed a two-year field experiment, integrating six nitrogen rates (0 (N0), 104 (N1), 138 (N2), 173 (N3), 207 (N4), and 242 (N5) kg N ha−1) and four planting densities (3 (D1), 3.5 (D2), 4 (D3), and 4.5 (D4) million plants ha−1). The C, N, and P contents, along with the C:N:P stoichiometry of different oat organs (leaf, stem, and root) and soil, were determined. It was found that the growth of oats in this area was limited by soil N. The pasture biomass increased nonlinearly with increasing planting density and N rate, and the maximum thresholds for C, N, and P uptake were 389.43 g kg−1, 11.19 g kg−1, and 3.10 g kg−1 at N3, respectively. The maximum thresholds for C, N, and P uptake were 356.45, 9.47, and 2.78 g kg−1 at D3, respectively, with an optimal biomass of 9221.74 kg ha−1; at a planting density of D3, the maximum thresholds for C, N, and P uptake were 329.39, 8.54, and 2.47 g kg−1, with an optimal biomass of 6276.10 kg ha−1. SEM showed that N rate and density increases significantly changed the ecological balance of the soil. The C:N and C:P ratios in oat leaves tend towards lower values, while the N:P ratio tends towards higher values; in contrast, the C:N and C:P ratios in oat stems tend towards higher values, and the N:P ratio tends towards lower values. The nutrient use strategy maintains the stoichiometric balance at the organ level, which in turn improves the accumulation of oat biomass. The best NUE was obtained at an N rate and density of N3D3 with a 144% biomass increase as compared to N0D2. This study provides new insights into nutrient allocation, usage strategies, and the stability of oats in actual sandy land production.

1. Introduction

Sandy land is a crucial resource that can alleviate cropland shortages, ensuring stable food production and improving land use efficiency. The Horqin sandy land, situated in Northern China, is one of its four major sandy areas. It falls into the agricultural and pastoral transition and semi-arid zones [1]. However, the loss of ground vegetation cover and topsoil occurs due to excessive farming, livestock grazing, and trampling [2,3,4], which have resulted in the decline in soil fertility and unstable crop production. Soil nutrient availability, nutrient balance, and C:N:P stoichiometry could limit sustainable crop production in the area, which hence threatens the food security of the populace [5]. While the management of the Horqin sandy land has made significant strides in improving natural grassland and constructing protective forests [6,7], it falls short in terms of farmland management. Farmland management, an important area intertwined with agriculture and animal husbandry, serves as the foundation for supporting the forage production of artificial grasslands [8]. To cope with the poor fertility of sandy soil, farmers and herders usually apply excessive N fertilizer to ensure forage production. Sandy soils have a poor water and fertilizer retention capacity [9], and the irrational application of N fertilizers under sandy soil conditions further increases environmental risks. Therefore, it is crucial to find nutrient-balanced management methods that achieve low costs and a high yield while ameliorating soil ecological problems.
The excessive use of N fertilizers leads to soil acidification [5,10,11], increases the accumulation of residual nitrogen, reduces nitrogen use efficiency (NUE), and accelerates nitrogen loss from the soil [12]. In order to alleviate the problems caused by the overconsumption of chemical fertilizers, one of the promising strategies to increase NUE without increasing fertilizer inputs is to partially replace chemical fertilizers by increasing the planting density [13]. The long-term adoption of moderate nitrogen fertilizers combined with high planting densities has been shown to be crucial for nitrogen recovery and utilization in agricultural environments [14]. Numerous studies have indicated that dense planting can help plants gain a population advantage, mitigate the adverse effects of nitrogen, and enhance the utilization efficiency of N [15,16]. The appropriate planting density enhances the root coverage area and strength of plants and increases soil firmness, thereby effectively alleviating wind and sand erosion and enhancing soil quality [17], ultimately leading to an increased final yield [18,19]. However, when the planting density is excessively high, plant populations tend to over-deplete soil nutrients, intensifying competition among individual plants, which in turn affects nutrient accumulation and plant growth. As a result, the yield potential of the crop population cannot be fully realized [20]. Therefore, exploring the trade-off between planting density and N fertilizer use through changes in crop yield and nutrient utilization in the Horqin sandy areas is of great interest.
Carbon (C), nitrogen (N), and phosphorus (P) are the three most important nutrient elements in ecosystems, and they play critical roles in plant growth and development [21]. Carbon, N, and P are typically bound to each other through a range of physiological processes. Phosphorus-rich RNAs regulate the synthesis of nitrogen-rich proteins [22]. Proteases, such as RuBisCO, are crucial for photosynthesis, facilitating carbon assimilation and supporting plant growth. Additionally, nitrogen and phosphorus are jointly involved in electron transfer during respiration [23]. During forage growth, the development of different organs controls the flow of nutrients and the final yield through complicated source–sink dynamics that use photosynthesis as a pathway [24]. Ecological stoichiometry provides an important framework for discussing coupling relationships, elemental balances, and material cycling in ecosystems through elemental ratios. Thus, C:N:P ratios are functional traits that reflect nutrient use efficiency and nutrient limitations. Altering the stoichiometry of carbon (C), nitrogen, and phosphorus (P) in plants as a result of the N rate and changes in planting density can disrupt photosynthetic synthesis and nutrient transport processes. Previous studies have shown that N or P limitation in ecosystems can be assessed using the N:P ratio of plant leaves [25]. Nitrogen enrichment increases soil N effectiveness; at the same time, it reduces radiation by enhancing canopy cover and shifts resource limitations from below ground (soil nutrients) to aboveground (light) [26,27]. Thus, changes in plant carbon-to-nitrogen ratios alter the response of plant growth to changes in resources due to nitrogen enrichment. However, the effect of coordinated element partitioning to different organs through plants at different planting densities and their ecological stoichiometric characteristics on plant growth strategies is not yet known. So, we need more information to fully understand how nitrogen fertilization and planting density affect the source–sink relationship and the movement of nutrients and dry matter from the ground up to the surface.
Oat (Avena sativa L.) is an annual cool-season grass plant with various advantages, including having a high yield and wide distribution, being of excellent quality, and adaptability. It is an important fodder crop globally and one of the widely grown forage species in Northern China. The total output and quality of oats in the Inner Mongolia Autonomous Region rank among the highest in the country; however, the traditional management methods and nutrient limitations of the cultivated soil are key limiting factors that lead to inconsistent oat yield and quality. Under the premise of ensuring production and environmental protection, it remains unclear how fertilizer application and changes in plant populations in infertile soils can achieve nutrient balance through stoichiometric changes and how different source–sink organs (leaves, stems, and roots) contribute to this process. Therefore, we hypothesize that different organs of oats adapt to changes in nitrogen rates and planting densities by regulating their elemental balance to achieve optimal forage production, thereby screening the most suitable combination of nitrogen rates and planting densities for oat cultivation in the current region. The specific objectives of our study were to (1) ascertain the interaction between the effects of the N rate and planting density on oat growth; (2) identify patterns of change in the stoichiometric ratios of various oat components (leaf, stem, and root); and (3) define the process of regulating nutrient balance and determine the appropriate combinations. Our experiments are expected to provide reliable evidence for exploring the potential to improve productivity by adjusting stoichiometric properties for nutrient balance management.

2. Materials and Methods

2.1. Study Sites

The experimental field station of Inner Mongolia University for Nationalities was the site of the experiment (Figure 1). The base spans 2000 acres and is located in Fengtian village, Tongliao. The coordinates of the place are 43° 38′ N latitude and 122° 04′ E longitude. The place sits at an elevation of 182–185 m above sea level.
The region endures brief, sweltering summers, mild autumns, and arid, severe winters owing to its temperate continental climate. The springs are characterized by windy and arid conditions. Approximately 50–60% of the annual precipitation of 399 mm occurs between August and September. The total annual temperature (exceeding 10 °C) is 3184 °C, with an average temperature of 6.4 °C. From May to September, there are 90 to 150 frost-free days. The organic matter content varies between 18.0 and 18.5 g kg⁻1, the soil pH is 8.2 (pH water), and the available concentrations of potassium, phosphorus, and nitrogen (alkali-hydrolyzable nitrogen) are 64, 41, and 195 mg kg⁻1, respectively.
The precipitation and temperature at the experimental site during the oat growing periods were collected from a nearby meteorological station. Total precipitation during the growing season (May to August) was 334.2 mm in 2017 and 295.1 mm in 2018, a difference of 49.8 mm between the two years. The accumulated precipitation during the main seasons was higher in 2017 than in 2018, which was due to heavy rainfall in July 2017. The mean temperature was 7.47 °C in 2017 and 6.53 °C in 2018. The average temperature was 22.1 °C during the 2017 growing season, which was slightly higher (1.05 °C) than in 2018. During the growing season from 2017 to 2018, July saw the highest temperature (Figure 2).

2.2. Experimental Design

The oat cultivar was Yanwang (Beijing Zhengdao Ecological Technology Co., Beijing, China), and the seeds were not chemically treated. The fertilizer was urea (N 46%). There were six N rate levels, including 0, 104, 138, 173, 207, and 242 kg ha−1 yr−1. Therefore, they are denoted the N0, N1, N2, N3, N4, and N5 treatments. The treatments were applied in the form of top dressing at the seedling stage (1/3 of the total amount) and the plucking stage (2/3 of the total amount). There were four planting densities, including 3 million plants ha−1, 3.5 million plants ha−1, 4 million plants ha−1, and 4.5 million plants ha−1. They are represented as D1, D2, D3, and D4. D2 is the typical density for oats grown locally, respectively, so we chose the N0D2 treatment as CK. A total of 21 treatments were established on the basis of a randomized block design, and these were carried out in plots with three replicates. The experimental plot area was 10 m × 10 m and the plots were spaced 2 m apart.
The preceding crop in this experiment was Jerusalem artichoke (Helianthus tuberosus L.). Oats (Avena sativa L.) were manually planted on 20 April 2017 and 25 April 2018, with a planting depth of 3 cm and a row spacing of 30 cm. Nitrogen (N), phosphorus (P2O5), and potassium (K2O) were applied in the form of urea (46% N), superphosphate (12% P2O5), and muriate of potash (60% K2O), respectively. The application rates for P2O5 and K2O were 80 kg per hectare each, and both were applied before sowing. A sprinkler irrigation system was installed next to the plot before planting. Sprinkler-based irrigation was performed after oat sowing to ensure homogenous seedling emergence. Irrigation was applied when necessary, and the amount of water applied to the plants was 10 L plot−1 each time. Manual weeding was carried out at the seedling stage and plucking stage of the oats.

2.3. Sampling and Measurement

In both 2017 and 2018, the harvest date used to assess biomass partitioning was 14 July. Two 1 × 1 m quadrats were used to survey the plant community within each plot in order to measure the biomass of the plants. Standing plants were clipped to a height of 1 cm above the ground, and the plants were then oven-dried for 48 h at 65 °C. We took the aboveground biomass from the ground surface and divided it into leaves and stems to calculate the biomass. Oat roots were manually removed from the 0–30 cm soil layer and sieved using a 100-mesh sieve because they are often widely scattered in the 0–30 cm soil layer. After washing the plant samples with deionized water, they were heated at 65 °C for 30 min to deactivate the enzymes and then weighed. For elemental analysis, all plant samples were then coarsely pulverized in a ball mill (Retsch MM 400, Retsch GmbH & Co KG, Haan, Germany).
The total C contents of plants (g kg−1) were determined by the dichromate oxidation method. The Kjeldahl method [28] was used to calculate the total nitrogen contents of plants (g kg−1). Following digestion, the total P (TP) contents were ascertained using the molybdenum blue technique [29].
Agronomic nitrogen use efficiency (NUE) was calculated as follows:
NUE = (Ytreatment − YCK)/F
Ytreatment and YCK are yields (kg ha−1) when the quantities of N fertilizer applied were N and zero; F is the total N (kg ha−1) applied.

2.4. Data Analysis

Excel 2021 and SPSS 25.0 for Windows were used for statistical analyses, and the mean and standard deviation (SD) of each variable were used to characterize the data. We checked for the normality and homogeneity of the variances before using parametric testing. Two-way ANOVA was used to analyze C, N, and P concentrations as well as changes in the C:N:P ratio between leaf, stem, root, and soil at p < 0.05. Linear regression (LR) was used to assess the biomass, ecological stoichiometric ratio, and the concentrations of C, N, and P in the soil and plant organs.
We examined the network of processes that relates N rate, planting density, and oat biomass using structural equation modeling (SEM). These mechanisms included soil C:N:P stoichiometry, plant (leaf, stem, and root) stoichiometry, and plant biomass. The model proposed that modifications to planting density and N rate would impact soil stoichiometry as well as plant stoichiometry (leaf, stem, and root) and that these modifications would probably have an impact on the total biomass of oats. The biomass of the leaves, stems, and roots may vary depending on the stoichiometry of the plant, which could alter the oats’ overall biomass. These were developed from previous conceptual models that included imaginary linkages and all possible cascade paths. After the data were standardized using the z-transformation, random effects were added to the analysis year [30]. These were developed from previous conceptual models that included imaginary linkages and all possible cascade paths. After the data were standardized using the z-transformation, random effects were added to the analysis year [31]. IBM SPSS Amos 21 (Amos Development Corporation, Chicago, IL, USA) was used to perform SEM analysis.

3. Results

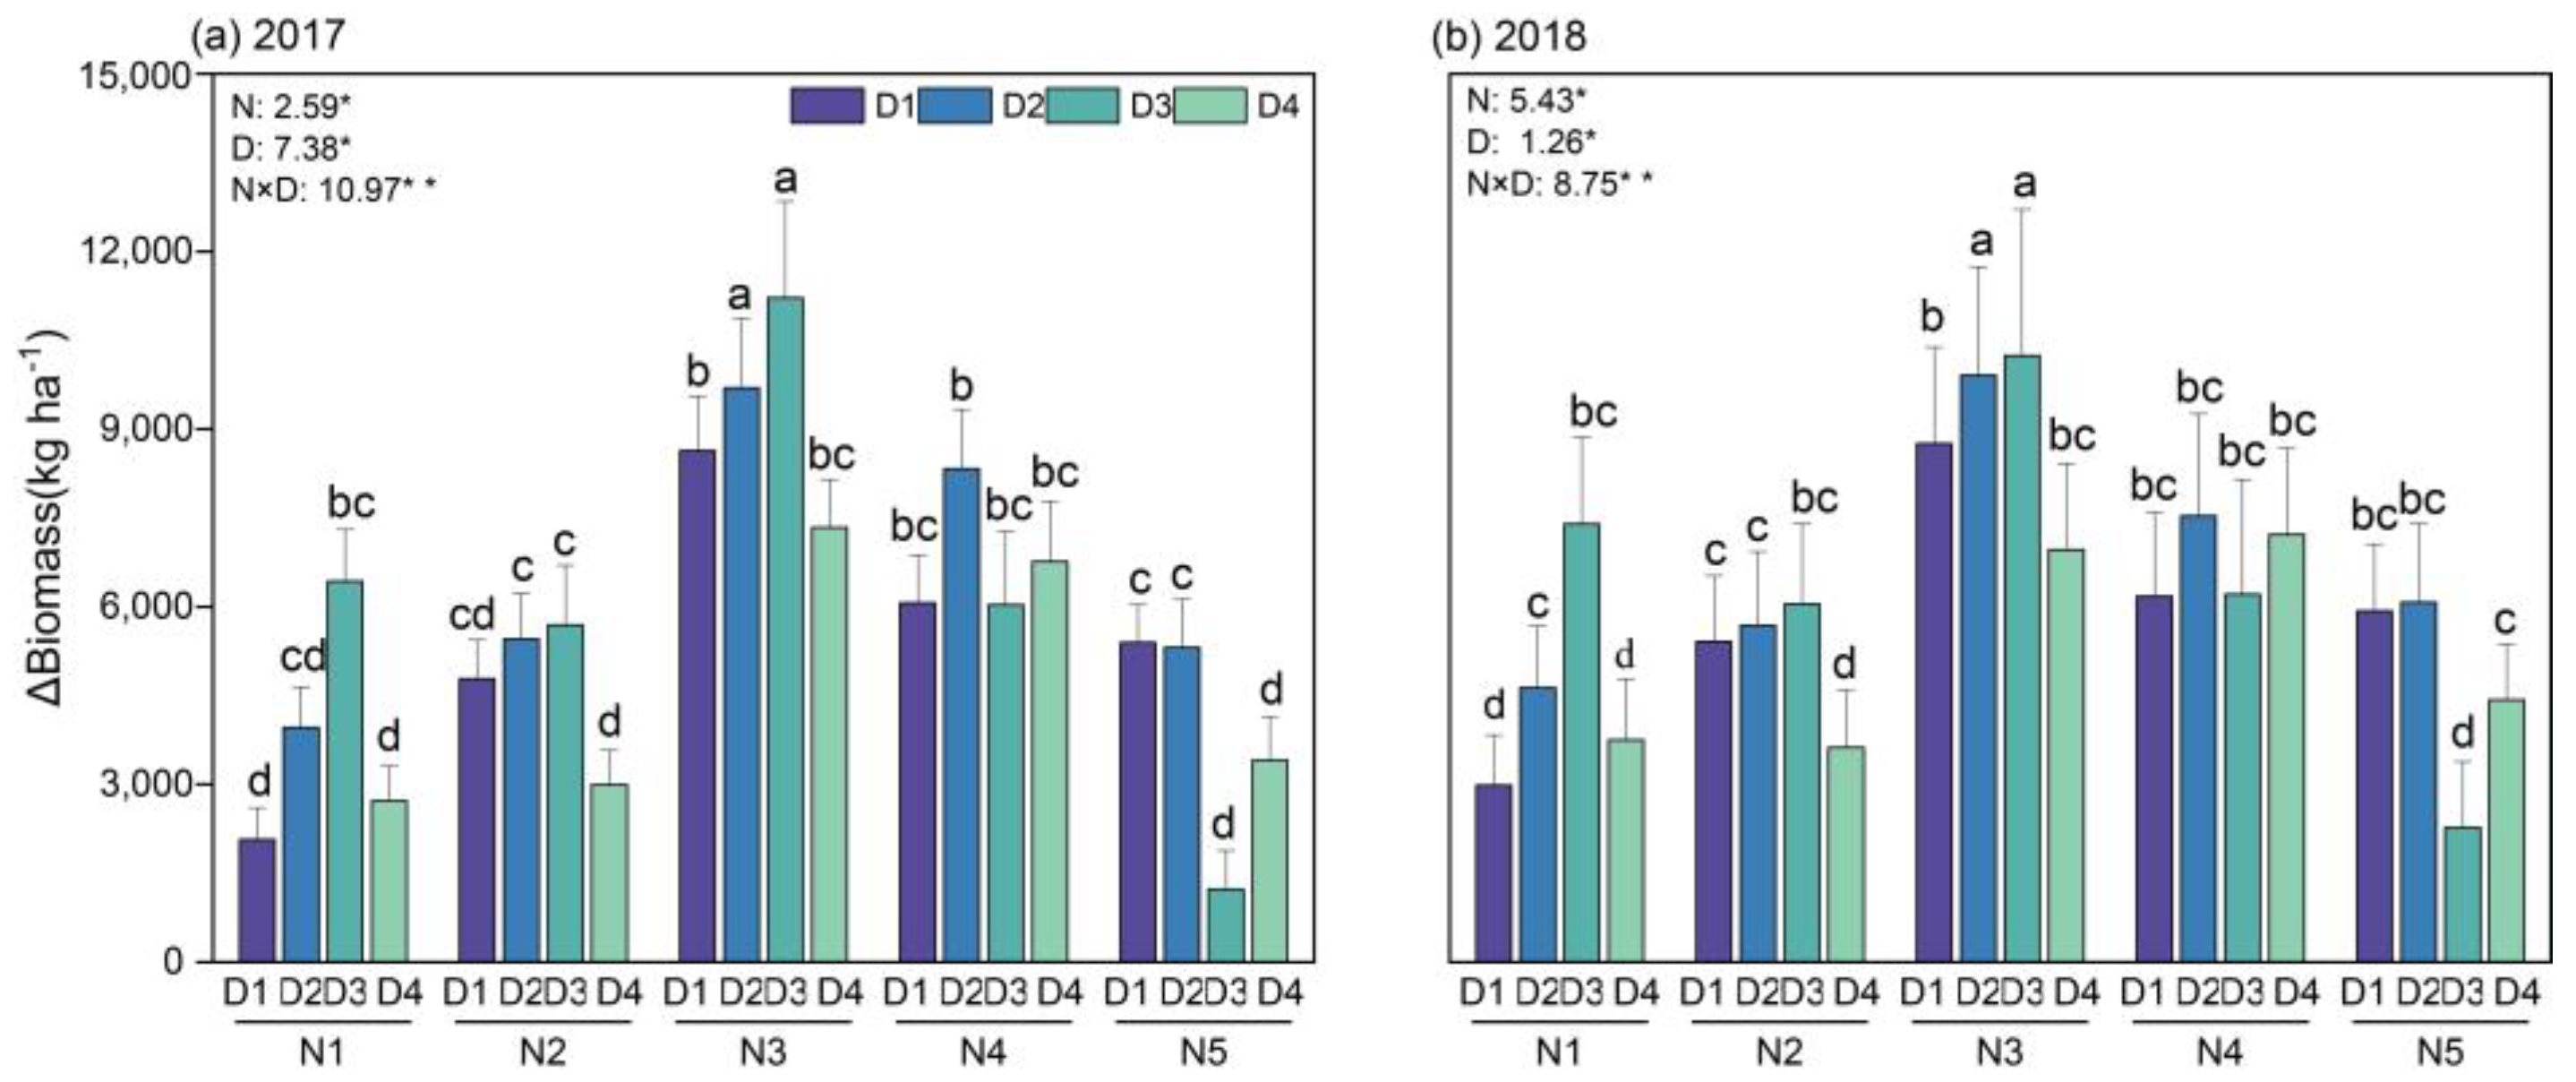
3.1. Biomass Discrepancy

The application of nitrogen, density, and their interaction significantly affected the oat biomass in both 2017 and 2018 (p < 0.05, Figure 3). The incremental biomass of D3 was generally the highest under the N1 to N3 applications. The incremental biomass of D2 was generally higher than the other density treatments under the N4 and N5 applications. However, at densities D1, D2, and D3, the oat biomass increased with the application of nitrogen, showing a consistent trend. At the high density of D4, the biomass increment did not significantly increase with increasing nitrogen applications until the N3 treatment was applied. The best performance in both years was obtained using the N3D3 treatment with 11,216.24 and 10,239.21 kg ha−1, respectively.

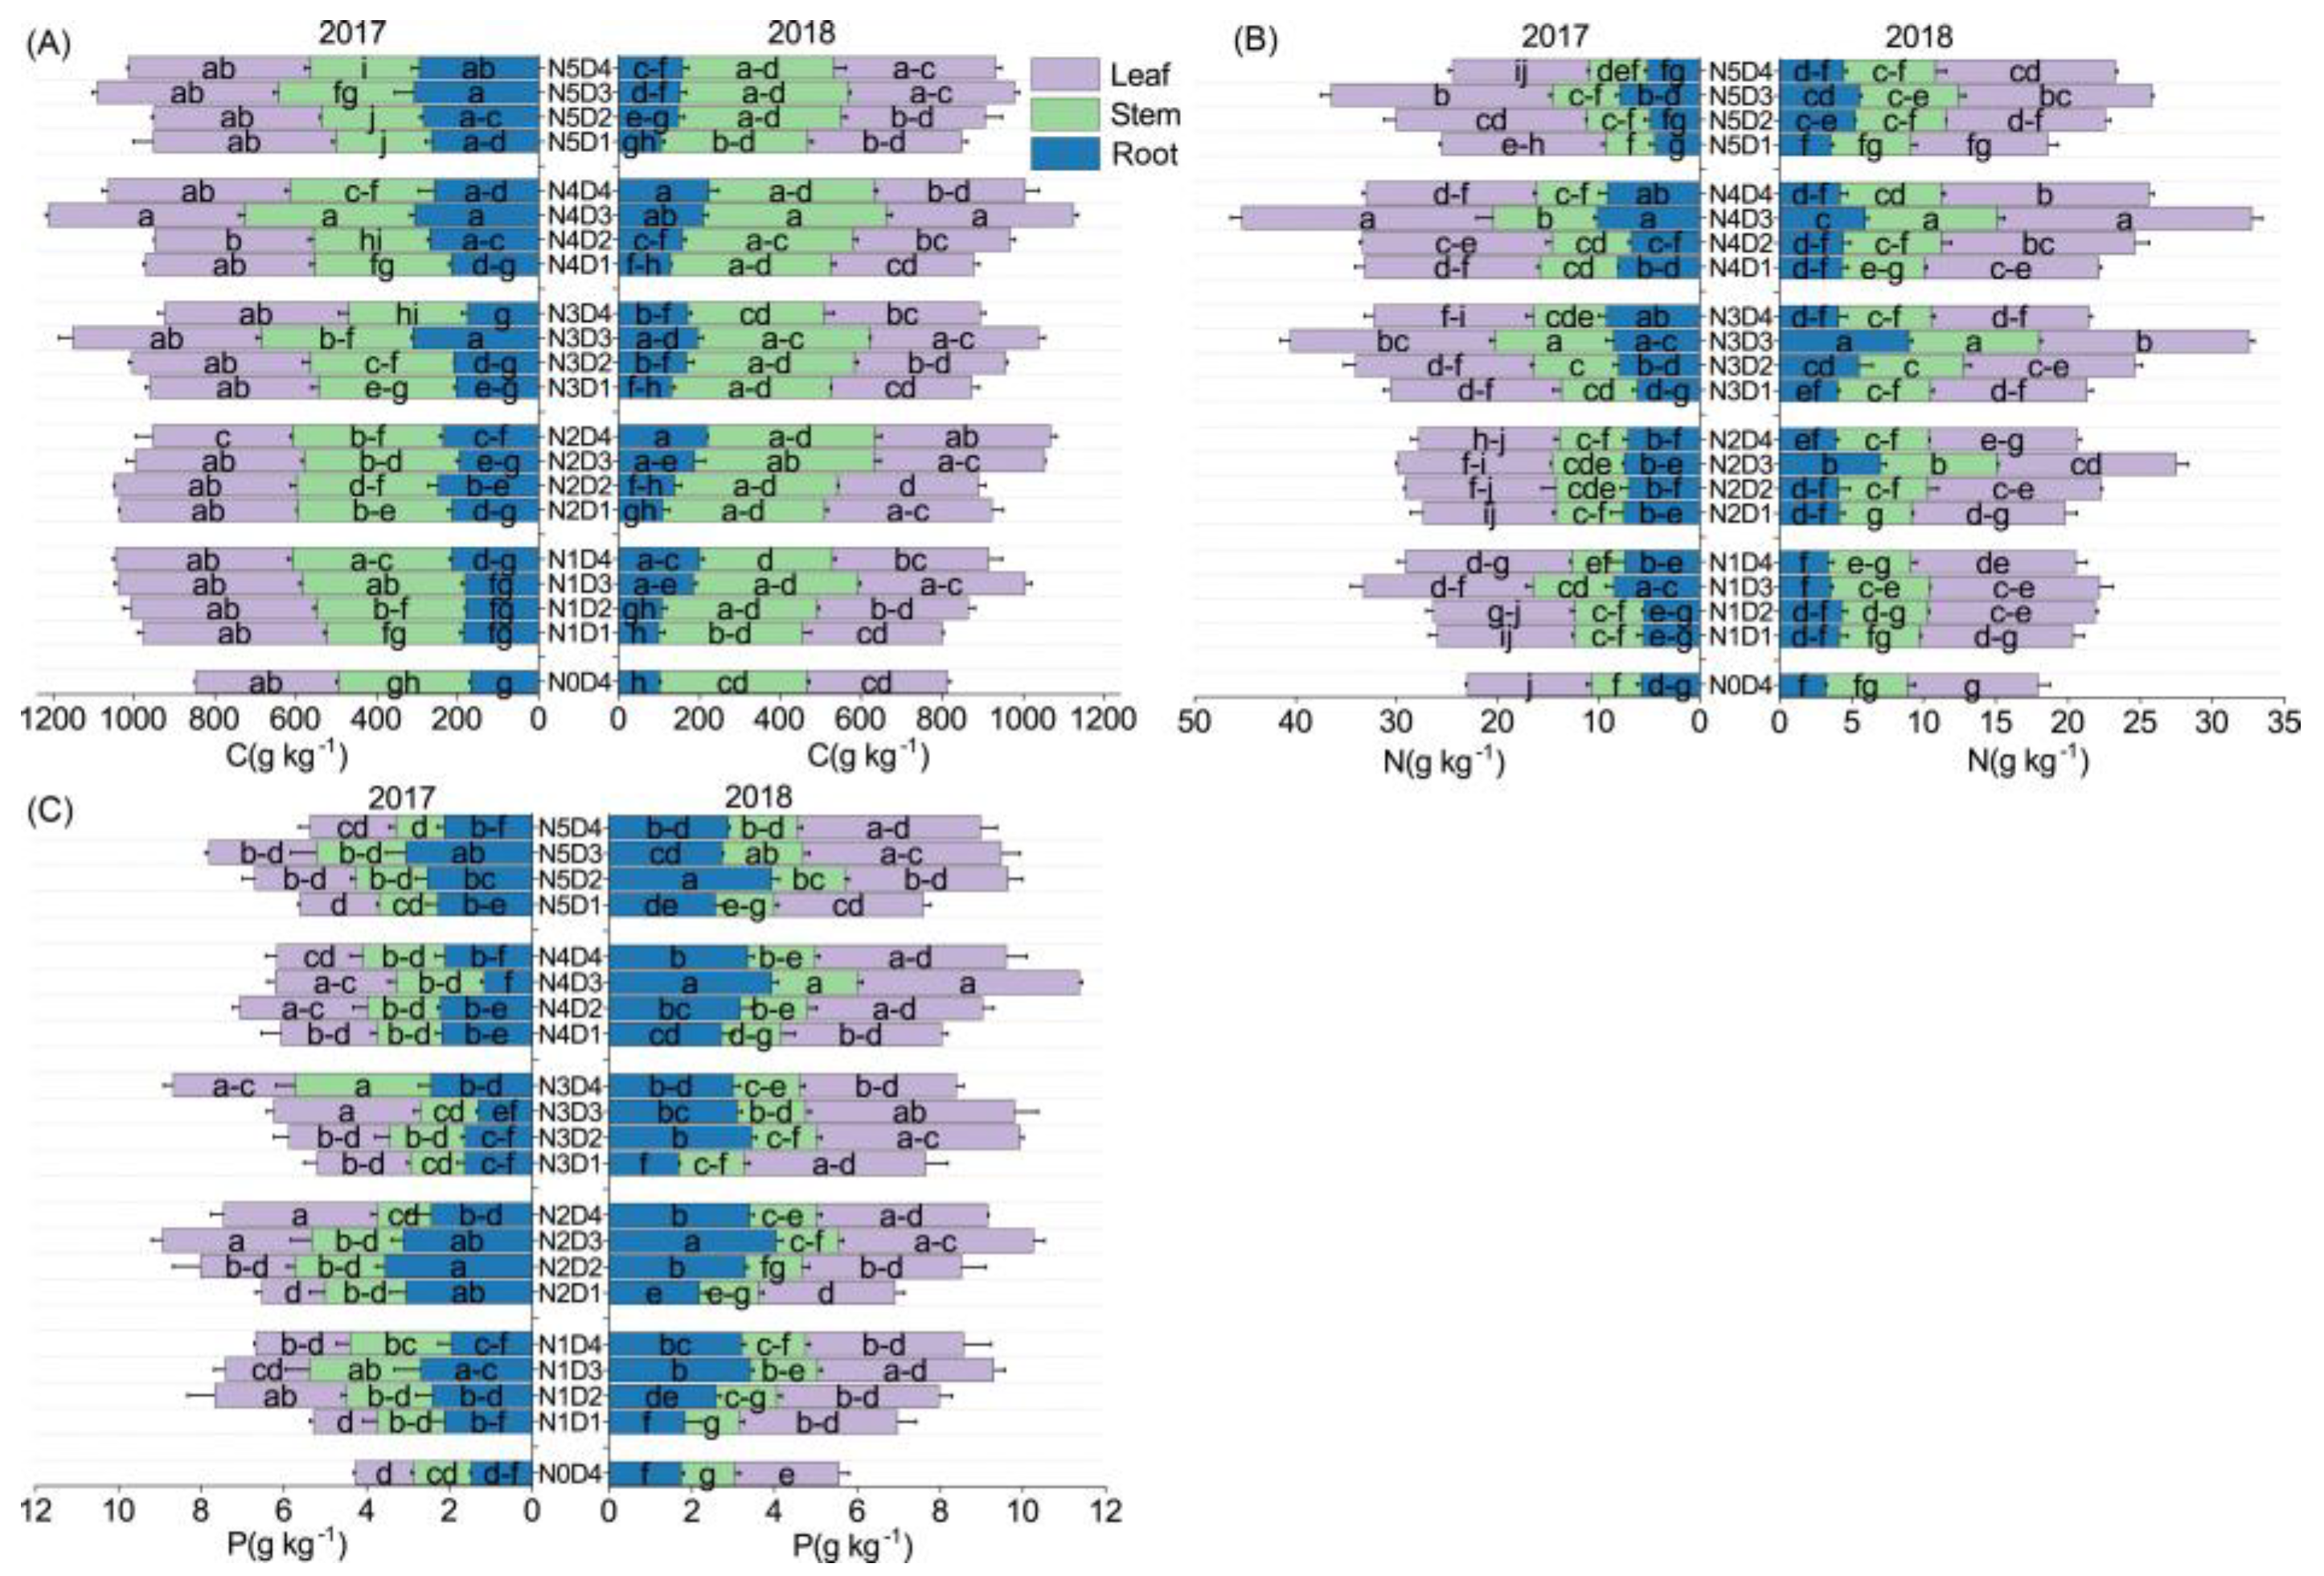
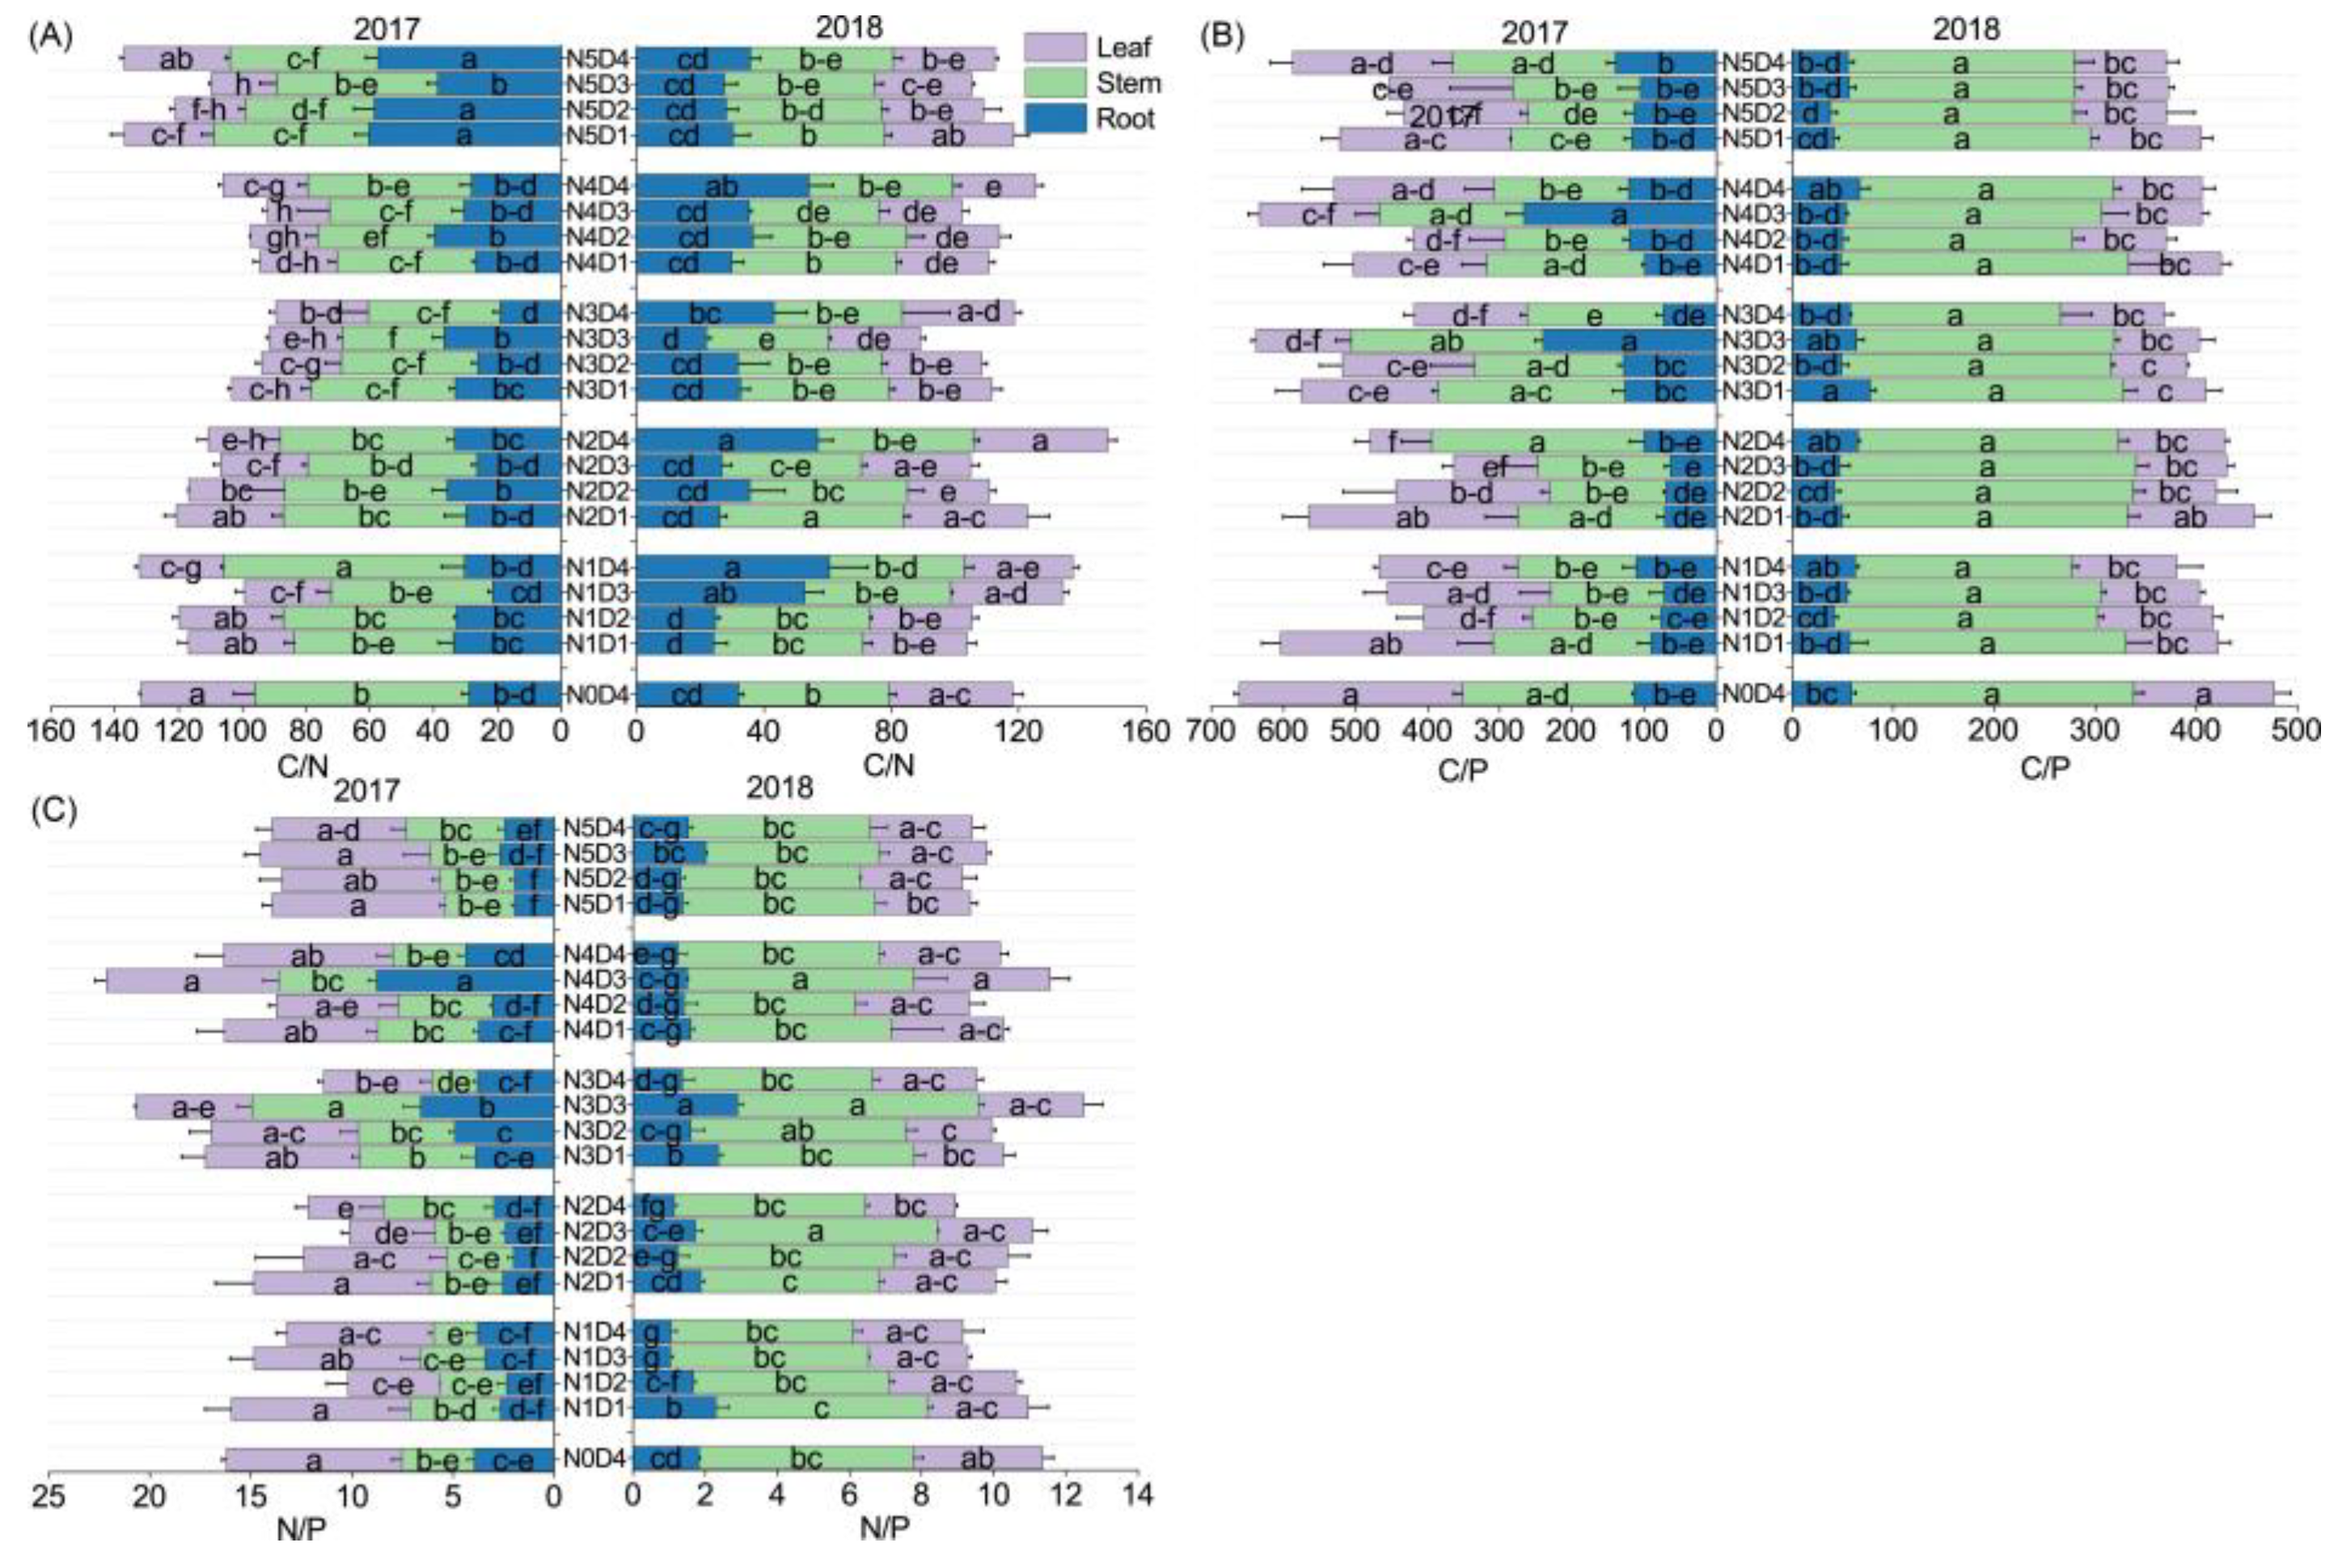
3.2. The C, N, and P Contents in the Different Organs of Oats

The C, N, and P contents of the oat leaves, stems, and roots changed in both years (Figure 4). In 2017 and 2018, the density and N rate had a sizable interaction effect on the stem C, N, and P contents. The maximum C contents of the stem occurred under the N4D3 treatment and were significantly different from the other treatments (p < 0.05), increasing by 53.03% and 72.67%, respectively, compared to the minimum in 2017 and 2018 (Figure 4A). The root N content ranged from 3.17 to 10.15 g kg−1 over the two years and was significantly higher in the N4D3 treatment in 2017 than in the other treatments in the same year and the N3D3 treatment in 2018 (p < 0.05). Applying the same amount of N at an increasing density first increased the leaf N content, which then declined, reaching its maximum value at the D3 density (Figure 4B). When D3 was applied, the density increased the P content to the highest observed value; however, the N rate lowered the P content in the experimental plots. The increase in stem P content with increased N application was minimal, except at the D3 density, at which the density was the same (Figure 4C). Overall, the C, N, and P contents were in the order of C > N > P in the leaves, and the leaf contents were higher than the stem contents (Figure 4).
The C:N:P ratios of the leaves and stems differed (Figure 5). Leaves from the N0D4 treatment had significantly higher C:N ratios than the other treatments in 2017, and leaves from the N2D4 treatment had significantly higher C:N ratios than the other treatments in 2018 (p < 0.05). In both years, C:N was significantly lower in the N4D3 treatment than in the other treatments for leaves (p < 0.05). In 2017 and 2018, the lowest C:N values of stems were in the N3D3 treatment, with values of 31.97 and 69.98 g kg⁻1, respectively (Figure 5A). The leaf C:P ratio was significantly higher (p < 0.05) in the N2D1 treatment than in the other treatments. In 2017, the stem C:P ratio was significantly higher (p < 0.05) for the N2D4 treatment than for the other treatments, but there was no significant influence between treatments for the stem C:P ratio in 2018. In 2017, the root C:P ratios were significantly higher in the N3D3 treatment than in the other treatments (Figure 5B). Furthermore, the stem N:P ratio in the N3D3 treatment was significantly higher (p < 0.05) than in the other treatments in 2017 and 2018. In 2018, the N:P ratios were significantly higher in the N3D3 treatment than in the roots of the other treatments (p < 0.05, Figure 5C).

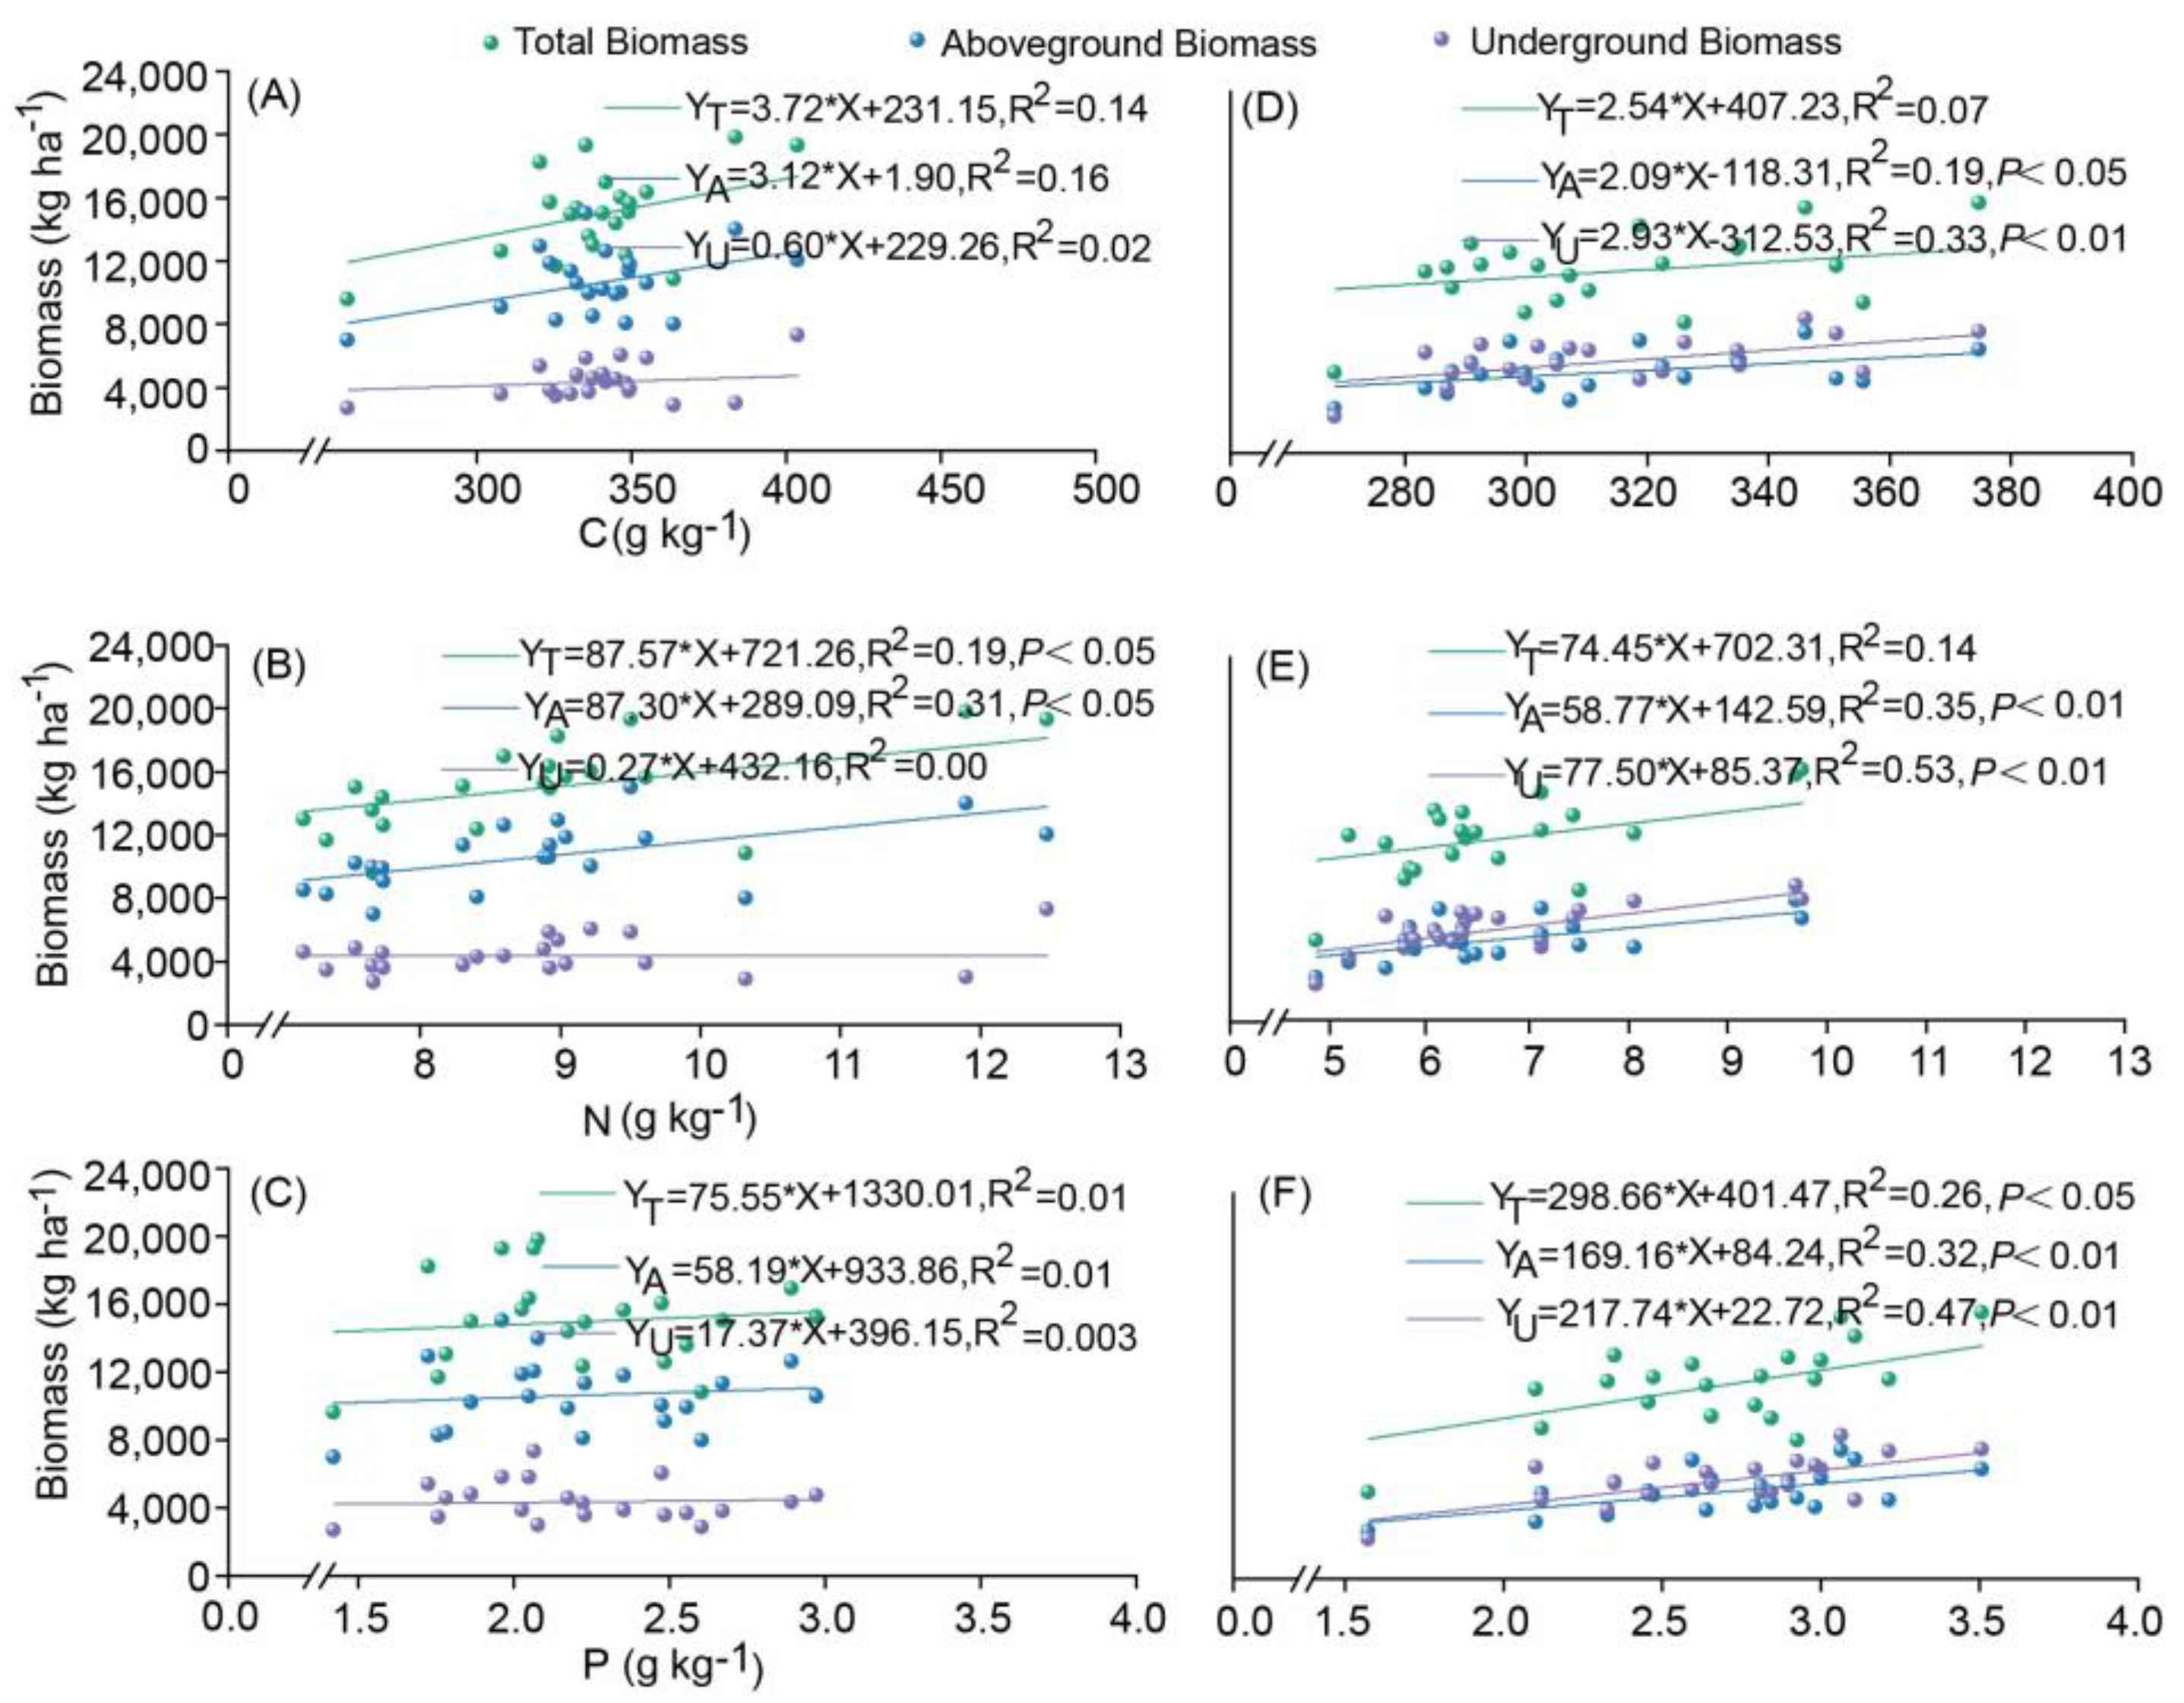
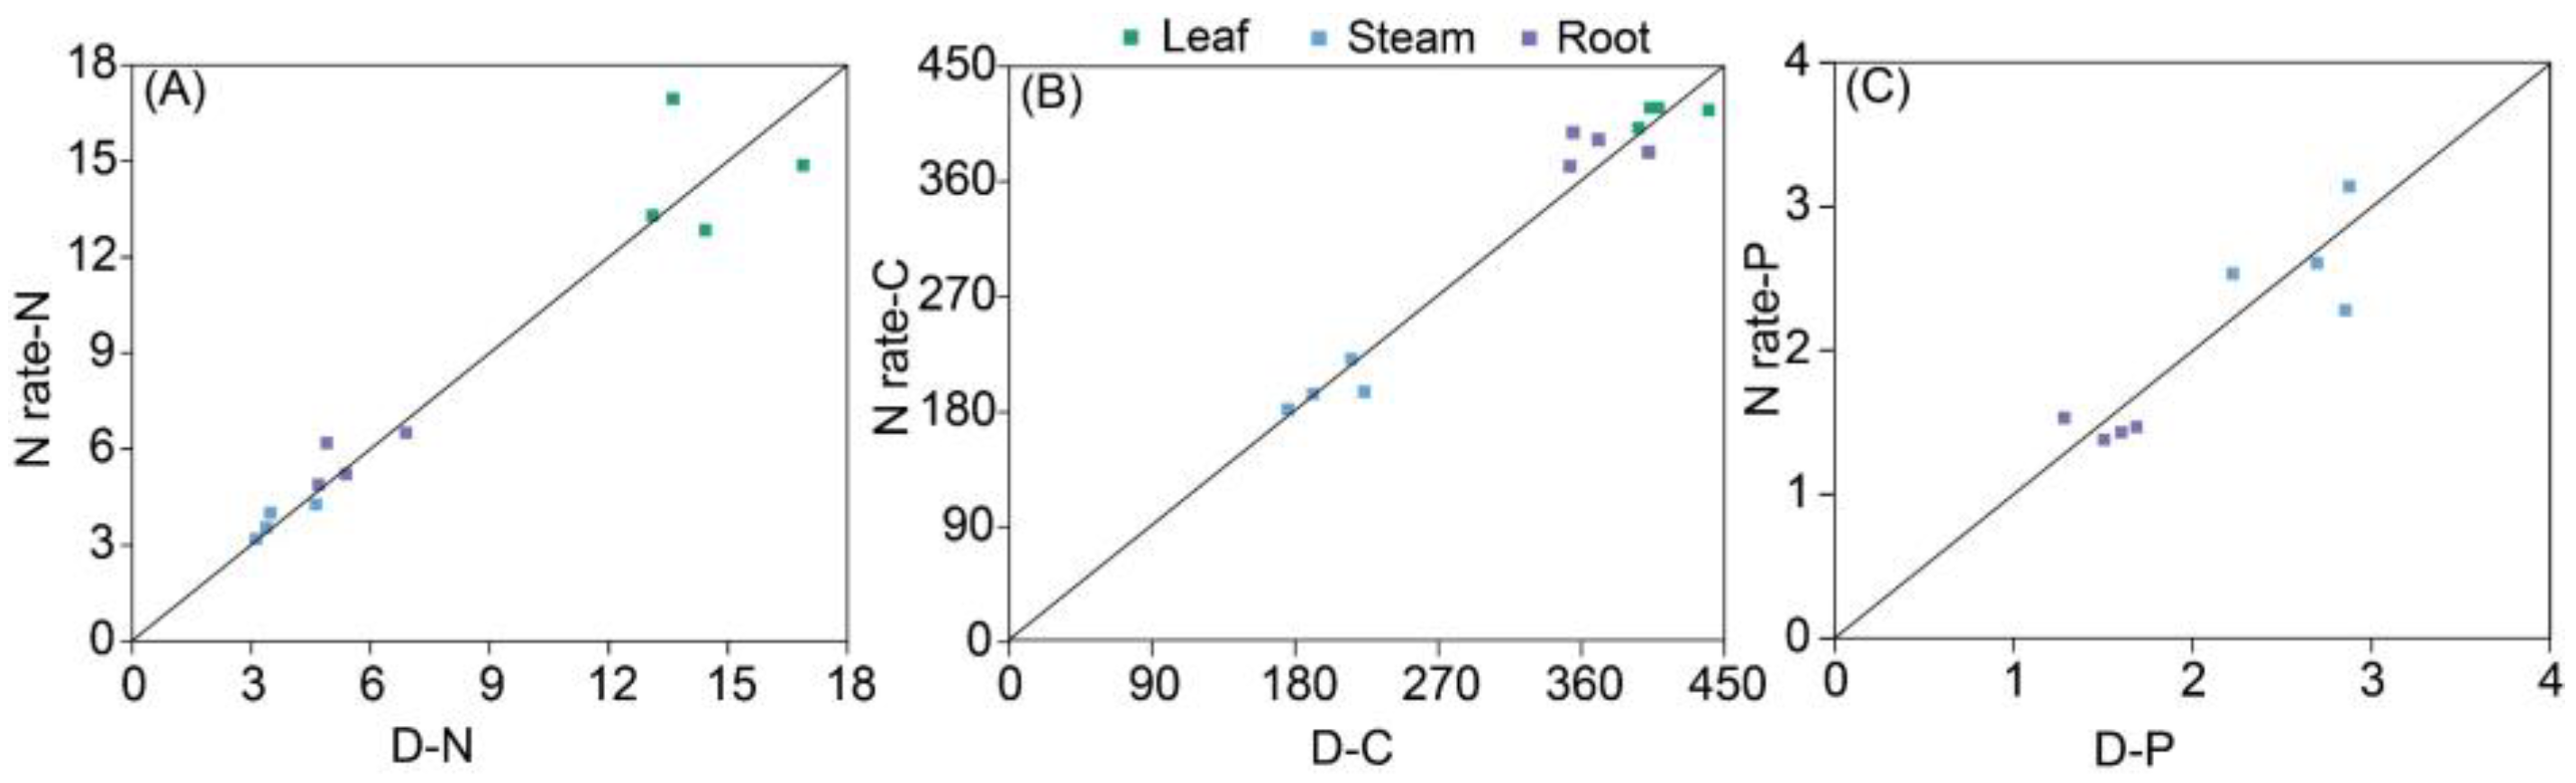
3.3. Relationships Between Plant Biomass and C, N, and P Contents of Plants

In 2017, there was a negative correlation between root biomass and root C and P contents (Figure 6A,C). In contrast, there was a positive correlation between leaf biomass and C, N, and P concentrations in 2017 and 2018 (Figure 6). The N and P contents of roots, stems, and leaves were highly and positively correlated with biomass in 2018 (p < 0.01, Figure 6E,F).
In 2017, there was a positive linear relationship between underground biomass, aboveground biomass, total biomass, and oat C, N, and P content (Figure 7A–C). Aboveground biomass and total biomass were found to be significantly correlated with plant N content (p < 0.05).
In 2018, there was a positive correlation between total biomass, aboveground biomass, belowground biomass, and oat C, N, and P content (Figure 7D–F). Aboveground biomass, underground biomass N and P, and underground biomass C were all significantly correlated (p < 0.01). The aboveground biomass was found to be significantly related to the C content (p < 0.05). Both the planting density and N rate affected the C, N, and P elements in different organs, but the N rate had a stronger effect than the planting density (Figure 8).

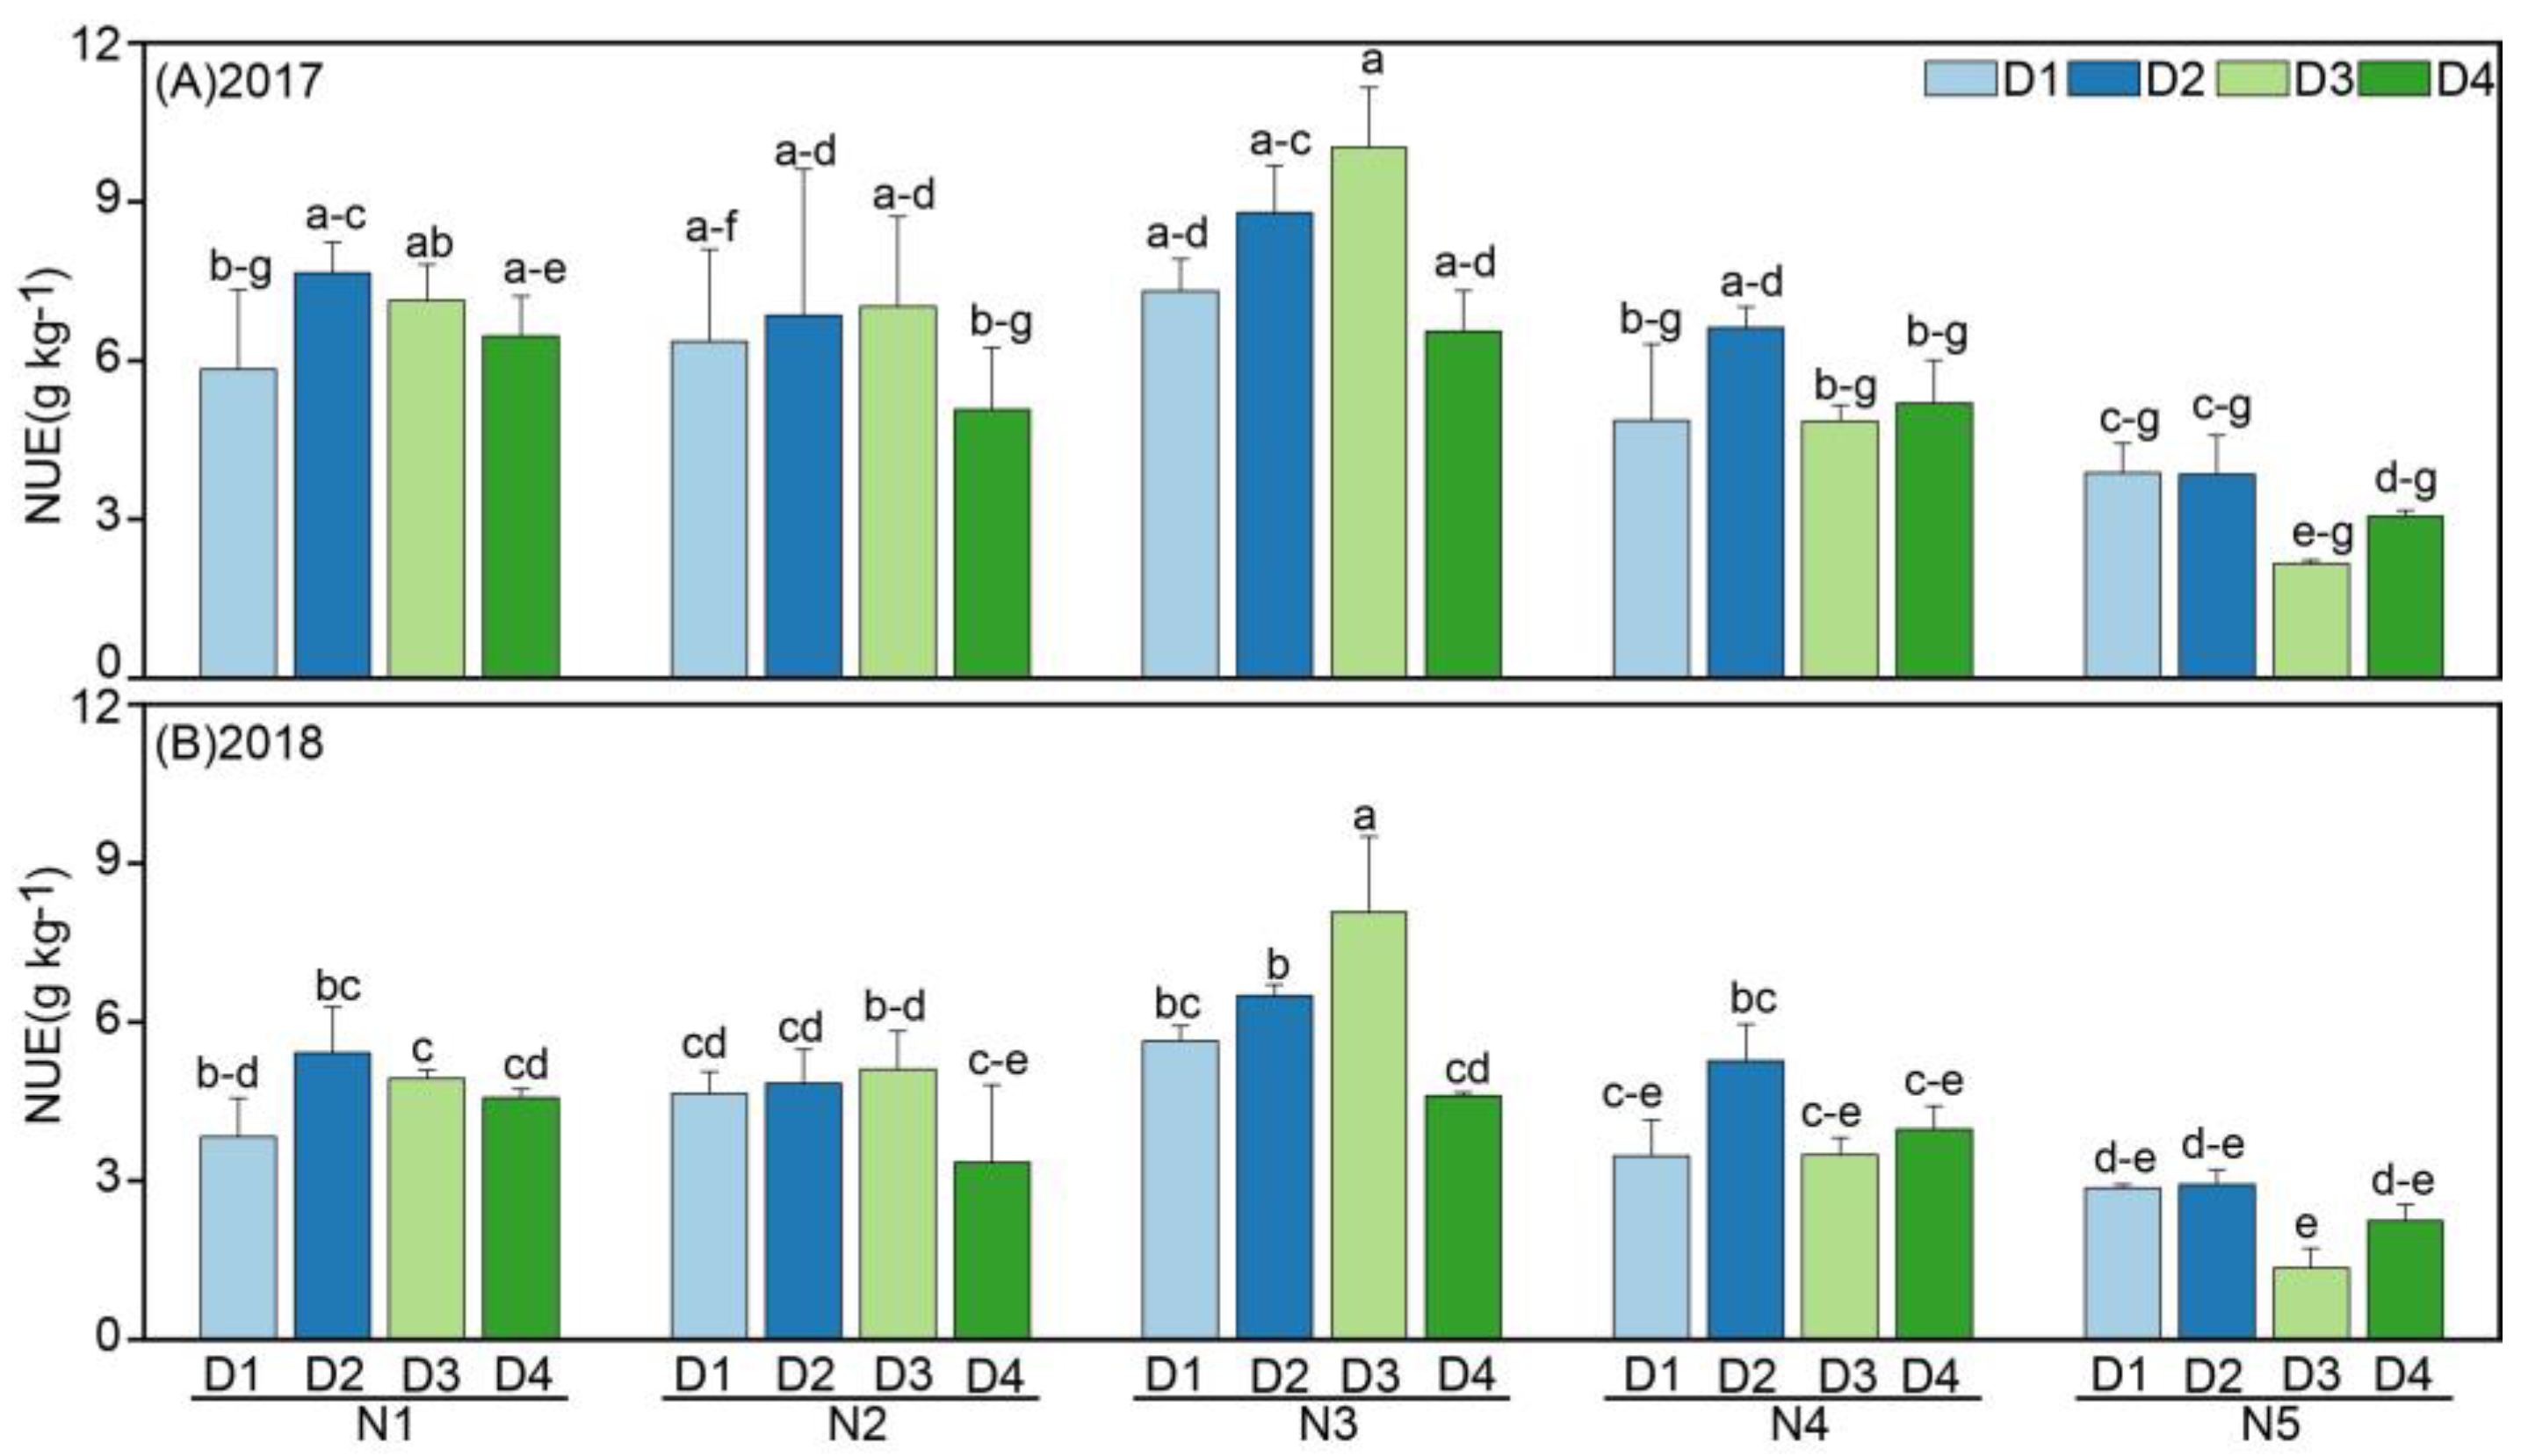
3.4. Effects of Planting Density and N Rate on the NUE of Oats

In 2017 and 2018, the agronomic NUE of oats first increased and then decreased significantly with the increasing N rate, and the agronomic NUE decreased significantly with the increasing N rate in the medium D3 treatment. The agronomic NUE under the moderate N rate was significantly higher than that under the low and high N rates when the planting density was D4. The agronomic NUE of oats first increased and then decreased with increasing planting density in the treatment with the low N rate, whereas in the treatments with moderate and high N rates, the agronomic NUE with D2 was greater than that with the other planting densities (Figure 9). The oat NUE was highest under the N3D3 treatment.

3.5. Effect of N Application and Planting Density on C, N, and P Content and Stoichiometric Ratio of the 0–30 cm Soil Layer

With varying planting densities, the soil C content was best under the D3 treatment, increasing by an average of eight percent compared to the farmer’s conventional planting practice, D2. As the N rate increased, the soil C content was higher under the N2 and N3 treatments. The soil C content under the N3D3 treatment was 32% higher than that under N0D2. With the increase in both the N rate and density, the soil C content gradually decreased; a reduction in the interaction of the N rate and density also led to a decrease in the soil C content. While the soil P concentrations were considerably greater in the N2D3 treatment, the soil C and N contents were significantly higher under the low N rate compared to the high N rate (p < 0.05). The soil P content and N:P values were significantly impacted by the planting density (p < 0.05), and the C:P values were significantly impacted by the combination of the N rate and density (p < 0.01) (Table 1). The maximum C:N value was 23.17, an increase of 51.83% compared to the minimum value. In comparison to the other treatments, the N3D4 and N4D3 treatments had greater soil N:P ratios.

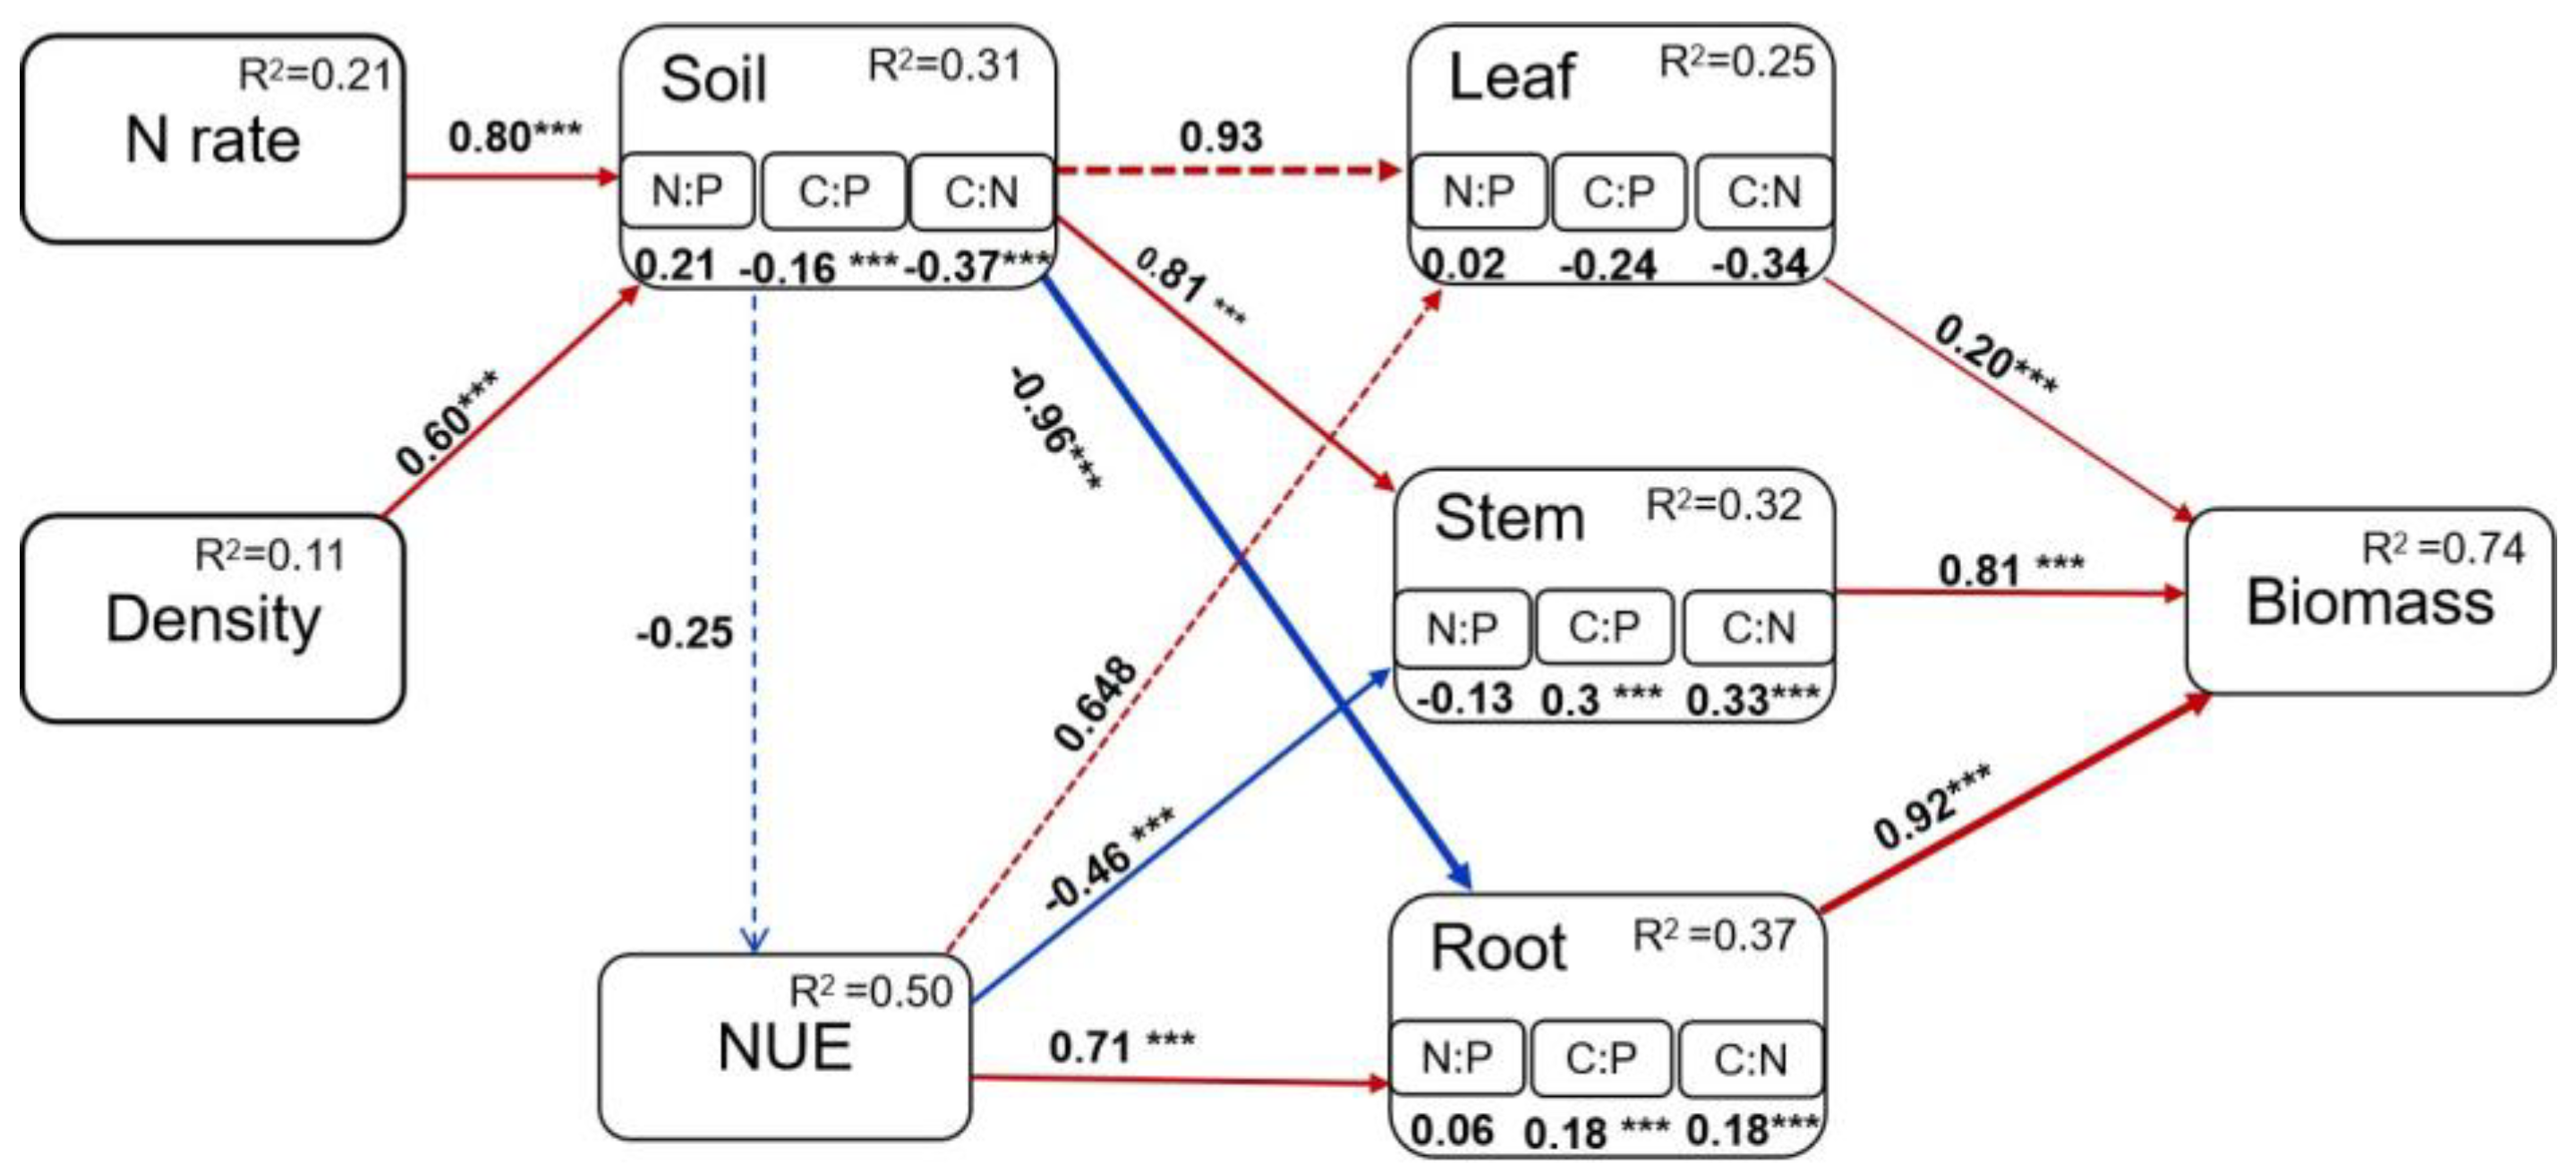
3.6. Regulation of N Rate and Planting Density on Oat Stoichiometry

Based on our prior conceptual models, the final SEM predicted that the N rate and planting density increases had significant effects on biomass (Figure 10). The SEM had an adequate fit (χ2 = 12.68, P = 0.69, df = 43, AIC = 45.78) and explained 74% of the variance in biomass N rate with planting density increases. Increasing the N rate and planting density drove the oat N use efficiency and soil C:N:P stoichiometry, with increasing soil N:P and decreasing C:N and C:P ratios. The oat N use efficiency and soil C:N:P stoichiometry had a significant positive effect on oat leaves and roots but a negative effect on stem stoichiometry. Ultimately, the stoichiometry of different organs positively determined the oat yield, with roots > stems > leaves.

4. Discussion

4.1. Effect of N Rate and Planting Density on the C:N:P Stoichiometry in Different Plant Organs

In contrast, the distribution of C, N, and P content in different oat organs for the N rate and planting density showed that the N rate had a stronger regulatory effect on nutrient elements than the planting density. Contrary to our expectation that increased nitrogen fertilization under N-limited conditions would promote an increase in the N and P contents of various organs [32], the N contents in our study showed a significant decrease with the high N rate. Excessive N fertilization leads to the inhibition of plant root growth, which in turn affects the rate of nutrient uptake by the root system and ultimately leads to a reduction in N content [33]. Meanwhile, the effects of a planting density that is too high on oats in this area are increased competition for light, space, and soil nutrients (especially nitrogen), weakened photosynthesis [34], and a slower rate of nutrient absorption by roots, stems, and leaves. Therefore, the nitrogen content of various oat organs is indirectly influenced. In our study, the C and N contents and their relative changes were higher in oat leaves than in roots, which is mainly due to the more active metabolic functions and higher nutrient requirements of leaves [35], which favor vegetative growth and promote the aboveground part of the plant. Meanwhile, the variation in the P content in stems, leaves, and roots can confirm that P shows a more complex response to N input (Figure 4). The variation in observed patterns between the increasing N input effects on plants could be due to the N rate stimulating root surface phosphomonoesterase activities [36], improving P conservation and accelerating P cycling rates [37]. Furthermore, in our study, the C content was much more stable than the N and P content in all the oat organs, suggesting that constant changes in oat nutrient consumption with the soil N rate and planting density in changing soil environments are an extremely conservative N and P utilization strategy in oats.
Plant continuity, in which a plant is composed of interrelated organs, can be revealed by systematic inquiries and collaborative analyses of the C:N ratio among various plant organs [38]. In this work, the N rate and density altered the stoichiometry of the soil and oats by decreasing the C:N and increasing the N:P ratios, as well as lowering the NUE (Figure 9). This is consistent with prior research that shown a significant reduction in plant C:N ratios and N utilization efficiency following experimental N rates [39]. Exogenous N intake boosted plant growth and N uptake, which may have led to an increase in plant N usage. Dense planting also improved the oat uptake of N and P during the entire growth period and enhanced nutrient use. Oats have adapted to low C:N ratios in order to boost their competitiveness and manufacture protein more quickly. With the addition of N and the planting density, the C:N ratio of the aboveground sections of oats decreased (Figure 5). We methodically investigated how density interactions and the N rate affected the C:N:P stoichiometry of several organs in oats [38]. Due to the need of nitrogen for respiration and photosynthesis, plants assigned more nitrogen to their more active organs, as evidenced by the C:N:P ratio in various plant organs. Because roots are rich in many secondary compounds of C, which might raise C:N and C:P ratios and decrease N uptake [40], none of the C:N:P ratios were decreased in the root system (Figure 3 and Figure 4). Despite the fact that the C:N:P ratios varied considerably amongst organs, they changed in the same direction (Figure 4). Comprehensive linear analyses of the biomass and corresponding C, N, and P contents of various oat organs during the two-year period showed that the changes in nutritional elements in leaves were most closely related to biomass compared to other organs, which may be due to the fact that leaves are a strong source of the transferal of carbohydrates to sinks through photosynthesis [41], which regulates the growth of oats (Figure 6 and Figure 7).
Plant growth may be co-restricted by both N and P, or it may not be limited by either, according to Güsewell [42], who also proposed that plant growth tends to be N-limited when the plant N:P ratio < 10 and P-limited when the plant N:P ratio > 20. Our results show that over the course of the study, the oat leaf N:P ratios varied from 2.41 to 8.86, with a mean of 4.99. The numbers were far below the minimum value of 10. Our findings imply that N is the finite element in these various treatments in the region. Researchers have placed comparatively little emphasis on the stoichiometric properties of other plant organs in comparison to leaves in response to the N rate. Concurrently, the N:P ratio of oat root systems was generally lower, making them more susceptible to N rate and density changes. This is because young leaves have more critical physiological needs and nutrient requirements, and plants must do all in their power to keep the nutrient composition of their leaves as stable as possible, either by nutrient transfer or reabsorption from other organs [43].

4.2. Changes in Soil Nutrient Conditions Affect Plant C:N:P Stoichiometry

The organic carbon content reached the highest value with the combination of a planting density and N rate of four million plants ha−1 and 173 kg ha−1, which was mainly due to the increase in underground biomass and the increase in microbial decomposition of the material after the increase in N fertilizer to promote the growth of the crop root system [44]. Secondly, with the increase in density, the underground biomass of oat roots increases, leading to an increase in the secretions produced, which, in combination with soil microorganisms, enhances the content of organic carbon [45]. When the N rate and planting density are too high, the soil C content decreases. This may be due to the excessive nitrogen application causing an increase in soil osmotic pressure, leading to root water loss and an increase in litterfall. At the same time, an increased density enhances competition among individuals, and growth limitations result in fewer sources of organic carbon in the soil [20]. Moreover, the region is characterized by a semi-arid sandy environment with scarce rainfall and limited soil carbon storage, which is even less capable of accommodating high nitrogen rates and planting densities. A low N rate could improve the soil N, while a high N rate decreases the soil N. This may be because a high N rate restrains the activity of soil microbes and decreases the soil N. From the perspective of population, the root fixation of N2 through soil–fungal symbiotic activities at low densities improves the soil’s N use efficiency; however, at high densities, increased root biomass is expected to stimulate root exudates into soils, promoting microbial activity, with the microbial storage of excess elements, resulting in a convergence between the biomass and resource stoichiometries [46,47]. The P content in the soil was higher with a low density and low N rate than with a high density and high N rate. This result may be related to the fact that low N rates and nutrient competition rates increased soil phosphorus, while high N rates inhibited soil biological activity and reduced the accumulation of soil phosphorus [48].
In this study, the C:N and C:P ratios were higher at medium and high N densities, so N3 and N4 nitrogen fertilizers together with D3 could improve the effectiveness of the soil N and P elements and contribute to the improvement of organic matter decomposition in the soil. This is a good explanation for the result that the changes in the soil NP content with nitrogen–density intercropping were more sensitive than the C content. The high C:N ratio of the soil organic layer shows that organic matter mineralizes more slowly, implying that the soil organic layer’s effective nitrogen concentration is lower [49]. The soil C:N ratio did not vary significantly across treatments. This is because, as structural components, carbon and nitrogen have a relatively constant ratio in the accumulation and consumption processes. The soil C:P ratio is often regarded as a marker of soil P mineralization, as well as an index for measuring the microbial mineralization of soil organic matter to release or absorb potential phosphorus from the environment [50]. The average soil C:P ratio was 25.29, which was lower than the intermediate level of Chinese soils (52.70). This value suggests that while the effectiveness of the soil P element and the mineralization efficiency of soil organic matter are high in the study area, the nutrient content is relatively low. This is likely due to the significant anthropogenic disturbance and soil erosion that occurred in this study area during the preceding period, which resulted in poor soil nutrient conditions. The soil N:P ratio can be used to assess if the soil is impacted by N or P restrictions, as well as N saturation, which shows the availability of soil nutrients during plant growth [42]. It is often believed that a low soil N:P ratio, which shows that plants are constrained by N, is better for community expansion [51]. The N rate and planting density altered the soil N:P ratio, with an average soil N:P ratio of 1.49, which is lower than the average for China (N:P ≈ 5.1) [52]. In particular, the very low rainfall of the region inhibited plant growth and decreased soil nutrients, which is why we detected lower concentrations of soil carbon, nitrogen, and phosphorus [53].

4.3. Regulatory Pathways of Nitrogen Rate and Density on Oat Stoichiometry

If the soil contains more nutrients and nitrogen is utilized more effectively, oats might be able to use their root system to absorb more nitrogen. The stem vascular bundles subsequently carry this nitrogen to the leaf and reproductive organs, providing a potent source for photosynthesis in the leaf and the storage of carbohydrates in the stem. Sufficient nitrogen sources caused assimilates from photosynthesis in the leaf to be stored in the stem as non-structural carbohydrates, which led to irregular stoichiometry in the stems and leaves. Thus, the NUE and soil stoichiometry produce inconsistent regulation of stem, leaf, and root stoichiometry (Figure 10). In this study, the N rate and planting density used in N3D3 resulted in the best NUE, indicating that this treatment provided the best cost–benefit ratio. It is possible that some oat root and litter residues increased exogenous C inputs, which in turn accelerated the rate of nitrate N assimilation in the soil. This improved the soil’s ability to store and deliver nitrogen by converting nitrate N into microbial biomass N for storage. This was subsequently progressively released through rejuvenation [54]. This explains the difference in N use efficiency between the two years. The effective N content in the soil was higher than that in 2017, and the soil environment was more suitable, which led to the overall N use efficiency of oats in 2018 being lower than that in 2017.

5. Conclusions

The adjustment of nutrient partitioning and stoichiometric ratios by plants under different N additions and planting densities is a key strategy to adapt to environmental changes. This study showed that carbon, nitrogen, and phosphorus uptake by oats under the interaction of the addition of nitrogen and planting density ranged from 263.41 to 389.43, 6.27 to 11.19, and 1.50 to 3.10 g kg−1, respectively. The study found that an increase in planting density and N addition led to an increase in forage biomass, followed by a subsequent decrease. At the N rate of 173 kg ha−1, the optimal biomass was 9221.74 kg ha−1; the C, N, and P uptake were 389.43 g kg−1, 11.19 g kg−1, and 3.10 g kg−1, respectively. The maximum thresholds for C, N, and P uptake were 356.45, 9.47, and 2.78 g kg−1 at the planting density of four million plants kg ha−1; the biomass was 6276.10 kg ha−1. At the organ level, the highest N and P contents and N:P ratio were found in leaves (the most active organ). Elemental plasticity was higher in roots than in leaves. In the sandy area, when the planting density is four million plants kg ha−1 and the nitrogen fertilizer application rate is 173 kg ha−1, the increase in biomass is five times higher than that of the poorest treatment (a planting density of four million plants ha−1 and N rate of 242 kg ha−1), and an optimal nutrient balance is achieved.

Author Contributions

Z.L.: Writing—Review and editing, Writing—Original draft, Methodology, Investigation, Formal analysis, Conceptualization. J.D.: Writing—Review and editing, Supervision, Methodology. K.G.: Writing—Review and editing, Supervision, Methodology, Funding acquisition, Conceptualization. Z.Z.: Writing—Review and editing, Supervision, Resources, Project administration, Methodology, Investigation, Conceptualization. All authors have read and agreed to the published version of the manuscript.

Funding

This study was funded by the Inner Mongolia Autonomous Region Grassland Talents Project (CYYC20005).

Data Availability Statement

Data will be made available upon request.

Conflicts of Interest

The authors declare that they have no known competing financial interests or personal relationships that could have appeared to influence the work reported in this paper.

References

  1. Kang, X.; Liu, T.; Hao, L.; Duan, L.; Wang, G.; Singh, V.P.; Zhang, M.; Wu, R.; Ma, K. Carbon dynamics of the plant-soil system during vegetation succession in dune-meadow cascade ecosystems in Horqin Sandy Land, China. Ecol. Indic. 2023, 155, 110916. [Google Scholar] [CrossRef]
  2. Sui, Y.; Yuan, H. Agroecological and economic approach of prevention and curing of sandstorms in China. Ecol. Econ. 2007, 61, 129–133. [Google Scholar] [CrossRef]
  3. Kairis, O.; Karavitis, C.; Kounalaki, A.; Salvati, L.; Kosmas, C. The effect of land management practices on soil erosion and land desertification in an olive grove. Soil Use Manag. 2013, 29, 597–606. [Google Scholar] [CrossRef]
  4. Verón, S.R.; Paruelo, J.M.; Oesterheld, M. Grazing-induced losses of biodiversity affect the transpiration of an arid ecosystem. Oecologia 2011, 165, 501–510. [Google Scholar] [CrossRef]
  5. Hayatu, N.G.; Liu, Y.-R.; Han, T.-F.; Daba, N.A.; Zhang, L.; Shen, Z.; Li, J.-W.; Muazu, H.; Lamlom, S.F.; Zhang, H.-M. Carbon sequestration rate, nitrogen use efficiency and rice yield responses to long-term substitution of chemical fertilizer by organic manure in a rice–rice cropping system. J. Integr. Agric. 2023, 22, 2848–2864. [Google Scholar] [CrossRef]
  6. Li, Y.; Tian, L.; Zhou, H.; Wang, H.; He, X.; Jin, Y.; Zhang, H. Comparison of water use efficiency of sand-binding species along revegetation chronosequence in an alpine desert. Ecol. Indic. 2023, 153, 110475. [Google Scholar] [CrossRef]
  7. Pan, Y.-X.; Wang, X.-P.; Ma, X.-Z.; Zhang, Y.-F.; Hu, R. The stable isotopic composition variation characteristics of desert plants and water sources in an artificial revegetation ecosystem in Northwest China. CATENA 2020, 189, 104499. [Google Scholar] [CrossRef]
  8. Tamburini, G.; Aguilera, G.; Öckinger, E. Grasslands enhance ecosystem service multifunctionality above and below-ground in agricultural landscapes. J. Appl. Ecol. 2022, 59, 3061–3071. [Google Scholar] [CrossRef]
  9. Ibrahimi, K.; Alghamdi, A.G. Available water capacity of sandy soils as affected by biochar application: A meta-analysis. CATENA 2022, 214, 106281. [Google Scholar] [CrossRef]
  10. Hayatu, N.G.; Noma, S.; Nabayi, A.; Abdelsattar, M.; Haruna, F.; Amadou, A.; Sani, I.; Sharu, M.B.; Anka, A.B.; Abubakar, S.D. Characterization And Classification Of Soils On Grazing Lands In Kwallatawa Village, Sokoto State, Nigeria. SVU-Int. J. Agric. Sci. 2020, 2, 326–339. [Google Scholar] [CrossRef]
  11. Dal Molin, S.J.; Ernani, P.R.; Gerber, J.M. Soil acidification and nitrogen release following application of nitrogen fertilizers. Commun. Soil Sci. Plant Anal. 2020, 51, 2551–2558. [Google Scholar] [CrossRef]
  12. Francis, B.; Aravindakumar, C.T.; Brewer, P.B.; Simon, S. Plant nutrient stress adaptation: A prospect for fertilizer limited agriculture. Environ. Exp. Bot. 2023, 213, 105431. [Google Scholar] [CrossRef]
  13. Da Silva, J.M.; Fontes, P.C.R.; Milagres, C.d.C.; de Abreu, J.A.A. Yield and nitrogen use efficiency of bell pepper grown in SLAB fertigated with different nitrogen rates. J. Plant Nutr. 2020, 43, 2833–2843. [Google Scholar] [CrossRef]
  14. Wu, X.; Li, Z.; Li, W.; Xue, X.; Yang, L.; Xu, J.; Yang, B.; Ding, R.; Jia, Z.; Zhang, X.; et al. Reducing fertilization with high planting density increases maize yield stability and nitrogen use efficiency in semi-arid areas. Eur. J. Agron. 2024, 159, 127223. [Google Scholar] [CrossRef]
  15. Zhang, W.; Fu, Z.; Zhao, X.; Guo, H.; Yan, L.; Zhou, M.; Zhang, L.; Ye, Y.; Liu, W.; Xu, Y.; et al. Comparison of Carbon Footprint Differences in Nitrogen Reduction and Density Increase in Double Cropping Rice under Two Evaluation Methods. Agronomy 2024, 14, 803. [Google Scholar] [CrossRef]
  16. Luo, Z.; Song, H.; Huang, M.; Zhang, Z.; Peng, Z.; Zi, T.; Tian, C.; Eissa, M.A. Nitrogen-Reduction in Intensive Cultivation Improved Nitrogen Fertilizer Utilization Efficiency and Soil Nitrogen Mineralization of Double-Cropped Rice. Agronomy 2022, 12, 1103. [Google Scholar] [CrossRef]
  17. Evers, B.J.; Blanco-Canqui, H.; Staggenborg, S.A.; Tatarko, J. Dedicated Bioenergy Crop Impacts on Soil Wind Erodibility and Organic Carbon in Kansas. Agron. J. 2013, 105, 1271–1276. [Google Scholar] [CrossRef]
  18. Yan, Z.B.; Tian, D.; Huang, H.Y.; Sun, Y.F.; Hou, X.H.; Han, W.X.; Guo, Y.L.; Fang, J.Y. Interactive effects of plant density and nitrogen availability on the biomass production and leaf stoichiometry of Arabidopsis thaliana. J. Plant Ecol. 2023, 16, 101. [Google Scholar] [CrossRef]
  19. Musa, A.; Zhang, Y.; Cao, J.; Wang, Y.; Liu, Y. Relationship between root distribution characteristics of Mongolian pine and the soil water content and groundwater table in Horqin Sandy Land, China. Trees 2019, 33, 1203–1211. [Google Scholar] [CrossRef]
  20. Gao, Y.; Chen, J.; Wang, G.; Liu, Z.; Sun, W.; Zhang, Y.; Zhang, X. Different Responses in Root Water Uptake of Summer Maize to Planting Density and Nitrogen Fertilization. Front. Plant Sci. 2022, 13, 918043. [Google Scholar] [CrossRef]
  21. Hu, B.; Bourennane, H.; Arrouays, D.; Denoroy, P.; Lemercier, B.; Saby, N.P.A. Developing pedotransfer functions to harmonize extractable soil phosphorus content measured with different methods: A case study across the mainland of France. Geoderma 2021, 381, 114645. [Google Scholar] [CrossRef]
  22. Zhang, J.; Li, M.; Xu, L.; Zhu, J.; Dai, G.; He, N. C:N:P stoichiometry in terrestrial ecosystems in China. Sci. Total Environ. 2021, 795, 148849. [Google Scholar] [CrossRef] [PubMed]
  23. Meharg, A. Marschner’s Mineral Nutrition of Higher Plants. 3rd edition. Edited by P. Marschner. Amsterdam, Netherlands: Elsevier/Academic Press (2011), pp. 684, US$124.95. ISBN 978-0-12-384905-2. Exp. Agric. 2012, 48, 305. [Google Scholar] [CrossRef]
  24. Verzeaux, J.; Alahmad, A.; Habbib, H.; Nivelle, E.; Roger, D.; Lacoux, J.; Decocq, G.; Hirel, B.; Catterou, M.; Spicher, F.; et al. Cover crops prevent the deleterious effect of nitrogen fertilisation on bacterial diversity by maintaining the carbon content of ploughed soil. Geoderma 2016, 281, 49–57. [Google Scholar] [CrossRef]
  25. Peng, Z.; Wu, Y.; Guo, L.; Yang, L.; Wang, B.; Wang, X.; Liu, W.; Su, Y.; Wu, J.; Liu, L. Foliar nutrient resorption stoichiometry and microbial phosphatase catalytic efficiency together alleviate the relative phosphorus limitation in forest ecosystems. New Phytol. 2023, 238, 1033–1044. [Google Scholar] [CrossRef]
  26. Xiao, Y.; Liu, X.; Zhang, L.; Song, Z.; Zhou, S. The allometry of plant height explains species loss under nitrogen addition. Ecol. Lett. 2021, 24, 553–562. [Google Scholar] [CrossRef]
  27. Borer, E.T.; Seabloom, E.W.; Gruner, D.S.; Harpole, W.S.; Hillebrand, H.; Lind, E.M.; Adler, P.B.; Alberti, J.; Anderson, T.M.; Bakker, J.D.; et al. Herbivores and nutrients control grassland plant diversity via light limitation. Nature 2014, 508, 517–520. [Google Scholar] [CrossRef]
  28. Pylak, M.; Oszust, K.; Frąc, M. Optimization of Growing Medium and Preservation Methods for Plant Beneficial Bacteria, and Formulating a Microbial Biopreparation for Raspberry Naturalization. Agronomy 2021, 11, 2521. [Google Scholar] [CrossRef]
  29. Ostrowska, A.; Gawliński, S.; Szczubiałka, Z. Methods of Analysis and Assessment of Soil and Plant Properties; Instytut Ochrony Srodowiska: Warszawa, Poland, 1991. [Google Scholar]
  30. Ma, Z.; Zeng, Y.; Wu, J.; Zhou, Q.; Hou, F. Plant litter influences the temporal stability of plant community biomass in an alpine meadow by altering the stability and asynchrony of plant functional groups. Funct. Ecol. 2022, 36, 148–158. [Google Scholar] [CrossRef]
  31. Shipley, B. The AIC model selection method applied to path analytic models compared using a d-separation test. Ecology 2013, 94, 560–564. [Google Scholar] [CrossRef]
  32. Sardans, J.; Alonso, R.; Janssens, I.A.; Carnicer, J.; Vereseglou, S.; Rillig, M.C.; Fernández-Martínez, M.; Sanders, T.G.M.; Peñuelas, J. Foliar and soil concentrations and stoichiometry of nitrogen and phosphorous across European Pinus sylvestris forests: Relationships with climate, N deposition and tree growth. Funct. Ecol. 2016, 30, 676–689. [Google Scholar] [CrossRef]
  33. Sattelmacher, B.; Klotz, F.; Marschner, H. Influence of the nitrogen level on root growth and morphology of two potato varieties differing in nitrogen acquisition. Plant Soil 1990, 123, 131–137. [Google Scholar] [CrossRef]
  34. Zhang, Q.; Xie, J.; Lyu, M.; Xiong, D.; Wang, J.; Chen, Y.; Li, Y.; Wang, M.; Yang, Y. Short-term effects of soil warming and nitrogen addition on the N:P stoichiometry of Cunninghamia lanceolata in subtropical regions. Plant Soil 2017, 411, 395–407. [Google Scholar] [CrossRef]
  35. Hedwall, P.-O.; Bergh, J.; Brunet, J. Phosphorus and nitrogen co-limitation of forest ground vegetation under elevated anthropogenic nitrogen deposition. Oecologia 2017, 185, 317–326. [Google Scholar] [CrossRef] [PubMed]
  36. Chang, J.; Ciais, P.; Gasser, T.; Smith, P.; Herrero, M.; Havlík, P.; Obersteiner, M.; Guenet, B.; Goll, D.S.; Li, W.; et al. Climate warming from managed grasslands cancels the cooling effect of carbon sinks in sparsely grazed and natural grasslands. Nat. Commun. 2021, 12, 118. [Google Scholar] [CrossRef]
  37. Marklein, A.R.; Houlton, B.Z. Nitrogen inputs accelerate phosphorus cycling rates across a wide variety of terrestrial ecosystems. New Phytol. 2012, 193, 696–704. [Google Scholar] [CrossRef]
  38. Zhang, Y.-W.; Shangguan, Z.-P. Interaction of soil water storage and stoichiometrical characteristics in the long-term natural vegetation restoration on the Loess Plateau. Ecol. Eng. 2018, 116, 7–13. [Google Scholar] [CrossRef]
  39. Liu, X.; Lamb, E.G.; Zhang, S. Nitrogen addition impacts on soil microbial stoichiometry are driven by changes in plant resource stoichiometry not by the composition of main microbial groups in an alpine meadow. Biol. Fertil. Soils 2020, 56, 261–271. [Google Scholar] [CrossRef]
  40. Zhang, J.; He, N.; Liu, C.; Xu, L.; Chen, Z.; Li, Y.; Wang, R.; Yu, G.; Sun, W.; Xiao, C.; et al. Variation and evolution of C:N ratio among different organs enable plants to adapt to N-limited environments. Glob. Change Biol. 2020, 26, 2534–2543. [Google Scholar] [CrossRef]
  41. Tegeder, M.; Masclaux-Daubresse, C. Source and sink mechanisms of nitrogen transport and use. New Phytol. 2018, 217, 35–53. [Google Scholar] [CrossRef]
  42. Güsewell, S. N:P ratios in terrestrial plants: Variation and functional significance. New Phytol. 2004, 164, 243–266. [Google Scholar] [CrossRef] [PubMed]
  43. Zhao, F.; Bin, Y.; Zhu, X.; Ma, S.; Xie, E.; Zeng, H.; Li, C.; Wu, J. An increase in intercropped species richness improves plant water use but weakens the nutrient status of both intercropped plants and soil in rubber–tea agroforestry systems. Agric. Water Manag. 2023, 284, 108353. [Google Scholar] [CrossRef]
  44. Khan, S.A.; Mulvaney, R.L.; Ellsworth, T.R.; Boast, C.W. The myth of nitrogen fertilization for soil carbon sequestration. J. Env. Qual. 2007, 36, 1821–1832. [Google Scholar] [CrossRef]
  45. Shafiq, F.; Anwar, S.; Khan, S. Editorial: Advances in plant-soil nitrogen management strategies. Front. Plant Sci. 2024, 15, 1380284. [Google Scholar] [CrossRef]
  46. Fraser, T.D.; Lynch, D.H.; Gaiero, J.; Khosla, K.; Dunfield, K.E. Quantification of bacterial non-specific acid (phoC) and alkaline (phoD) phosphatase genes in bulk and rhizosphere soil from organically managed soybean fields. Appl. Soil Ecol. 2017, 111, 48–56. [Google Scholar] [CrossRef]
  47. Gutiérrez Castorena, E.V.; Gutiérrez-Castorena, M.d.C.; González Vargas, T.; Cajuste Bontemps, L.; Delgadillo Martínez, J.; Suástegui Méndez, E.; Ortiz Solorio, C.A. Micromapping of microbial hotspots and biofilms from different crops using digital image mosaics of soil thin sections. Geoderma 2016, 279, 11–21. [Google Scholar] [CrossRef]
  48. Adhikary, P.P.; Mohanty, S.; Rautaray, S.K.; Manikandan, N.; Mishra, A. Alternate wetting and drying water management can reduce phosphorus availability under lowland rice cultivation irrespective of nitrogen level. Environ. Monit. Assess. 2023, 195, 1420. [Google Scholar] [CrossRef]
  49. Yang, Y.; Liu, B.-R.; An, S.-S. Ecological stoichiometry in leaves, roots, litters and soil among different plant communities in a desertified region of Northern China. CATENA 2018, 166, 328–338. [Google Scholar] [CrossRef]
  50. Boudjabi, S.; Chenchouni, H. Soil fertility indicators and soil stoichiometry in semi-arid steppe rangelands. CATENA 2022, 210, 105910. [Google Scholar] [CrossRef]
  51. Schreeg, L.A.; Santiago, L.S.; Wright, S.J.; Turner, B.L. Stem, root, and older leaf N:P ratios are more responsive indicators of soil nutrient availability than new foliage. Ecology 2014, 95, 2062–2068. [Google Scholar] [CrossRef]
  52. Tian, H.; Chen, G.; Zhang, C.; Melillo, J.M.; Hall, C.A.S. Pattern and variation of C:N:P ratios in China’s soils: A synthesis of observational data. Biogeochemistry 2010, 98, 139–151. [Google Scholar] [CrossRef]
  53. Liu, R.; Zhao, H.; Zhao, X.; Drake, S. Facilitative effects of shrubs in shifting sand on soil macro-faunal community in Horqin Sand Land of Inner Mongolia, Northern China. Eur. J. Soil Biol. 2011, 47, 316–321. [Google Scholar] [CrossRef]
  54. Nendel, C.; Melzer, D.; Thorburn, P.J. The nitrogen nutrition potential of arable soils. Sci. Rep. 2019, 9, 5851. [Google Scholar] [CrossRef]
Figure 1. Coordinates of the study site.
Agronomy 15 00150 g001
Figure 2. Monthly dynamics of precipitation and temperature from 2017 to 2018.
Agronomy 15 00150 g002
Figure 3. Oat biomass discrepancy (ΔBiomass) in 2017 and 2018. * Significant effects at p < 0.05; ** Significant effects at p < 0.01. Different lowercase letters indicate significant differences among different treatments.
Agronomy 15 00150 g003
Figure 4. C (A), N (B), P (C) concentrations of oat leaves, stems, and roots under different treatments. Data are shown as means ± SE. Different lowercase letters indicate significant differences among different treatments.
Agronomy 15 00150 g004
Figure 5. C/N (A), C/P (B), N/P (C) of oat leaves, stems, and roots under different treatments. Data are shown as means ± SE. Different lowercase letters indicate significant differences among different treatments.
Agronomy 15 00150 g005
Figure 6. Correlation between the biomass of each organ and its C, N, and P contents in oats in 2017 (AC) and 2018 (DF). R2 represents the coefficients of determination for leaves, stems, and roots of A. sativa L., respectively.
Agronomy 15 00150 g006
Figure 7. Correlation between the total biomass, aboveground biomass, underground biomass, and C, N, and P contents in oats in 2017 (AC) and 2018 (DF). R2 represents the coefficients of determination for total biomass, aboveground biomass, and underground biomass of oats, respectively.
Agronomy 15 00150 g007
Figure 8. N (A), C (B), P (C) contents of roots, stems, and leaves and their relationship to N rate and planting density.
Agronomy 15 00150 g008
Figure 9. Effects of planting density and N rate on nitrogen use efficiency (NUE g kg−1); (A) shows 2017 and (B) shows 2018. Data are shown as means ± SE. Different lowercase letters indicate significant differences among different treatments.
Agronomy 15 00150 g009
Figure 10. The final structural equation model (SEM) of effects of N rate and density on biomass through soil stoichiometry plant NUE and different organs’ stoichiometry. Solid and dashed arrows indicate significant and nonsignificant pathways, respectively. Blue and red arrows indicate (***, p < 0.001) positive and negative pathways, respectively.
Agronomy 15 00150 g010
Table 1. C, N, and P contents (g kg−1) and ecological stoichiometry in 0–30 cm soil under different treatments in 2018.
NitrogenDensityCNPC/NC/PN/P
N0D25.33 ± 0.49 b–d0.25 ± 0.02 b0.18 ± 0.01 c21.55 ± 2.06 ab28.99 ± 2.06 a–c1.36 ± 0.19 a
N1D15.74 ± 0.32 a–d0.32 ± 0.01 ab0.21 ± 0.01 b15.95 ± 0.49 ab27.31 ± 1.33 a–c0.9 ± 0.13 a
D24.68 ± 0.89 cd0.3 ± 0.03 ab0.23 ± 0.03 ab16.25 ± 4.46 ab20.03 ± 2.51 d1.3 ± 0.27 a
D35.49 ± 0.44 a–d0.29 ± 0.03 b0.23 ± 0.01 ab17.51 ± 2.57 ab24.13 ± 2.34 b–d1.4 ± 0.16 a
D45.89 ± 0.08 a–c0.27 ± 0.05 b0.19 ± 0.03 bc23.17 ± 5.13 a32.57 ± 5.23 a1.50 ± 0.44 a
N2D15.42 ± 0.44 a–d0.32 ± 0.03 ab0.2 ± 0.02 bc16.77 ± 0.12 ab26.85 ± 3.05 a–c1.6 ± 0.19 a
D25.72 ± 0.82 a–d0.35 ± 0.02 a0.28 ± 0.03 a16.49 ± 2.68 ab20.62 ± 1.88 d1.27 ± 0.13 a
D36.74 ± 0.79 ab0.35 ± 0.05 a0.28 ± 0.04 a19.67 ± 5.12 ab24.45 ± 4.39 b–d1.31 ± 0.36 a
D45.85 ± 0.55 a–c0.29 ± 0.01 b0.17 ± 0.01 c20.48 ± 2.12 ab34.36 ± 5.72 a1.67 ± 0.13 a
N3D14.89 ± 0.3 cd0.3 ± 0.02 ab0.19 ± 0.04 bc16.54 ± 2.04 ab26.85 ± 4.61 a–c1.65 ± 0.34 a
D25.51 ± 0.04 a–d0.32 ± 0.03 ab0.25 ± 0.03 ab21.78 ± 1.78 ab22.04 ± 1.46 cd1.36 ± 0.21 a
D37.02 ± 0.26 a0.22 ± 0.02 b0.24 ± 0.02 ab19.56 ± 0.74 ab29.36 ± 3.05 a–c1.50 ± 0.11 a
D44.02 ± 0.26 d0.34 ± 0.04 ab0.2 ± 0.03 bc12.01 ± 0.9 b21.27 ± 4.37 cd1.81 ± 0.48 a
N4D14.89 ± 0.42 cd0.31 ± 0.03 ab0.18 ± 0.01 c15.88 ± 2.11 ab26.54 ± 2.49 a–c1.68 ± 0.07 a
D24.96 ± 0.38 cd0.36 ± 0.03 a0.18 ± 0.02 c17.59 ± 3.07 ab28.24 ± 4.1 a–c1.63 ± 0.28 a
D35.17 ± 0.32 b–d0.34 ± 0.05 ab0.19 ± 0 bc15.57 ± 1.43 ab27.34 ± 1.92 a–c1.78 ± 0.25 a
D44.73 ± 0.63 cd0.33 ± 0.05 ab0.2 ± 0.01 bc14.24 ± 0.97 ab23.83 ± 2.98 b–d1.68 ± 0.22 a
N5D15.21 ± 0.12 b–d0.29 ± 0.02 b0.19 ± 0.04 bc17.78 ± 0.86 ab28.64 ± 6.7 a–c1.6 ± 0.31 a
D24.52 ± 0.34 cd0.26 ± 0.05 b0.21 ± 0.02 b17.38 ± 2.11 ab21.47 ± 2.04 cd1.24 ± 0.09 a
D34.42 ± 0.12 cd0.27 ± 0.01 b0.23 ± 0.01 ab16.16 ± 0.73 ab19.59 ± 0.49 d1.22 ± 0.09 a
D45.04 ± 0.95 cd0.32 ± 0.02 ab0.2 ± 0.03 bc15.92 ± 3.96 ab24.43 ± 1.55 b–d1.6 ± 0.28 a
F valueN2.11.62.20.60.32.2
D2.20.34.8 *0.31.55.4 *
N×D1.21.91.81.83.4 **0.9
Note: Lowercase letters mean with different superscripts in the same column differ significantly; N, D, and N×D are the results of ANOVA for two factors and their interaction, respectively; * Significant effects at p < 0.05; ** Significant effects at p < 0.01. Data are shown as means ± SE.
Disclaimer/Publisher’s Note: The statements, opinions and data contained in all publications are solely those of the individual author(s) and contributor(s) and not of MDPI and/or the editor(s). MDPI and/or the editor(s) disclaim responsibility for any injury to people or property resulting from any ideas, methods, instructions or products referred to in the content.

