Article

Exploring the Relationship between Nitrogen Use Efficiency and Protein Concentrations in Potato Genotypes

Crop Research Department, Institute of Agricultural Resources and Economics, 2 Zinatnes Street, 4126 Priekuli, Latvia
*
Author to whom correspondence should be addressed.
Agronomy 2024, 14(7), 1517; https://doi.org/10.3390/agronomy14071517
Submission received: 14 June 2024 / Revised: 5 July 2024 / Accepted: 9 July 2024 / Published: 12 July 2024
(This article belongs to the Section Plant-Crop Biology and Biochemistry)

Abstract

:
This two-year study assessed nitrogen use efficiency (NUE) and its effect on potato tuber protein concentration, focusing on crude protein concentration (CPC), crude protein yield (CPY), and patatin relative abundance (PRA) across 19 potato genotypes and four nitrogen management treatments (organic with no added fertilizers and three integrated treatments with N rates of 60, 120, and 180 kg ha−1). Nitrogen availability significantly affected CPC, with the highest average CPC across genotypes being 10.7% at 180 kg ha−1 and the lowest of 8.15% at 60 kg ha−1. Certain genotypes consistently outperformed others in terms of CPC and/or CPY under varying nitrogen treatments. A significant negative correlation was found between CPC and NUE, and genotypes with higher NUE typically had lower CPC. A positive correlation between CPY and NUE was observed, with the highest CPY of 1.36 t ha−1 at 120 kg N ha−1 in 2020. This suggests that higher NUE genotypes are more efficient in protein production per unit area. PRA varied significantly among genotypes, ranging from 8.7% to 35.51%. Although the relationship between NUE and PRA was weak, the significant and negative correlation indicates that cultivars with high NUE could have low PRA and vice versa. The findings underscore the importance of genotype variability in the relationship between NUE and protein content in potato tubers.

1. Introduction

Potato (Solanum tuberosum L.) is a key global food crop that provides substantial amounts of carbohydrates, vitamins, and minerals to the diets of the increasing world population. Notably, it is also a source of high-quality protein that contains all the essential amino acids [1,2]. Potato proteins are characterized by high nutritional and functional value and hypoallergenic properties. The high solubility and emulsifying, gelling, and foaming properties of potato protein make it suitable for successful application as a novel product [2].
Potato plants require an abundant nitrogen (N) supply, which is often provided via the application of fertilizers [3]. In many high-intensity agricultural systems, a significant portion of the nitrogen (N) applied to fields, ranging from 50% to 75%, remains unutilized by plants. This excess nitrogen is primarily lost through leaching into soil and aquatic systems and through the release of gaseous emissions into the atmosphere [4,5]. In farming techniques that strive to reduce environmental impacts, advanced nutrient (including N) management practices aim to balance increased yields with minimized environmental contamination risks. NUE efficiency decreases with increasing N input [6]. Moreover, nitrogen-efficient genotypes use nitrogen more effectively, which can enable reduced nitrogen fertilizer application while maintaining or even improving yield [7]. This can contribute to sustainable potato production and minimize the environmental impacts associated with nitrogen fertilizer use [8]. Physiological and molecular mechanisms are involved in N uptake, transport, assimilation, and utilization in potato plants. The efficacy of nitrogen use can vary among different potato cultivars due to genetic differences [9,10]. A complex network of genes is associated with nitrogen use efficiency. Genetic studies have identified candidate genes for improving nitrogen use efficiency (NUE) in potato plants [10,11,12]. The availability of nitrogen affects the expression of genes involved in various processes related to nitrogen metabolism and uptake in different potato cultivars [13]. Despite the identification of candidate genes, the successful development of genotypes with improved NUE has been limited by complex genetic and environmental factors and the various physiological processes involved in the interactions underlying nitrogen utilization in plants [6,14]. Generally, late maturing potato varieties exhibit higher NUE [9,15]; however, this is only valid if the growing season is sufficiently long [6].
Nitrogen is a nutrient that not only has an impact on potato tuber yield [16,17] but also may affect various potato quality traits, including protein and nitrate levels in the tubers [10,18,19].
Nitrogen compounds are the second major component of potato tuber dry matter (DM), and their concentrations range between 27 and 146 g kg−1 after conversion to crude protein (conversion factor N × 6.25) [20]. The protein concentration in the DM of potato species varies from 5.2% (S. tuberosum) to 8.0% (S. stenotomum) [21]. A study on potato cultivars in Latvia showed that the crude protein concentration in potato tubers varied from 1.3 to 2.0% of the fresh weight [22].
Due to a high concentration of amino acids, potato protein is a valuable nutritional source. Potato proteins have a high biological value of 90–100 compared to egg proteins with a biological value of 100 and are more complete than most other plant proteins because they contain all the essential amino acids [21,23,24].
Potato tuber proteins are classified into three main groups: patatins, protease inhibitors, and other proteins, such as structural and regulatory proteins and enzymes [20]. Patatin is the most abundant but least studied storage protein in potato tubers [25,26]. Patatin is a class of glycoprotein that accounts for up to 45% of the total soluble protein [1,27] and is primarily concentrated in the tuberous tissues of potatoes [20,28]. Although the physiological functions of patatin in potato tubers have not been fully explored, patatin also has enzymatic and other biological functions, such as defense and antioxidant functions and cytotoxic effects on cancer [2,29,30]. In recent years, researchers have explored the health benefits of patatin, emphasizing its antioxidant, anticancer, and anti-inflammatory activities and ability to promote glucose uptake [2,28,31]. The relative abundance of total protein in patatin can indeed be influenced by the potato genotype [20].
Elevated N concentrations in soil increase the concentration of protein in potato tubers [32,33,34], but this effect varies depending on the genotype [32,35,36]. Higher tuber yields are associated with increasing crude protein yield per unit area [32]. Less is known about the NUE and quality traits in potato tubers, including the relationship between the NUE of potato genotypes and protein concentrations in the tubers.
To narrow the knowledge gap, this study aimed to evaluate the relationships between cultivar NUE and crude protein (CPC) concentration, crude protein yield (CPY), and patatin relative abundance (PRA) in potato tuber proteins.

2. Materials and Methods

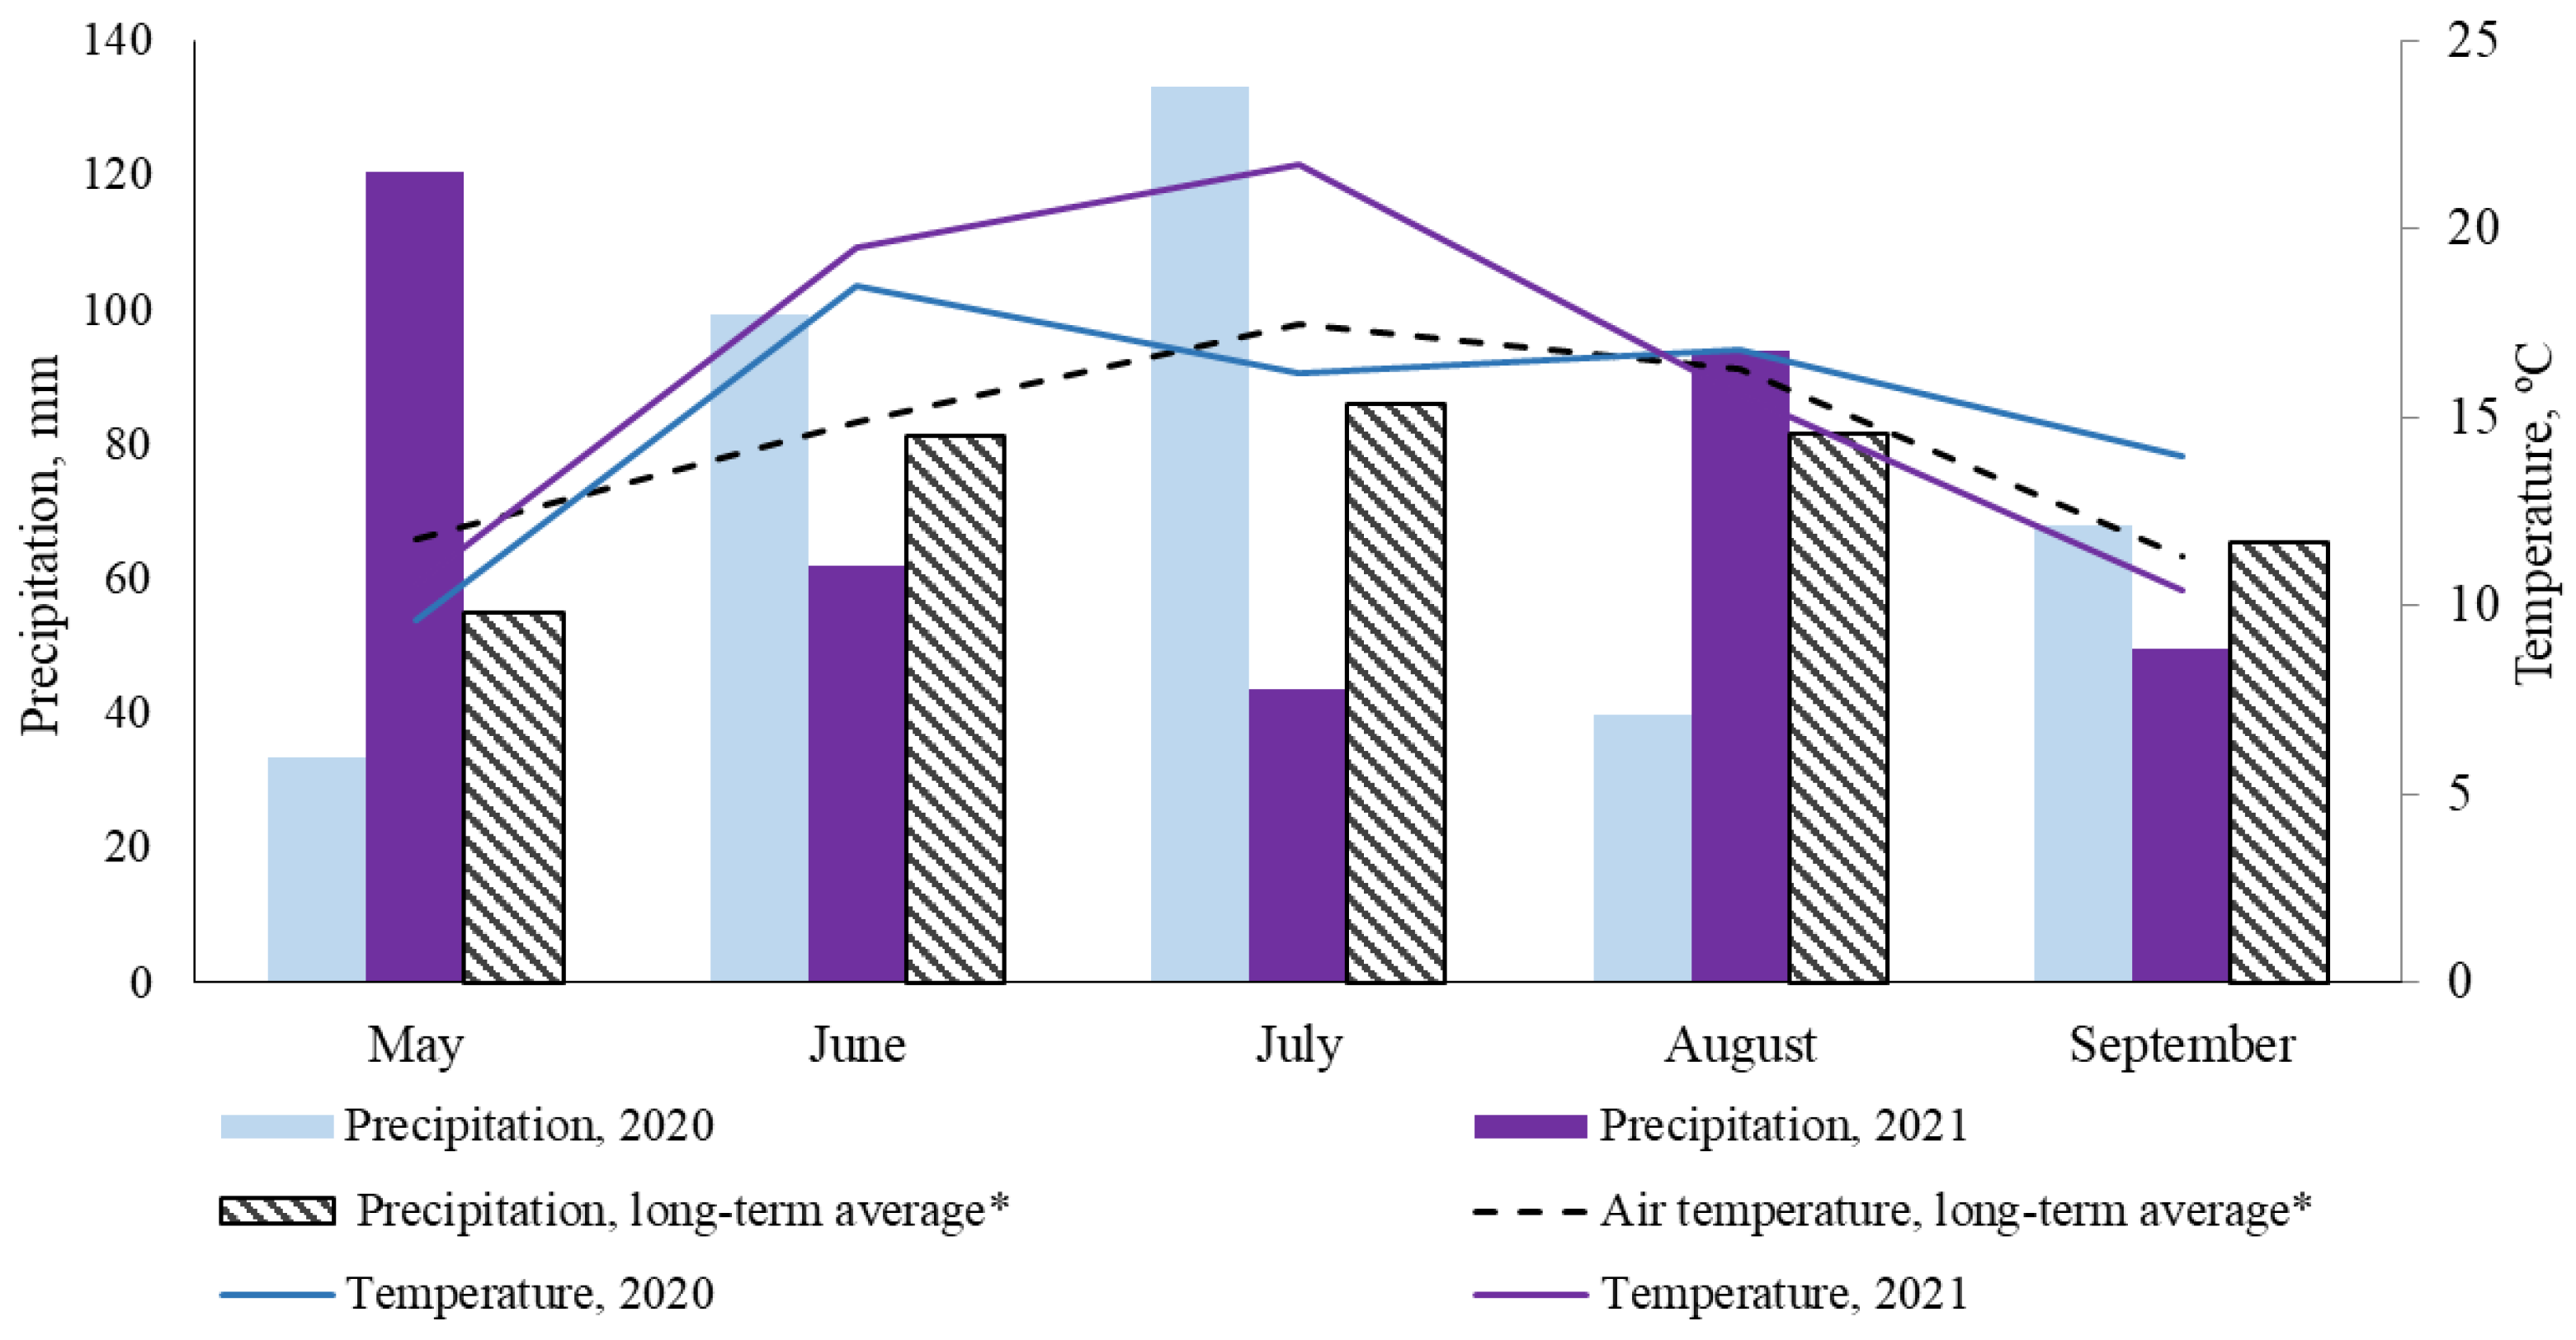
2.1. Growth Conditions

In 2020 and 2021, nineteen potato cultivars were grown in fields under organic and various integrated management treatments in Latvia at the Priekuli site (57°19′ N, 25°20′ E) of the Institute of Agricultural Resources and Economics (AREI).
The soil type in the organic and integrated fields was a loamy sand texture (Albeluvisol). The soil characteristics are presented in Table 1.
The soil pHKCl in the fields ranged from 5.0 to 5.7, which is optimal for potato production. Plant-available phosphorus was consistently high, but potassium levels varied: they were low in the organic farming soil in 2020, moderate in both the integrated farming soil of 2020 and the organic farming soil of 2021, and high in the integrated farming soil in 2021. The total plant-available N during the season was estimated as described by Skrabule et al. [37].
The basic fertilizer at rates of 90 kg ha−1 K2O and 55 kg ha−1 P2O5 was broadcasted in an integrated field. The following three N rate treatments were used in the integrated field by applying different N fertilizer levels: Conv1-60 kg N ha−1, Conv2-120 kg N ha−1, and Conv3-180 kg N ha−1. The field trials in the integrated management fields were arranged in accordance with a split-plot design with different N fertilization rates in the main plots and different genotypes in the 3.4 m2 subplots. No fertilizer was added to the organic field, which constituted the fourth treatment O. Four replicates were applied to the main plots. Four replicates with a randomized plot layout were also used in the organic field.
Potatoes were planted in mid-May, and the haulm was killed at the end of August or the beginning of September. In 2020, the period from planting to haulm killing in the integrated field was 115 days, but in 2021 it was 109 days. In the organic field, it was 105 and 104 days, respectively. Agronomic practices common for organic and integrated farming in the area were used during the vegetation season.
The meteorological conditions differed between the trial years. The average air temperature and precipitation between May and September, along with long-term data, are shown in Figure 1.
The average air temperatures in May, June, and July 2021 were greater than those in the same months in 2020, particularly in July (Figure 1). Precipitation in June and July of 2021 was lower than that in 2020 and notably less than the long-term average. This relatively warm and significantly drier weather could have contributed to unfavorable conditions for tuber yield development in 2021.
Tubers of cultivars from all trial fields were subjected to chemical and nutrient content analysis, including assessments of crude protein, pure protein, and patatin levels.

2.2. Plant Material Used in the Trials

In two trial years, 19 potato cultivars were studied in each farming system and treatment variant. These included ten Latvian cultivars of different maturity types: ‘Agrie Dzeltenie’, ‘Madara’, ‘Monta’, ‘Rigonda’ (early-maturing cultivar), ‘Prelma’, and ‘Lenora’ (medium–early), and ‘Magdalena’, ‘Brasla’, ‘Imanta’, and ‘Jogla’ (medium–late-maturing cultivars). Additionally, five promising clones from the AREI breeding program were examined: S 03067-33 (early) and four medium–early clones, S 01085-21, S 04065-2, S 11161-85 (purple-fleshed), and S 11152-7. The following four popular Latvian cultivars from foreign breeding companies representing different maturity types were also included in the study: two cultivars by Europlant—‘Vineta’ (early) and ‘Jelly’ (medium–late), one by Solana—‘Verdi’ (medium–early) from Germany, and ‘Kuras’ (late) by Agrico, the Netherlands.
This diverse selection aimed to determine protein concentration variations in relation to cultivar NUE under different N availability levels.

2.3. Protein Analysis

Eight weeks after storage, whole tubers for sample preparation were obtained from the field trial yield. Tubers were selected from each cultivar and treatment variant from the first and third replicates and then were washed and quartered, and a representative sample was created. The sample was subsequently homogenized using a domestic blender (Braun’s Multiquick 5, Braun, Kronberg im Taunus, Germany). From this homogenized mass, 110–140 g was weighed and immediately frozen at −20 °C for 24 h. The frozen samples were lyophilized according to the following program: primary drying at −50 °C and 0.040 mBar for 48 h and final drying at −76 °C and 0.0010 mBar for 8 h. Then, the lyophilized potato samples were homogenized in a blender, after which the samples were further subjected to nitrogen determination via the Kjeldahl method, pure protein determination via the BCA assay, and patatin determination via the chip electrophoresis method.
The crude protein concentration (CPC) in the first and third replicates was determined using Kjeldahl’s method for assessing the N concentration in the potato tuber dry matter (DM) and was estimated using the conversion factor N × 6.25. CPC was expressed as a percentage of tuber DM. For the evaluation of CPC in the second and fourth replicates, fresh potatoes with skin were crushed using a blender and subjected to near-infrared (NIR) spectroscopic analysis utilizing the XDS Rapid Content Analyzer from Foss. All necessary adjustments to DM weight were applied. The NIRS analyzer was calibrated in advance based on the N concentration results obtained by the Kjeldahl method, using a dataset of 240 samples that demonstrated a correlation coefficient (R2) of 0.9713.
The crude protein yield (CPY) was calculated by multiplying the CPC with the DM yield of the tubers and then dividing the result by 100. CPY was expressed as t ha−1.
To determine the relative abundance of patatin (PRA), the pure protein concentration (PPC) in the samples, such as that of PRA, can be determined for pure protein. Procedures for pure protein extraction and determination of the pure protein concentration necessary for quantification of the relative abundance of the protein were conducted as described by [38]. The lyophilized samples from the first and third replicates were divided into two parts.
After protein extraction, one part was used for PPC detection. The PPC concentration was determined using a BCA protein assay kit (Novogen, Germany) and measured in triplicate at a wavelength of 562 nm using a Nanodrop ND-1000 spectrophotometer (NanoDrop Technologies, Wilmington, DE, USA). The PPC was expressed in mg g−1 DM.
The other part of the lyophilized samples was used for the quantification of the relative abundance of patatin (PRA) within the total PPC of potato tubers. The protein was extracted through microchip electrophoresis using an Agilent 2011 Bioanalyzer (Agilent Technologies, Waldbronn, Germany) operated with 2100 Expert Software. An Agilent ProteinKit 230 was used for the protein analysis, facilitating the quantification of proteins in the range of 14 to 240 kDa. PRA was expressed as a percentage of the PPC.

2.4. NUE Calculation

The NUE for each sample (treatment and cultivar) and replication was defined as the tuber DM yield produced per unit of total N available in the soil and was expressed as kg kg−1 [15,39]. The DM yield for NUE estimation was detected as described by Skrabule et al. [37].

2.5. Statistical Analysis

To analyze the impact of different factors, a factor analysis of variance (ANOVA) was conducted. Tukey’s post hoc test, with a significance level set at α = 0.05, was used to identify groups with significant differences. Pearson’s correlation and linear regression were employed to determine the relationships among the variables. The statistical analysis was carried out using Jamovi software (version 2.2.2) [40], which operates in conjunction with R version 4.0.

3. Results and Discussion

To assess the impact of nitrogen use efficiency (NUE) on protein concentrations, protein yield, and patatin relative abundance in potato tubers, we evaluated the relationships between cultivar NUE, crude protein concentration (CPC), crude protein yield (CPY), and patatin relative abundance (PRA) across 19 potato genotypes under four nitrogen treatments over two years. The results showed significant variations in CPC and CPY based on different nitrogen availability and NUE values, while PRA was less affected by genotype NUE.

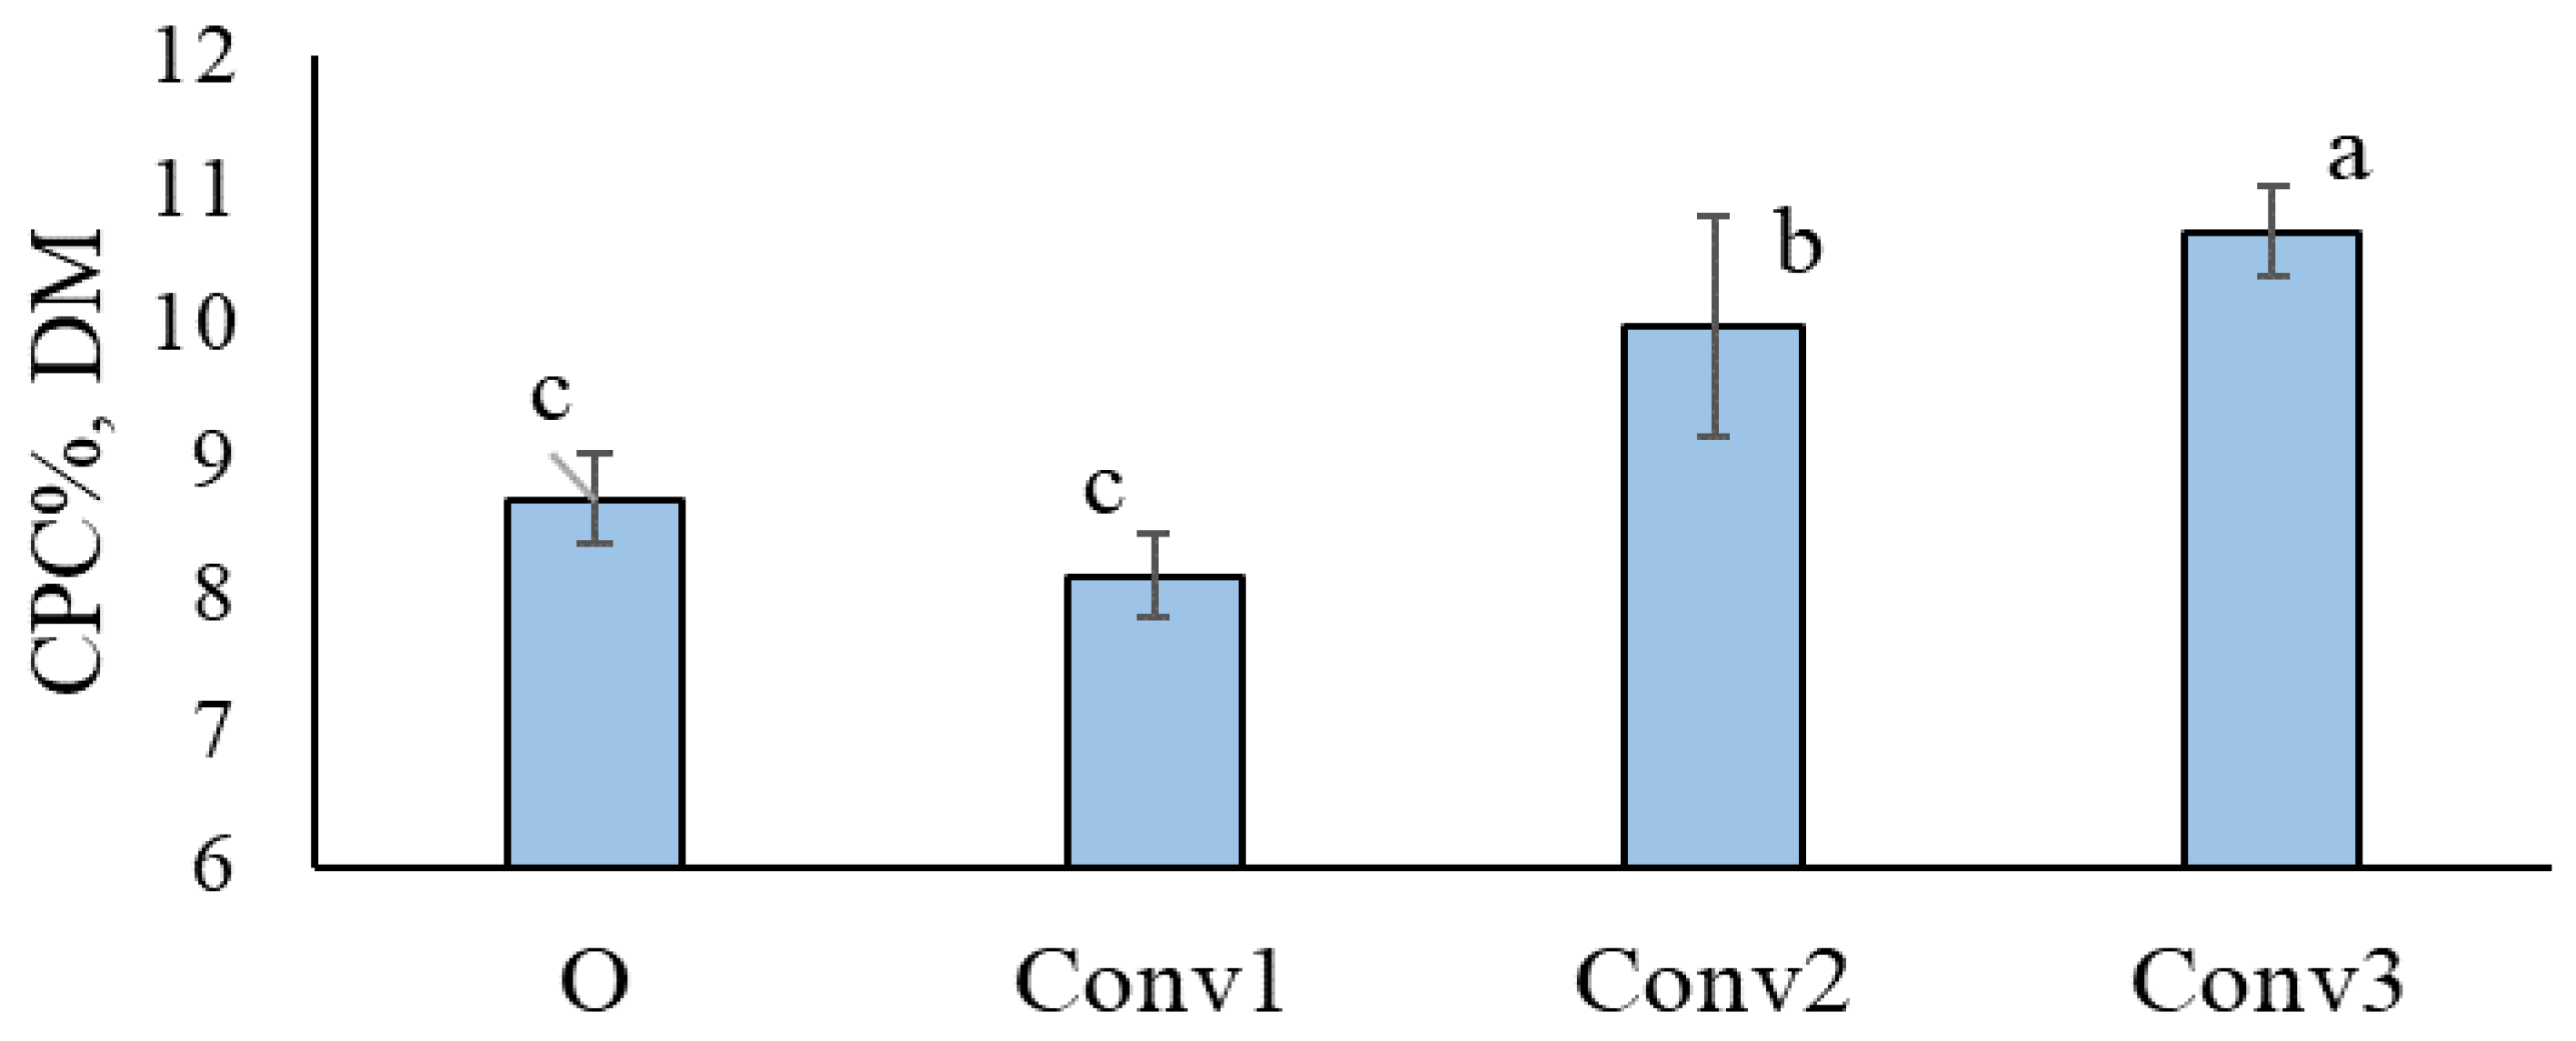
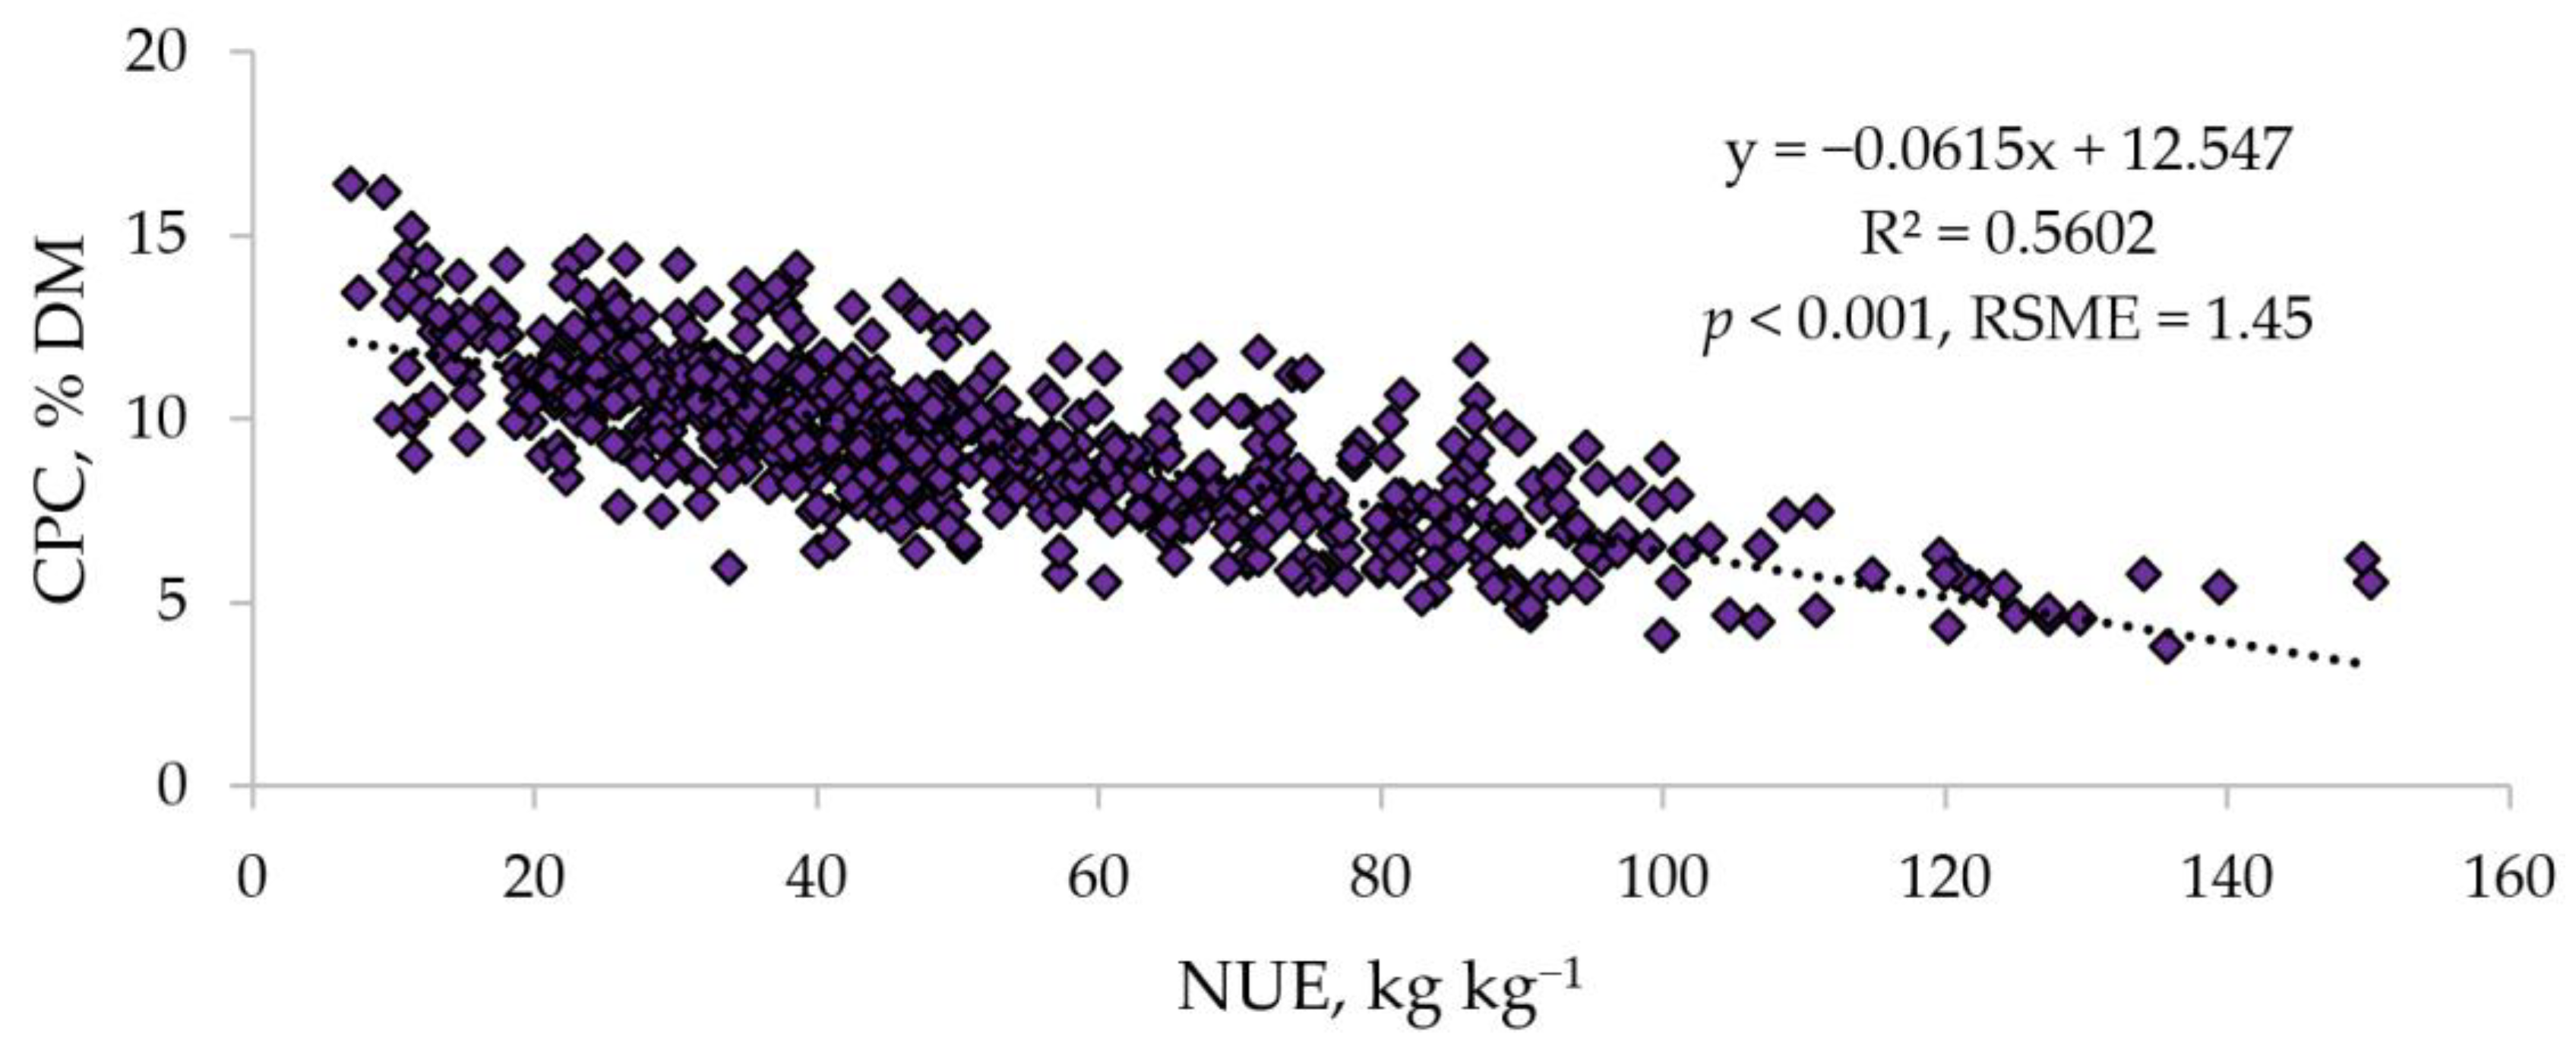
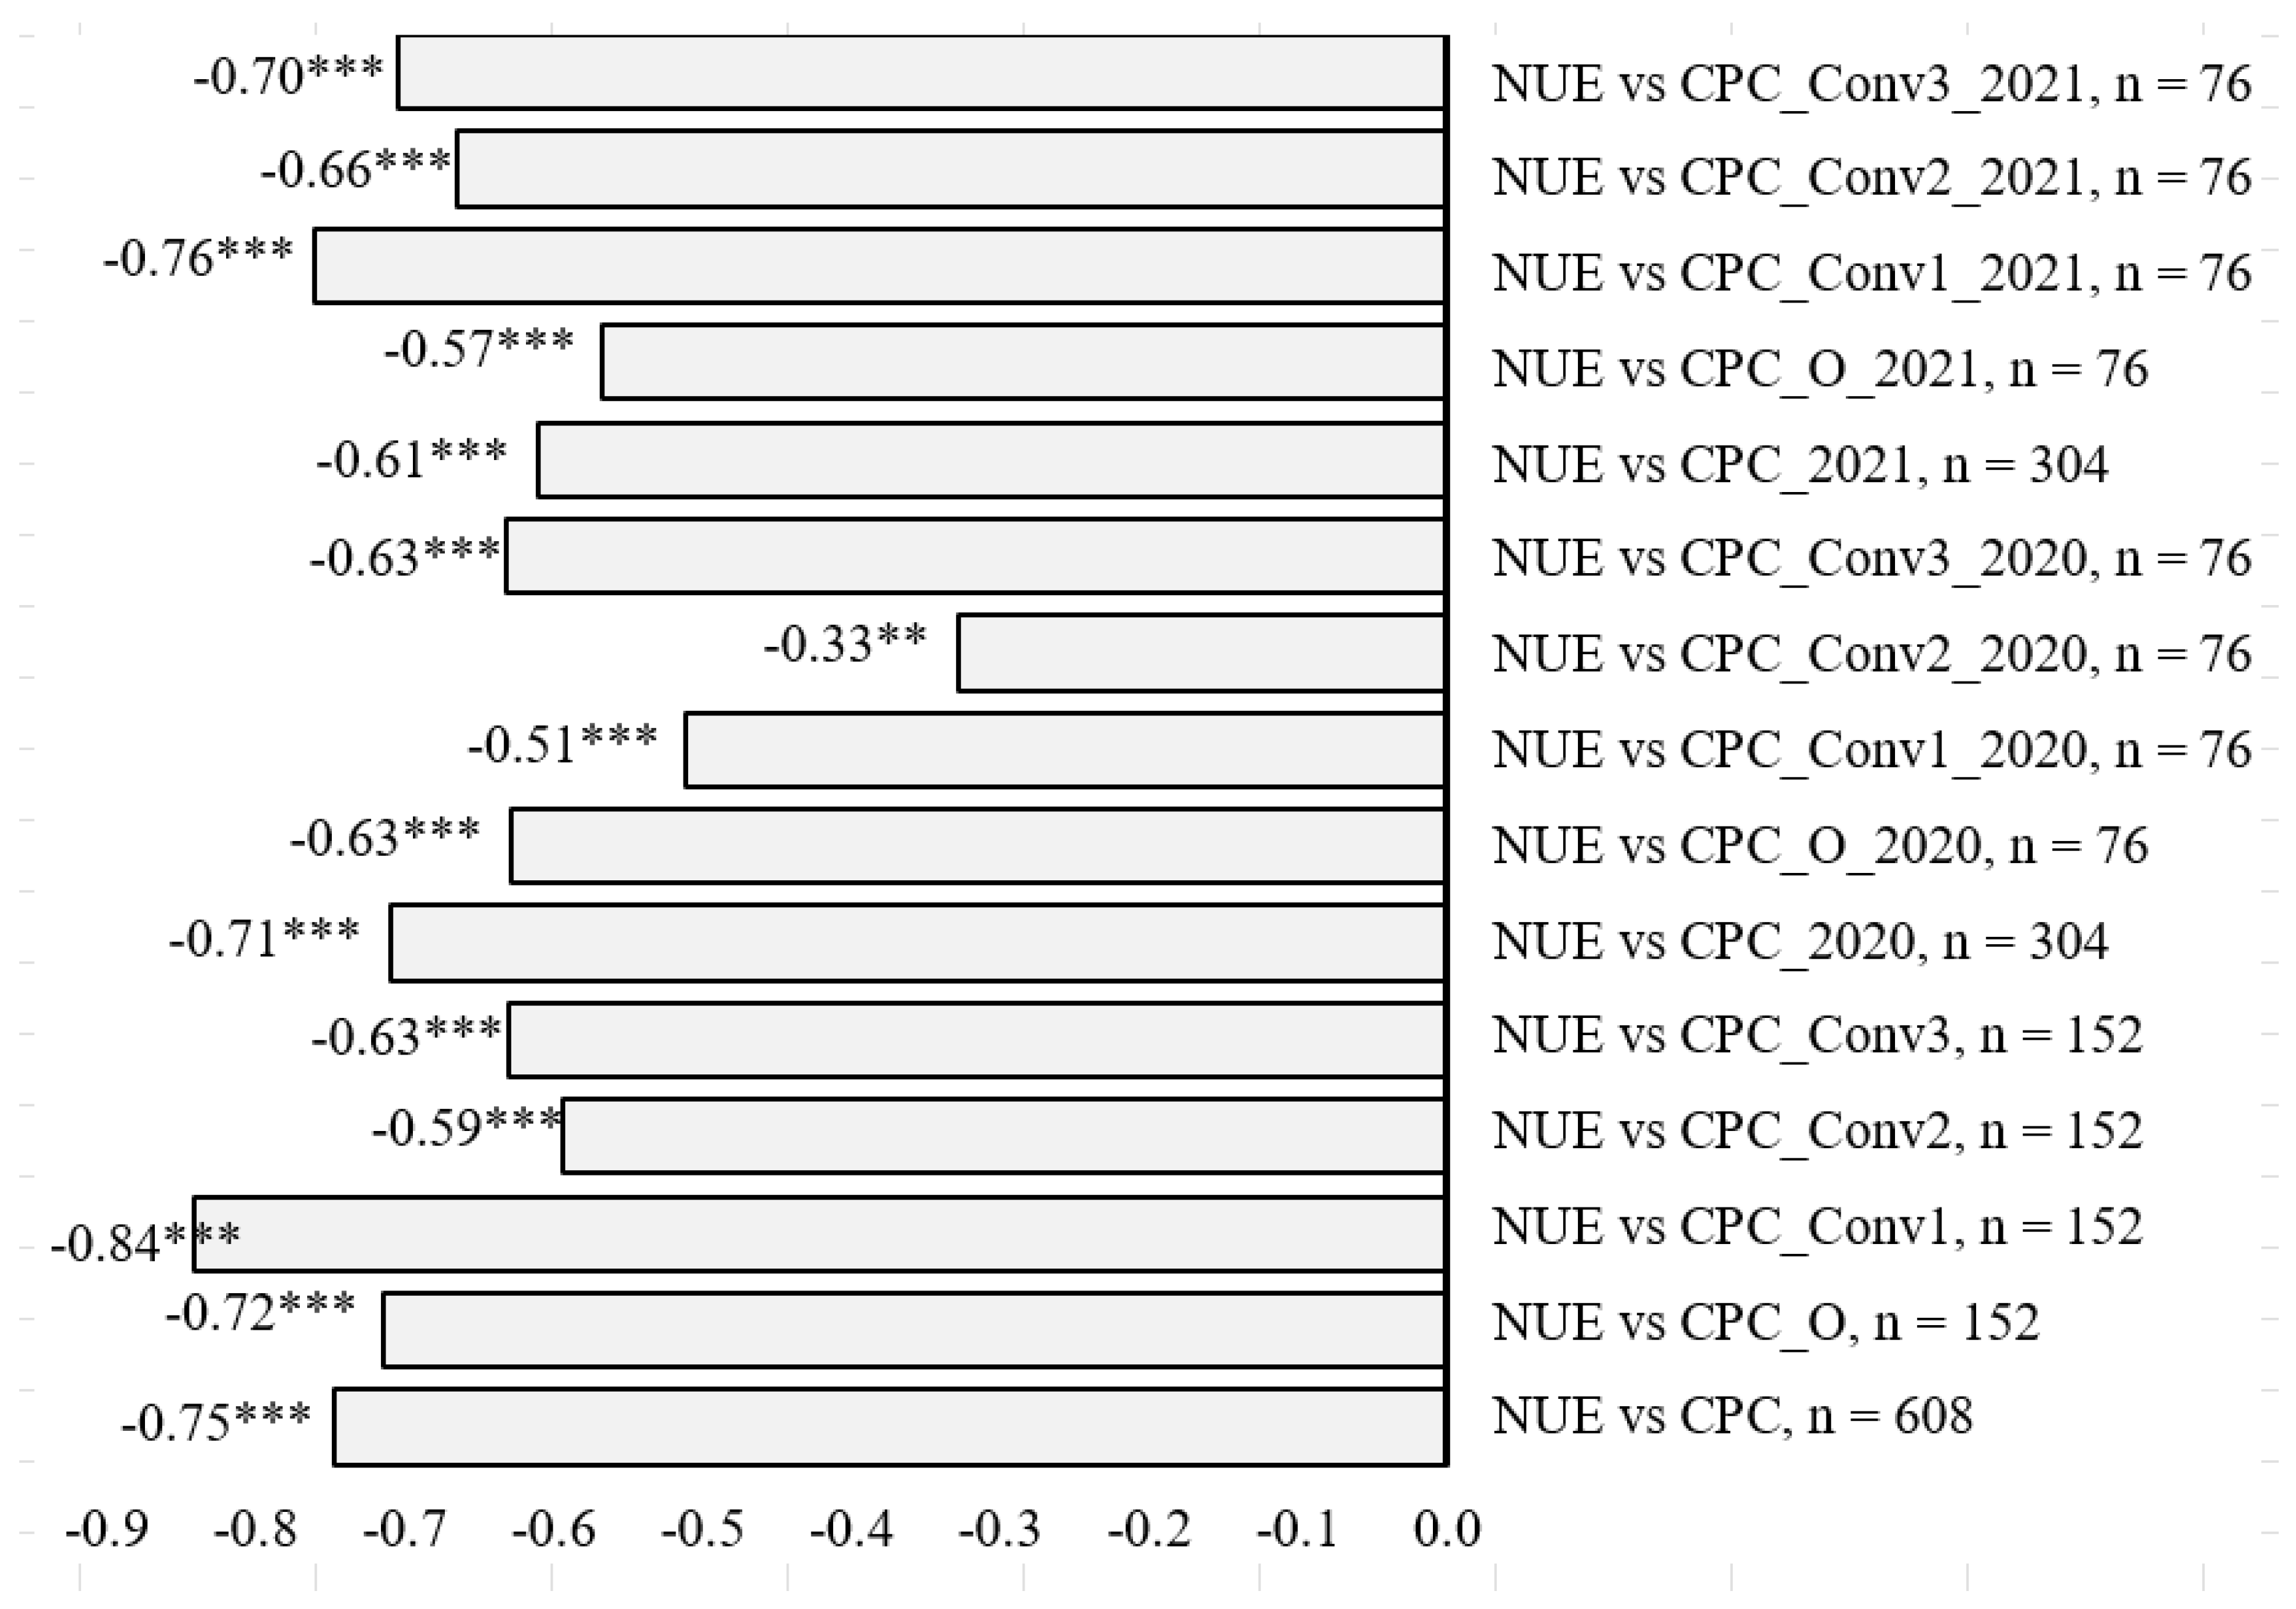
3.1. Crude Protein Concentration (CPC) in Tubers and Its Relationship with NUE

Significant differences (p < 0.001) were observed between treatments across the trial years, with Conv3 having the highest average CPC (10.68%) and Conv1 exhibiting the lowest average CPC (8.15%). The CPC concentration in the integrated management fields was significantly affected by the availability of N in the soil. The highest CPC concentration was detected in the tubers grown in the fields with a higher nitrogen supply (Figure 2), and this trend was consistent across both years of the trial.
During the trial, Conv3 treatment resulted in CPCs ranging from 7.12% to 13.76% in 2020 and from 7.35% to 15.26% in 2021, while the CPCs in the tubers obtained from the Conv1 treatment ranged from 4.31% to 8.93% in 2020 and from 6.51% to 12.79% in 2021 (Table S1).
These results are in line with those of other studies. The crude protein concentration in potato tubers cultivated in the Czech Republic in 2004–2005 ranged from 5.86 to 11.16%, and protein concentration differences between tubers grown at N rates of 100 kg ha−1 and 200 kg ha−1 were significant [32]. Öztürk et al. [34] used N fertilizer at rates of 0, 120, and 240 kg N ha−1 and reported that the protein concentration increased significantly between N rates of 120 and 240 kg N ha−1. The same relationship in which the protein concentration in tubers increases in line with the increase in N fertilizer rate has also been observed by Leszczyński and Lisińska [41] and Mitrus et al. [33]. However, when comparing the CPC obtained in organic fields (O treatment) with the CPC obtained from integrated fields (Conv1 treatment), in the present study, the CPC in the O treatment was, on average, greater than that in the Conv1 treatment, but the difference was not significant (p = 0.06). Similarly, Bártová et al. [42] reported that the CPC density in conventional fields did not differ significantly from that in organic fields. A comparable trend was noted by Öztürk et al. [34], where CPC in tubers was not significantly greater between two lower N supply rates, and CPC at 120 kg N ha−1 was not significantly greater than that in tubers grown at 0 kg N ha−1. These findings suggest that the impact of plant-available N might become increasingly apparent at higher N rates.
Significant differences (p < 0.001) in CPC in tubers were also observed among the cultivars, and this was true both across treatments (O, Conv1, Conv2, and Conv3) and within each treatment and trial year. The cultivar with the lowest CPC across treatments and trial years was ‘Kuras’ (average CPC of 6.47%); moreover, ‘Kuras’ exhibited the lowest CPC values under each separate treatment. The highest average CPC was observed for the ‘S 11161-85’ cultivar (12.06%) (Table S1). The effect of interaction between cultivar and treatment was not significant (p = 0.998).
After conducting the correlation analysis, the results demonstrated an inverse relationship between CPC in the DM of potato tubers and the NUE of cultivars (data on the NUE of cultivars are presented in Table S3). The correlation between the NUE of cultivars and CPC across trial years and treatments was significant and negative (r = −0.748, p < 0.001). Figure 3 shows the direction of correlation. Consequently, cultivars with a higher average NUE across all treatments exhibited, on average, the lowest CPC in tubers.
The NUE of potato plants is positively associated not only with tuber yield and DM yield but also with starch yield [37], which in turn is dependent on starch concentration. The relationship between DM concentration and CPC in potato tubers is not straightforward and can be influenced by various factors, including the content of proteins bound in potato starch [43]. A strong negative correlation between DM concentration and crude protein concentration per DM basis was observed by Bernhard et al. [44], whereas in the study by Leonel et al. [45], starch and protein exhibited a positive correlation. Based on controversial findings, this relationship cannot be confirmed in potato tubers. This difference may also depend on factors that influence the increase in starch concentration; for example, in the study of Leonel et al. [45], the starch concentration increased against a background of higher phosphorus fertilization rates, whereas in the present study, the starch concentration was greater in tubers grown under lower N rates [37], while in turn, the protein concentration was lower (Figure 2 and Table S1). The overall correlation between starch concentration and NUE was significantly positive and ranged from moderately close to weak [37]. However, the relationship was not strong enough to predict starch concentration reliably based on NUE alone. Across all treatments, the correlation between DM concentration and CPC was significant and negative (r = −0.570, p < 0.001) in the present study.
A negative correlation between the NUE of the different genotypes and the CPC concentration in the DM of the tubers was observed not only across all the treatments but also within each treatment, both across the trial years and individually in each year, as illustrated in Figure 4. These findings underscore the previously described relationship between NUE and CPC.

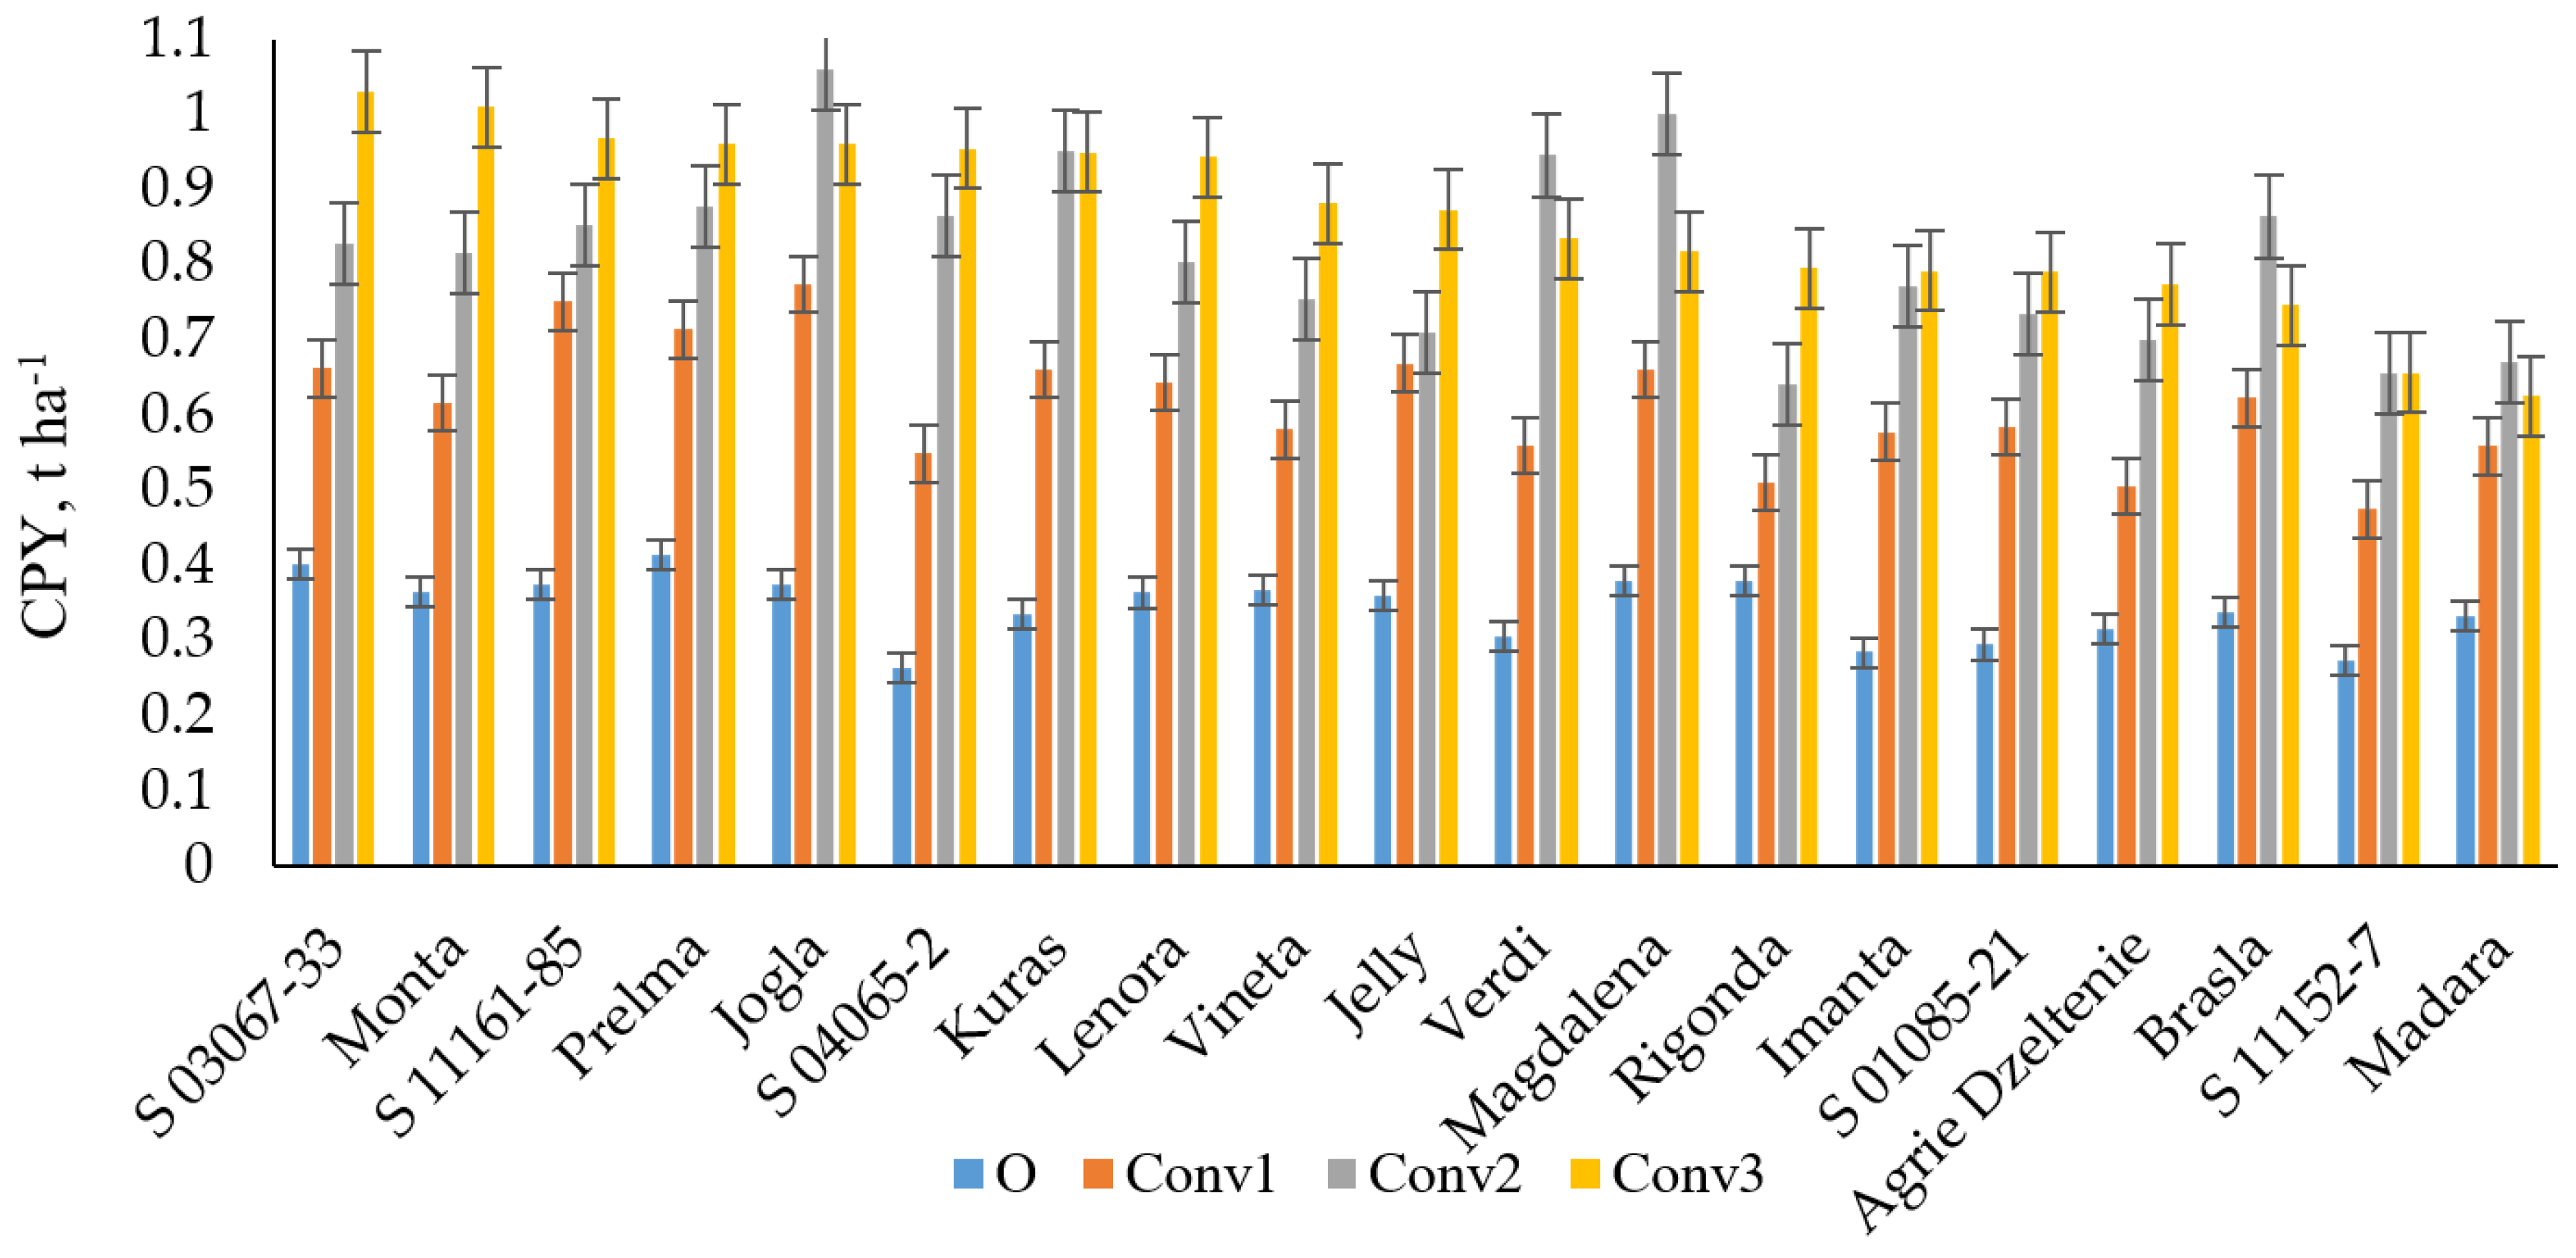
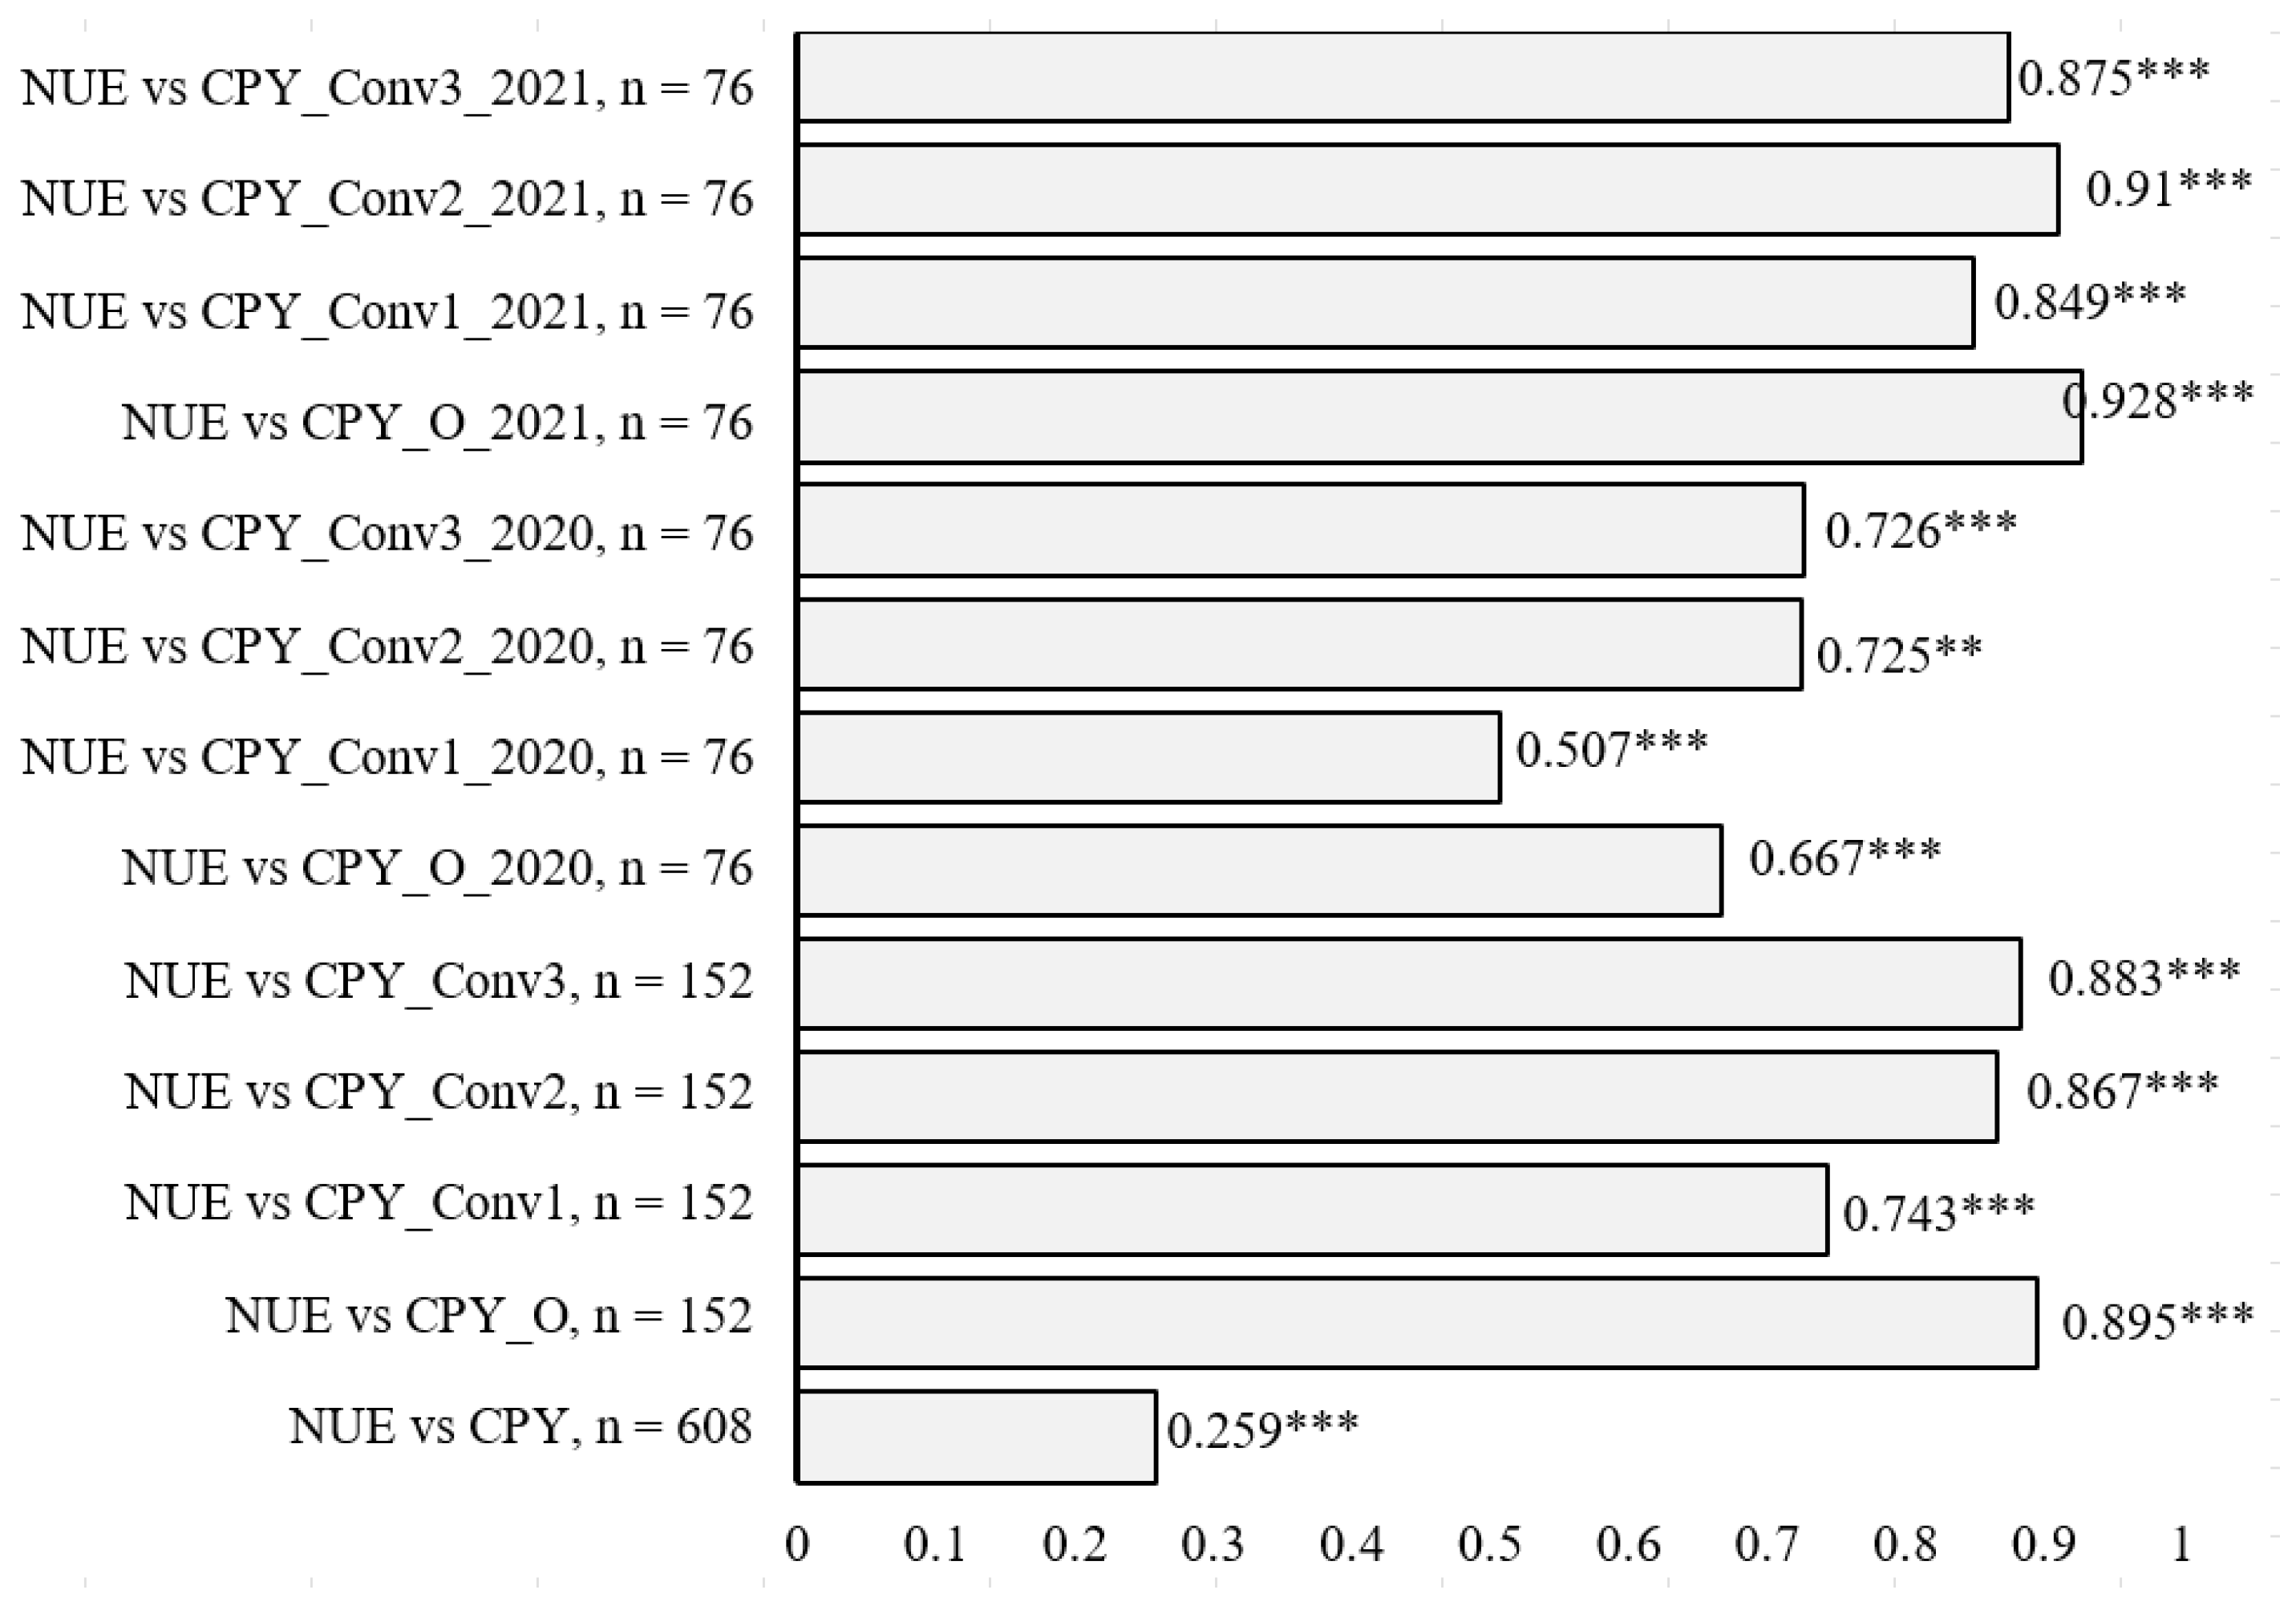
3.2. Crude Protein Yield (CPY) and Its Relationship with NUE

The CPY was significantly (p < 0.001) influenced by treatment and cultivar. The highest CPY within the trial years was observed in 2020 (Table S2) for the ‘Monta’ cultivar under Conv3 and the ‘Verdi’ cultivar under Conv2, at 1.36 t ha−1. The lowest CPY of 0.14 t ha−1 was observed in 2021 in the O field for the cultivar ‘Agrie Dzeltenie’ and the breeding clone ‘S 04065-2’. Notably, 2021 was a year when the total tuber yield was also lower than that in 2020.
The CPY was greater under higher N availability than under lower N availability and maintained this trend in both study years (Figure 5). A significant (p < 0.001) effect of the interaction between cultivar and treatment was also detected. Figure 5 shows that the highest CPY across trial years was observed for the ‘Jogla’ cultivar under Conv2 management (1.06 t ha−1). The lowest CPY was observed in the O treatment for the breeding clone ‘S 04065-2’ (0.27 t ha−1).
The relationship between CPY and NUE was positive and significant (r = 0.259, p < 0.001) when analyzed across all management treatments and trial years (Figure 6). This weak overall correlation between CPY and NUE may be influenced by varying dynamics of NUE, DM yield, and CPY across different N rates. At higher N rates, even though yields (and thus CPY) may be greater, the NUE is generally lower [9,15,37,46]. Conversely, at lower N rates, NUE is generally greater than that at higher N rates, but yields are lower than those at higher N rates, thus affecting CPY.
When the analysis was performed for each management treatment (which included the plant-available N rate), the relationship between CPY and NUE became increasingly clear. This allows for a clearer understanding of how NUE influences CPY within that specific nitrogen availability context. Even if a high-NUE variety has a lower CPC, the overall increase in tuber biomass (DM yield) can result in a greater total CPY. Analyzing the CPY within each treatment and year, it is evident that the NUE of the cultivars significantly correlates with the obtained CPY; thus, the higher the NUE of the cultivar is, the greater the potential to achieve a greater protein yield under any nitrogen availability conditions. This implies that even if more effective NUE cultivars have a lower CPC, the CPY per unit area is likely to be greater than that for cultivars with lower NUE.

3.3. Patatin Relative Abundance (PRA) in Pure Protein and Its Relationship to NUE

The relative abundance of patatin in % from PPC was significantly (p < 0.001) affected by cultivar in both trial years (Table 2). ‘Magdalena’ was the cultivar with the lowest PRA in both trial years (6.53% in 2020 and 10.89% in 2021) and across the years (8.7%), whereas ‘Verdi’ had the highest average PRA values (35.51%) and in each trial year (34.19% in 2020 and 36.82% in 2021). Significant differences between genotypes with respect to their patatin content have been reported in previous studies [42,47]. Considerable variation in the PRA among cultivars was observed (8.7–35.55% when averaged across the years), consistent with the findings of Barta and Bartova [20], who also analyzed a wide range of cultivars and observed average PRA values ranging from 7.16 to 31.29%. A study by Barta and Bartova [20] revealed that potato cultivars intended for processing generally exhibit a greater PRA than table potato cultivars. In our study, the highest PRA was also observed in the processing potato cultivars (‘Verdi’, ‘Imanta’, and ‘Brasla’). However, this trend was less pronounced for other cultivars, such as the processing cultivar ‘Kuras’, which had a significantly lower PRA than the other cultivars and a lower PRA than, for instance, the early-maturing table potato cultivar ‘Rigonda’. Conversely, the lowest PRA, similar to the findings of Barta and Bartova [20], was observed for table potato cultivars (‘Magdalena’, ‘Vineta’, and ‘Prelma’).
The treatment effect was not significant during any of the trial years (p = 0.164 in 2020; p = 0.082 in 2021) or across trial years (p = 0.062). These findings align with those of prior research, which also reported no significant impact of the farming system (organic vs. conventional) on the relative abundance of patatin in potato tubers [42,48]. The effect of the interaction between cultivar and treatment was significant (p < 0.05). Barta and Bartova [20] found that the impact of the trial year and the interaction between year and cultivar significantly influenced PRA, in addition to the notable impact of the cultivar itself, across forty cultivars studied over three years. However, in the study by Barta and Bartova [20], the total variation attributed to the cultivar effect (49%) was greater than that due to the impact of year (14%) and the combined effect of year and cultivar interaction (36.5%). A similar phenomenon was also observed in this study, where the cultivar effect explained 58% of the PRA variation, while the combined effect of the N treatment and N treatment to cultivar interaction explained only 12% of the PRA data variation.
When conducting the correlation analysis between the average PRA and the average NUE across all treatments and both trial years (n = 152), a negative, statistically significant correlation (r = −0.213, p < 0.01) was revealed. The direction of the relationship is shown in Figure 7. The obtained regression model was significant; nevertheless, according to the model, the NUE of the cultivar explained only 5% of the variation in the PRA.
This weak (although significant) correlation can be attributed to the fact that cultivars with high NUE may exhibit both high and low PRA and vice versa (Figure 8).
This lack of a strong linear association reveals the complexity of the relationship between NUE and the relative abundance of protein in potato tubers.
Barta and Bartova [20] noted a significant but weak and negative correlation between average tuber weight and PRA. In our study, under specific conditions, NUE showed a significant correlation with tuber yield [37], suggesting a parallel with these findings, especially since NUE also exhibited a significant negative correlation with PRA. Bartova et al. [42] found genotype to have a highly significant impact on PRA, whereas other factors like crop management, year, and site did not significantly affect PRA. Our research indicates that NUE is influenced by both genotype and plant-available N, whereas PRA is primarily influenced by the potato genotype. Since NUE is impacted by a broader range of factors than PRA, its variance is likely wider, potentially weakening the relationship, even though both factors are genotype dependent.
This research demonstrated that while a negative correlation exists between protein concentration and nitrogen use efficiency (NUE), NUE can be a vital criterion for selecting potato genotypes for protein yield. Cultivars with higher NUE can yield more protein per area than those with lower NUE. However, for patatin levels, NUE is not a consistent indicator. Instead, the genotype has a more important role in determining patatin abundance. Consequently, an in-depth examination of patatin levels in relation to the NUE of specific genotypes is crucial. This study, while offering insights into the relationship between NUE and CPC, CPY, and PRA of potato genotypes, holds certain limitations. The primary limitation was the variability in environmental conditions across the two-year field trial, which may have influenced the genotype performance. However, these limitations do not detract from the study’s significant findings, as they reflect real-world agricultural scenarios. Future studies could focus on controlled environment experiments to further validate these findings. The implications of this research extend beyond basic agricultural practices, offering potential strategies for improving potato crop quality and nutritional value through targeted nitrogen management, thereby contributing to sustainable agricultural practices and food security.

4. Conclusions

The crude protein concentration in potato tubers was significantly influenced by nitrogen availability. Higher nitrogen levels increased the crude protein concentration, but this effect varied across genotypes. A significant inverse relationship between nitrogen use efficiency (NUE) and crude protein concentration was observed, indicating that cultivars with higher NUE tend to have lower crude protein concentrations.
Crude protein yield was significantly affected by both nitrogen treatment and cultivar. A higher crude protein yield was associated with greater nitrogen availability, and a positive correlation between crude protein yield and NUE was identified, suggesting that a higher NUE contributes to greater protein yield, regardless of the crude protein concentration.
A significant variation in the relative abundance of patatin among the cultivars was observed without a significant relationship with nitrogen treatment. A weak but significant negative correlation between NUE and the relative abundance of the patatin was observed.
While the study revealed a negative relationship between protein concentration and NUE, which is beneficial for minimizing environmental nitrogen losses and achieving economic gains through increased total yield, NUE remains a crucial factor in selecting genotypes for protein yield. High-NUE cultivars can provide greater protein yields per unit area than low-NUE cultivars. However, when considering patatin, NUE is not a reliable predictor of its abundance. In this scenario, the genotype plays a more significant role. Therefore, a detailed analysis of the patatin abundance and NUE of the respective genotypes is essential. This approach allows for a more targeted selection of potato cultivars, optimizing both environmental sustainability and protein patatin abundance.

Supplementary Materials

The following supporting information can be downloaded at: https://www.mdpi.com/article/10.3390/agronomy14071517/s1, Table S1: Crude protein concentration, % dry matter, Table S2: Crude protein yield, t ha−1, nitrogen use efficiency, kg kg−1, Table S3: Nitrogen use efficiency, kg kg−1.

Author Contributions

Conceptualization, I.S. and I.D.; methodology, I.S., I.D., E.S. and D.B.; validation, I.D. and I.S.; formal analysis, I.D., I.S., I.T. and D.B.; investigation, I.D., E.S., I.T. and D.B.; resources, I.D. and I.S.; data curation, I.D. and I.T.; writing—original draft preparation, I.D., I.S. and V.S.; writing—review and editing, I.D. and I.S.; visualization, I.D.; supervision, I.D. and I.S.; project administration, I.D. and I.S.; funding acquisition, I.S. All authors have read and agreed to the published version of the manuscript.

Funding

This research was funded by The Latvian Council of Science, grant number lzp-2019/1-0371 and the APC was funded by the Institute of Agricultural Resources and Economics.

Data Availability Statement

The data have been placed in the publicly accessible data repository Dataverse and are available on request https://doi.org/10.7910/DVN/CGS7PG.

Conflicts of Interest

The authors declare no conflicts of interest. The funders had no role in the design of the study; in the collection, analyses, or interpretation of data; in the writing of the manuscript; or in the decision to publish the results.

References

  1. Camire, M.E.; Kubow, S.; Donnelly, D.J. Potatoes and Human Health. Crit. Rev. Food Sci. Nutr. 2009, 49, 823–840. [Google Scholar] [CrossRef] [PubMed]
  2. Hussain, M.; Qayum, A.; Xiuxiu, Z.; Liu, L.; Hussain, K.; Yue, P.; Yue, S.; Koko, M.Y.F.; Hussain, A.; Li, X. Potato Protein: An Emerging Source of High Quality and Allergy Free Protein, and Its Possible Future Based Products. Food Res. Int. 2021, 148, 110583. [Google Scholar] [CrossRef] [PubMed]
  3. Haverkort, A.J. Potato Handbook: Crop of the Future; Aardappelwereld BV: The Hague, The Netherlands, 2018; ISBN 9082897407. [Google Scholar]
  4. Govindasamy, P.; Muthusamy, S.K.; Bagavathiannan, M.; Mowrer, J.; Jagannadham, P.T.K.; Maity, A.; Halli, H.M.; Sujayananad, G.K.; Vadivel, R.; Das, T.K.; et al. Nitrogen Use Efficiency—A Key to Enhance Crop Productivity under a Changing Climate. Front. Plant Sci. 2023, 14, 1121073. [Google Scholar] [CrossRef] [PubMed]
  5. Hirel, B.; Tétu, T.; Lea, P.J.; Dubois, F. Improving Nitrogen Use Efficiency in Crops for Sustainable Agriculture. Sustainability 2011, 3, 1452–1485. [Google Scholar] [CrossRef]
  6. Lammerts van Bueren, E.T.; Struik, P.C. Diverse Concepts of Breeding for Nitrogen Use Efficiency. A Review. Agron. Sustain. Dev. 2017, 37, 50. [Google Scholar] [CrossRef]
  7. Getahun, B.B.; Kassie, M.M.; Visser, R.G.F.; van der Linden, C.G. Genetic Diversity of Potato Cultivars for Nitrogen Use Efficiency Under Contrasting Nitrogen Regimes. Potato Res. 2020, 63, 267–290. [Google Scholar] [CrossRef]
  8. Wang, C.; Zang, H.; Liu, J.; Shi, X.; Li, S.; Chen, F.; Chu, Q. Optimum Nitrogen Rate to Maintain Sustainable Potato Production and Improve Nitrogen Use Efficiency at a Regional Scale in China. A Meta-Analysis. Agron. Sustain. Dev. 2020, 40, 37. [Google Scholar] [CrossRef]
  9. Ospina, C.A.; Lammerts van Bueren, E.T.; Allefs, J.J.H.M.; Engel, B.; van der Putten, P.E.L.; van der Linden, C.G.; Struik, P.C. Diversity of Crop Development Traits and Nitrogen Use Efficiency among Potato Cultivars Grown under Contrasting Nitrogen Regimes. Euphytica 2014, 199, 13–29. [Google Scholar] [CrossRef]
  10. Zebarth, B.J.; Tai, G.; Tarn, R.; de Jong, H.; Milburn, P.H. Nitrogen Use Efficiency Characteristics of Commercial Potato Cultivars. Can. J. Plant Sci. 2004, 84, 589–598. [Google Scholar] [CrossRef]
  11. Tiwari, J.K.; Devi, S.; Buckseth, T.; Ali, N.; Singh, R.K.; Zinta, R.; Dua, V.K.; Chakrabarti, S.K. Precision Phenotyping of Contrasting Potato (Solanum tuberosum L.) Varieties in a Novel Aeroponics System for Improving Nitrogen Use Efficiency: In Search of Key Traits and Genes. J. Integr. Agric. 2020, 19, 51–61. [Google Scholar] [CrossRef]
  12. Zhang, J.; Wang, Y.; Zhao, Y.; Zhang, Y.; Zhang, J.; Ma, H.; Han, Y. Erratum: Transcriptome Analysis Reveals Nitrogen Deficiency Induced Alterations in Leaf and Root of Three Cultivars of Potato (Solanum tuberosum L.). PLoS ONE 2020, 15, e0240662, Erratum in PLoS ONE 2021, 16, e0253994. https://doi.org/10.1371/journal.pone.0253994. [Google Scholar] [CrossRef]
  13. Gálvez, J.H.; Tai, H.H.; Lagüe, M.; Zebarth, B.J.; Strömvik, M.V. The Nitrogen Responsive Transcriptome in Potato (Solanum tuberosum L.) Reveals Significant Gene Regulatory Motifs. Sci. Rep. 2016, 6, 26090. [Google Scholar] [CrossRef]
  14. Baligar, V.C.; Fageria, N.K.; He, Z.L. Nutrient Use Efficiency in Plants. Commun. Soil Sci. Plant Anal. 2001, 32, 921–950. [Google Scholar] [CrossRef]
  15. Tiemens-Hulscher, M.; Lammerts van Bueren, E.T.; Struik, P.C. Identifying Nitrogen-Efficient Potato Cultivars for Organic Farming. Euphytica 2014, 199, 137–154. [Google Scholar] [CrossRef]
  16. Koch, M.; Naumann, M.; Pawelzik, E.; Gransee, A.; Thiel, H. The Importance of Nutrient Management for Potato Production Part I: Plant Nutrition and Yield. Potato Res. 2020, 63, 97–119. [Google Scholar] [CrossRef]
  17. Stefaniak, T.R.; Fitzcollins, S.; Figueroa, R.; Thompson, A.L.; Schmitz Carley, C.; Shannon, L.M. Genotype and Variable Nitrogen Effects on Tuber Yield and Quality for Red Fresh Market Potatoes in Minnesota. Agronomy 2021, 11, 255. [Google Scholar] [CrossRef]
  18. Ruza, A.; Skrabule, I.; Vaivode, A. Influence of Nitrogen on Potato Productivity and Nutrient Use Efficiency. Proc. Latv. Acad. Sci. 2013, 67, 247–253. [Google Scholar]
  19. Zhang, H.; Liu, X.; Song, B.; Nie, B.; Zhang, W.; Zhao, Z. Effect of Excessive Nitrogen on Levels of Amino Acids and Sugars, and Differential Response to Post-Harvest Cold Storage in Potato (Solanum tuberosum L.) Tubers. Plant Physiol. Biochem. 2020, 157, 38–46. [Google Scholar] [CrossRef]
  20. Barta, J.; Bartova, V. Patatin, the Major Protein of Potato (Solanum tuberosum L.) Tubers, and Its Occurrence as Genotype Effect: Processing versus Table Potatoes. Czech J. Food Sci. 2008, 26, 347–359. [Google Scholar] [CrossRef]
  21. Bártová, V.; Bárta, J.; Brabcová, A.; Zdráhal, Z.; Horáčková, V. Amino Acid Composition and Nutritional Value of Four Cultivated South American Potato Species. J. Food Compos. Anal. 2015, 40, 78–85. [Google Scholar] [CrossRef]
  22. Murniece, I.; Karklina, D.; Galoburda, R.; Santare, D.; Skrabule, I.; Costa, H.S. Nutritional Composition of Freshly Harvested and Stored Latvian Potato (Solanum tuberosum L.) Varieties Depending on Traditional Cooking Methods. J. Food Compos. Anal. 2011, 24, 699–710. [Google Scholar] [CrossRef]
  23. Gorissen, S.H.M.; Crombag, J.J.R.; Senden, J.M.G.; Waterval, W.A.H.; Bierau, J.; Verdijk, L.B.; van Loon, L.J.C. Protein Content and Amino Acid Composition of Commercially Available Plant-Based Protein Isolates. Amino Acids 2018, 50, 1685–1695. [Google Scholar] [CrossRef]
  24. Waglay, A.; Karboune, S.; Khodadadi, M. Investigation and Optimization of a Novel Enzymatic Approach for the Isolation of Proteins from Potato Pulp. LWT Food Sci. Technol. 2016, 65, 197–205. [Google Scholar] [CrossRef]
  25. Bernal, J.; Mouzo, D.; López-Pedrouso, M.; Franco, D.; García, L.; Zapata, C. The Major Storage Protein in Potato Tuber Is Mobilized by a Mechanism Dependent on Its Phosphorylation Status. Int. J. Mol. Sci. 2019, 20, 1889. [Google Scholar] [CrossRef]
  26. Pots, A.M.; Gruppen, H.; Van Diepenbeek, R.; Van Der Lee, J.J.; Van Boekel, M.A.J.S.; Wijngaards, G.; Voragen, A.G.J. The Effect of Storage of Whole Potatoes of Three Cultivars on the Patatin and Protease Inhibitor Content; A Study Using Capillary Electrophoresis and MALDI-TOF Mass Spectrometry. J. Sci. Food Agric. 1999, 79, 1557–1564. [Google Scholar] [CrossRef]
  27. de Souza Cândido, E.; Pinto, M.F.S.; Pelegrini, P.B.; Lima, T.B.; Silva, O.N.; Pogue, R.; Grossi-de-Sá, M.F.; Franco, O.L. Plant Storage Proteins with Antimicrobial Activity: Novel Insights into Plant Defense Mechanisms. FASEB J. 2011, 25, 3290–3305. [Google Scholar] [CrossRef]
  28. Pęksa, A.; Miedzianka, J. Potato Industry By-Products as a Source of Protein with Beneficial Nutritional, Functional, Health-Promoting and Antimicrobial Properties. Appl. Sci. 2021, 11, 3497. [Google Scholar] [CrossRef]
  29. Kowalczewski, P.Ł.; Olejnik, A.; Białas, W.; Rybicka, I.; Zielińska-Dawidziak, M.; Siger, A.; Kubiak, P.; Lewandowicz, G. The Nutritional Value and Biological Activity of Concentrated Protein Fraction of Potato Juice. Nutrients 2019, 11, 1523. [Google Scholar] [CrossRef]
  30. Liu, Y.-W.; Han, C.-H.; Lee, M.-H.; Hsu, F.-L.; Hou, W.-C. Patatin, the Tuber Storage Protein of Potato (Solanum tuberosum L.), Exhibits Antioxidant Activity in Vitro. J. Agric. Food Chem. 2003, 51, 4389–4393. [Google Scholar] [CrossRef]
  31. Fu, Y.; Liu, W.N.; Soladoye, O.P. Towards Potato Protein Utilisation: Insights into Separation, Functionality and Bioactivity of Patatin. Int. J. Food Sci. Technol. 2020, 55, 2314–2322. [Google Scholar] [CrossRef]
  32. Bartova, V.; Barta, J.; Divis, J.; Svajiner, J.; Peterka, J. Crude Protein Content in Tubers of Starch Processing Potato Cultivars in Dependence on Different Agro-Ecological Conditions Vliv Agroekologických Podmínek Na Obsah Hrubého Proteinu V Hlízách. Cent. Eur. Agric. 2009, 10, 57–66. [Google Scholar]
  33. Mitrus, J.; Stankiewicz, C.; Steć, E.; Kamecki, M.; Starczewski, J. The Influence of Selected Cultivation on the Content of Total Protein and Amino Acids in the Potato Tubers. Plant Soil Environ. 2003, 49, 131–134. [Google Scholar] [CrossRef]
  34. Öztürk, E.; Kavurmaci, Z.; Kara, K.; Polat, T. The Effects of Different Nitrogen and Phosphorus Rates on Some Quality Traits of Potato. Potato Res. 2010, 53, 309–312. [Google Scholar] [CrossRef]
  35. Assunção, N.S.; Fernandes, A.M.; Soratto, R.P.; Mota, L.H.S.O.; Ribeiro, N.P.; Leonel, M. Tuber Yield and Quality of Two Potato Cultivars in Response to Nitrogen Fertilizer Management. Potato Res. 2021, 64, 147–166. [Google Scholar] [CrossRef]
  36. Zarzecka, K.; Gugala, M.; Mystkowska, I.; Sikorska, A. Total and True Protein Content in Potato Tubers Depending on Herbicides and Biostimulants. Agronomy 2020, 10, 1106. [Google Scholar] [CrossRef]
  37. Skrabule, I.; Rābante-hāne, L.; Dimante, I.; Taškova, I. The Effect of Nitrogen Use Efficiency on Significant Traits of Potato Starch Production. Zemdirb. Agric. 2023, 110, 329–338. [Google Scholar] [CrossRef]
  38. Berga, D.; Sterna, V.; Sokolova, E.; Taskova, I.; Seile, S.; Dimante, I.; Skrabule, I. Evaluation of Patatin Content in Proteins of Potato Genotypes Grown in Latvia. Rural Sustain. Res. 2021, 46, 125–132. [Google Scholar] [CrossRef]
  39. Hawkesford, M.J.; Griffiths, S. Exploiting Genetic Variation in Nitrogen Use Efficiency for Cereal Crop Improvement. Curr. Opin. Plant Biol. 2019, 49, 35–42. [Google Scholar] [CrossRef]
  40. Jamovi The Jamovi Project 2021. Available online: https://www.jamovi.org/ (accessed on 14 June 2024).
  41. Leszczyński, W.; Lisińska, G. Influence of Nitrogen Fertilization on Chemical Composition of Potato Tubers. Food Chem. 1988, 28, 45–52. [Google Scholar] [CrossRef]
  42. Bártová, V.; Diviš, J.; Bárta, J.; Brabcová, A.; Švajnerová, M. Variation of Nitrogenous Components in Potato (Solanum tuberosum L.) Tubers Produced under Organic and Conventional Crop Management. Eur. J. Agron. 2013, 49, 20–31. [Google Scholar] [CrossRef]
  43. Tong, C.; Ma, Z.; Chen, H.; Gao, H. Toward an Understanding of Potato Starch Structure, Function, Biosynthesis, and Applications. Food Front. 2023, 4, 980–1000. [Google Scholar] [CrossRef]
  44. Bernhard, T.; Truberg, B.; Friedt, W.; Snowdon, R.; Wittkop, B. Development of Near-Infrared Reflection Spectroscopy Calibrations for Crude Protein and Dry Matter Content in Fresh and Dried Potato Tuber Samples. Potato Res. 2016, 59, 149–165. [Google Scholar] [CrossRef]
  45. Leonel, M.; do Carmo, E.L.; Fernandes, A.M.; Soratto, R.P.; Ebúrneo, J.A.M.; Garcia, É.L.; dos Santos, T.P.R. Chemical Composition of Potato Tubers: The Effect of Cultivars and Growth Conditions. J. Food Sci. Technol. 2017, 54, 2372–2378. [Google Scholar] [CrossRef]
  46. Milroy, S.P.; Wang, P.; Sadras, V.O. Defining Upper Limits of Nitrogen Uptake and Nitrogen Use Efficiency of Potato in Response to Crop N Supply. Field Crops Res. 2019, 239, 38–46. [Google Scholar] [CrossRef]
  47. Bárta, J.; Bártová, V.; Zdráhal, Z.; Šedo, O. Cultivar Variability of Patatin Biochemical Characteristics: Table versus Processing Potatoes (Solanum tuberosum L.). J. Agric. Food Chem. 2012, 60, 4369–4378. [Google Scholar] [CrossRef]
  48. Lehesranta, S.J.; Koistinen, K.M.; Massat, N.; Davies, H.V.; Shepherd, L.V.T.; McNicol, J.W.; Cakmak, I.; Cooper, J.; Lück, L.; Kärenlampi, S.O. Effects of Agricultural Production Systems and Their Components on Protein Profiles of Potato Tubers. Proteomics 2007, 7, 597–604. [Google Scholar] [CrossRef]
Figure 1. Average air temperature and precipitation during the growing seasons of 2020 and 2021. * long-term refers to the years 1981–2010.
Agronomy 14 01517 g001
Figure 2. Average crude protein concentrations (CPCs) in dry matter (DM) of potato tubers depending on treatment and across the years. O—organic field; Conv1—integrated field 60 kg N ha−1; Conv2—integrated field 120 kg N ha−1; Conv3—integrated field 180 kg N ha−1; different letters indicate significant differences at p < 0.05 (Tukey’s post hoc test) between cultivars. Vertical error bars indicate the 95% confidence intervals.
Agronomy 14 01517 g002
Figure 3. Relationship between the nitrogen use efficiency (NUE) of potato cultivars and crude protein concentration (CPC) in dry matter (DM) of tubers.
Agronomy 14 01517 g003
Figure 4. Correlation coefficients between nitrogen use efficiency (NUE) and crude protein concentrations (CPCs). O—organic field; Conv1—integrated field 60 kg N ha−1; Conv2—integrated field 120 kg N ha−1; Conv3—integrated field 180 kg N ha−1; 2020—year 2020; 2021—year 2021. *** p < 0.001, ** p < 0.01.
Agronomy 14 01517 g004
Figure 5. Crude protein yields (CPYs) of potato cultivars within treatments across the trial years. O—organic field; Conv1—integrated field 60 kg N ha−1; Conv2—integrated field 120 kg N ha−1; Conv3—integrated field 180 kg N ha−1. Vertical error bars indicate the 95% confidence intervals.
Agronomy 14 01517 g005
Figure 6. Correlation coefficients between nitrogen use efficiency (NUE) and crude protein yield (CPY). O—organic field; Conv1—integrated field 60 kg N ha−1; Conv2—integrated field 120 kg N ha−1; Conv3—integrated field 180 kg N ha−1; 2020—year 2020; 2021—year 2021. *** p < 0.001, ** p < 0.01.
Agronomy 14 01517 g006
Figure 7. Relationship between nitrogen use efficiency (NUE) of potato cultivars and patatin relative abundance (PRA) in pure protein of potato tubers.
Agronomy 14 01517 g007
Figure 8. Average patatin relative abundance (PRA) in pure protein of potato tubers and average NUE of cultivars. Vertical error bars indicate the 95% confidence intervals.
Agronomy 14 01517 g008
Table 1. The soil characteristics of the experimental fields at the ploughing depth (0.25 m) in 2020 and 2021.
IndicatorsOrganic FieldIntegrated Field
2020202120202021
pHKCl5.75.65.55.0
Organic matter, g kg−123272321
K2O, mg kg−156132137190
P2O5, mg kg−1101164179175
Estimated plant-available N in the soil kg ha−1 (before fertilization)71836958
Table 2. Patatin relative abundance (PRA, %) in pure protein of potato cultivars.
CultivarPRA, %
20202021Average
Verdi34.236.835.5 a
Brasla22.427.324.9 b
Imanta23.226.624.9 b
Lenora21.225.823.5 bc
S 11152-723.922.723.3 bc
Rigonda23.021.522.3 bcd
S 11161-8520.024.522.2 bcd
Monta24.019.221.6 bcde
Jogla21.118.619.8 bcde
Madara21.217.719.5 bcdef
S 04065-219.519.319.4 bcdef
Jelly13.318.916.1 cdefg
Agrie Dzeltenie17.214.515.9 cdefg
Kuras17.113.715.4 cdefg
S 01085-2112.217.915.1 cdefg
S 03067-3312.514.513.5 efg
Prelma7.214.510.8 fg
Vineta8.711.410.0 g
Magdalena6.510.98.7 g
Average18.3319.8019.07
Different letters indicate significant differences at p < 0.05 (Tukey’s post hoc test) between cultivars.
Disclaimer/Publisher’s Note: The statements, opinions and data contained in all publications are solely those of the individual author(s) and contributor(s) and not of MDPI and/or the editor(s). MDPI and/or the editor(s) disclaim responsibility for any injury to people or property resulting from any ideas, methods, instructions or products referred to in the content.

