Article

MicroRNA164 Regulates Perennial Ryegrass (Lolium perenne L.) Adaptation to Changing Light Intensity

1
College of Grassland Science and Technology, China Agricultural University, Beijing 100193, China
2
Beijing Academy of Agriculture and Forestry Sciences, Beijing 100097, China
*
Authors to whom correspondence should be addressed.
Agronomy 2024, 14(6), 1142; https://doi.org/10.3390/agronomy14061142
Submission received: 25 April 2024 / Revised: 21 May 2024 / Accepted: 24 May 2024 / Published: 27 May 2024
(This article belongs to the Special Issue Advances in Stress Biology of Forage and Turfgrass)

Abstract

:
Plants especially need to adapt to all different light environments (shade, high light, etc.) due to the essential role of light in plant life. Either shade or high-light microenvironmental conditions are common for cool-season turfgrasses, such as perennial ryegrass (Lolium perenne L.). In order to study how a plant highly conserves microRNA, miR164-affected perennial ryegrass were studied under different light intensities. OsmiR164a-overexpression (OE164), target mimicry OsmiR164a (MIM164), and CRES-T (chimeric repressor gene-silencing technology) OsNAC60 (NAC60) transgenic plants and wild-type (WT) plants were evaluated in both field (shade and full sun) and growth chamber conditions (low, medium, and high PAR at 100, 400, and 1200 µmol s−1 m−2). Morphological and physiological analysis showed miR164 could fine-tune perennial ryegrass adaptation to changing light intensity, possibly via the regulation of target genes, such as NAC60. Overall, OE164 and NAC60 plants were similar to each other and more sensitive to high light, particularly under the field condition, demonstrated by smaller size and much poorer grass quality; MIM164 performed more like WT plants than either the OE164 or NAC60 plants. This study indicates the potential of genetic manipulation of miR164 and/or its targeted genes for turfgrass adaptation to changing light environments, and future research to further investigate the molecular mechanism beneath would be warranted.

1. Introduction

Sunlight is the dominant energy source for plants and all other life in the world by far, which varies from time to time (e.g., daily, seasonally), place to place, in intensity, and also in spectral composition (such as red, blue, and ultraviolet). Light is essential for plant life, and as primary producers on earth, plants need to adapt to all different light environments. Too little light, such as severe shade, means a negative energy balance, and the gain from photosynthesis cannot cover the basic energy requirements. However, the light response curves of most plant leaves saturate between 500 and 1000 µmol s−1 m−2, which is well below full sun light (about 1900–2000 µmol s−1 m−2). In addition, excess light entering the chloroplast leads to oxidative stress and photoinhibition, particularly in C3 plants, including perennial ryegrass (Lolium perenne L.) [1,2]; this causes a reduction in photosynthetic efficiency due to damage caused by excessive light to the photosystem II, affecting the overall photosynthetic process.
Given the crucial role of light in plant life, adaptation to each light environment is present at all levels from the morphological and structural to the molecular. For example, sun leaves are usually smaller and thicker than shade leaves, along with better-developed mesophyll [3]. In addition, plants have evolved an array of receptors to monitor the light environment, such as phytochrome A-E (PHYA-E), cryptochrome 1-3 (CRY1-3), and UVR8 (UV RESISTANCE LOCUS 8). After perceiving light quantity and quality changes, light signals will be transduced and regulated by a number of genes, including COPs, PIFs, HY5, hormone biosynthesis as well as transduction-related genes, microRNAs, etc. [4,5]. These allow plants to time and adjust their development such that they can cope with various light environmental circumstances.
MicroRNAs (miRNAs) are a type of endogenous small non-coding RNA, typically 20 to 24 bases long, that play a crucial role in the negative regulation of target gene expression in both plants and animals [6]. Research into plant miRNAs has revealed their pivotal roles in regulating diverse facets of plant growth and development, as well as interactions with the environment, encompassing responses to abiotic and biotic factors, and mutualistic or parasitic associations [7,8,9]. For example, miRNAs participate in modulating phenotypic plasticity in response to a range of environmental cues, including temperature and light. These findings underscore the multifaceted involvement of miRNAs in orchestrating plant physiological processes and their adaptation to environmental challenges [9]. Of which, miR156—as one of the most evolutionarily conserved miRNAs—forms a regulation module (miR156-SPLs) with its targeted SPL (SQUAMOSA-PROMOTER BINDING PROTEIN-LIKE) genes to act as a negative regulator of plant shade-avoidance syndrome. The module is further regulated by shade-activating transcription factor PIFs (PHYTOCHROME INTERACTING FACTORs), which bind to the promoters of miR156s and suppress their expression in Arabidopsis [10].
The microRNA164 (miR164) family is another highly conserved class of miRNAs in plants [11]. In Arabidopsis, the miR164 family consists of three members (miR164a, miR164b, miR164c), which mediate five NAC (NAM, ATAF1/2, and CUC2) transcription factor genes; in rice, it contains six members of miR164a/b/f, miR164c, miR164d, and miR164e, which mainly target six NAC transcription factors (OMTN1-6, Oryza miR164-targeted NAC), and some non-NAC genes, such as PSK5 (phytosulfokines precursor gene) and PM27 (seed maturation protein gene) [12,13,14,15]. These target genes are mainly involved in plant development, senescence-mediated cell death, and biotic/abiotic stresses [13,14]. For example, a number of studies have reported the regulation of miR164 by different environmental stimuli, particularly abiotic stresses, such as salt, cold, high temperature, drought, and heavy metals [12,16,17,18]. However, other than one study that showed the expression of miR164b was down-regulated under the treatment of high light (1500 µmol m−2·s−1) in Phyllostachys edulis [17], no study has reported the relationship between miR164 and the plant response to diverse light intensity. In addition, the relationship between miR164 and plant shade/high-light stress tolerance has not yet been found, and the specific response and tolerance mechanisms need to be further explored.
Perennial ryegrass is a popular cool-season (C3) turfgrass/forage grass species worldwide. Cool-season turfgrasses can potentially endure with as little as 5% of full sunlight. Nevertheless, the typical requirement for healthy growth is usually between 25% and 35% of full sunlight, varying based on the species and the intensity of management practices [19,20]. For perennial ryegrass, its light compensation point and saturation point were reported at 150 and 867 μmol m−2·s−1, respectively [21]. Either shade or high-light microenvironmental conditions are common for cool-season turfgrasses, including perennial ryegrass, and the growth and development of plants are greatly influenced by the quantity of light available for photosynthesis [22,23]. Therefore, the objective of this study aimed to elucidate the mechanisms by which miR164 and its target genes, such as NAC60, influence light adaptation. The findings from this study are expected to provide valuable insights into the molecular pathways governing plant adaptation to changing light environments, potentially informing genetic strategies for improving turfgrass resilience and performance under diverse light conditions.

2. Materials and Methods

2.1. Plant Materials, Growth Conditions, and Experiment Treatments

Perennial ryegrass “Citation Fore” (Pure Seed, Canby, OR, USA) was used in this study. Overexpressing (OE164), target mimicry (MIM164) rice miR164a, and CRES-T (chimeric repressor gene-silencing technology) rice NAC60 (NAC60) transgenic plants were developed as described previously [24,25,26,27,28]. Control plants of the wild type (WT) and one representative line from each transgenic perennial ryegrass variety (OE164, MIM164, and NAC60) were reproduced clonally from tillers within plastic cone tubes (18.5 cm deep and 5 cm wide), containing a soil blend of sand and peat (1:1 ratio). This propagation took place in a greenhouse maintained at China Agricultural University (Beijing, China), with temperature ranges of 15 ± 3 °C during the night and 25 ± 5 °C during the day. Plants with comparable growth statuses were carefully chosen for further experimentation. A total of 32 tubes of plants (8 tubes per type of ryegrass plants) were transplanted to the field in Experiment 1. Half of the plants were planted in a part shade plot (daily light integral, 15–19 mol m−2 d−1, LIGHTSCOUT DLI100 Daily light meter, Spectrum Technologies, Inc. Aurora, IL, USA), and another half were grown in a full sun conditions (35+ mol m−2 d−1). In Experiment 2, 72 plant tubes, with 18 tubes per type of ryegrass, were moved to plant growth chambers (RXZ, Jiangnan Instrument and Equipment Company, Ningbo, China). These chambers were equipped with LED white light, providing photosynthetically active radiation (PAR) at a rate of 400 µmol s−1 m−2, and maintaining a dark/light cycle of 16/22 °C, 10/14 h, and 70% relative humidity. The plants received watering as necessary, were trimmed to a height of 6 cm weekly, and fertilized biweekly with Miracle-Gro (N-P-K 24-12-14, Scotts, Wuhan, China) at a rate of 5 kg N ha−1 per month to sustain normal plant growth. After one week of acclimation to chamber conditions, the plants (six tubes per light intensity treatment) were randomly assigned to three different light intensities for a duration of 28 days (with day/night temperatures set at 22/16 °C and 14/10 h, respectively). These light intensities were categorized as low, medium, and high, with PAR values of 100, 400, and 1200 µmol s−1 m−2, respectively. To mitigate microenvironmental effects, tube positions within the chamber were rotated every 24 h throughout the experiment.

2.2. Sampling and Measurements

2.2.1. Morphological Comparison of Transgenic Plants Grown under Different

Light Intensity

In Experiment 1, the grass quality was visually evaluated as an integral of color, uniformity, and density on a scale of 1 (poorest or dead leaves) to 9 (a perfect or ideal grass) with 6 or above being acceptable according to the NTEP (National Turfgrass Evaluation Program), 3 months after transplanting to the field. In Experiment 2, plant height was measured from the soil surface to the top of the plants, and the width of the ryegrass leaves was measured using a vernier caliper. This was performed by determining the width of the widest section of the first fully developed leaf on a tiller, measured from the top to the bottom of the plant. Three measurements of randomly selected leaves were taken for each tube of plants.

2.2.2. Plant Leaf Electron Microscopy

Both scanning electron microscopy (SEM) analysis and transmission electron microscopy (TEM) observation were prepared according to Fowke [29]. Leaf samples were collected from identical relative positions on the longest tillers of OE164, MIM164, and WT ryegrass plants, and then sectioned into segments of 1–2 cm. These segments were subsequently immersed in a phosphate buffer (pH 7.2) containing 2.5% (v/v) glutaraldehyde for fixation. After dehydration, some of the samples were coated with gold particles and examined under a scanning electron microscope (SU8010, Hitachi, Tokyo, Japan) to analyze the coated surfaces [30]. The other samples were then washed and immersed in 1% osmium acid for one day. Later the samples were dehydrated and polymerized. Ultrathin sections with an ultramicrotome (EM UC7, Leica, Wetzlar, Germany) were photographed using a transmission electron microscope (JEM1230, Jeol, Tokyo, Japan).

2.2.3. Measurement of Physiological Parameters

In Experiment 1, fully expanded leaves were harvested 3 months after transplanting to the field. Leaf chlorophylls and carotenoids were extracted using dimethyl sulphoxide (DMSO) and quantified as described previously [31]. The absorbance of extracts was read at 665, 649, and 480 nm with a UV–Vis spectrophotometer (UH5300, Hitachi, Tokyo, Japan). Chlorophyll a, b, and carotenoids were calculated as milligrams per gram dry weight (DW) using the equations below: Chlorophyll a (Chla) = 12.19 × A665 − 3.45 × A649; Chlorophyll b (Chlb) = 21.99 × A649 − 3.52 × A665; and Carotenoids = (1000 × A480 − 2.14 × Chla-70.16 × Chlb)/220. In Experiment 2, the SPAD index value (representing leaf total chlorophyll content) was recorded 21 d after light treatments using a chlorophyll meter according to the user guide (SPAD-502Plus, Konica Minolta, Tokyo, Japan). The leaf maximum (Fv/Fm) and effective (Y(II)) photochemical quantum yields of PS II were measured 14 d after light treatments using a MINI PAM chlorophyll fluorescence meter (Walz, Effeltrich, Germany) according to the user manual.
Enzyme extracts were prepared following the method described by Wang et al. [32]. Leaf samples weighing 0.2 g were rapidly frozen in liquid nitrogen and then ground in 4 mL of a solution containing 50 mM phosphate buffer (PBS) at pH 7.8, 0.1 mM ethylenediaminetetraacetic acid (EDTA), and 1% polyvinylpolypyrrolidone (PVPP). The resulting homogenate was centrifuged at 12,000× g for 15 min at 4 °C, and the supernatant was used to assay superoxide dismutase (SOD) activity. To measure SOD activity, the reaction mixture without the enzyme extract developed the maximum color after illumination, representing the maximum reduction in p-Nitro-Blue tetrazolium chloride (NBT), while the mixture without illumination served as the control. The absorbance at 560 nm (A560) of the reaction mixture was measured using a Hitachi UH5300 spectrophotometer.

2.3. Experimental Design and Statistical Analysis

Experiment 1 and Experiment 2 were a split-plot design with four and six replications, respectively. The light treatments (shade/full sun or low/medium/high light) were the main plot and four genotypes of ryegrass plants (OE164, NAC60, MIM164, and WT) were the split plot. The analyses of the two experiments were conducted individually. Unless specified otherwise, all measurements were scrutinized utilizing the samples gathered according to the previously described sampling time. The data acquired were subjected to analysis employing SPSS software (Version 25.0, IBM, Armonk, NY, USA). Distinctions among treatments were discerned through the application of Fisher’s least-significant-difference (LSD) test, with a significance threshold set at 0.05.

3. Results and Discussion

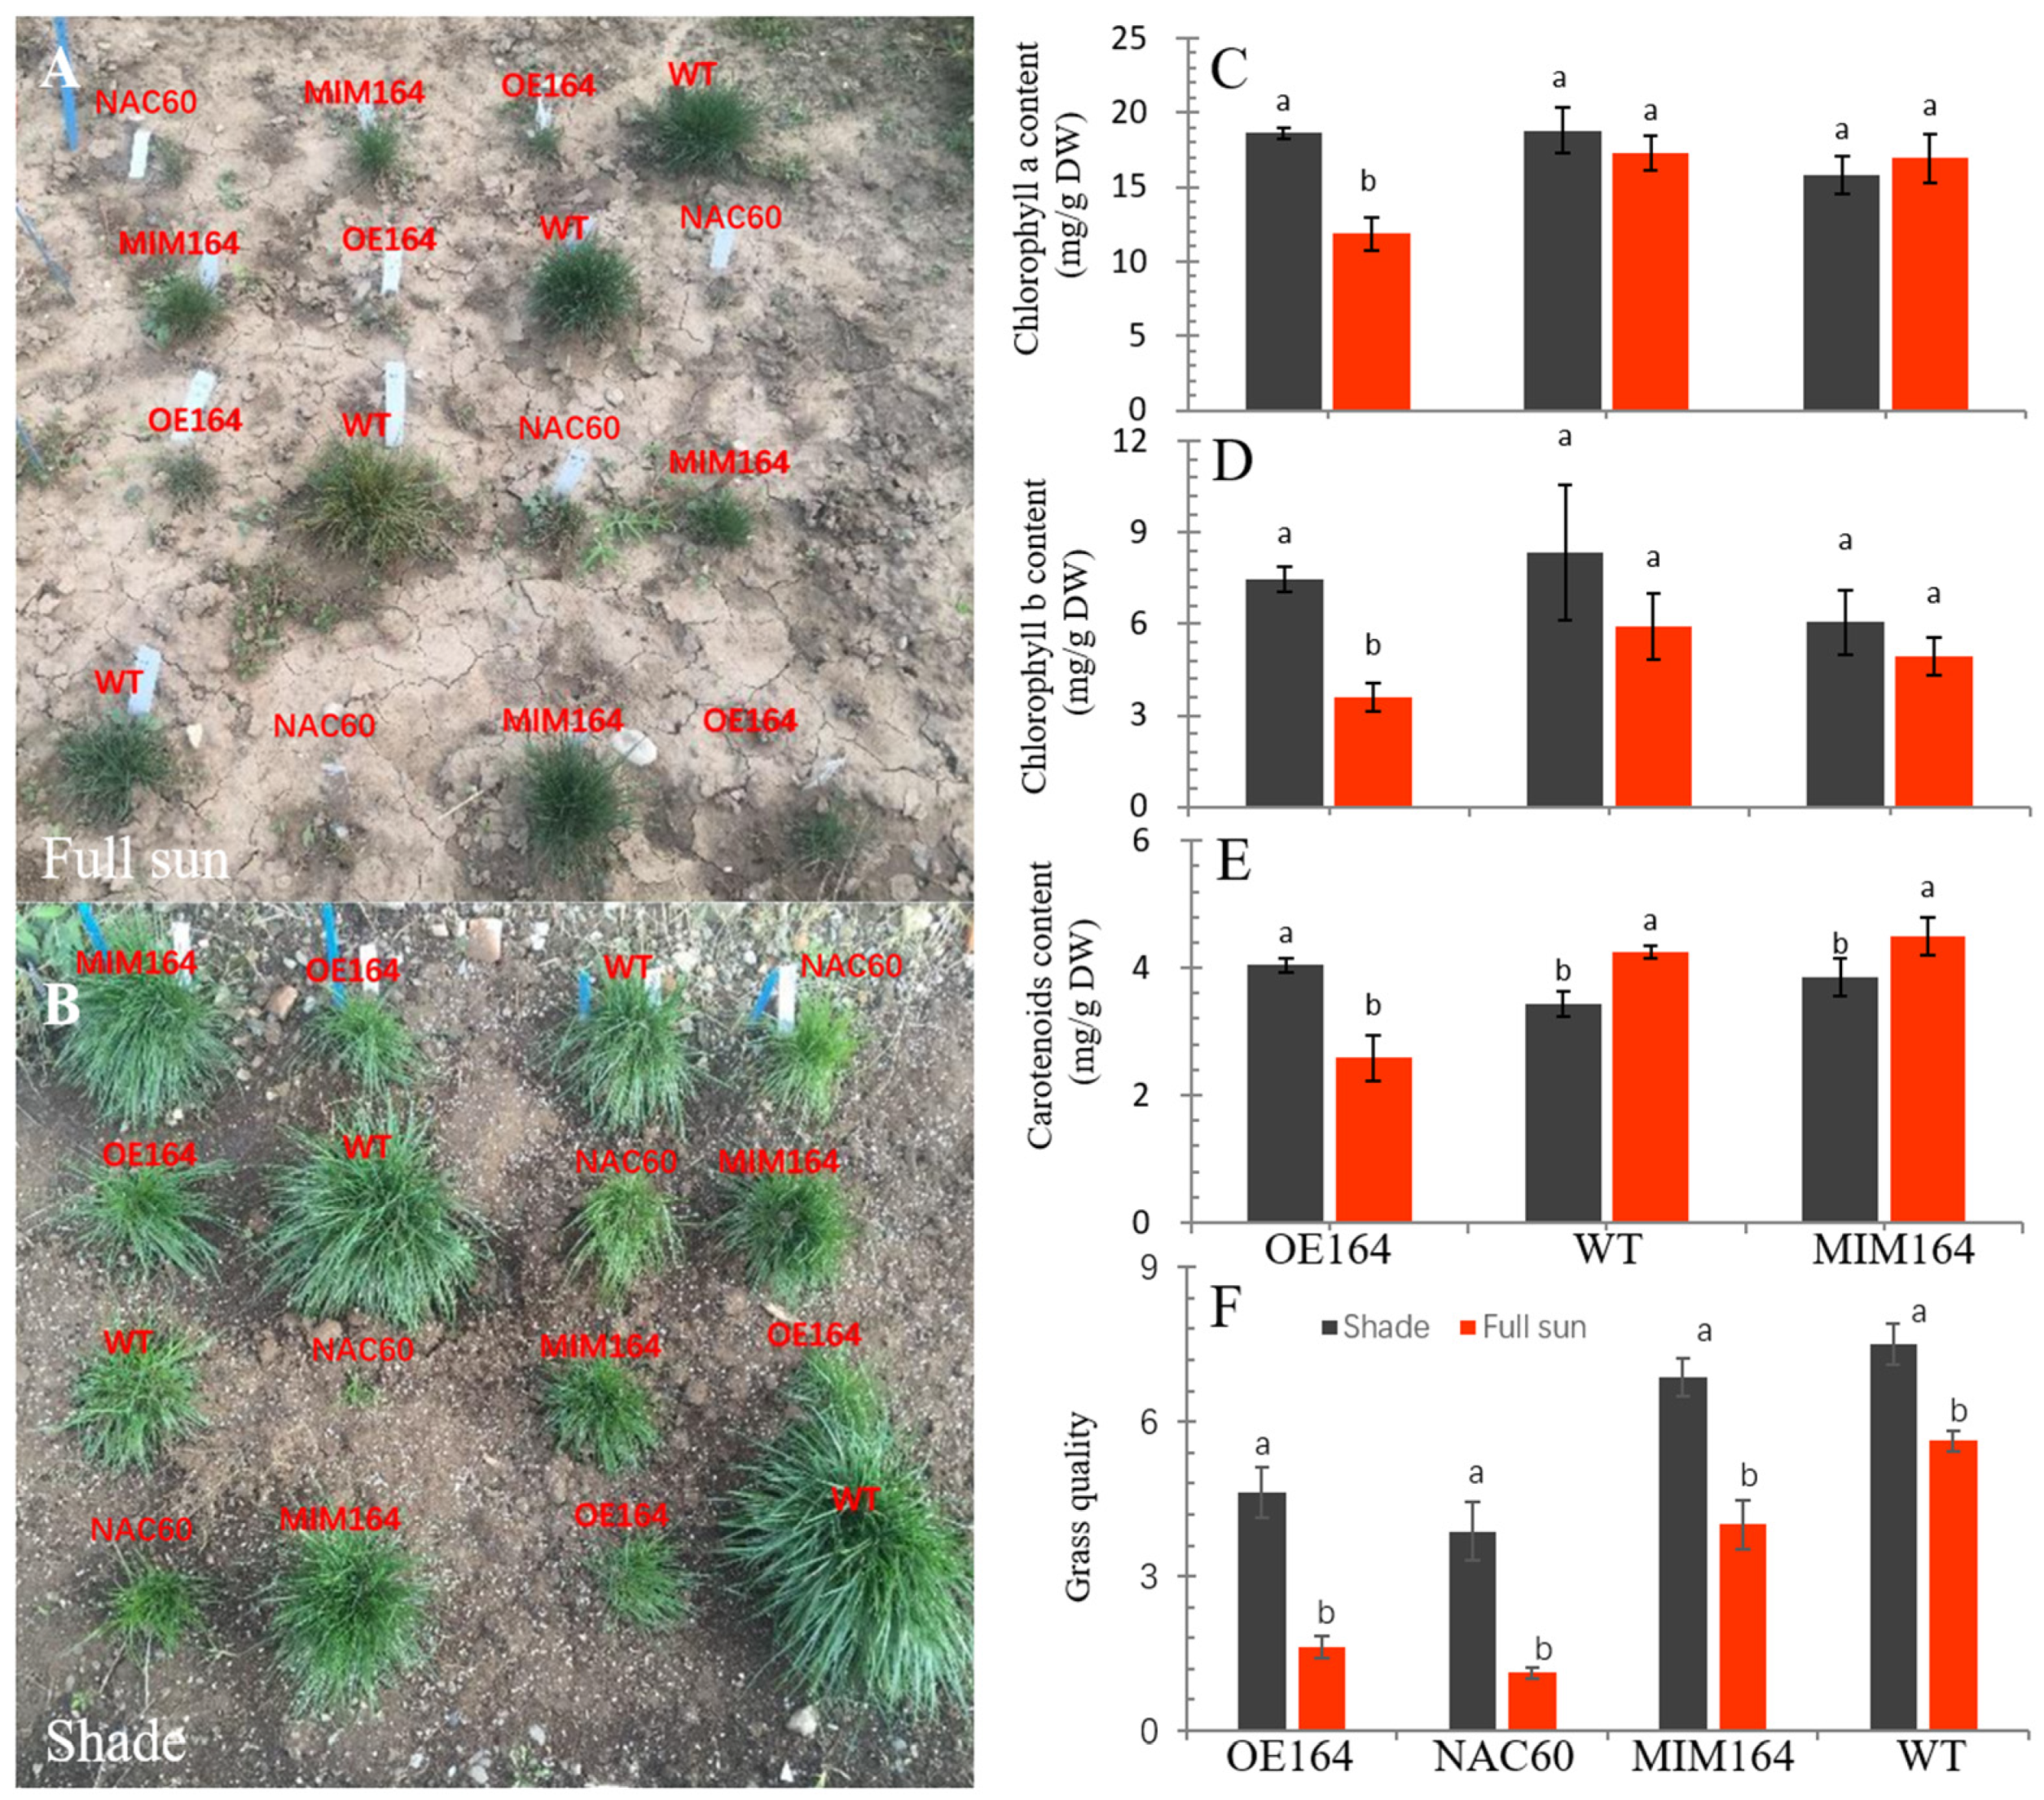
3.1. OE164, NAC60, MIM164, and WT Plants Performed Differently under Shade or Full Sun Field Conditions

3.1.1. Grass Quality and Photosynthetic Pigments

Unlike animals, light stands out as a pivotal environmental element that significantly influences the growth and development of plants. It plays a crucial role in processes like photosynthesis and photomorphogenesis. Just like all biological conditions, too much light can be as detrimental as too little light [33,34]. In Experiment 1, the grass quality data showed that all the ryegrass plants performed better under shade than those under full sun conditions, regardless of the genotype. Among them, the WT plant was overall the best with a quality rating of about 6 and 8 under full sun and shade, respectively. The grass quality of MIM164 was better than those of both OE164 and NAC60, which were poor and lower than acceptable, particularly under full sun conditions (Figure 1A,B,F). Nearly all four replications of NAC60 plants were dead under full sun, for which NAC60 was not included in the chlorophyll measurements nor electron microscopy analysis later.
Photosynthetic pigments, including chlorophyll a, chlorophyll b, and carotenoids vary under different abiotic stresses, including shade and high light. Chlorophylls absorb light energy and are directly related to photosynthesis, and carotenoids function in transferring the light energy absorbed by chlorophylls and play a protective role in photosynthesis [2,35]. Here both chlorophyll a and b contents of OE164 decreased under full sun compared to the shade condition, and they showed an overall reducing trend but this was not significantly different between the light conditions in both WT and MIM164 plants (Figure 1C,D). In the meanwhile, the carotenoid content declined under full sun but they increased in both WT and MIM164 plants (Figure 1E). These generally agreed with the overall performance demonstrated by the grass quality data. Reduced chlorophyll content under high light is proposed as an indicator of chlorophyll destruction through excessive irradiation [36]. Zhang, Ge, et al. [37] reported that the lower chlorophyll content of Heptacodium miconioides seedlings under high light (full sun) was also a result of expression changes in chlorophyll metabolism-related genes, such as the higher level of a chlorophyll-degradation associated gene, PAO (pheophorbide a oxygenase) [38]. Previous studies indicated that a target gene of miR164, ORE1/NAC2, directly regulates chlorophyll catabolic genes, including PAO and PPH (pheophytin pheophorbide hydrolase), during ethylene-mediated senescence [38,39,40,41]. Under shade, OE164 maintained a higher level of chlorophyll content than MIM164 plants (Figure 1C,D), which might be related to the role of miR164 in leaf senescence. Future analysis of the expressions of photosynthetic and chlorophyll metabolism-related genes in the four genotypes of ryegrass plants would help to understand more details of the regulatory role of miR164 in plant responses to light.

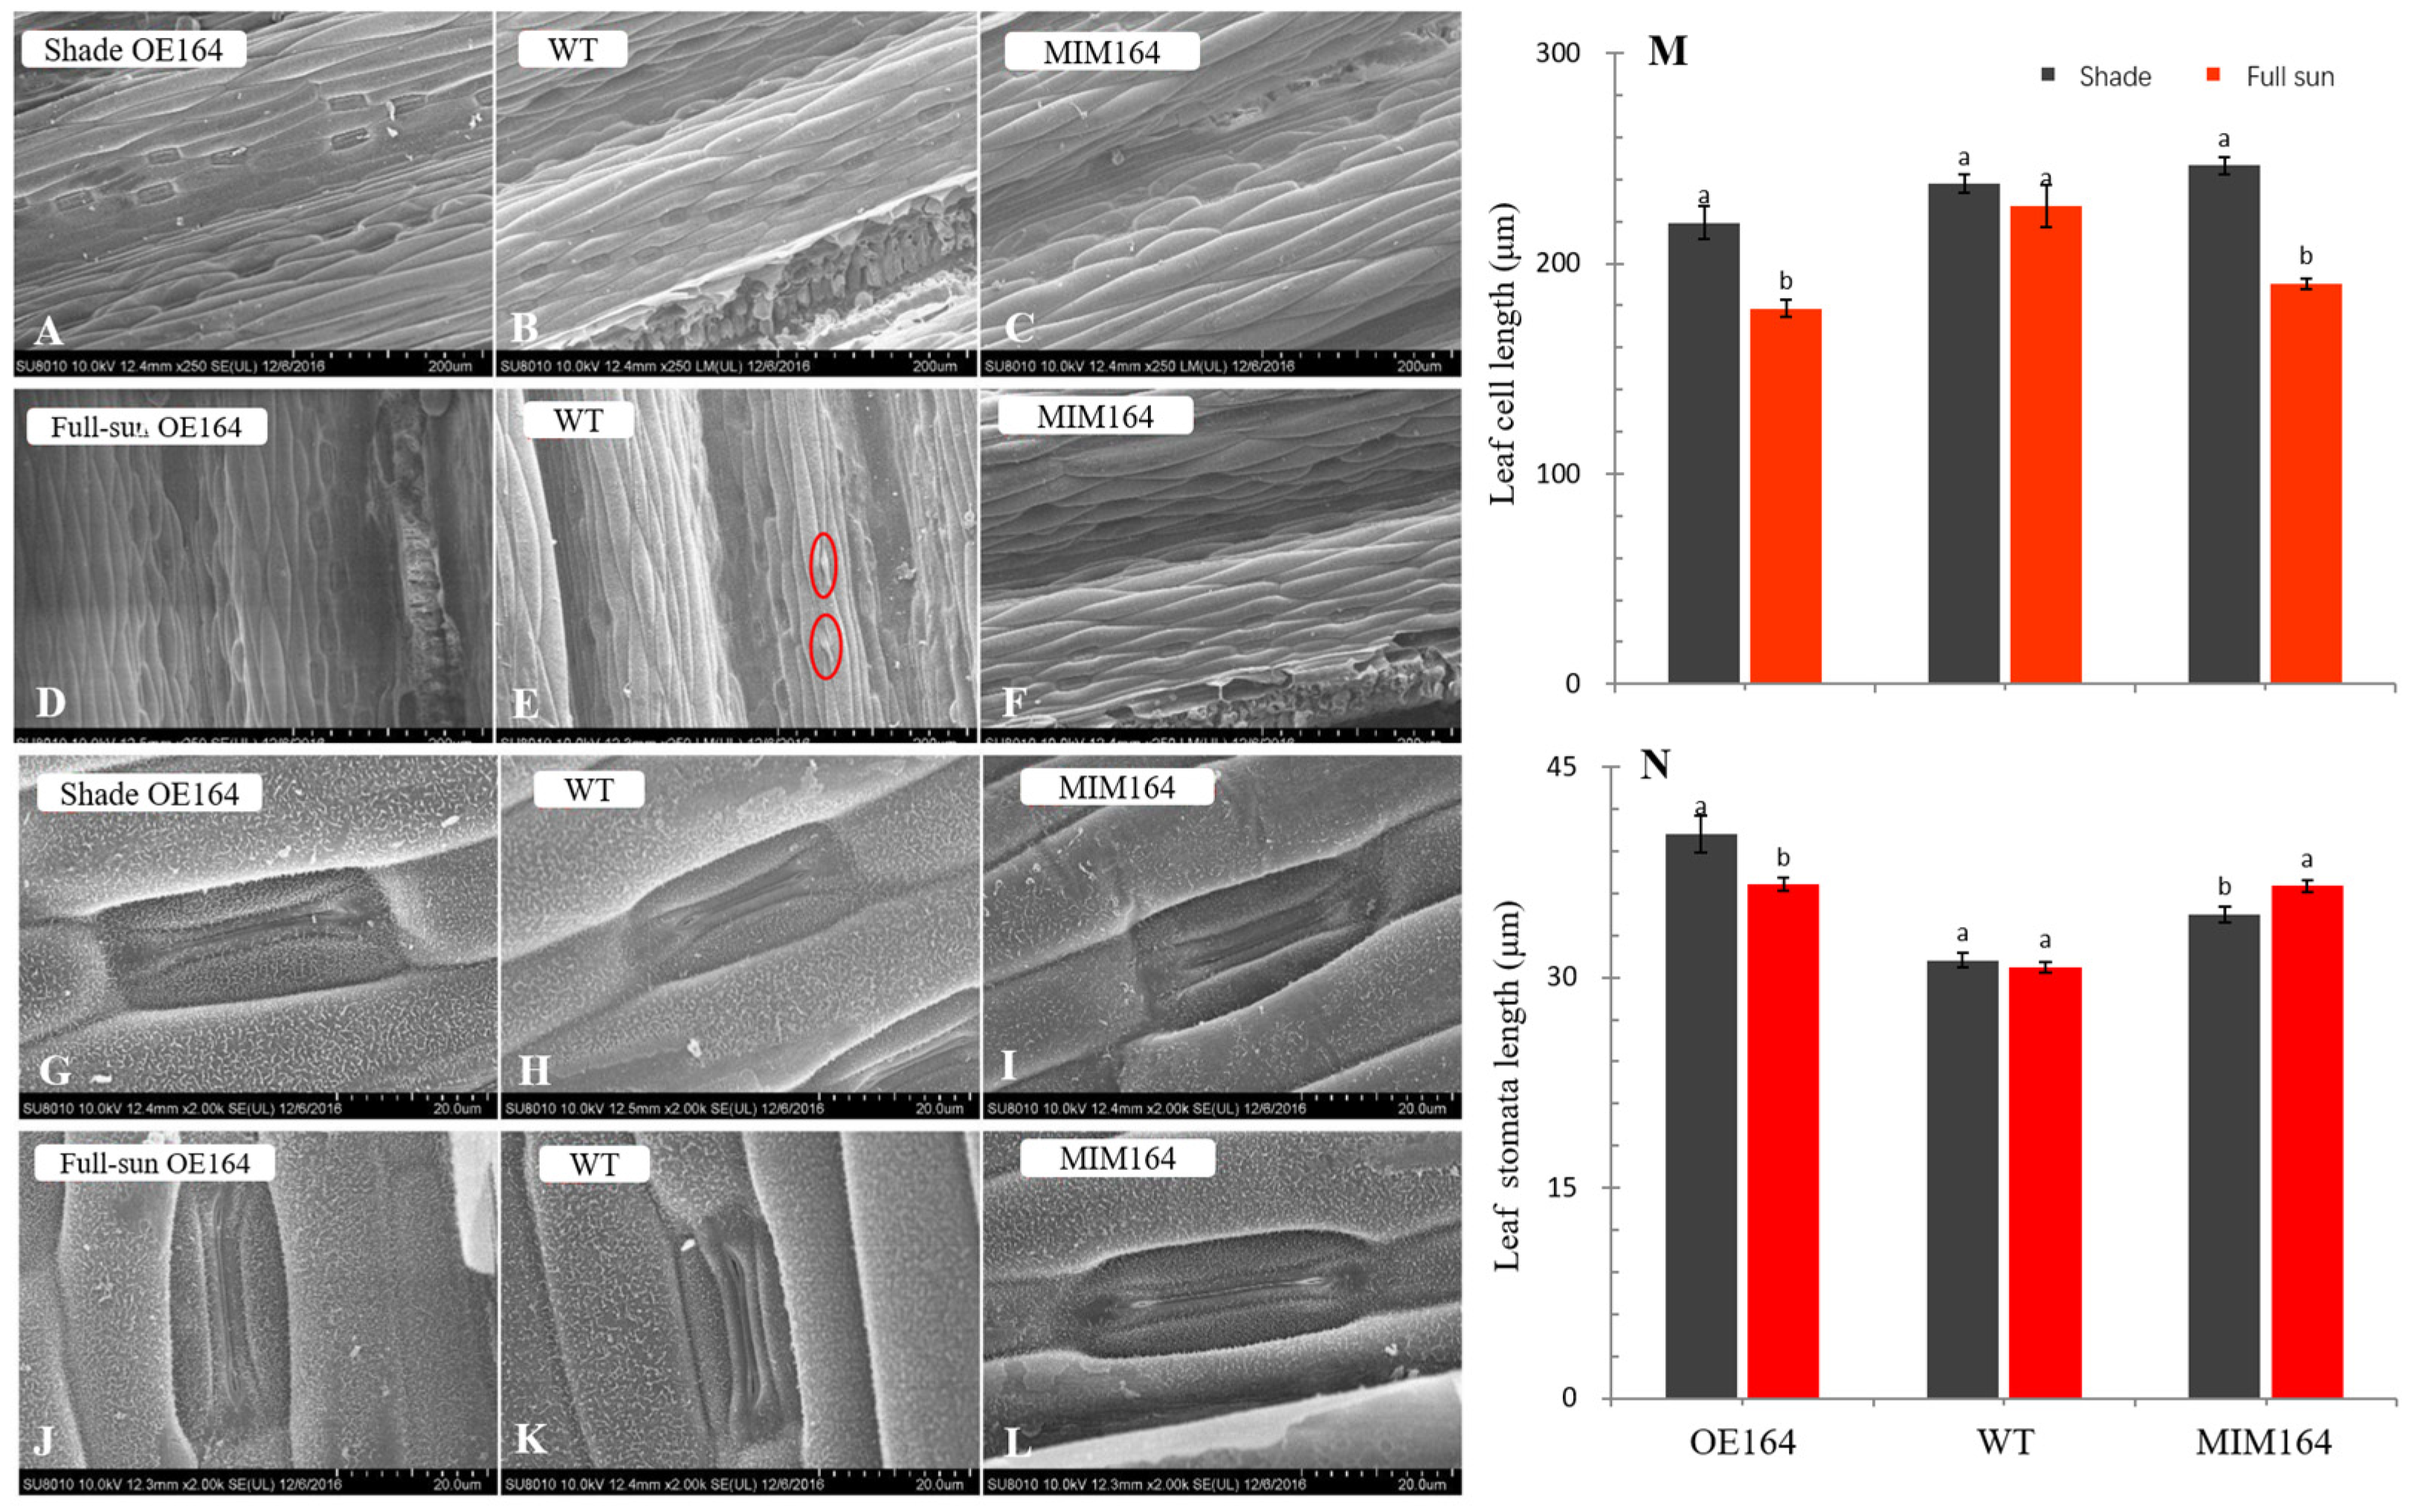
3.1.2. Leaf SEM and TEM Analysis

Leaf scanning electron microscopy analysis found that a few siliceous papillae on the leaf surfaces were only observed in WT plants under full sun conditions. Further epidermal cell-length measurement found that the cells of OE164 and MIM164 plants under shade were longer than those under full sunlight conditions. A similar trend in the WT plants was observed, while the difference was not significant (Figure 2A–F,M). This was somehow consistent with the plant phenotype we observed. Under full sunlight, all four genotypes of plants, including OE164 and MIM164, were shorter and smaller than those under shade conditions (Figure 1A,B). Dunn et al. [42] reported four grass species increased cell length in shaded treatments. Other than the high light intensity, the increased blue light perceived by cryptochromes under full sun compared to shade conditions would also inhibit the elongation of stems and leaves [3,43]. Additionally, magnified pictures showed that the stomatal length of OE164 plants decreased under full sun in comparison to their length in shaded environments. On the contrary, it increased in MIM164 plants (Figure 2G–L,N). Stomatal characteristics are highly responsive to light variations due to their integral role in photosynthesis. This process, wherein plants convert carbon dioxide and water into energy and oxygen using light, occurs primarily in the stomata. Stomata intake carbon dioxide and release oxygen so their aperture size influences the plant’s response to light intensity. In high light, stomata open wider to increase carbon dioxide intake, boosting photosynthesis. Under low or excessive light, stomata may close to prevent water loss via transpiration. Hence, analyzing stomatal traits like size, density, and aperture can reveal plant adaptations to light conditions. Plants with larger, denser stomata are suited to bright environments, while those with smaller, more regulated stomata thrive in low or fluctuating light. Stomatal traits thus indicate a plant’s light adaptability [44,45]. Zhang et al. [34] reported the stomata of seedlings under high light had larger length and width than those under low light. Higher lighting conditions prompt the opening of stomata, facilitating greater CO2 absorption [46]. Conversely, when light levels become excessive, stomata close swiftly to reduce water loss and prevent xylem damage by limiting transpiration, thereby protecting against photoinhibition [23,47]. Moreover, Phookaew et al. [48] found the expression levels of miR164/MesNAC in Cassava (Manihot esculenta) were found to vary in relation to stomatal closure changes due to water deficits; however, how exactly miR164 was involved in the stomatal response difference among the three genotypes of ryegrass plants would need further investigation.
Based on the TEM observation, the number of chloroplasts and peroxisomes of the three genotypes of plants under full sunlight conditions increased compared with shade (Figure 3). Under high light conditions, the rate of photorespiration increases, necessitating a greater peroxisomal activity to manage the resultant oxidative stress. Enhanced photosynthesis leads to the accumulation of larger starch granules as more glucose is converted into starch for storage. In contrast, under low light conditions, photosynthetic activity diminishes, resulting in smaller starch granules due to the reduced conversion of glucose into starch. Thus, the size of starch granules can reflect the photosynthetic capacity of ryegrass under different light intensities. Under the shading condition, the starch grains produced by chloroplasts in the OE164 plants were significantly bigger than those under the full sunlight condition, which indicated that the photosynthetic yield of OE164 plants under the shading condition is possibly higher than that under full sun. This was in accordance with the better performance of OE164 under shade (Figure 1). In the meanwhile, in high-light environments, excessive light energy can damage the photosynthetic machinery. To mitigate this, plants increase the extent of thylakoid stacking to enhance non-photochemical quenching, which dissipates excess energy as heat. Conversely, in low light conditions, thylakoid stacking is reduced to maximize the efficiency of light capture and utilization. The OE164 plants showed less thylakoid stacking than MIM164 and WT under shade (Figure 3C,F,I), whereas they had larger and more swelling in the mitochondria than MIM164 and WT under full sun, particularly when compared to the WT (Figure 3L,O,R). Chloroplasts from shade leaves often show substantial thylakoid stacking, and small granal stacks are typical of chloroplasts from high-light leaves [3]. Lin, Zhu, et al. [49] reported the loss of function of tomato (Solanum lycopersicum) miR164a by CRISPR/Cas9-mediated mutagenesis resulted in enhanced chloroplast development. Under abiotic stresses, such as temperature and oxidative stresses, mitochondrial swelling and ultrastructural disorganization occur [50,51]; moreover, changes in mitochondrial morphology including mitochondrial swelling and aggregation have been observed during programmed cell death (PCD) progression in vivo [52].

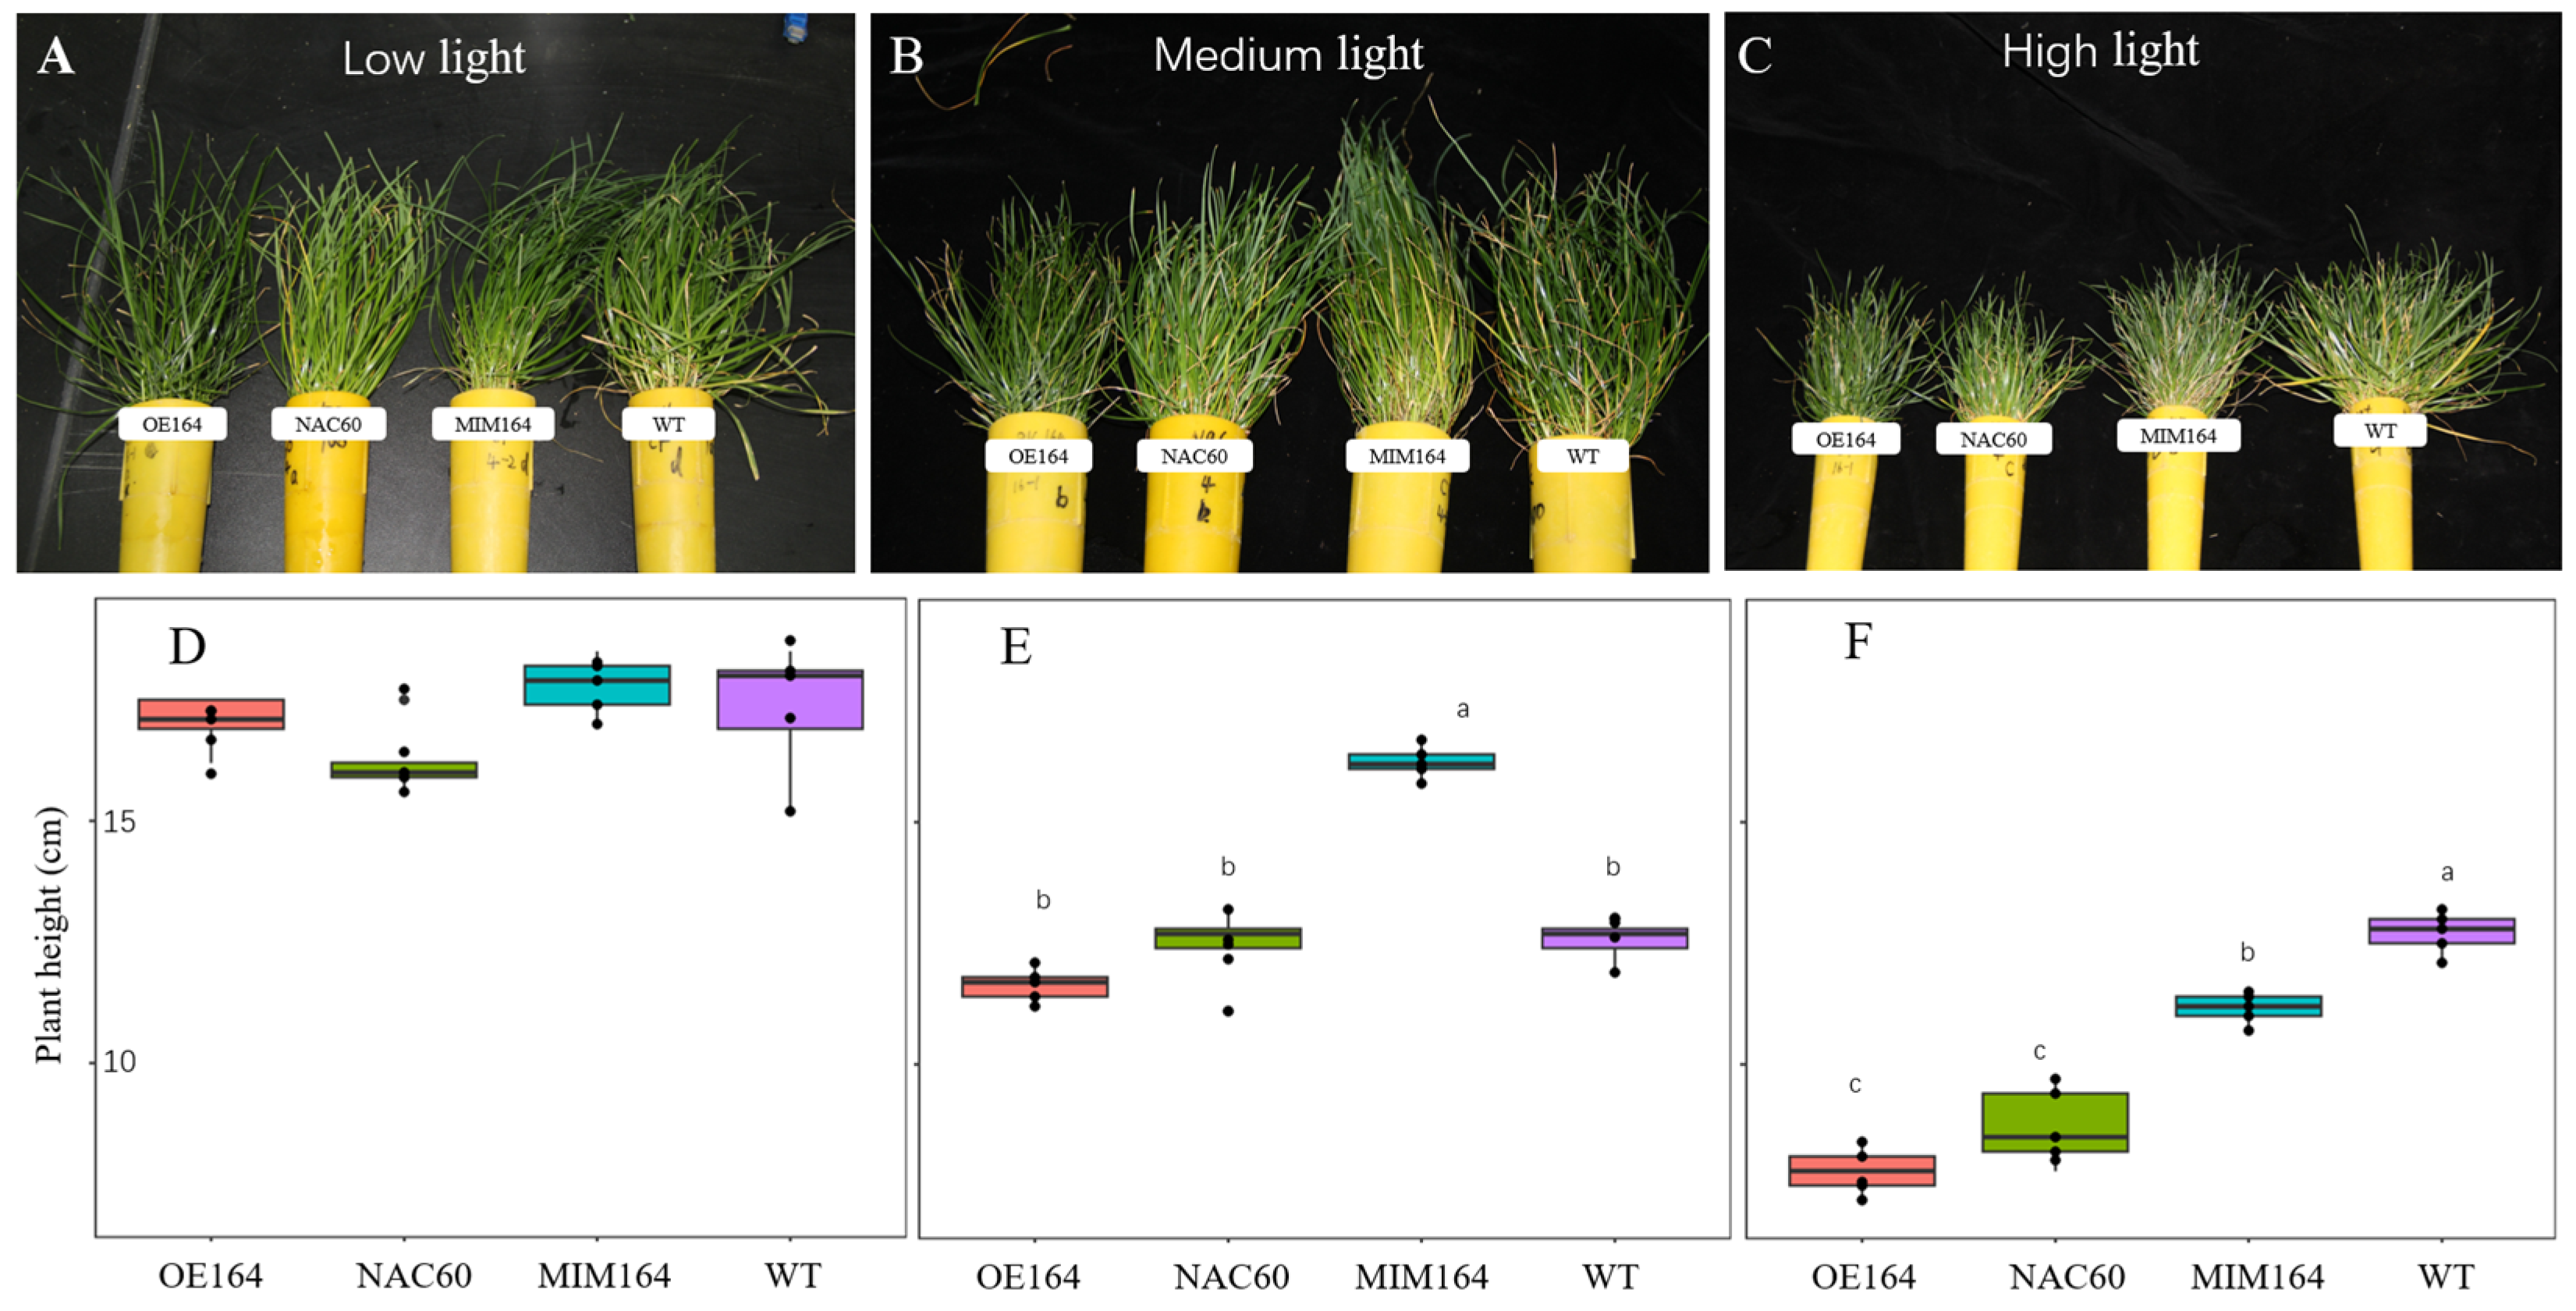
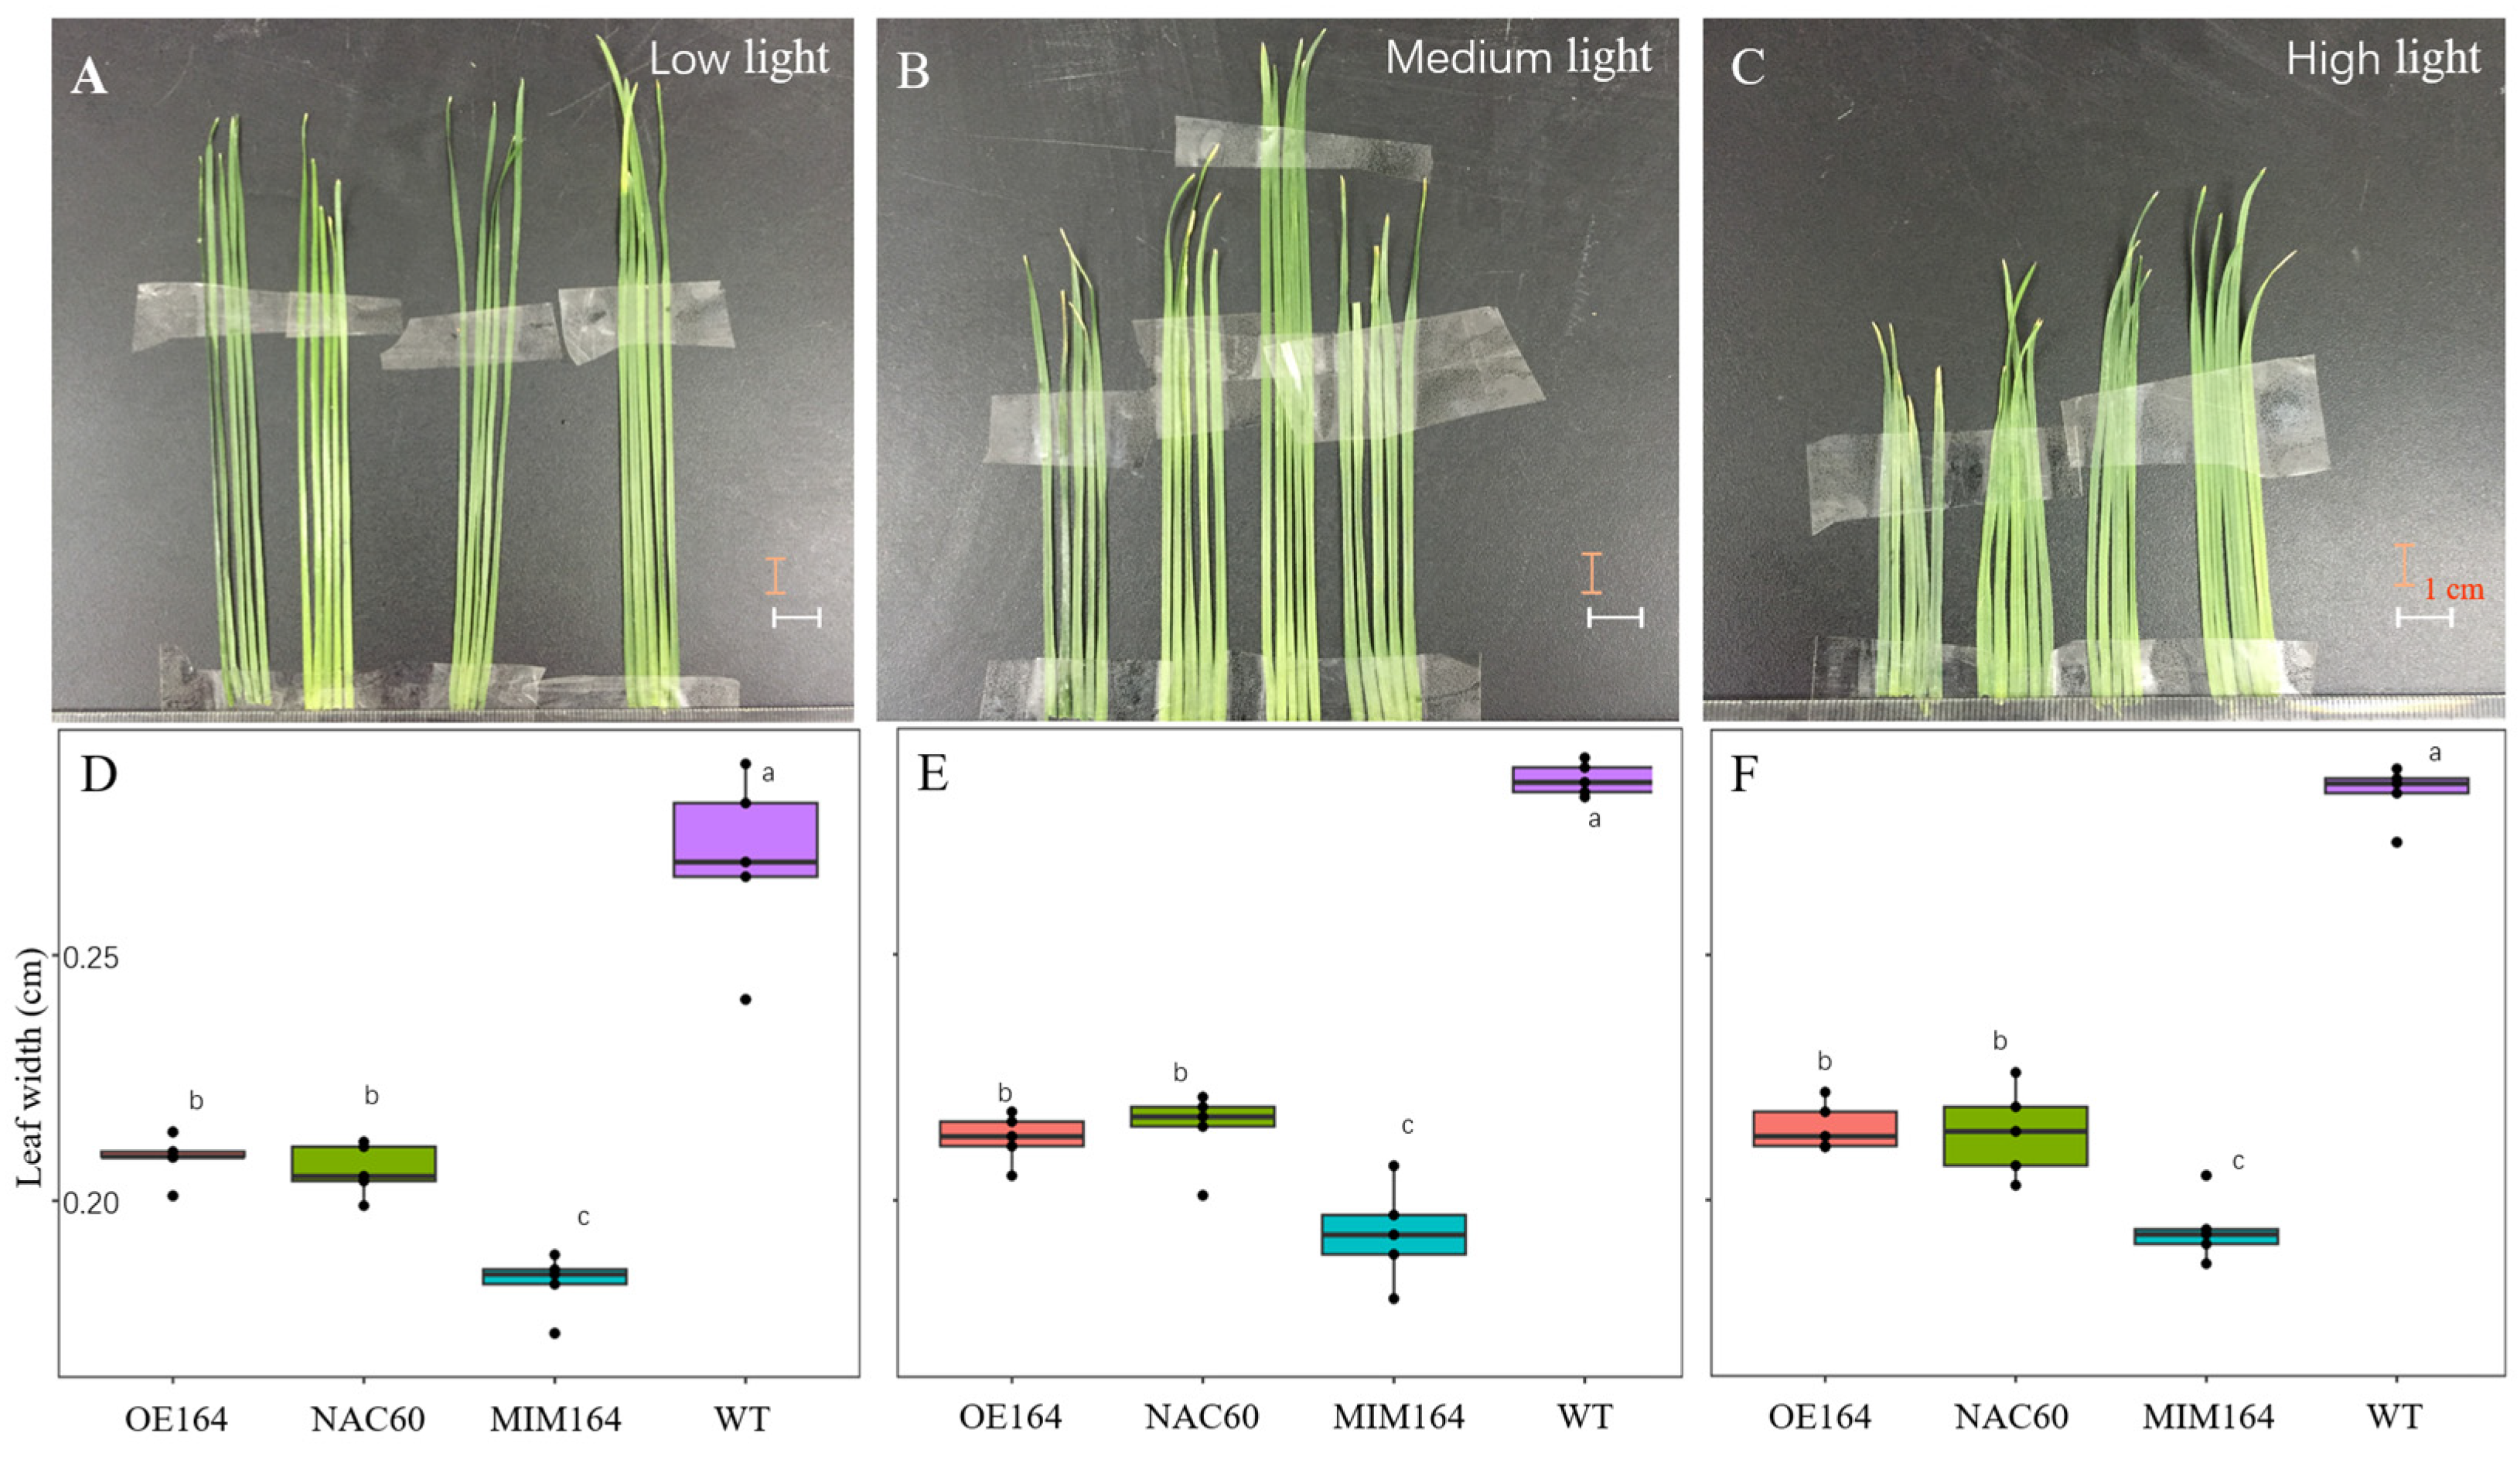
3.2. OE164, NAC60, MIM164, and WT Plants Responded Similarly to Various Light Intensities in Growth Chambers but to Different Extents

3.2.1. The Morphology of OE164, NAC60, MIM164, and WT Plants

Similar to the observation in Experiment 1, plant height decreased with the increase in light intensity, regardless of the genotypes (Figure 4). Among them, OE164 and NAC60 looked most alike. For example, from low light to high light treatment, the heights of OE164 and NAC60 decreased from 17.0, 11.6, to 7.8 cm, and 16.2, 12.4, to 8.7 cm, respectively; MIM164 decreased from 17.8, 16.2, to 11.2 cm (Figure 4D–F). The leaf width of MIM164 was the narrowest, and the leaf widths of all four genotypes of plants were relatively unchanged across the light treatments (Figure 5). However, different from Experiment 1, the overall dwarf phenotype under high light intensity in Experiment 2 was not as severe as that under full sun field conditions, especially for the OE164 and NAC60 plants. With the global environmental changes, increasing UV and temperature are becoming increasing threats to plant growth and development [53,54,55]. As a cool-season grass, perennial ryegrass is known to be UV and high-temperature sensitive [56,57]; thus, we assumed that in addition to high light intensity, the increased UV radiation and summer high temperature under full sun conditions could also account for the differences between Experiment 1 and Experiment 2.

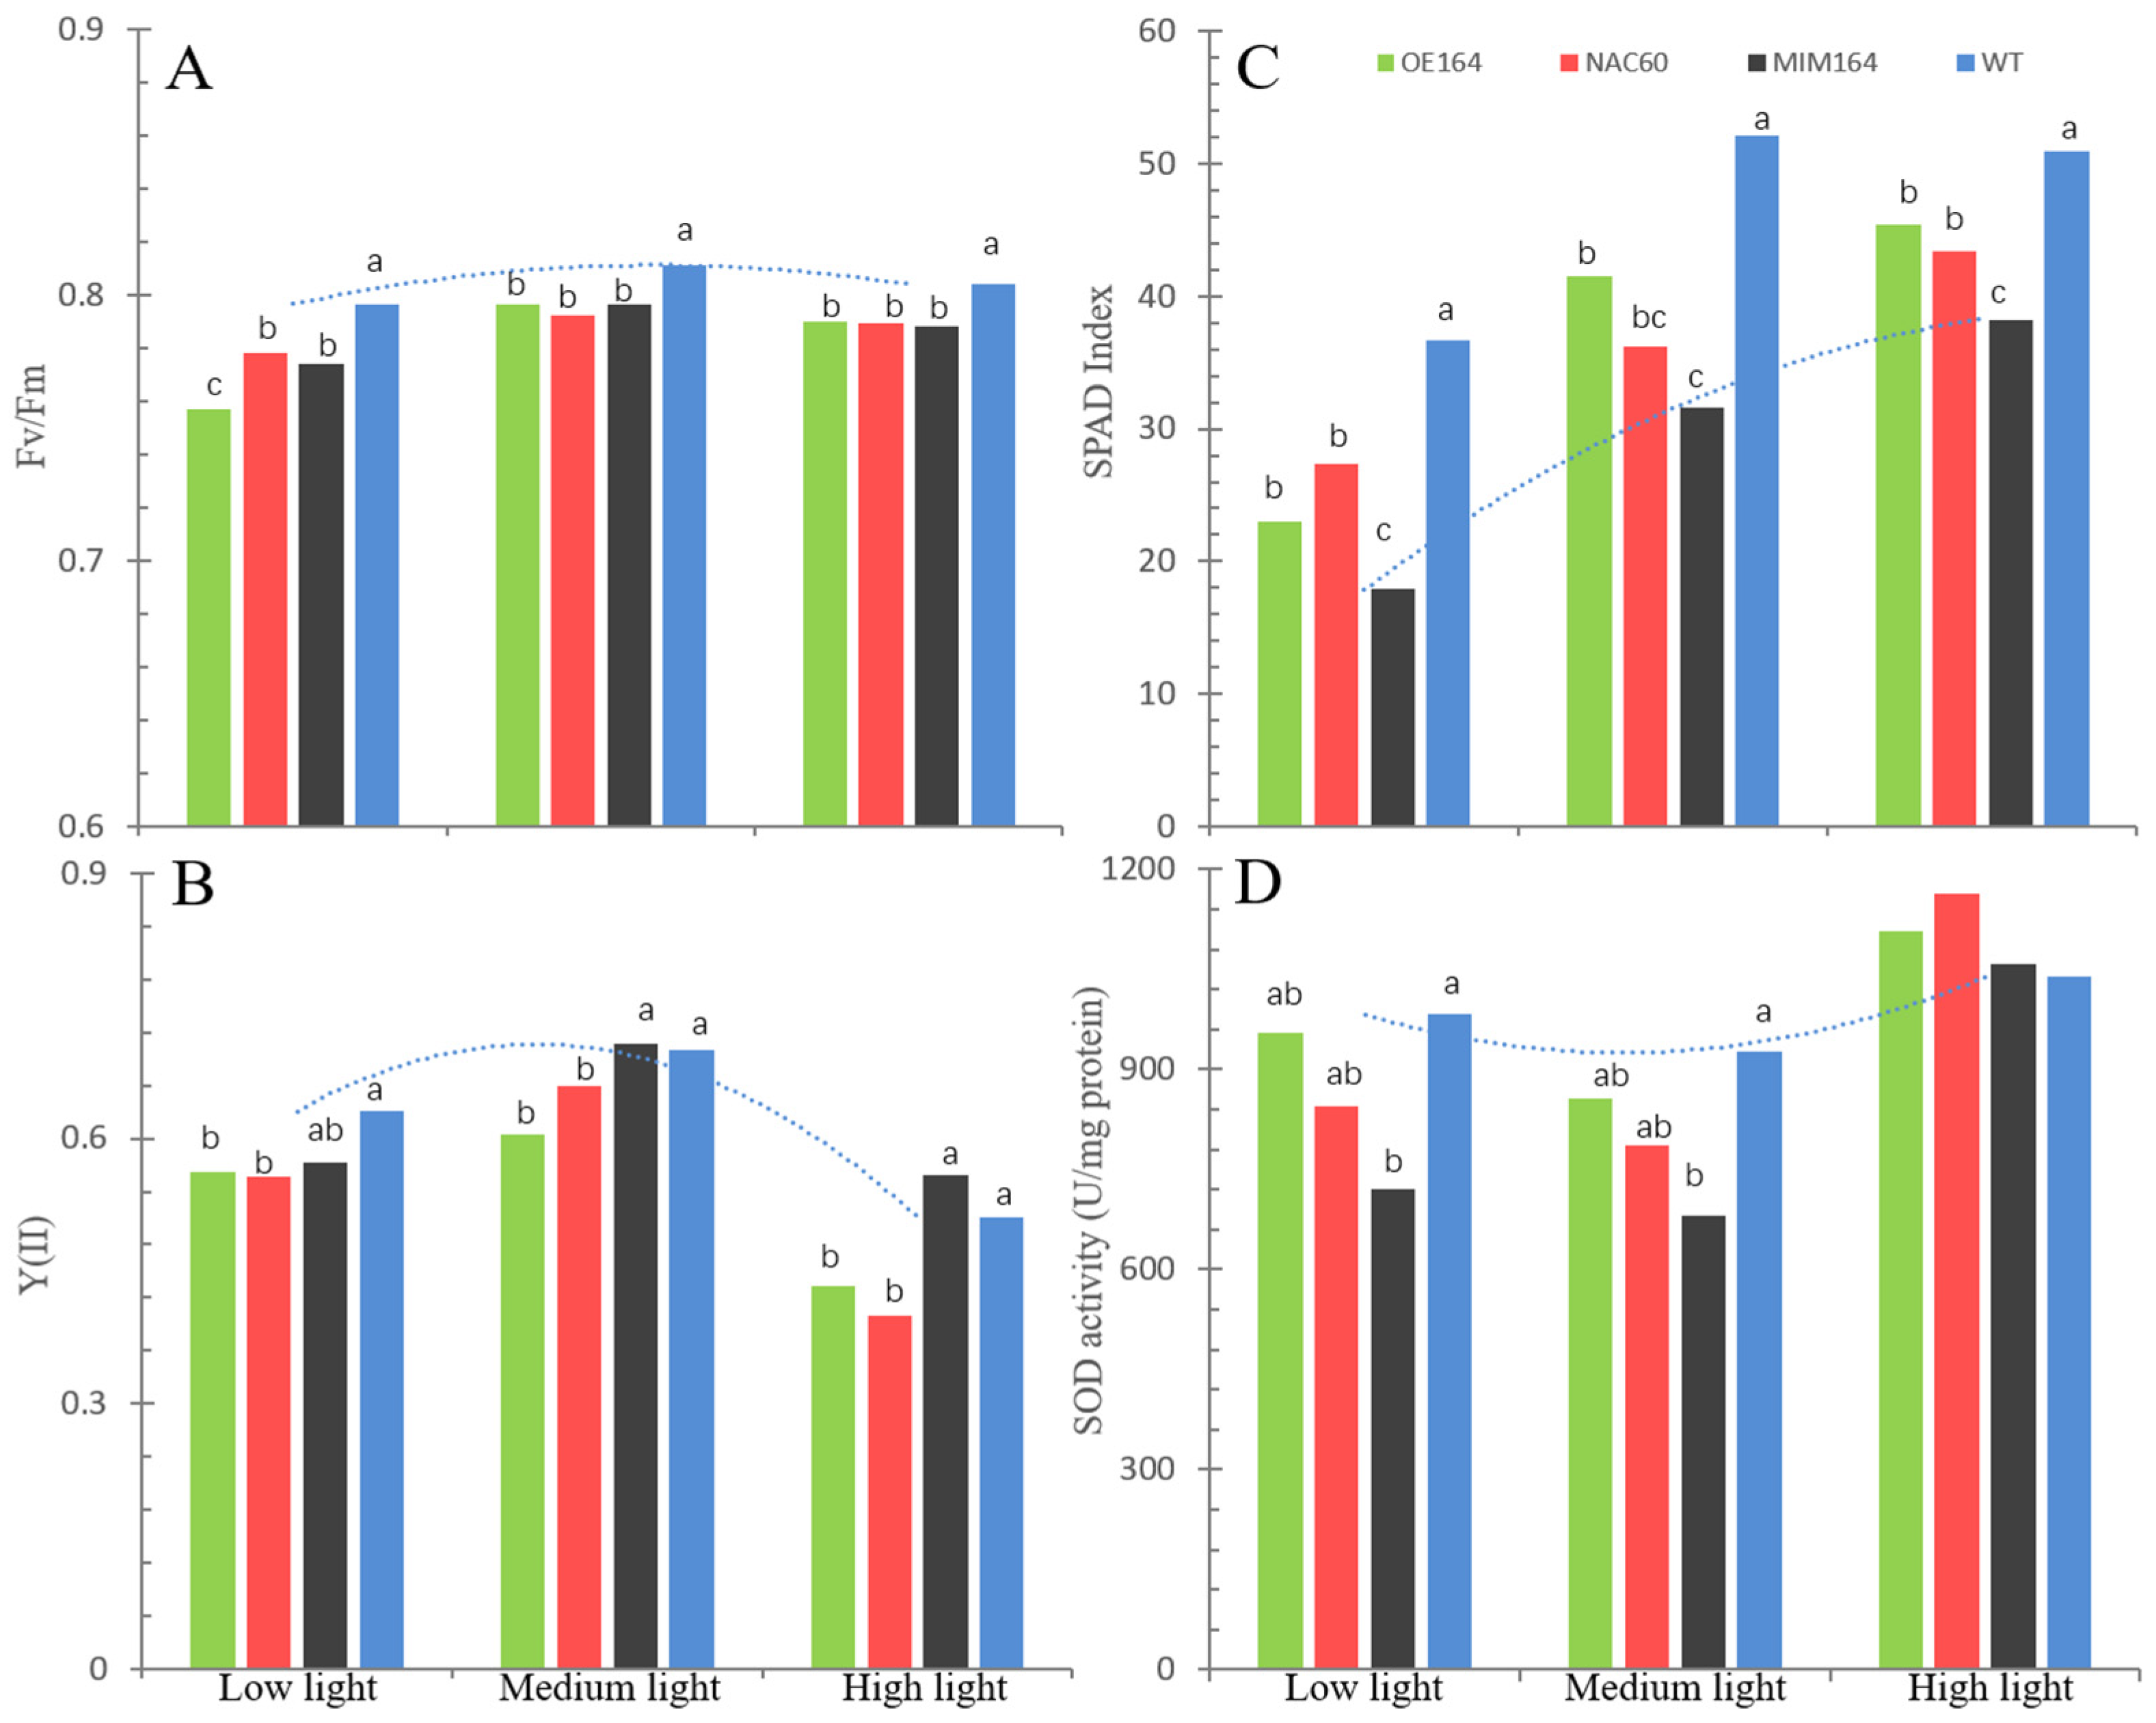
3.2.2. The Physiology of OE164, NAC60, MIM164, and WT Plants

The intensity of light has a direct impact on the process of light absorption in plants, resulting in alterations in the quantities of chlorophyll pigments and variations in the operational condition of photosystem II (PSII) [58]. Interestingly, a trend of increase in the SPAD index along with light intensity increase was observed (Figure 6C). The rate of photosynthesis is determined by light intensity. At low intensity, the rate of photosynthesis rises with increasing light intensity, peaking at the light saturation point. However, excessive light can damage the photosynthetic machinery, leading to photoinhibition [2,59]. Under strong light, the photosystem II (PSII) is readily inactivated, which is referred to as the photoinhibition of PSII [60]. Overall, the Fv/Fm increased and then decreased slightly with the increase in the light intensity across all four genotypes (Figure 6A). Consequently, the observed decrease in Fv/Fm under intense light reflects the impact of photoinhibition on PSII efficiency; the changing trend of Y(II) was similar to Fv/Fm (Figure 6B). Additionally, the WT plants performed generally better than the other three genotypes regardless of light conditions (Figure 6A,B). Previous studies suggest an increased Fv/Fm and Y(II) in plants grown under normal light compared to shade conditions [33]. Interestingly, the SOD activities showed a trend opposite to Fv/Fm and Y(II) under different light intensities (Figure 6A,B,D). Intense light triggers the generation of reactive oxygen species (ROS), leading to the direct deactivation of the photosystem II (PSII) photochemical reaction center [61]. To avoid/reduce photoinhibition, plants have developed various photoprotection mechanisms, including the reactive oxygen species (ROS) scavenging system [62]. Within a cell, the superoxide dismutases (SODs) serve as the initial defense against reactive oxygen species (ROS). They achieve this by catalyzing the dismutation of the superoxide anion free radical (O2−) into molecular oxygen (O2) and hydrogen peroxide (H2O2) [63]. Hence, the increase in SOD activity under intense light conditions serves as a photoprotective mechanism against photoinhibition and ROS-induced damage to the PSII. The trend of higher leaf SOD activities at both low and high light conditions than medium light might reflect a stress-induced antioxidant response, which is in accordance with the lower Fv/Fm and Y(II). Like high light stress, shade/low light could result in increased SOD activity, along with accumulation of the malondialdehyde content due to ROS damage [64]. The relationship between Fv/Fm, photoinhibition, and SOD activity reflects the dynamic response of the photosynthetic apparatus to varying light intensities. Decreased Fv/Fm values indicate the onset of photoinhibition due to excessive light, while increased SOD activity signifies the activation of photoprotective mechanisms to mitigate ROS-induced damage and maintain PSII efficiency under high light stress; however, the higher SOD activity of WT plants under both low and medium light more likely indicates a more active growth and metabolic status than other ryegrass plants.

3.3. MiR164 Plays a Role in Regulating Plant Adaptation to Changing Light Intensity

The miR164 family is well-known to play important roles in various abiotic stresses. For instance, the miR164-TaNAC14 module regulates drought tolerance in wheat seedlings, with tae-miR164 reducing drought and salinity tolerance by downregulating the expression of TaNAC14 [12]. Fang et al. [13] also suggest that the conserved miR164-targeted NAC genes may be negative regulators of drought tolerance in rice. However, Lu et al. [65] reported that overexpression of the peu-miR164 target PeNAC070 gene in Arabidopsis promoted sensitivity of transgenic plants to drought and salt stresses. More recently, the miR164 mutants presented heat-sensitive phenotypes, while 164OE transgenic plants showed better heat tolerance than WT plants [66]. Overall, whether miR164 is a negative or positive regulator of plant tolerance to abiotic stresses is not determined. Wang et al. [17] found high light down-regulated the expression of miR164b in Phyllostachys edulis but did not further investigate how miR164 affected the plant responses to light. Here we used OE164, NAC60, MIM164, and WT perennial ryegrass plants to further functionally analyze the role of miR164 in regulating plant adaptation to changing light environments. In this study, the WT plants generally performed the best across different light environments among all four types of ryegrass plants, and MIM164 was more similar to WT than to either OE164 or NAC60. In addition, OE164 and NAC60 were like each other, and were both sensitive to high light, particularly in the field full sun conditions. These results indicated that a certain/suitable range of miR164 level could be important for plants to maintain a wide adaptation to changing light environments, which were most likely through the regulation of target genes, such as NAC60, a putative target gene of miR164 in rice [27]. One possible explanation could be that wild-type plants or wild plants are those that have been naturally selected and adapted in natural environments for hundreds of thousands of years. For example, wild plants are generally thought to have higher plant plasticity or greater phenotypic homeostasis than crops [67,68]. Further experiments would be needed to investigate how the regulation module of miR164-NACs works under varying light intensity conditions (e.g., shade, high light).

4. Conclusions

In summation, morphological and physiological analysis of OE164, NAC60, MIM160, and WT plants under different light intensity conditions showed that the miR164 gene affected perennial ryegrass responses to changing light environments in both field and growth chamber experiments. Particularly, both OE164 and NAC60 plants presented high-light sensitive phenotypes in the field full sun condition, such as much smaller plants, lower grass quality, and more mitochondrial swelling. This study indicates that miR164 and/or its targeted genes can serve as new genetic resources for plant light adaptation breeding in the future. Future research will focus on further elucidating the molecular mechanisms underlying miR164-mediated light sensitivity and exploring the potential for genetic modification to enhance light tolerance in perennial ryegrass and other crop species. These efforts aim to develop new plant varieties better suited to varying light conditions, which is increasingly important in the context of climate change and the need for sustainable agricultural practices. The successful application of these genetic resources could lead to significant improvements in turfgrass yield and quality, thereby contributing to global food security and agricultural sustainability.

Author Contributions

W.Z., Y.L. and K.W. designed and coordinated the study. L.Z., X.H., N.M. and K.W. wrote the manuscript and performed the data analysis. X.H. and N.M. collected and grew the plant material and conducted treatments. Q.H. and D.L. gave helpful suggestions for the whole project and further revised the manuscript. All authors have read and agreed to the published version of the manuscript.

Funding

This research was funded by the National Natural Science Foundation of China (32071887, 32271754), and the National Key Research and Development Program of China (2023YFF1001403).

Data Availability Statement

The original contributions presented in this study are included in the article, further inquiries can be directed to the corresponding authors.

Conflicts of Interest

The authors declare no conflicts of interest.

References

  1. Guidi, L.; Lo Piccolo, E.; Landi, M. Chlorophyll Fluorescence, Photoinhibition and Abiotic Stress: Does it Make Any Difference the Fact to Be a C3 or C4 Species? Front. Plant Sci. 2019, 10, 174. [Google Scholar] [CrossRef] [PubMed]
  2. Kato, Y.; Kuroda, H.; Ozawa, S.I.; Saito, K.; Dogra, V.; Scholz, M.; Zhang, G.X.; de Vitry, C.; Ishikita, H.; Kim, C.; et al. Characterization of tryptophan oxidation affecting D1 degradation by FtsH in the photosystem II quality control of chloroplasts. eLife 2023, 12, RP88822. [Google Scholar] [CrossRef] [PubMed]
  3. Schulze, E.D.; Beck, E.; Muller-Hohenstein, K. Plant Ecology; Springer: Berlin/Heidelberg, Germany, 2005. [Google Scholar]
  4. de Wit, M.; Galvão, V.C.; Fankhauser, C. Light-Mediated Hormonal Regulation of Plant Growth and Development. Annu. Rev. Plant Biol. 2016, 67, 513–537. [Google Scholar] [CrossRef]
  5. Hernando, C.E.; Garcia, C.; Mateos, J.L. Casting Away the Shadows: Elucidating the Role of Light-mediated Posttranscriptional Control in Plants. Photochem. Photobiol. 2017, 93, 656–665. [Google Scholar] [CrossRef] [PubMed]
  6. Zhu, C.; Zhang, S.T.; Zhou, C.Z.; Chen, L.; Zaripov, T.; Zhan, D.M.; Weng, J.J.; Lin, Y.L.; Lai, Z.X.; Guo, Y.Q. Integrated Transcriptome, microRNA, and Phytochemical Analyses Reveal Roles of Phytohormone Signal Transduction and ABC Transporters in Flavor Formation of Oolong Tea (Camellia sinensis) during Solar Withering. J. Agric. Food Chem. 2020, 68, 12749–12767. [Google Scholar] [CrossRef] [PubMed]
  7. Ahmad, H.M.; Wang, X.; Ijaz, M.; Rahman, M.U.; Oranab, S.; Ali, M.A.; Fiaz, S. Molecular aspects of microRNAs and phytohormonal signaling in response to drought stress: A review. Curr. Issues Mol. Biol. 2022, 44, 3695–3710. [Google Scholar] [CrossRef] [PubMed]
  8. Zhou, R.; Song, Y.; Xue, X.; Xue, R.; Jiang, H.; Zhou, Y.; Qi, X.; Wang, Y. Differential Transcription Profiling Reveals the MicroRNAs Involved in Alleviating Damage to Photosynthesis under Drought Stress during the Grain Filling Stage in Wheat. Int. J. Mol. Sci. 2024, 25, 5518. [Google Scholar] [CrossRef]
  9. Song, X.W.; Li, Y.; Cao, X.F.; Qi, Y.J. MicroRNAs and Their Regulatory Roles in Plant-Environment Interactions. Annu. Rev. Plant Biol. 2019, 70, 489–525. [Google Scholar] [CrossRef] [PubMed]
  10. Xie, Y.R.; Liu, Y.; Wang, H.; Ma, X.J.; Wang, B.B.; Wu, G.X.; Wang, H.Y. Phytochrome-interacting factors directly suppress MIR156 expression to enhance shade-avoidance syndrome in Arabidopsis. Nat. Commun. 2017, 8, 348. [Google Scholar] [CrossRef]
  11. Sunkar, R.; Zhou, X.; Zheng, Y.; Zhang, W.; Zhu, J.K. Identification of novel and candidate miRNAs in rice by high throughput sequencing. BMC Plant Biol. 2008, 8, 25. [Google Scholar] [CrossRef]
  12. Chi, Q.; Du, L.Y.; Ma, W.; Niu, R.Y.; Wu, B.W.; Guo, L.J.; Ma, M.; Liu, X.L.; Zhao, H.X. The miR164-TaNAC14 module regulates root development and abiotic-stress tolerance in wheat seedlings. J. Integr. Agric. 2023, 22, 981–998. [Google Scholar] [CrossRef]
  13. Fang, Y.; Xie, K.; Xiong, L. Conserved miR164-targeted NAC genes negatively regulate drought resistance in rice. J. Exp. Bot. 2014, 65, 2119–2135. [Google Scholar] [CrossRef] [PubMed]
  14. Lee, M.H.; Jeon, H.S.; Kim, H.G.; Park, O.K. An Arabidopsis NAC transcription factor NAC4 promotes pathogen-induced cell death under negative regulation by microRNA164. New Phytol. 2017, 214, 343–360. [Google Scholar] [CrossRef] [PubMed]
  15. Zhou, Y.; Zhou, S.Q.; Wang, L.P.; Wu, D.; Cheng, H.L.; Du, X.; Mao, D.D.; Zhang, C.L.; Jiang, X.C. miR164c and miR168a regulate seed vigor in rice. J. Integr. Plant Biol. 2020, 62, 470–486. [Google Scholar] [CrossRef] [PubMed]
  16. Bhardwaj, A.R.; Joshi, G.; Pandey, R.; Kukreja, B.; Goel, S.; Jagannath, A.; Kumar, A.; Katiyar-Agarwal, S.; Agarwal, M. A Genome-Wide Perspective of miRNAome in Response to High Temperature, Salinity and Drought Stresses in Brassica juncea (Czern) L. PLoS ONE 2014, 9, e92456. [Google Scholar] [CrossRef] [PubMed]
  17. Wang, L.L.; Zhao, H.S.; Sun, H.Y.; Dong, L.L.; Lou, Y.F.; Gao, Z.M. Expression Analysis of miR164b and Its Target Gene PeNAC1 in Phyllostachys edulis under Stress. For. Res. 2015, 28, 605–611. [Google Scholar]
  18. Zhang, M.; Liang, S.J.; Hang, X.M.; Xiang, Y.X.; Cheng, Z.L.; Li, W.J.; Shi, J.M.; Huang, L.; Sun, Y.Q. Identification of heavy-ion radiation-induced microRNAs in rice. Adv. Space Res. 2011, 47, 1054–1061. [Google Scholar] [CrossRef]
  19. Peng, X.; Feng, C.; Wang, Y.T.; Zhang, X.; Wang, Y.Y.; Sun, Y.T.; Xiao, Y.Q.; Zhai, Z.F.; Zhou, X.; Du, B.Y.; et al. MiR164g-MsNAC022 acts as a novel module mediating drought response by transcriptional regulation of reactive oxygen species scavenging systems in apple. Hortic. Res. 2022, 9, uhac192. [Google Scholar] [CrossRef] [PubMed]
  20. Han, R.; Ma, L.; Terzaghi, W.; Guo, Y.; Li, J.G. Molecular mechanisms underlying coordinated responses of plants to shade and environmental stresses. Plant J. 2024, 117, 1893–1913. [Google Scholar] [CrossRef]
  21. Bell, G.E.; Danneberger, T.K.; McMahon, M.J. Spectral Irradiance Available for Turfgrass Growth in Sun and Shade. Crop Sci. 2000, 40, 189–195. [Google Scholar] [CrossRef]
  22. Gardner, D.S.; Goss, R.M. Management of Turfgrass in Shade. Turfgrass Biol. Use Manag. 2013, 56, 219–247. [Google Scholar]
  23. Shi, Y.; Ke, X.; Yang, X.; Liu, Y.; Hou, X. Plants response to light stress. J. Genet. Genom. 2022, 49, 735–747. [Google Scholar] [CrossRef] [PubMed]
  24. Cen, H.; Ye, W.; Liu, Y.; Li, D.; Wang, K.; Zhang, W. Overexpression of a Chimeric Gene, OsDST-SRDX, Improved Salt Tolerance of Perennial Ryegrass. Sci. Rep. 2016, 6, 27320. [Google Scholar] [CrossRef] [PubMed]
  25. Franco-Zorrilla, J.M.; Valli, A.; Todesco, M.; Mateos, I.; Puga, M.I.; Rubio-Somoza, I.; Leyva, A.; Weigel, D.; Garcia, J.A.; Paz-Ares, J. Target mimicry provides a new mechanism for regulation of microRNA activity. Nat. Genet. 2007, 39, 1033–1037. [Google Scholar] [CrossRef] [PubMed]
  26. Ma, N. Genetic Transformation of miR164 and Target Mimicry miR164 Gene on Perennial Ryegrass. Master’s Thesis, China Agricultural University, Beijing, China, 2015. [Google Scholar]
  27. Wang, Z.Y.; Xia, Y.Q.; Lin, S.Y.; Wang, Y.R.; Guo, B.H.; Song, X.N.; Ding, S.C.; Zheng, L.Y.; Feng, R.Y.; Chen, S.L.; et al. Osa-miR164a targets OsNAC60 and negatively regulates rice immunity against the blast fungus Magnaporthe oryzae. Plant J. 2018, 95, 584–597. [Google Scholar] [CrossRef]
  28. Xu, C.; Huang, X.; Ma, N.; Liu, Y.; Xu, A.; Zhang, X.; Li, D.; Li, Y.; Zhang, W.; Wang, K. MicroRNA164 Affects Plant Responses to UV Radiation in Perennial Ryegrass. Plants 2024, 13, 1242. [Google Scholar] [CrossRef]
  29. Fowke, L.C. Transmission and Scanning Electron Microscopy for Plant Protoplasts, Cultured Cells and Tissues. In Plant Cell, Tissue and Organ Culture: Fundamental Methods; Gamborg, O.L., Phillips, G.C., Eds.; Springer: Berlin Heidelberg, Germany, 1995; pp. 229–238. [Google Scholar]
  30. Hang, N.; Shi, T.R.; Liu, Y.R.; Ye, W.X.; Taier, G.; Sun, Y.; Wang, K.H.; Zhang, W.J. Overexpression of Os-microRNA408 enhances drought tolerance in perennial ryegrass. Physiol. Plant. 2020, 172, 733–747. [Google Scholar] [CrossRef]
  31. Wellburn, A.R. The Spectral Determination of Chlorophylls a and b, as well as Total Carotenoids, Using Various Solvents with Spectrophotometers of Different Resolution. J. Plant Physiol. 1994, 144, 307–313. [Google Scholar] [CrossRef]
  32. Wang, K.H.; Zhang, X.Z.; Ervin, E. Antioxidative responses in roots and shoots of creeping bentgrass under high temperature: Effects of nitrogen and cytokinin. J. Plant Physiol. 2012, 169, 492–500. [Google Scholar] [CrossRef]
  33. Shafiq, I.; Hussain, S.; Raza, M.A.; Iqbal, N.; Asghar, M.A.; Raza, A.; Fan, Y.F.; Mumtaz, M.; Shoaib, M.; Ansar, M.; et al. Crop photosynthetic response to light quality and light intensity. J. Integr. Agric. 2021, 20, 4–23. [Google Scholar] [CrossRef]
  34. Zhang, J.; Ge, J.; Dayananda, B.; Li, J. Effect of light intensities on the photosynthesis, growth and physiological performances of two maple species. Front. Plant Sci. 2022, 13, 999026. [Google Scholar] [CrossRef] [PubMed]
  35. Chai, S.F.; Tang, J.M.; Mallik, A.; Shi, Y.C.; Zou, R.; Li, J.T.; Wei, X. Eco-physiological basis of shade adaptation of Camellia nitidissima, a rare and endangered forest understory plant of Southeast Asia. BMC Ecol. 2018, 18, 5. [Google Scholar] [CrossRef] [PubMed]
  36. Griffin, J.J.; Ranney, T.G.; Pharr, D.M. Photosynthesis, Chlorophyll Fluorescence, and Carbohydrate Content of Illicium Taxa Grown under Varied Irradiance. J. Am. Soc. Hortic. Sci. 2004, 129, 46–53. [Google Scholar] [CrossRef]
  37. Tanaka, A.; Tanaka, R. Chlorophyll metabolism. Curr. Opin. Plant Biol. 2006, 9, 248–255. [Google Scholar] [CrossRef] [PubMed]
  38. Kim, H.J.; Hong, S.H.; Kim, Y.W.; Lee, I.H.; Jun, J.H.; Phee, B.K.; Rupak, T.; Jeong, H.; Lee, Y.; Hong, B.S.; et al. Gene regulatory cascade of senescence-associated NAC transcription factors activated by ETHYLENE-INSENSITIVE2-mediated leaf senescence signalling in Arabidopsis. J. Exp. Bot. 2014, 65, 4023–4036. [Google Scholar] [CrossRef] [PubMed]
  39. Li, J.; Lai, T.; Song, H.; Xu, X. MiR164 is involved in delaying senescence of strawberry (Fragaria ananassa) fruit by negatively regulating NAC transcription factor genes under low temperature. Russ. J. Plant Physiol. 2017, 64, 251–259. [Google Scholar] [CrossRef]
  40. Li, Z.H.; Peng, J.Y.; Wen, X.; Guo, H.W. ETHYLENE-INSENSITIVE3 Is a Senescence-Associated Gene That Accelerates Age-Dependent Leaf Senescence by Directly Repressing miR164 Transcription in Arabidopsis. Plant Cell 2013, 25, 3311–3328. [Google Scholar] [CrossRef] [PubMed]
  41. Moschen, S.; Luoni, S.B.; Paniego, N.B.; Hopp, H.E.; Dosio, G.A.A.; Fernandez, P.; Heinz, R.A. Identification of Candidate Genes Associated with Leaf Senescence in Cultivated Sunflower (Helianthus annuus L.). PLoS ONE 2014, 9, e104379. [Google Scholar] [CrossRef] [PubMed]
  42. Dunn, R.E.; Le, T.Y.T.; Stromberg, C.A.E. Light Environment and Epidermal Cell Morphology in Grasses. Int. J. Plant Sci. 2015, 176, 832–847. [Google Scholar] [CrossRef]
  43. Barillot, R.; De Swaef, T.; Combes, D.; Durand, J.L.; Escobar-Gutiérrez, A.J.; Martre, P.; Perrot, C.; Roy, E.; Frak, E. Leaf elongation response to blue light is mediated by stomatal-induced variations in transpiration in Festuca arundinacea. J. Exp. Bot. 2020, 72, 2642–2656. [Google Scholar] [CrossRef]
  44. Drake, P.L.; Froend, R.H.; Franks, P.J. Smaller, faster stomata: Scaling of stomatal size, rate of response, and stomatal conductance. J. Exp. Bot. 2013, 64, 495–505. [Google Scholar] [CrossRef] [PubMed]
  45. Zhang, Y.F.; Chen, C.; Jin, Z.X.; Yang, Z.N.; Li, Y.L. Leaf anatomy, photosynthesis, and chloroplast ultrastructure of Heptacodium miconioides seedlings reveal adaptation to light environment. Environ. Exp. Bot. 2022, 195, 104780. [Google Scholar] [CrossRef]
  46. Roelfsema, M.R.; Hedrich, R. In the light of stomatal opening: New insights into ‘the Watergate’. New Phytol. 2005, 167, 665–691. [Google Scholar] [CrossRef]
  47. Pastenes, C.; Pimentel, P.; Lillo, J. Leaf movements and photoinhibition in relation to water stress in field-grown beans. J. Exp. Bot. 2005, 56, 425–433. [Google Scholar] [CrossRef]
  48. Phookaew, P.; Netrphan, S.; Sojikul, P.; Narangajavana, J. Involvement of miR164-and miR167-mediated target gene expressions in responses to water deficit in cassava. Biol. Plant. 2014, 58, 469–478. [Google Scholar] [CrossRef]
  49. Lin, D.B.; Zhu, X.E.; Qi, B.L.; Gao, Z.; Tian, P.; Li, Z.W.; Lin, Z.T.; Zhang, Y.X.; Huang, T.B. SlMIR164A regulates fruit ripening and quality by controlling SlNAM2 and SlNAM3 in tomato. Plant Biotechnol. J. 2022, 20, 1456–1469. [Google Scholar] [CrossRef]
  50. Chapa-Dubocq, X.; Makarov, V.; Javadov, S. Simple kinetic model of mitochondrial swelling in cardiac cells. J. Cell. Physiol. 2018, 233, 5310–5321. [Google Scholar] [CrossRef] [PubMed]
  51. Rurek, M. Plant mitochondria under a variety of temperature stress conditions. Mitochondrion 2014, 19, 289–294. [Google Scholar] [CrossRef]
  52. Scott, I.; Logan, D.C. Mitochondrial morphology transition is an early indicator of subsequent cell death in Arabidopsis. New Phytol. 2008, 177, 90–101. [Google Scholar] [CrossRef]
  53. Fina, J.; Casadevall, R.; AbdElgawad, H.; Prinsen, E.; Markakis, M.N.; Beemster, G.T.S.; Casati, P. UV-B Inhibits Leaf Growth through Changes in Growth Regulating Factors and Gibberellin Levels. Plant Physiol. 2017, 174, 1110–1126. [Google Scholar] [CrossRef]
  54. IPCC. Electronic Book; World Meteorological Organization: Geneva, Switzerland, 2018. [Google Scholar]
  55. Sharma, S.; Chatterjee, S.; Kataria, S.; Joshi, J.; Datta, S.; Vairale, M.G.; Veer, V. A Review on Responses of Plants to UV-B Radiation Related Stress. UV-B Radiat. 2017, 75–97. [Google Scholar] [CrossRef]
  56. Huang, K.Y.; Liu, Y.R.; Shi, Y.L.; Tian, J.L.; Shi, T.R.; Peng, H.R.; Tian, X.J.; Zhang, W.J.; Wang, K.H. Overexpression of TaMBF1c improves thermo-tolerance of perennial ryegrass. Sci. Hortic. 2022, 295, 110812. [Google Scholar] [CrossRef]
  57. Reyes, T.H.; Pompeiano, A.; Ranieri, A.; Volterrani, M.; Guglielminetti, L.; Scartazza, A. Photosynthetic performance of five cool-season turfgrasses under UV-B exposure. Plant Physiol. Biochem. 2020, 151, 181–187. [Google Scholar] [CrossRef] [PubMed]
  58. Tang, W.; Guo, H.; Baskin, C.C.; Xiong, W.D.; Yang, C.; Li, Z.Y.; Song, H.; Wang, T.R.; Yin, J.N.; Wu, X.L.; et al. Effect of Light Intensity on Morphology, Photosynthesis and Carbon Metabolism of Alfalfa (Medicago sativa) Seedlings. Plants 2022, 11, 1688. [Google Scholar] [CrossRef]
  59. Wimalasekera, R. Effect of Light Intensity on Photosynthesis. In Photosynthesis, Productivity and Environmental Stress; Wiley Online Library: Hoboken, NJ, USA, 2019; pp. 65–73. [Google Scholar]
  60. Murata, N.; Takahashi, S.; Nishiyama, Y.; Allakhverdiev, S.I. Photoinhibition of photosystem II under environmental stress. Biochim. Biophys. Acta (BBA) Bioenerg. 2007, 1767, 414–421. [Google Scholar] [CrossRef] [PubMed]
  61. Huang, W.; Yang, Y.J.; Hu, H.; Zhang, S.B. Seasonal variations in photosystem I compared with photosystem II of three alpine evergreen broad-leaf tree species. J. Photochem. Photobiol. B Biol. 2016, 165, 71–79. [Google Scholar] [CrossRef]
  62. Szymańska, R.; Ślesak, I.; Orzechowska, A.; Kruk, J. Physiological and biochemical responses to high light and temperature stress in plants. Environ. Exp. Bot. 2017, 139, 165–177. [Google Scholar] [CrossRef]
  63. Alscher, R.G.; Erturk, N.; Heath, L.S. Role of superoxide dismutases (SODs) in controlling oxidative stress in plants. J. Exp. Bot. 2002, 53, 1331–1341. [Google Scholar] [CrossRef]
  64. Zhu, H.F.; Li, X.F.; Zhai, W.; Liu, Y.; Gao, Q.Q.; Liu, J.P.; Ren, L.; Chen, H.Y.; Zhu, Y.Y. Effects of low light on photosynthetic properties, antioxidant enzyme activity, and anthocyanin accumulation in purple pak-choi (Brassica campestris ssp. Chinensis Makino). PLoS ONE 2017, 12, e0179305. [Google Scholar] [CrossRef]
  65. Lu, X.; Dun, H.; Lian, C.; Zhang, X.; Yin, W.; Xia, X. The role of peu-miR164 and its target PeNAC genes in response to abiotic stress in Populus euphratica. Plant Physiol. Biochem. 2017, 115, 418–438. [Google Scholar] [CrossRef]
  66. Tsai, W.A.; Sung, P.H.; Kuo, Y.W.; Chen, M.C.; Jeng, S.T.; Lin, J.S. Involvement of microRNA164 in responses to heat stress in Arabidopsis. Plant Sci. 2023, 329, 111598. [Google Scholar] [CrossRef] [PubMed]
  67. Brooker, R.; Brown, L.K.; George, T.S.; Pakeman, R.J.; Palmer, S.; Ramsay, L.; Schoeb, C.; Schurch, N.; Wilkinson, M.J. Active and adaptive plasticity in a changing climate. Trends Plant Sci. 2022, 27, 717–728. [Google Scholar] [CrossRef] [PubMed]
  68. Matesanz, S.; Milla, R. Differential plasticity to water and nutrients between crops and their wild progenitors. Environ. Exp. Bot. 2018, 145, 54–63. [Google Scholar] [CrossRef]
Figure 1. OE164, NAC60, MIM164, and WT perennial ryegrass plants under full sun (A) and shade (B) conditions in the field. (CE) Chlorophyll a, b, and carotenoid contents of the OsmiR164a overexpression (OE164), target mimicry OsmiR164a (MIM164) transgenic and wild-type (WT) plants. (F) Grass quality of OE164, NAC60 (CRES-T OsNAC60), MIM164, and WT plants. Different letters indicate statistical differences (p < 0.05).
Agronomy 14 01142 g001
Figure 2. Scanning electron microscopy (SEM) analysis of leaf surface of OE164, MIM164, and WT perennial ryegrass plants in full sun and shade conditions in the field. (AF) Representative SEM images of leaf epidermal cells, the red circle represented siliceous papillae. (GL) Representative SEM images of leaf stomata. (M) Leaf cell length. (N) Leaf stomata length. Different letters indicate statistical differences (p < 0.05).
Agronomy 14 01142 g002
Figure 3. Transmission electron microscopy (TEM) observation of leaf cells of OE164, WT, and MIM164 perennial ryegrass plants in shade (AI) and full sun (JR) conditions in the field. The red circle, arrow, and rectangle indicated starch grains in chloroplast, mitochondria, and peroxisomes, respectively.
Agronomy 14 01142 g003
Figure 4. Morphology of OE164, MIM164, NAC60, and WT perennial ryegrass plants under different light intensities in growth chamber: (A,D) plants under low light; (B,E) plants under medium light; (C,F) plants under high light. Different letters indicate statistical differences (p < 0.05).
Agronomy 14 01142 g004
Figure 5. Leaf characteristics of OE164, MIM164, NAC60, and WT perennial ryegrass plants under different light intensities in growth chamber: (A,D), plants under low light; (B,E) plants under medium light; (C,F) plants under high light. Different letters indicate statistical differences (p < 0.05).
Agronomy 14 01142 g005
Figure 6. Effects of light intensity on leaf maximum ((A), Fv/Fm) and effective ((B), Y(II)) photochemical quantum yields of PS II, SPAD index (C), and superoxide dismutase ((D), SOD) activity in OE164, MIM164, NAC60, and WT perennial ryegrass plants. Different letters indicate statistical differences (p < 0.05).
Agronomy 14 01142 g006
Disclaimer/Publisher’s Note: The statements, opinions and data contained in all publications are solely those of the individual author(s) and contributor(s) and not of MDPI and/or the editor(s). MDPI and/or the editor(s) disclaim responsibility for any injury to people or property resulting from any ideas, methods, instructions or products referred to in the content.

