Article

Analysis of the Factors Affecting the Deposition Coverage of Air-Assisted Electrostatic Spray on Tomato Leaves

1
Key Laboratory of Plant Protection Engineering of Ministry of Agriculture and Rural Affairs, Jiangsu University, Zhenjiang 212013, China
2
Key Laboratory of Modern Agricultural Equipment and Technology, Ministry of Education, Jiangsu University, Zhenjiang 212013, China
*
Author to whom correspondence should be addressed.
Agronomy 2024, 14(6), 1108; https://doi.org/10.3390/agronomy14061108
Submission received: 22 April 2024 / Revised: 11 May 2024 / Accepted: 22 May 2024 / Published: 23 May 2024
(This article belongs to the Special Issue In-Field Detection and Monitoring Technology in Precision Agriculture)

Abstract

:
In order to investigate the effects of various factors (charging voltage, spray distance and spray pattern) on the deposition coverage of tomato leaves, the Box–Behnken surface response methodology was used to design an outdoor air-assisted electrostatic spraying experiment with three factors and three levels. The deposition coverage of tomato leaves in the upper, middle and lower layers was collected under different polarity charging voltages (0, +10 kV, −10 kV), spray distances (1, 3, 5 m) and spray patterns (ascending spray, descending spray, fixed height spray). Regression analysis and variance analysis were performed on the experimental data to determine the optimal working parameters. The results showed that (1) spray distance is the most important factor affecting the droplet coverage rate in the process of air-assisted electrostatic spraying; (2) the droplet coverage rate of air-assisted electrostatic spraying is optimal when the charging voltage polarity is negative voltage, the spray distance is 2.75 m, and the spray pattern is descending spray. The following conclusions were obtained. (1) In air-assisted electrostatic spraying, the distribution of air flow had the greatest effect on droplet deposition on tomato leaf surface. (2) Compared with air-assisted non-electrostatic spray, air-assisted electrostatic spray had a better deposition effect.

1. Introduction

A greenhouse environment has the characteristics of high temperature and humidity, lack of natural enemies of pests, high planting density of crops and so on. It is easily affected by pests and diseases in the actual production process [1,2]. Due to the intensive planting of greenhouse crops, there are many problems in the greenhouse application environment, such as narrow crop rows and dense canopy. This makes it difficult for traditional manual sprayers and backpack sprayers to effectively deposit pesticide solution on the surface of the middle and lower leaves of crops during application, and it also increases the health risks for its operators [3,4,5]. In order to cope with the complex working environment, more and more efficient spraying technologies have been put into use, including air-assisted spraying technology, electrostatic spraying technology, air-assisted electrostatic spraying technology, etc. [6,7,8].
Air-assisted spraying technology refers to the plant protection machinery in the process of spraying crops through the fan generated by the airflow field; the droplets are transported to the target position and deposited on the target crop surface. In the airflow field, crop leaves will also be disturbed by the airflow field, which improves the droplet deposition amount, penetration and deposition uniformity on the back of leaves and inside the canopy [6,9,10,11]. In air-assisted spraying, the main factors affecting droplet deposition on crop leaf surface are air velocity, spray distance, moving speed of spraying platform, etc. [12,13].
Electrostatic spraying is a spraying technique that charges droplets. When the charged droplet cloud composed of many charged droplets approaches the plant leaves, an induced electric field will be formed around the target leaves, so that the charged droplets will be affected by the electric field force near the target leaves, and the status quo of “electrostatic deflection and circling” will appear, thus reducing the droplet drift and improving the deposition of charged droplets on the target leaves [14,15]. In electrostatic spraying, the main factors affecting droplet deposition on crop leaf surface are charging voltage, spraying pressure, spraying height, droplet size, etc. [16,17,18].
Air-assisted electrostatic spraying technology combines the advantages of air-assisted spraying technology and electrostatic spraying technology, which can effectively improve the droplet deposition coverage of spray distance. In addition, air-assisted electrostatic spraying technology also inherits many factors that can affect the deposition effect of air-assisted spray and electrostatic spray. These influencing factors mainly include charged voltage, spray distance, spray pattern, air velocity and spray pressure [19,20,21].
At present, there are few studies on the influence of air-assisted electrostatic spraying platform dynamics on droplet deposition coverage, and the related studies are not comprehensive. Dai et al. examined the effects of spray pressure, air pressure and applied voltage on droplet size and charge-to-mass ratio [19]. Neto et al. compared the effects of different spray volumes and charges on spray deposition [20]. Zampiroli et al. evaluated the control effect of different spray rates and different nozzles [21]. These studies mainly compared the different spray pressures, different air pressures, different types of nozzles, charge sizes and other factors in the spray deposition effect. There are few studies on the polarity of charging voltage and the spray pattern of the sprayer.
In this paper, the effects of different polarity charging voltages (0, +10 kV, −10 kV), spray distances (1, 3, 5 m) and spray patterns (ascending spray, descending spray, fixed height spray) on droplet deposition coverage on the upper, middle and lower tomato leaves were investigated by using the greenhouse single-rail air-assisted sprayer [22] developed by Jiangsu University. Three regression equations were obtained between the polarity charge voltage, spray distance, spray pattern and droplet deposition coverage on tomato leaves in each layer. The purpose of this study was to explore the charging voltage polarity and spray pattern suitable for this air-assisted electrostatic sprayer. And it provided a reference for greenhouse air-assisted electrostatic sprayer application.

2. Materials and Methods

2.1. Equipment

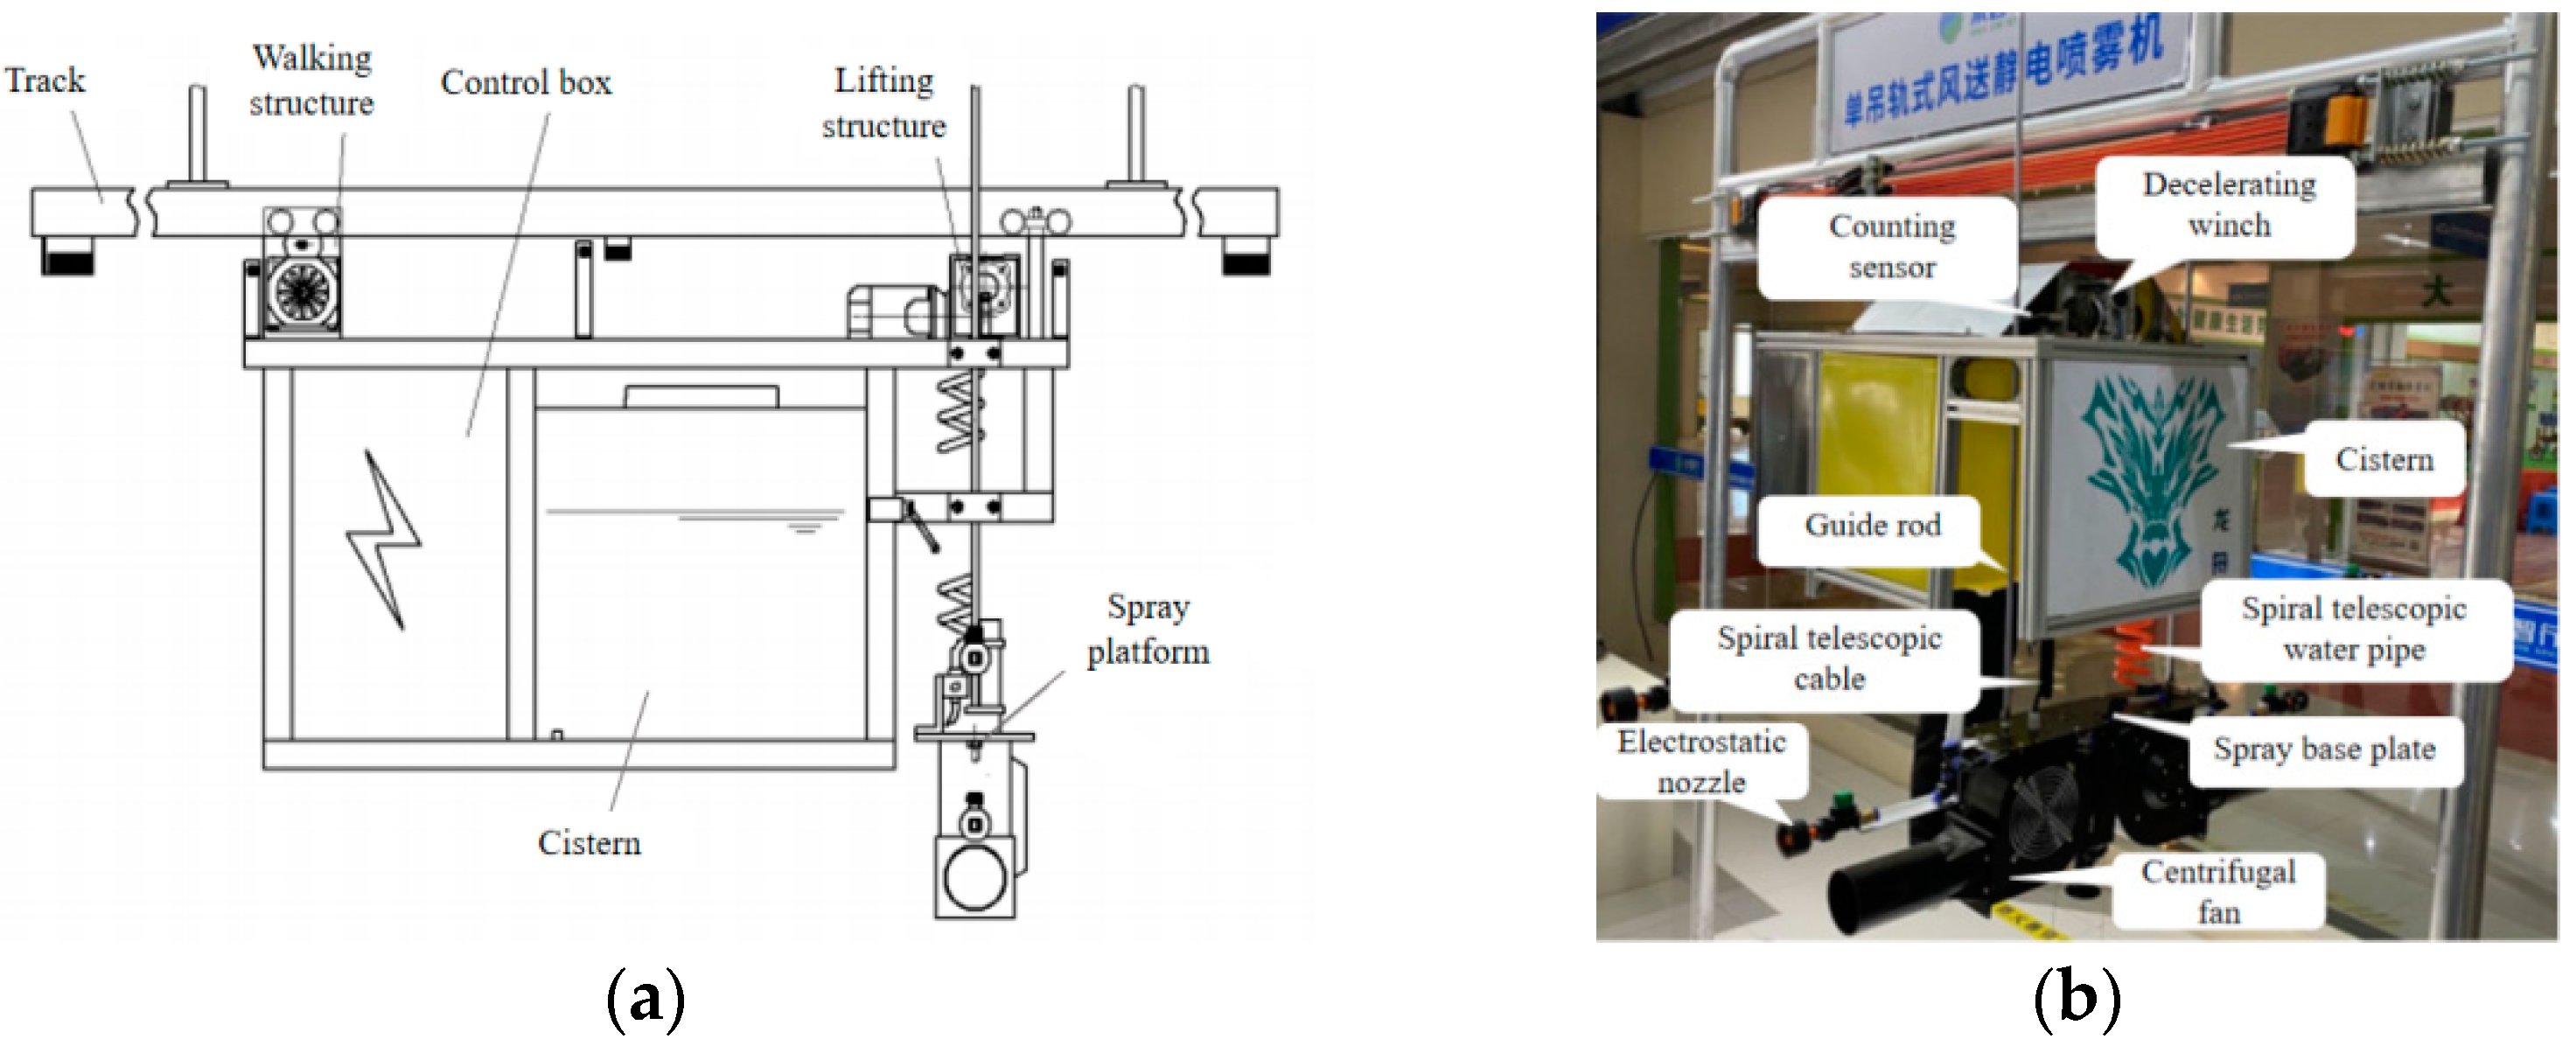
The greenhouse single-rail air-assisted electrostatic sprayer used in this experiment was developed by Jiangsu University. Its main structure consists of a control box, cistern, lifting structure, spraying platform, walking structure and track. There is a rotary atomizer in the middle of the spray platform for spraying the area directly below the machine location. However, since the test does not involve walking spray and does not measure the spray effect in the area directly below the spray platform, the function and effect of the walking mechanism and rotary atomizer are not described too much. The structure of the sprayer is shown in Figure 1.
The lifting structure of the sprayer is mainly composed of a single-phase AC motor, winch wheel, worm reducer and guide rod. Two winch wheels are, respectively, fixed at two ends of the worm reducer, and the lifting movement of the spraying device is realized by winding and retracting the steel rope. The lifting motor configuration has a brake function and can realize the lifting function of power failure that is stopped. In addition, the worm reducer also has a self-locking function to ensure that the rising speed is consistent with the falling speed.
The spray platform consists of two centrifugal fans (YWL 2E-150, Hangda Electric Co., China) and four electrostatic flat-fan nozzles (FVP 110-02, HYPRO Manufacturer Co., USA). The two fans and four electrostatic flat-fan nozzles are symmetrically fixed on two sides of the bottom plate of the spraying device, respectively, so that the spraying device can simultaneously apply pesticide to crops in two directions. The electrostatic nozzle is fixed above the air outlet of the fan, so that the droplets have sufficient charging time. The spray angle of the electrostatic nozzle is 110°, and inductive charging is adopted. Its main operating parameters are shown in Table 1.

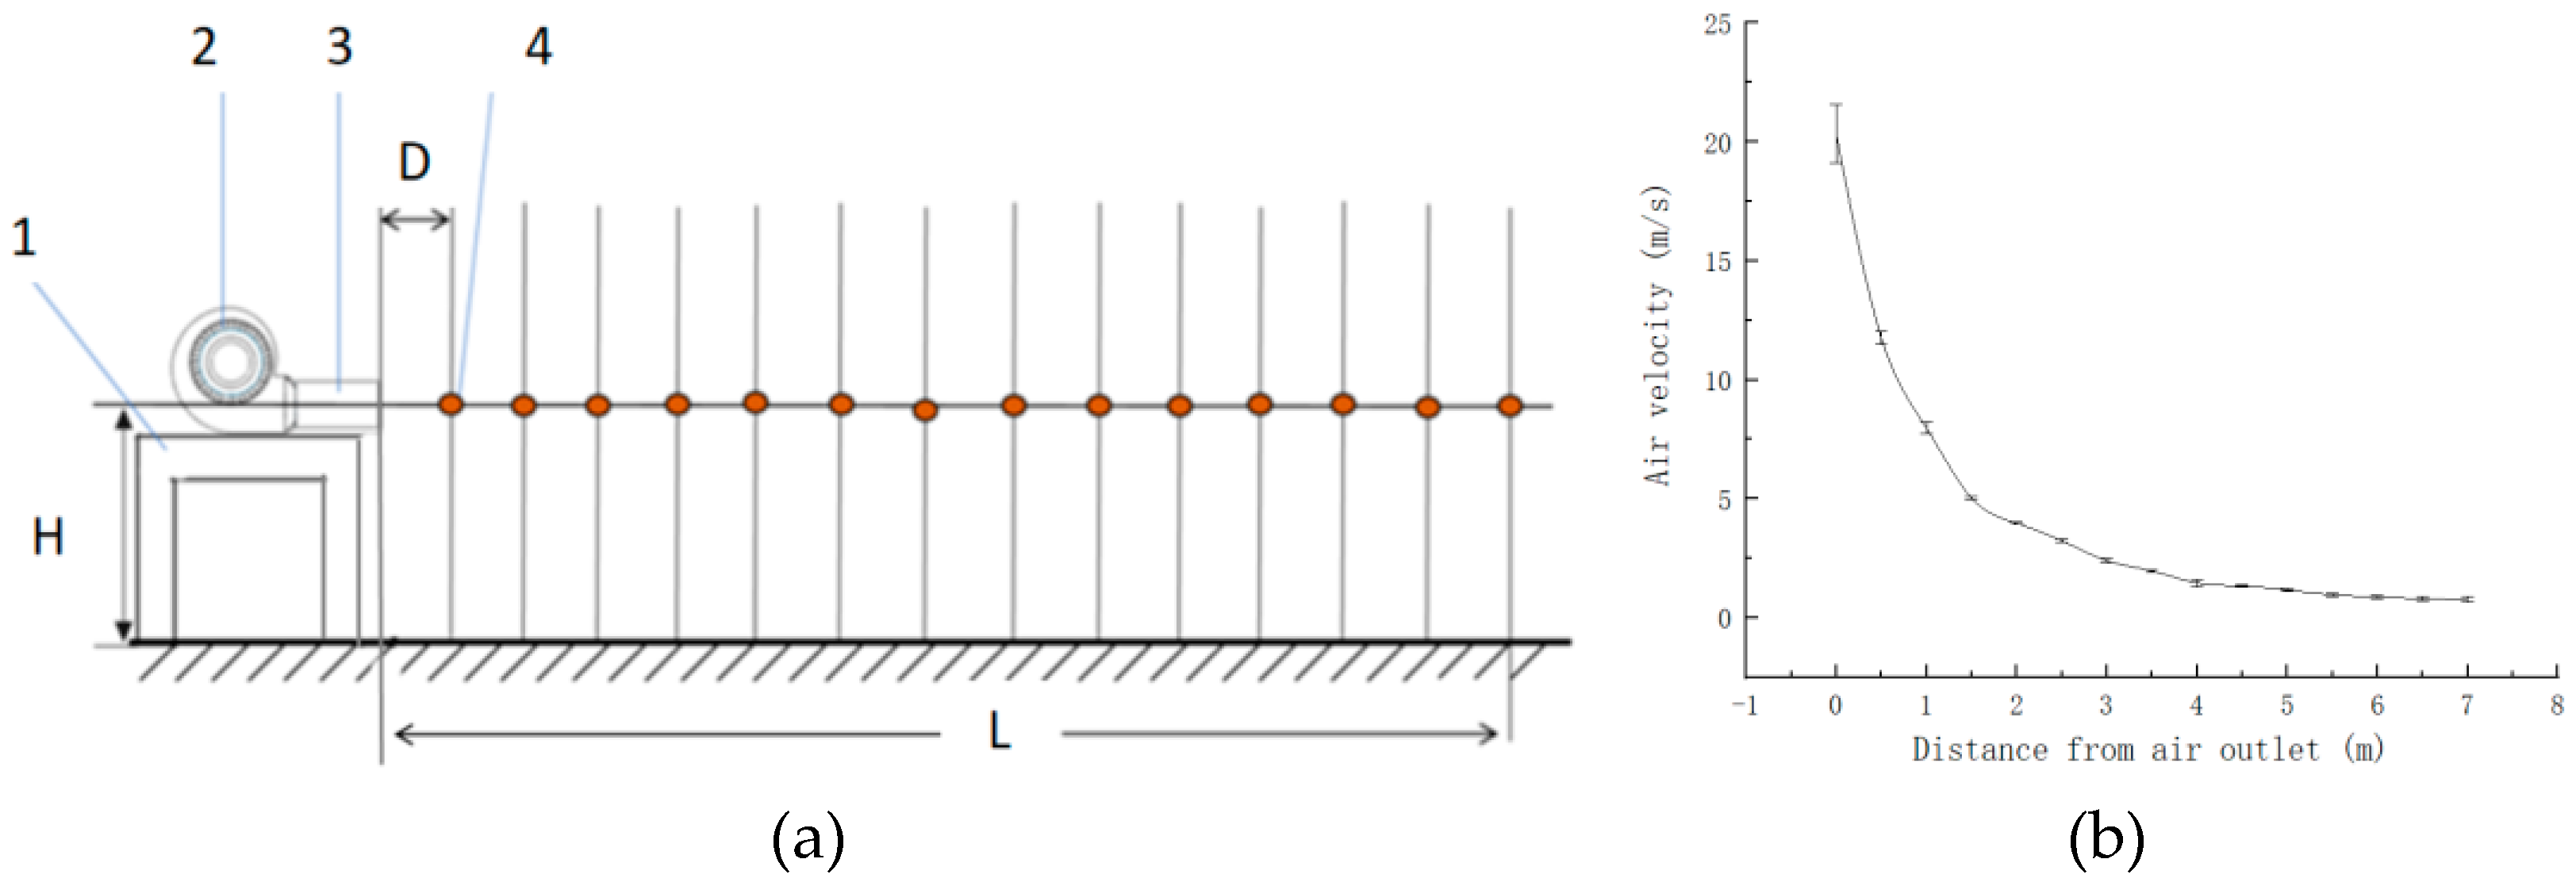
2.2. Air Velocity Measurement Test

In order to understand the variation in air velocity during spraying, the air velocity along the axis of the centrifugal fan outlet was measured. The test was conducted in a corridor at Jiangsu University with a length of 10 m, a width of 2 m and a height of 3 m. The test was measured by a handheld anemometer, and the wind speed change within the range of 0–7 m from the air outlet in the axis direction of the air outlet was measured. The measurement point interval was 0.5 m (Figure 2a). The test results are shown in Figure 2b.
According to the curve of air velocity change in Figure 2b, the attenuation of air velocity is faster in the range of 0–3 m, and the attenuation of air velocity is gentle in the range of 3–7 m.

2.3. Deposition Test Arrangement

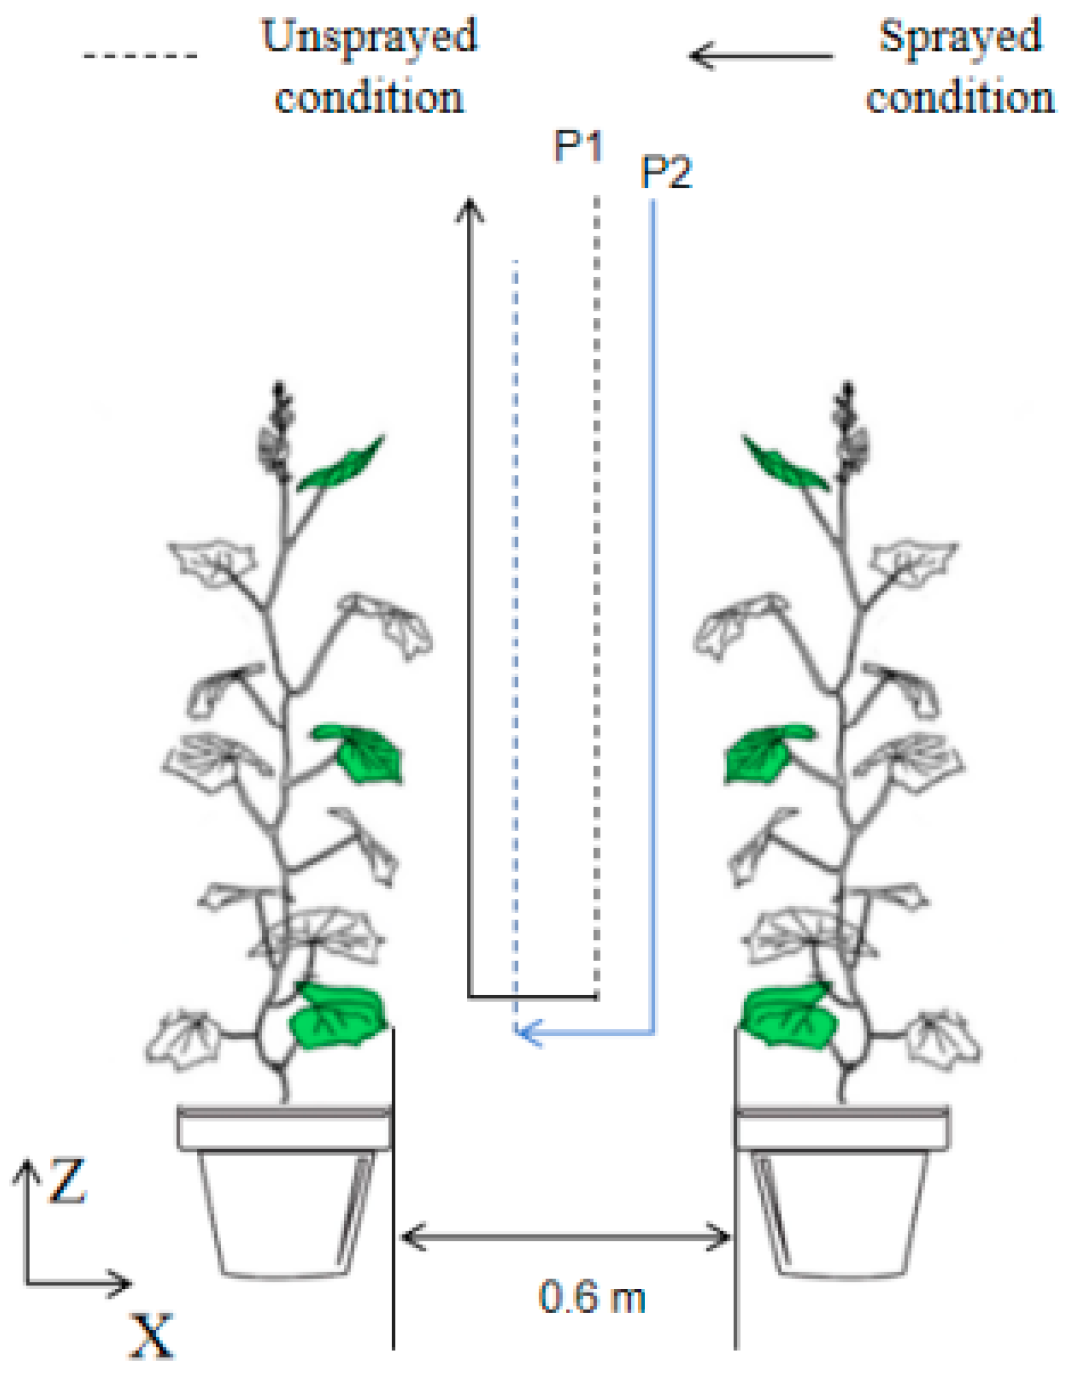
The application scenario of the greenhouse single-rail air-assisted electrostatic sprayer is a solar greenhouse in Shouguang City, Shandong Province. The main crops planted in the solar greenhouse are tomato, eggplant, cucumber and other crops, which are planted in the close planting mode. The ridge distance between two rows of crops is 1.2 m; the canopy distance of mature crops is approximately 0.6 m; and the length of single crops is approximately 12 m. The greenhouse single-rail air-assisted electrostatic sprayer is hung on the greenhouse beam through the rail and suspended above the crop canopy. During spraying, the sprayer moves to the middle of two rows of crops and sprays with the aid of the lifting structure.
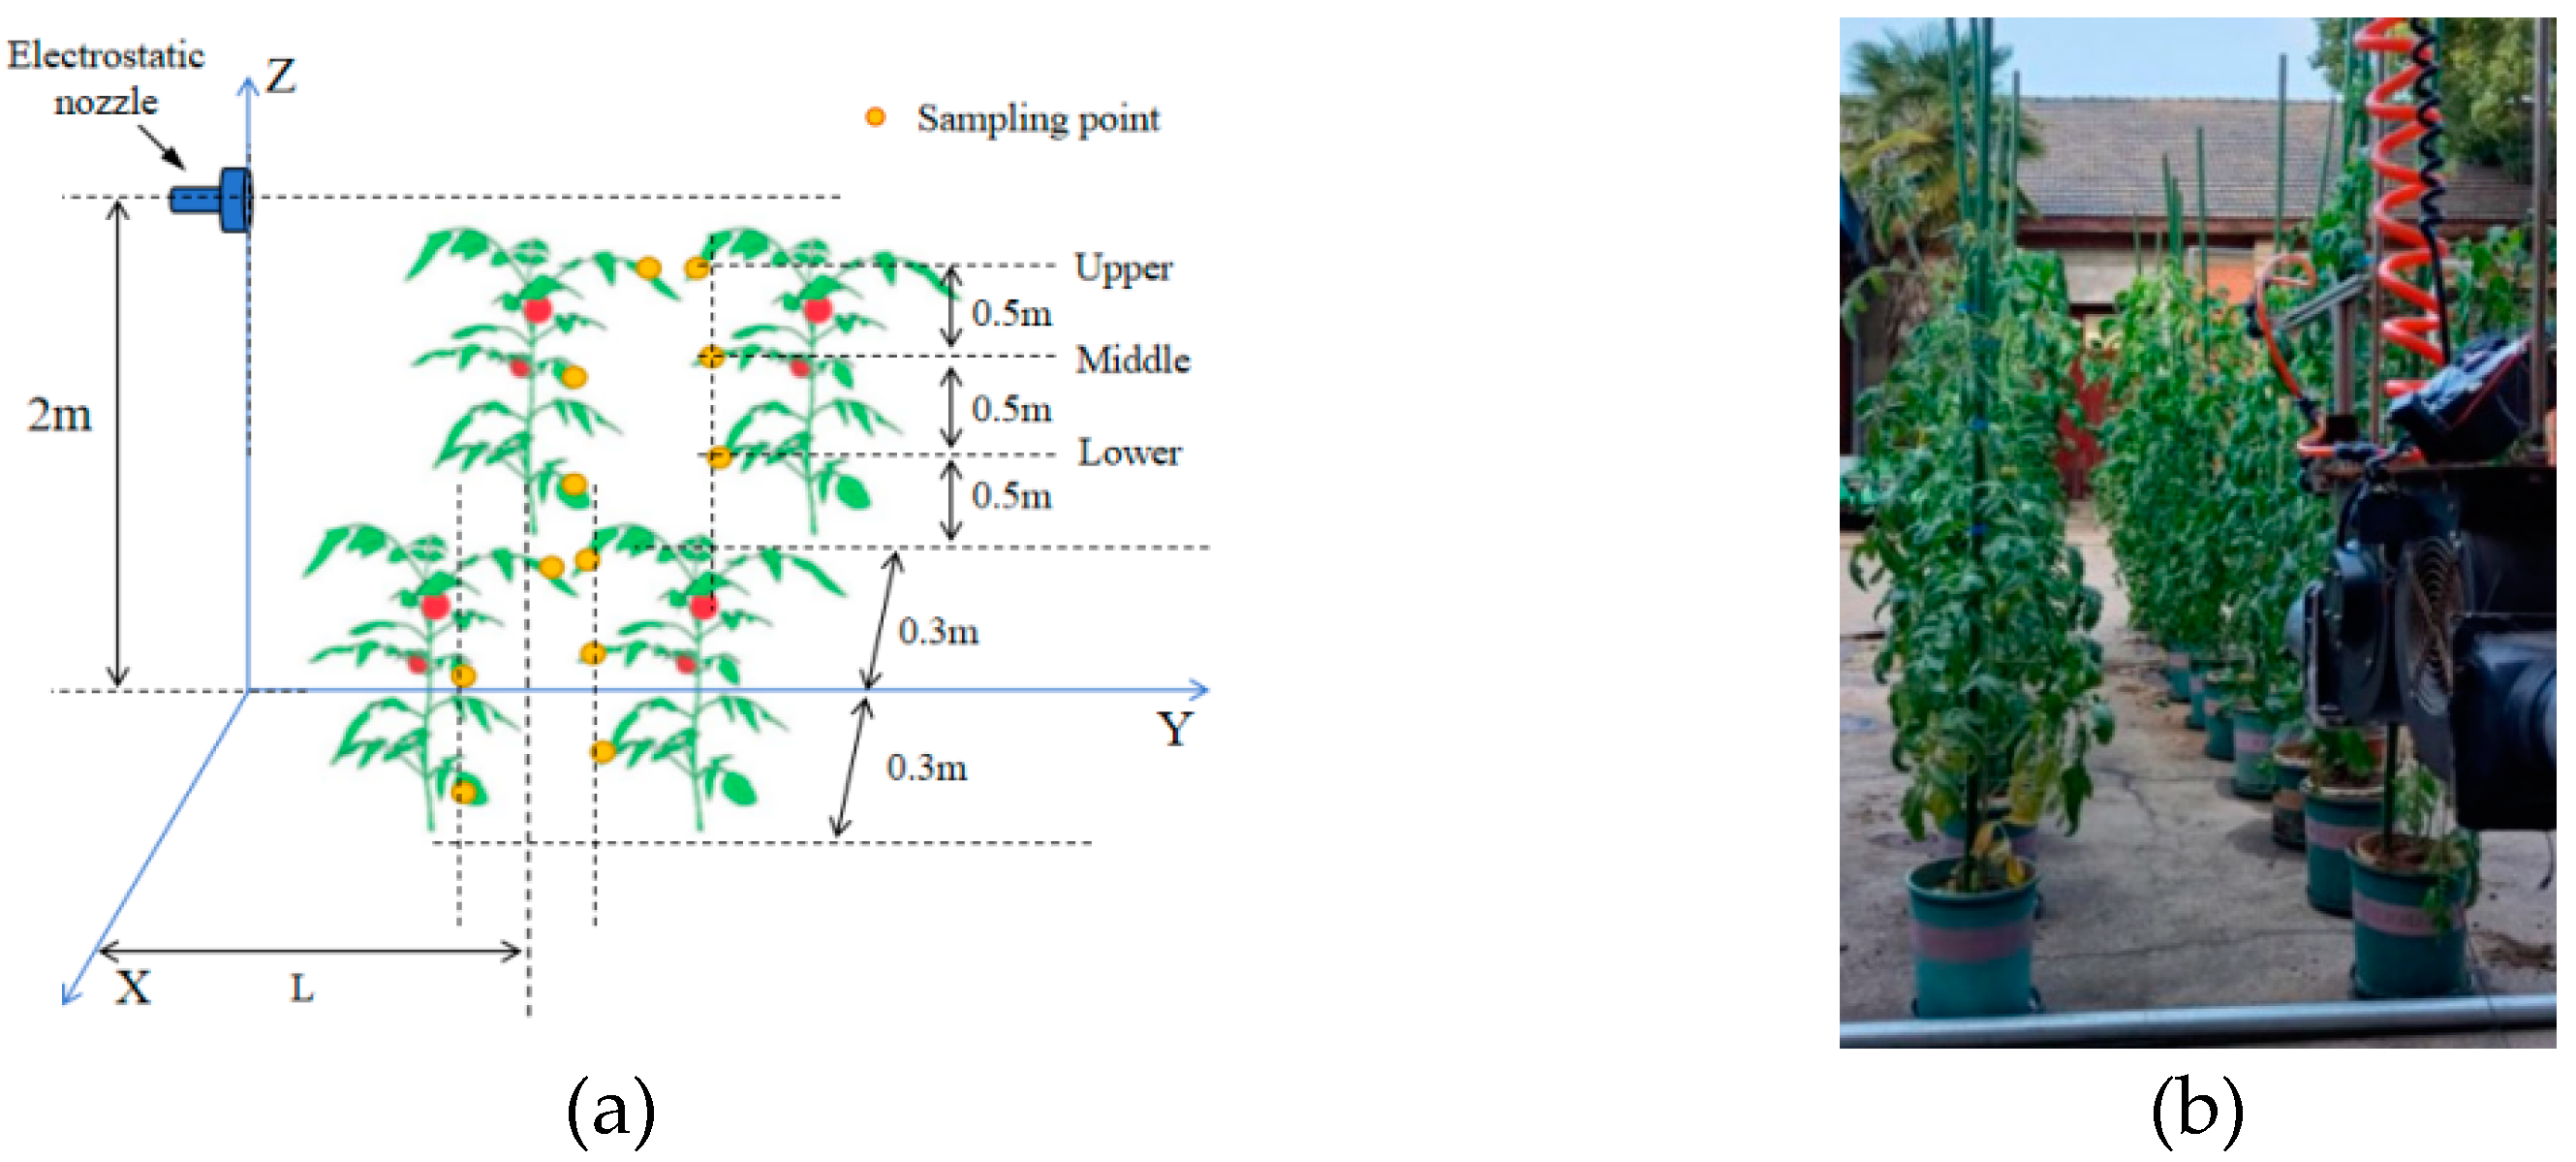
The experiment was carried out in Jiangsu University agricultural machinery compound using the greenhouse single-rail air-assisted electrostatic sprayer. The tomato crops used in the experiment were potted tomatoes planted in a self-built small greenhouse. In the experiment, the placement method was intended to simulate the planting method in the Shouguang greenhouse, as shown in Figure 3.
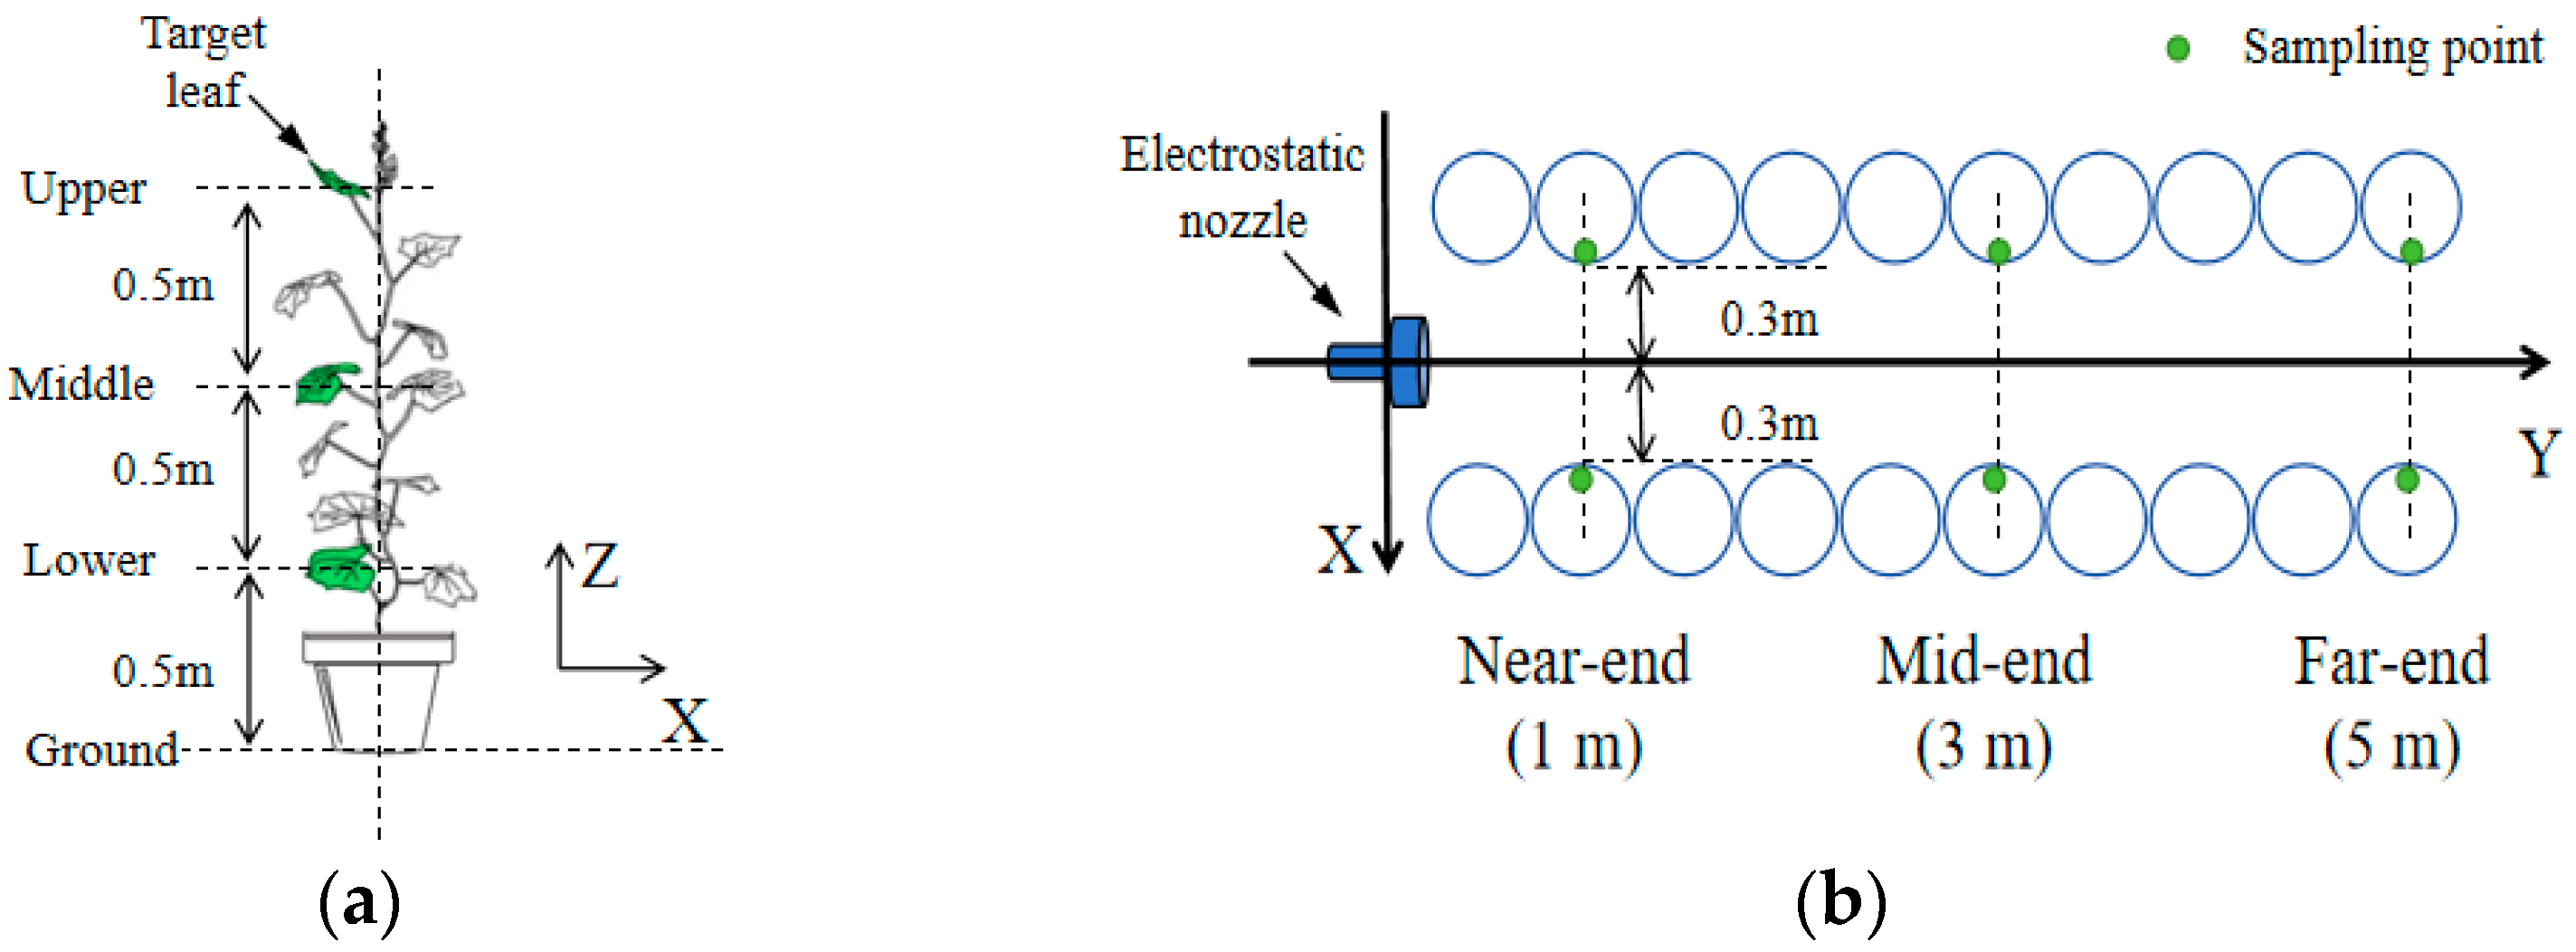
In the greenhouse spraying operation in Shouguang, the crops in the working scene of the greenhouse single-rail air-assisted electrostatic sprayer are located at both ends of the machine horizontal direction (Y axis direction) and have certain symmetry; therefore, the tomato leaves at one end are selected to arrange the sampling points. In order to reflect the law of droplet deposition on the surface of each layer of tomato leaves, the sampling points are divided into upper, middle and lower layers from the height direction (Z axis direction); each layer is 0.5 m apart, and the upper tomato leaves are approximately 1.5 m above the ground (Z axis direction). And from the horizontal distance direction (Y axis direction), they are divided into near-end, mid-end and far-end. The distance is 2 m, and the distance between the near-end and the air outlet in the horizontal direction is 1 m. The sampling point layout is shown in Figure 4.
During the test, the outdoor temperature was 27 °C, the humidity was 44%, and there was no wind.

2.4. Experimental Factors

There are many factors affecting the droplet deposition coverage of air-assisted electrostatic spray on tomato leaf surface, including but not limited to the charging voltage polarity, spray distance, spray pattern, spray height, spray angle size and target characteristics. The three factors selected in this experiment are the charging voltage polarity, spray distance and spray pattern, and the other conditions remain the same. In order to facilitate the subsequent data processing and calculation, X1 represents the charging voltage polarity; X2 represents the spray distance; X3 represents the spray pattern; Y1 represents the droplet deposition coverage on the upper tomato leaf surface; Y2 represents the droplet deposition coverage on the middle tomato leaf surface; and Y3 represents the droplet deposition coverage on the lower tomato leaf surface. X1, X2 and X3 are the independent variables; Y1, Y2 and Y3 are the dependent variables; and droplet deposition coverage is used as an evaluation index. The factor levels tested are shown in Table 2.
Among them, the spray patterns are divided into ascending spray, fixed height spray and descending spray, and the ascending velocity direction of the ascending spray is taken as the positive direction; therefore, the ascending spray velocity is +0.3 m/s, the fixed height spray velocity is 0, and the descending spray velocity is −0.3 m/s (Figure 5).
Ascending spraying: spray for 3 s from 0.5 m above the ground (Z axis direction), then rise at +0.3 m/s and spray at the same time. When the spraying platform rises to 2 m above the ground, it stops rising and continues spraying for 2 s before stopping the application operation. The time required for rising is 5 s.
Descending spraying: spray for 3 s from 2 m above the ground (Z axis direction), then descend at −0.3 m/s and spray at the same time. When the spraying platform descends to a height of 0.5 m above the ground, it stops descending and continues spraying for 2 s before stopping the application operation. The descending time is 5 s.
Fixed height spray: spray continuously for 10 s at a position 2 m away from the ground (Z axis direction).
In order to determine the optimum spray parameter combination of air-assisted electrostatic spray, response surface methodology was used to design the experiments. The Box–Behnken orthogonal test method was used to select the test groups. And the Develve software (Version 4.16) was used to generate the test schemes. A total of 17 groups of tests were obtained, as shown in Table 3.

2.5. Data Processing and Analysis

In this test, droplets were collected using a 15 mm × 20 mm white paper card. Before each experiment, white paper cards were fixed on the target leaves of tomato plants with paper clips as droplet collection devices. In order to observe the effect of droplet deposition, carmine solution with a concentration of 5 g/L was used for spraying. In order to ensure that the test data are not contaminated by other factors, at the end of each test, the white paper card needs to be dried and stored separately in a sound self-sealing plastic bag.
At the end of the test, the white paper card used to collect droplets was brought back to the laboratory. For the collected white paper card, the following steps need to be performed: (1) Scan one by one with a scanner into digitized .jpg format files; (2) Adjust image digits; (3) Binarization; (4) Adjust threshold; (5) The droplet deposition coverage is obtained by the software Depositscan (Version 1.2) [23] (Figure 6).
In this paper, the droplet deposition coverage rate on the surface of each layer leaf was used as an evaluation index. Generally speaking, the larger the droplet deposition coverage rate on the tomato leaf surface, the better the spray effect.
X ¯ = j = 1 m X j n 1
where X ¯ is the sample mean; X j is the droplet deposition coverage rate on each white paper card; n is the total number of droplet collection cards at a certain position.

3. Results

The test was designed using response surface methodology, and the final test results are shown in Table 4. X1 represents the charging voltage polarity; X2 represents the spray distance; X3 represents the spray pattern; Y1 represents the droplet deposition coverage on the upper tomato leaf surface; Y2 represents the droplet deposition coverage on the middle tomato leaf surface; and Y3 represents the droplet deposition coverage on the lower tomato leaf surface.
The test data in Table 4 were imported into the Develve software (Version 4.16), and the test data were further processed by the Develve software. The response relationship between air-assisted electrostatic spray parameters and droplet deposition coverage on the surface of upper, middle and lower tomato leaves was obtained using regression analysis, and the droplet deposition coverage on the surface of upper, middle and lower tomato leaves was established based on the charging voltage polarity, spray distance and spray pattern. A quadratic polynomial regression model for the dynamic response relationship of spray platforms was constructed, the regression equations of which are shown in Equations (2)–(4):
Y 1 = 10.57 0.16   X 1 + 4.40   X 2 + 0.45   X 3 + 0.0429   X 1 X 2 + 0.2808   X 1 X 3   3.6575 × 10 16   X 2 X 3 + 1.37   X 1 2 4.47   X 2 2 3.52   X 3 2
Y 2 = 0.46 0.10   X 1 + 6.46   X 2 3.58   X 3 + 0.0116   X 1 X 2 + 0.5058   X 1 X 3   0.0458   X 2 X 3 + 0.02   X 1 2 1.36   X 2 2 + 28.92   X 3 2
Y 3 = 5.26 0.04   X 1 + 5.39   X 2 + 0.70   X 3 0.0029   X 1 X 2 + 2.1925   X 1 X 3   0.4000   X 2 X 3 + 0.04   X 1 2 1.01   X 2 2 + 53.56   X 3 2
According to the test results recorded in Table 4, the regression model variance analysis tables of droplet deposition coverage on the upper, middle and lower tomato leaf surfaces can be obtained through further calculation, and the results are shown in Table 5, Table 6 and Table 7.
Based on the observation of Table 5, Table 6 and Table 7, it can be seen that the p-values of the three regression models are all less than 0.01, and the values of the respective lack of fit terms are all greater than 0.05, which indicates that the three models are suitable and significant. At the same time, for the determination coefficient R2 of the three regression equations, the closer the calculation result of R2 is to 1, the better the fitting degree and the greater the correlation. After optimizing the three models Y1, Y2 and Y3, the coefficient of determination R2 of Y1 is 94.37%; the coefficient of determination R2 of Y2 is 90.16%; and the coefficient of determination R2 of Y3 is 97.86%. All three coefficients of determination R2 are greater than 90%, indicating that the model can explain more than 90% of the variation in response values. To sum up, the three regression models established by this test data can predict and analyze the test indicators.

4. Discussion

4.1. Analysis of Droplet Deposition Coverage

By comparing the F-value (the larger the F-value, the greater the influence of this factor on the response variable) and the p-value (the smaller the p-value, the more significant the influence of this factor on the response variable) in Table 5, it can be seen that among the three factors X1, X2 and X3, the order of their influence on Y1 is X2 > X1 > X3.
By comparing the F-value and p-value in Table 6, it can be seen that among the three factors X1, X2 and X3, the order of influence on Y2 is X2 > X3 > X1.
By comparing the F-value and p-value in Table 7, it can be seen that among the three factors X1, X2 and X3, the order of influence on Y3 is X2 > X1 > X3.
Figure 7a is a curve plot of the interaction of X1 and X2 on Y1 when the spray platform sprays at a fixed height. From the point of view of X1, electrostatic spray is better than non-electrostatic spray in droplet deposition. This is because of the electrostatic force, which means that charged droplets in the vicinity of tomato leaves occur as an “electrostatic circle or deflection” phenomenon, and then, charged droplets become attached to the surface of tomato leaves.
Figure 7b is a curve plot of the interaction of X2 and X3 on Y2 in the case of air-assisted non-electrostatic spray. Analyzed from the angle of X3, Y2 is minimum when fixed height spray is employed. However, Y2 changes little under three spray patterns. This indicates that the effect of X3 on Y2 is not significant for the air-assisted non-electrostatic spray. Comparing the Y2 of ascending spray with the Y2 of descending spray, it can be seen that the Y2 of ascending spray is lower than the Y2 of descending spray. Therefore, for this type of greenhouse single-rail air-assisted electrostatic sprayer, the droplet deposition coverage on the surface of tomato leaves in the middle layer is descending spray > ascending spray > fixed height spray.
Figure 7c shows the interaction of X1 and X2 on Y3 when the spray platform sprays at a fixed height. With the increase in X1, Y3 first decreases and then increases, and the variation range is obvious. The main reason is that, at a fixed spray height, the lower leaf is less affected by the air flow, and electrostatic force becomes the main force. Therefore, the Y3 of air-assisted electrostatic spray is larger than the Y3 of non-electrostatic spray.
By observing the response curves of Y1, Y2 and Y3 with respect to spray distance X2 in Figure 7a–c, it can be seen that Y1, Y2 and Y3 all first increase and then decrease as X2 increases. This indicated that the droplet deposition coverage on the upper, middle and lower tomato leaves in the mid-end position was higher than that in the near-end and far-end positions of the air-assisted electrostatic spray. This phenomenon is observed because (1) the wind speed at the near-end (1 m) is relatively high, and a large number of droplets are carried by the air flow, and it is difficult to deposit them on the surface of the proximal leaf; (2) the wind speed at the far-end (5 m) is relatively low, and it is difficult to effectively transport droplets to the far-end, and a large number of droplets are deposited on the surface of the mid-end leaf in the process of transportation, resulting in the generally low droplet deposition coverage on the surface of the far-end leaf.

4.2. Model Validation

In order to determine the optimal parameters for X1, X2 and X3, Y1, Y2 and Y3 were taken as the maximum optimization targets, and parameter optimization was carried out with the help of the Develve software. A model of droplet deposition coverage on the upper, middle and lower leaves of the tomato plant was established with the parameter ranges of X1, X2 and X3 as constraints. The model is
max Y 1 = f ( X 1 , X 2 , X 3 )
max Y 2 = f ( X 1 , X 2 , X 3 )
max Y 3 = f ( X 1 , X 2 , X 3 )
where
X 1 [ 10 , + 10 ] , X 2 [ 1 , 5 ] , X 3 [ 0.3 , + 0.3 ]
According to the above model and requirements, when X1 is negative voltage, X2 is 2.23 m, and X3 is descending spray, Y1, Y2 and Y3 reach the maximum. At this time, the predicted value of Y1 is 14.0386%; the predicted value of Y2 is 16.3669%; and the predicted value of Y3 is 17.5975%. In order to verify the validity of the model, relevant experiments were carried out according to the optimized spray parameters, and the experiments were repeated three times. Considering that it is difficult to set the decimal place of equipment parameters during the test, the optimized parameters are slightly corrected: X1 = −10 kV, X2 = 2.75 m, X3 = −0.3 m/s. Under these parameters, descending air-assisted electrostatic spraying operation was carried out, and the test results are shown in Table 8.
Based on the data in Table 8, it can be seen that the relative error between the experimental value and the predicted value of the model is less than 13% for the deposition coverage on the upper, middle and lower tomato leaf surfaces. This indicates that the model is valid.

5. Conclusions

Based on the analysis of the test results, the following conclusions can be drawn:
(1)
In air-assisted electrostatic spraying, the distribution of air flow had the greatest effect on droplet deposition on tomato leaf surface.
(2)
Compared with air-assisted non-electrostatic spray, air-assisted electrostatic spray had a better deposition effect.

Author Contributions

Methodology, J.G.; Validation, J.G.; Resources, B.Q.; Data curation, J.G.; Writing—original draft, J.G.; Writing—review & editing, J.G., X.D. and B.Q.; Supervision, X.D. and B.Q. All authors have read and agreed to the published version of the manuscript.

Funding

This research was funded by Jiangsu University, A Project Funded by the Priority Academic Program Development of Jiangsu Higher Education Institutions (No. PAPD2023-87).

Data Availability Statement

Data are contained within the article.

Conflicts of Interest

The Develve software used in this document complies with the regulations governing the use of non-commercial versions of the software. The following are the relevant regulations: non-commercial use. We anticipate that non-commercial use will primarily involve students and teachers who may wish to use Develve at home and in school for the purposes of their school or academic study and teaching, without intending to seek any commercial advantage or financial gain.

References

  1. Guo, N.; Guan, X.S.; Xu, H.; Tian, S.; Li, T. Design and Experiment of Automatic Sprayer for High-wire Cultivation Plants in Solar Greenhouse. J. Shenyang Agric. Univ. 2021, 52, 435–441. [Google Scholar]
  2. Kumar, N.; Upadhyay, G.; Choudhary, S.; Patel, B.; Naresh; Chhokar, R.S. Resource conserving mechanization technologies for dryland agriculture. In Enhancing Resilience of Dryland Agriculture under Changing Climate: Interdisciplinary and Convergence Approaches; Springer Nature: Singapore, 2023; pp. 657–688. [Google Scholar]
  3. Pascuzzi, S.; Cerruto, E. Spray deposition in “tendone” vineyards when using a pneumatic electrostatic sprayer. Crop Prot. 2015, 68, 1–11. [Google Scholar] [CrossRef]
  4. Vujčić, B.; Tadić, V.; Marković, M.; Lukinac-Čačić, J.; Stošić, M.; Plaščak, I. Impact of technical spraying factors on vertical liquid distribution with Agromehanika AGP 440 axial fan sprayer. Teh. Vjesn. Tech. Gaz. 2015, 22, 367–373. [Google Scholar] [CrossRef]
  5. Abbas, I.; Liu, J.; Faheem, M.; Noor, R.S.; Shaikh, S.A.; Solangi, K.A.; Raza, S.M. Different sensor based intelligent spraying systems in Agriculture. Sens. Actuators A Phys. 2020, 316, 112265. [Google Scholar] [CrossRef]
  6. Zhu, H.; Brazee, R.D.; Derksen, R.C.; Fox, R.D.; Krause, C.R.; Ozkan, H.E.; Losely, K. A Specially Designed Air-Assisted Sprayer to Improve Spray Penetration and Air Jet Velocity Distribution Inside Dense Nursery Crops. Trans. ASABE 2006, 49, 1285–1294. [Google Scholar] [CrossRef]
  7. Patel, M.K.; Praveen, B.; Sahoo, H.K.; Patel, B.; Kumar, A.; Singh, M.; Nayak, M.K.; Rajan, P. An advance air-induced air-assisted electrostatic nozzle with enhanced performance. Comput. Electron. Agric. 2017, 135, 280–288. [Google Scholar] [CrossRef]
  8. Sánchez-Hermosilla, J.; Pérez-Alonso, J.; Martínez-Carricondo, P.; Carvajal-Ramírez, F.; Agüera-Vega, F. Evaluation of Electrostatic Spraying Equipment in a Greenhouse Pepper Crop. Horticulturae 2022, 8, 541. [Google Scholar] [CrossRef]
  9. Foqué, D.; Pieters, J.G.; Nuyttens, D. Spray deposition and distribution in a bay laurel crop as affected by nozzle type, air assistance and spray direction when using vertical spray booms. Crop Prot. 2012, 41, 77–87. [Google Scholar] [CrossRef]
  10. Piché, M.; Panneton, B.; Thériault, R. Field evaluation of air-assisted boom spraying on broccoli and potato. Trans. ASAE 2000, 43, 793–799. [Google Scholar] [CrossRef]
  11. Wu, S.; Liu, J.Z.; Wang, J.S.; Hao, D.H.; Wang, R.K. The Motion of Strawberry Leaves in an Air-Assisted Spray Field and its Influence on Droplet Deposition. Trans. ASABE 2021, 64, 83–93. [Google Scholar] [CrossRef]
  12. Grella, M.; Gil, E.; Balsari, P.; Marucco, P.; Gallart, M. Advances in developing a new test method to assess spray drift potential from air blast sprayers. Span. J. Agric. Res. 2017, 15, e0207. [Google Scholar] [CrossRef]
  13. Pergher, G.; Gubiani, R.; Cividino, S.R.; Dell’Antonia, D.; Lagazio, C. Assessment of spray deposition and recycling rate in the vineyard from a new type of air-assisted tunnel sprayer. Crop Prot. 2013, 45, 6–14. [Google Scholar] [CrossRef]
  14. Chen, C.G.; Qiu, B.J.; Shi, S.; Shen, W. Overview of research on electrostatic spray technology at home and abroad. Agric. Equip. Technol. 2017, 43, 4–9. [Google Scholar]
  15. Ru, Y.; Jia, Z.C.; Zhou, H.P.; Shu, C. Research on moving trajectory simulation of charged droplets. Chin. Agric. Mech. 2011, 4, 51–55. [Google Scholar]
  16. Appah, S.; Wang, P.; Ou, M.; Gong, C.; Jia, W. Review of electrostatic system parameters, charged droplets characteristics and substrate impact behavior from pesticides spraying. Int. J. Agric. Biol. Eng. 2019, 12, 1–9. [Google Scholar] [CrossRef]
  17. Tunio, M.H.; Gao, J.; Qureshi, W.A.; Sheikh, S.A.; Chen, J.; Chandio, F.A.; Lakhiar, I.A.; Solangi, K.A. Effects of droplet size and spray interval on root-to-shoot ratio, photosynthesis efficiency, and nutritional quality of aeroponically grown butterhead lettuce. Int. J. Agric. Biol. Eng. 2022, 15, 79–88. [Google Scholar]
  18. Qin, W.; Xue, X.; Cui, L.; Zhou, Q.; Xu, Z.; Chang, F. Optimization and test for spraying parameters of cotton defoliant sprayer. Biol. Eng. 2016, 9, 63–72. [Google Scholar]
  19. Dai, S.; Zhang, J.; Jia, W.; Ou, M.; Zhou, H.; Dong, X.; Chen, H.; Wang, M.; Chen, Y.; Yang, S. Experimental Study on the Droplet Size and Charge-to-Mass Ratio of an Air-Assisted Electrostatic Nozzle. Agriculture 2022, 12, 889. [Google Scholar] [CrossRef]
  20. Neto, J.G.; da Cunha, J.P.A.R.; Almeida, V.V.; Alves, G.S. Spray deposition on coffee leaves from airblast sprayers with and without electrostatic charge. Biosci. J. 2015, 31, 1296–1303. [Google Scholar] [CrossRef]
  21. Zampiroli, R.; Parenti, M.V.; de Alvarenga, C.B.; Celoto, F. Use of different spray volumes and hydraulic nozzles in air-assisted electrostatic insecticide application technologies to control coffee berry borer (Hypothenemus hampei) populations. Acta Sci. Agron. 2022, 44, e53751. [Google Scholar] [CrossRef]
  22. Lin, J.; Ma, J.; Liu, K.; Huang, X.; Xiao, L.; Ahmed, S.; Dong, X.; Qiu, B. Development and test of an autonomous air-assisted sprayer based on single hanging track for solar greenhouse. Crop Prot. 2021, 142, 105502. [Google Scholar] [CrossRef]
  23. Zhu, H.; Salyani, M.; Fox, R.D. A portable scanning system for evaluation of spray deposit distribution. Comput. Electron. Agric. 2011, 76, 38–43. [Google Scholar] [CrossRef]
Figure 1. Greenhouse single-rail air-assisted electrostatic sprayer: (a) Structure diagram; (b) Experimental prototype.
Agronomy 14 01108 g001
Figure 2. Airflow velocity measurement: (a) Measurement diagram: 1. Testbed, 2. Centrifugal fan, 3. Air duct, 4. Sampling point, H is 0.8 m, D is 0.5 m, L is 7 m; (b) Measurement results.
Agronomy 14 01108 g002
Figure 3. Test layout: (a) Spray diagram; (b) Test site drawing. Note: In this article, all coordinate systems (including rectangular coordinate systems and three-dimensional coordinate systems) have the same axis direction.
Agronomy 14 01108 g003
Figure 4. Schematic diagram of sampling point layout: (a) Schematic diagram of tomato leaf layering; (b) Sampling position diagram.
Agronomy 14 01108 g004
Figure 5. Spray pattern. P1: Ascending spray; P2: Descending spray.
Agronomy 14 01108 g005
Figure 6. Droplet deposition picture processing flow: (a) Original image; (b) Adjust digit; (c) Binarization; (d) Adjust threshold.
Agronomy 14 01108 g006
Figure 7. Response surface of droplet deposition coverage. (a) the interaction of X1 and X2 on Y1; (b) the interaction of X2 and X3 on Y2; (c) the interaction of X1 and X2 on Y3. X1: Charging voltage polarity (kV), X2: Spray distance (m), X3: Spray pattern (m/s). Y1: Upper sediment coverage (%), Y2: Middle sediment coverage (%), Y3: Lower sediment coverage (%).
Agronomy 14 01108 g007
Table 1. Working parameters of the sprayer.
Working ParametersNumber
Spray pressure0.3 MPa
Outlet diameter0.1 m
Outlet air velocity20 m/s
Charged voltage0, ±10 kV
Spray platform lifting speed0.3 m/s
Table 2. Test factor level table.
FactorsLevels
−101
X1 (kV)−100+10
X2 (m)135
X3 (m/s)+0.30−0.3
Table 3. Experimental design scheme.
Test NumberX1 (kV)X2 (m)X3 (m/s)
1−1010
2030
3030
4−103−0.3
51050
61010
7030
8−1050
9030
10010.3
11−1030.3
12050.3
13103−0.3
1401−0.3
151030.3
16030
1705−0.3
Table 4. Experimental results.
Test NumberX1 (kV)X2 (m)X3 (m/s)Y1 (%)Y2 (%)Y3 (%)
1−101016.327.452.95
203014.647.411.8
303015.966.91.57
4−103−0.312.3517.5118.63
510506.611.980.35
6101013.766.712.03
703013.4510.351.73
8−10505.741.791.5
903014.337.612.96
10010.310.59.115.34
11−1030.311.259.783.56
12050.30.890.661.27
13103−0.310.1812.234.38
1401−0.310.548.823.55
151030.312.4510.5715.62
1603010.185.741.19
1705−0.30.930.480.44
Table 5. Variance analysis of upper tomato leaves’ droplet deposition coverage model.
SourceSum of Square dfMean SquareF-Valuep-Value
Model325.02936.1113.050.0013
X10.884510.88450.31950.5896
X2170.661170.6661.650.0001
X30.148510.14850.05360.8235
X1X22.9412.941.060.3369
X1X32.8412.841.030.3449
X2X30.000010.00000.00001.0000
X127.8917.892.850.1352
X2284.26184.2630.440.0009
X3252.27152.2718.880.0034
Residual19.3872.77
Lack of fit0.537630.17920.03800.9886
Pure error18.8444.71
Cor total344.4016
Table 6. Variance analysis of middle tomato leaves’ droplet deposition coverage model.
SourceSum of Square dfMean SquareF-Valuep-Value
Model281.80931.317.130.0084
X13.1813.180.72250.4234
X292.34192.3421.010.0025
X39.9519.952.260.1762
X1X20.216210.21620.04920.8308
X1X39.2119.212.100.1909
X2X30.003010.00300.00070.9798
X1222.62122.625.150.0576
X22124.481124.4828.330.0011
X3228.52128.526.490.0382
Residual30.7674.39
Lack of fit19.2136.402.220.2284
Pure error11.5542.89
Cor total312.5616
Table 7. Variance analysis of lower tomato leaves’ droplet deposition coverage model.
SourceSum of Square dfMean SquareF-Valuep-Value
Model411.90945.7735.53<0.0001
X12.2712.271.760.2261
X213.29113.2910.320.0148
X30.183010.18300.14210.7174
X1X20.013210.01320.01030.9221
X1X3173.051173.05134.37<0.0001
X2X30.230410.23040.17890.6850
X1263.31163.3149.150.0002
X2268.04168.0452.830.0002
X3297.82197.8275.95<0.0001
Residual9.0271.29
Lack of fit7.2532.425.480.0668
Pure error1.7640.4408
Cor total420.9116
Table 8. Comparison of model predicted values with experimental values.
Response VariablePredicted Value (%)Test Value (%)Prediction Error (%)
Y114.038612.2812.53
14.332.08
14.563.71
Y216.366915.077.92
17.356.01
14.4611.65
Y317.597516.376.98
15.8210.10
16.844.30
Disclaimer/Publisher’s Note: The statements, opinions and data contained in all publications are solely those of the individual author(s) and contributor(s) and not of MDPI and/or the editor(s). MDPI and/or the editor(s) disclaim responsibility for any injury to people or property resulting from any ideas, methods, instructions or products referred to in the content.

