Article

Non-Destructive Classification of Maize Seeds Based on RGB and Hyperspectral Data with Improved Grey Wolf Optimization Algorithms

1
Institute for the Smart Agriculture, Jilin Agricultural University, Changchun 130118, China
2
College of Information Technology, Jilin Agricultural University, Changchun 130118, China
3
School of Data Science and Artificial Intelligence, Jilin Engineering Normal University, Changchun 130052, China
*
Authors to whom correspondence should be addressed.
Agronomy 2024, 14(4), 645; https://doi.org/10.3390/agronomy14040645
Submission received: 11 February 2024 / Revised: 12 March 2024 / Accepted: 21 March 2024 / Published: 22 March 2024
(This article belongs to the Section Precision and Digital Agriculture)

Abstract

:
Ensuring the security of germplasm resources is of great significance for the sustainable development of agriculture and ecological balance. By combining the morphological characteristics of maize seeds with hyperspectral data, maize variety classification has been achieved using machine learning algorithms. Initially, the morphological data of seeds are obtained from images, followed by the selection of feature subsets using Recursive Feature Elimination (RFE) and Select From Model (SFM) methods, indicating that features selected by RFE exhibit better performance in maize seed classification. For hyperspectral data (350–2500 nm), Competitive Adaptive Re-weighted Sampling (CARS) and the Successive Projections Algorithm (SPA) are employed to extract feature wavelengths, with the SPA algorithm demonstrating superior performance in maize seed classification tasks. Subsequently, the two sets of data are merged, and a Random Forest (RF) classifier optimized by Grey Wolf Optimization (GWO) is utilized. Given the limitations of GWO, strategies such as logistic chaotic mapping for population initialization, random perturbation, and final replacement mechanisms are incorporated to enhance the algorithm’s search capabilities. The experimental results show that the proposed ZGWO-RF model achieves an accuracy of 95.9%, precision of 96.2%, and recall of 96.1% on the test set, outperforming the unimproved model. The constructed model exhibits improved identification effects on multi-source data, providing a new tool for non-destructive testing and the accurate classification of seeds in the future.

1. Introduction

Seeds are the foundation of agriculture and are often referred to as the “chips” of agriculture. As one of the most extensively grown food crops in the world, maize is crucial to both global food security and economic growth [1,2]. The prices and lodging resistance capabilities of different maize varieties vary significantly, and the quality of a variety is closely related to its inherent characteristics [3]. Yet, due to similarities in the appearance of maize seeds, it becomes challenging to differentiate them accurately [4]. As a consequence, counterfeiting practices are prevalent in the market, posing challenges to quality assurance. The improvement of maize yields through seed classification is crucial for the agricultural industry’s sustainability and the advancement of maize breeding [5,6,7].
Traditional seed classification methods primarily involve manual identification based on experience, chemical and biological identification, and electrophoretic techniques [8,9,10,11]. However, these methods suffer from drawbacks such as being time-consuming, labor-intensive, and prone to sample loss, which hampers their wide-scale adoption [12]. The present issue of maize seed mixing needs to be resolved in order to guarantee the purity of maize seeds and enhance the caliber of seed selection and breeding [13,14]. Due to advancements in computer and spectroscopic technologies, quick and non-destructive detection is widely used in seed classification and identification [15,16,17,18,19].
Table 1 shows the classification results of the different techniques used to sort the varieties. Near-infrared spectroscopy and computer vision technologies can effectively address issues such as the slow recognition speed and high subjectivity arising from manual labor. These technologies have a wide range of applications in breeding, agricultural product quality testing, as well as the diagnosis and identification of pests and diseases [20,21,22,23,24]. In existing seed classification methods, researchers have employed various models to classify seeds such as maize, wheat, and rice. Through comparisons, it is observed that deep learning exhibits excellent performance in image-based classification due to its powerful feature learning capability, enabling the models to learn high-level abstract feature representations from raw data. However, deep learning models require substantial data support, have long training times, and lack interpretability compared to machine learning. Additionally, the fusion of image and spectral data has shown significant advantages, achieving a 97.7% accuracy rate in the classification of ten classes of maize, indicating that feature fusion can effectively enhance the model’s accuracy. This phenomenon arises from the reliance on solely utilizing individual seed image or spectral data for classification purposes, which inadvertently disregards other crucial feature information, consequently leading to the omission of certain types of characteristics [25,26]. The fusion of multiple types of features enhances feature expression by integrating information from different types of features and compensating for the limitations of individual features. Consequently, some scholars have started to explore the fusion of information from multiple types of features to perform classification discrimination tasks.
Table 1. Classification results of different technologies.
Sorting
Technology
Data TypeModelNumber of
Varieties and Categories
AccuracyRef.
Machine learningNIRSDT, SVM, RF, MLP, NB7 types of pine nutsEach model achieved 80%Huang [27]
HyperspectralELM5 types of wheat86.26%Bao [28]
RGBMLP, LDA, SVM etc.5 types of maizeEach model achieved 93%Xu [29]
Deep learningRGBMF Swin-Transformer19 types of maize96.47%Bi [30]
Hyperspectral imageCNN-LSTM5 types of maize95.26%Wang [31]
NIRSCNN, RNN, LSTM, etc.4 years of cotton seedsEach model achieved 93.5%Duan [32]
RGB+NIRS2Branch-CNN10 types of rice98%Ye [33]
RGB+NIRSBP Neural Network10 types of maize97.7Yang [34]
However, in the practical application of machine learning, the performance heavily relies on the setting of the internal hyperparameters of the model [35,36,37]. Therefore, selecting the optimal hyperparameters is the most crucial step. Swarm intelligence optimization algorithms can effectively address nonlinear parameter optimization problems and possess strong global search capability and adaptability. As a result, they demonstrate excellent performance in practical applications [38,39,40]. According to recent research, swarm intelligence algorithms perform noticeably better than conventional optimization algorithms in a variety of domains, including speech recognition, image processing, path planning, data mining, etc. [41,42,43,44]. Shao et al. [45] used the sparrow search optimization algorithm to optimize an extreme learning machine for vehicle classification based on multimodal data features. The results showed that the improved model had significant advantages relating to its classification accuracy and convergence speed. Bedolla-Ibarra et al. [46] optimized the random forest algorithm for attention-level classification using the particle swarm optimization algorithm and achieved a high accuracy rate. Dogan et al. [47] optimized an extreme learning machine using the Salp Swarm Algorithm and classified images of 14 different types of dry bean cultivars with an accuracy rate of 91.43%. The results indicate that swarm intelligence optimization algorithms exhibit superior classification accuracy compared to traditional machine learning algorithms. In conclusion, swarm intelligence optimization algorithms demonstrate excellent performance in identifying the optimal hyperparameters for machine learning.
This study proposes a maize seed classification model based on the improved grey wolf optimization algorithm, which fuses RGB and hyperspectral data features. By leveraging multi-source heterogeneous data for feature fusion, the model’s feature distribution is enhanced. Additionally, the grey wolf optimization algorithm is employed to optimize the hyperparameters that have a significant impact on accuracy in the random forest algorithm. This optimization process improves the model’s recognition performance on multi-source heterogeneous data, providing a novel tool for achieving non-destructive detection and precision classification in seed-sorting applications.

2. Materials and Methods

2.1. Data Acquisition

The Institute of Smart Agriculture at Jilin Agricultural University provided the samples of maize seed used in this study, which included a total of eleven varieties: JiDan 27, JiDan 50, JiDan 83, JiDan 209, JiDan 407, JiDan 436, JiDan 505, JiDan 626, JiDan 953, LY9915, and ZhengDan 958 (Figure 1). All of the selected seeds display a yellow color, with certain varieties showcasing slightly reddish surfaces. In order to prevent the seeds being mixed with broken, insect-infested, and impure seeds, manual screening was employed during the sample selection process to choose large and intact seeds. One thousand seeds of each type were chosen in total.

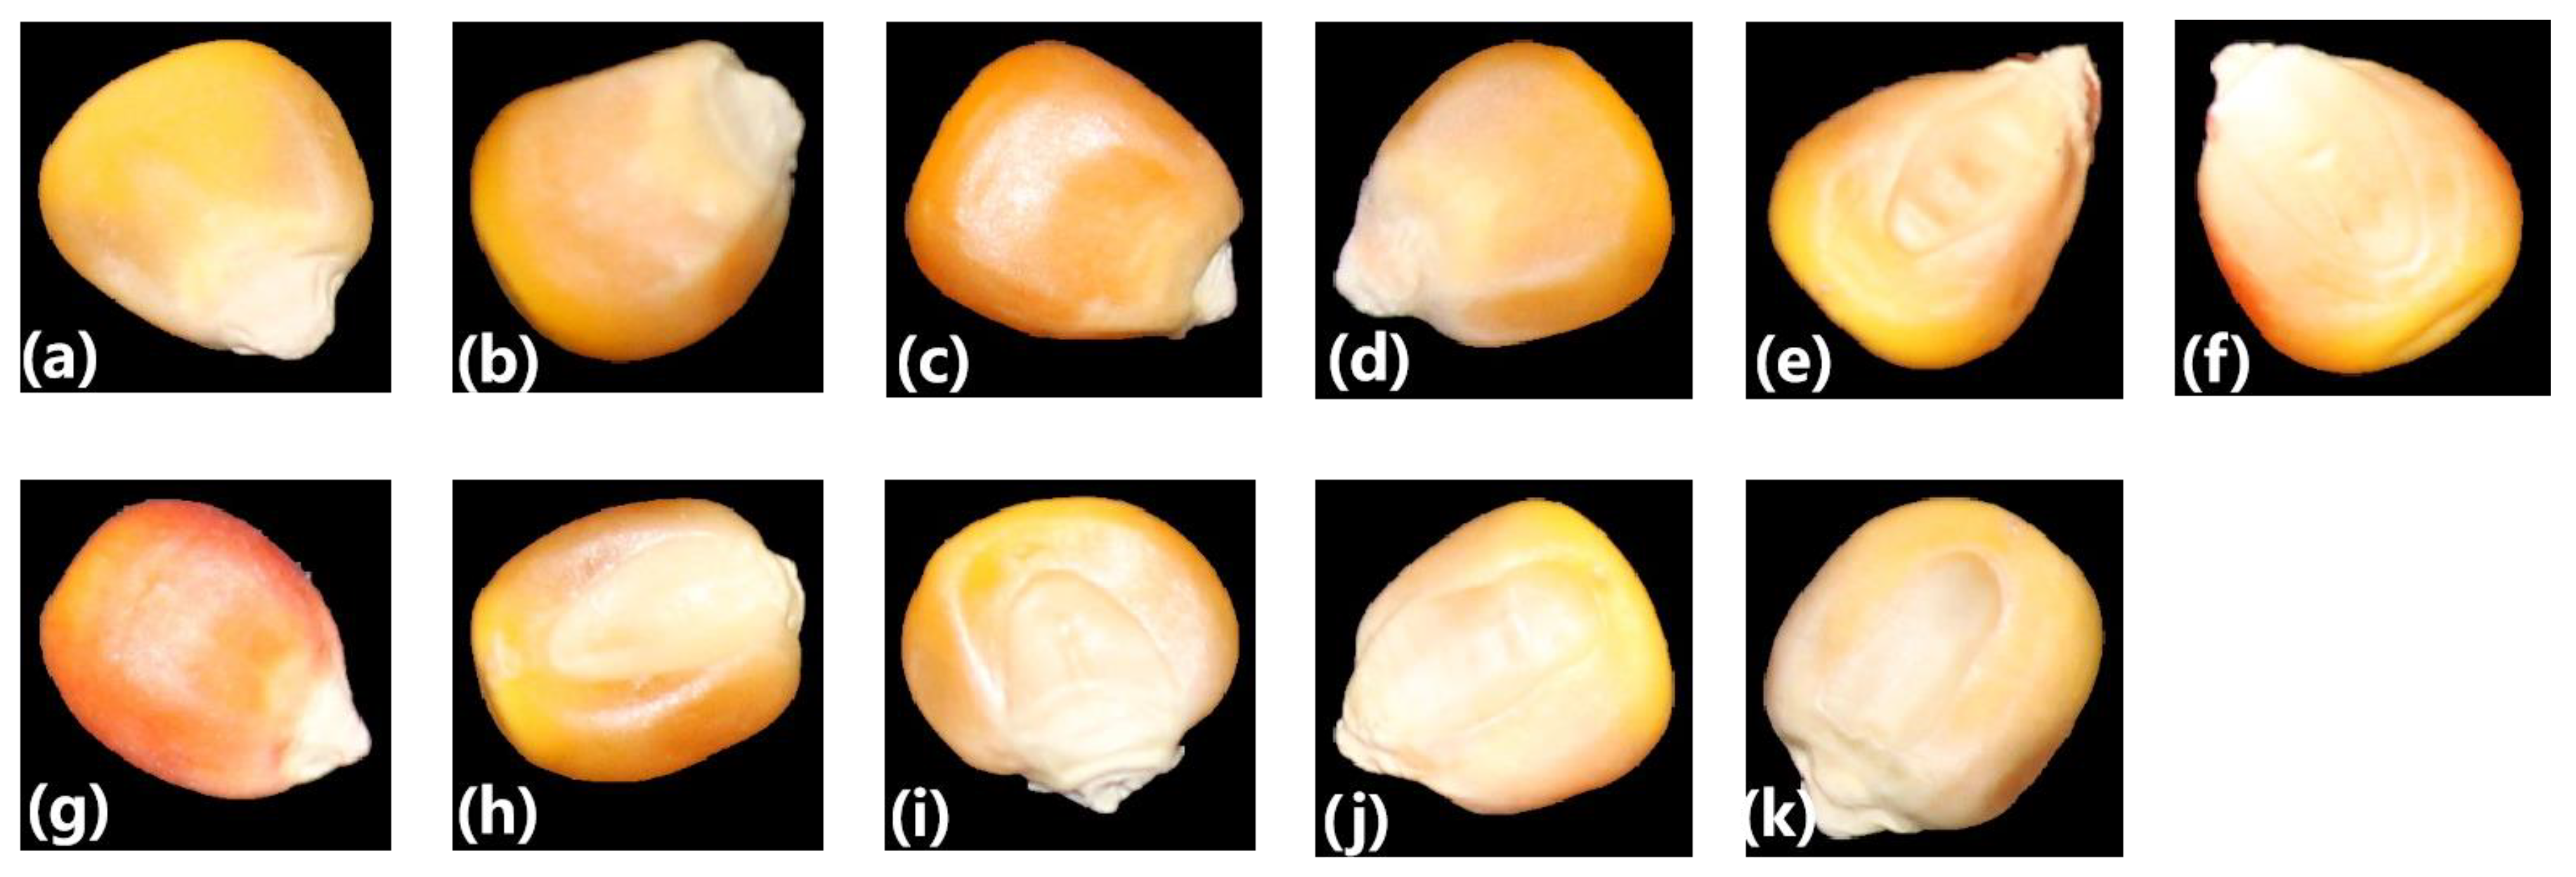
2.1.1. Image Data Acquisition

The images of maize seeds were captured using the camera model Canon EOS 1500D produced by Canon, located in Tokyo, Japan. To ensure environmental consistency during data collection, prevent interference from extraneous light sources, and minimize external environmental effects on the photographic quality, all images were captured under identical conditions. The maize seeds were positioned on a black background plate and photographed with the camera oriented vertically above them. Two stable LED light sources were used to provide consistent illumination during image capture. The acquisition device is shown in Figure 2. The germinal, non-germinal, and germ tip orientations of the maize seeds were arranged in a random pattern. Each type of seed was arranged in groups of 100 on a black background plate, and ten sets of photographs were captured. The resolution of each image of the maize seeds was set at 6000 × 4000 pixels.

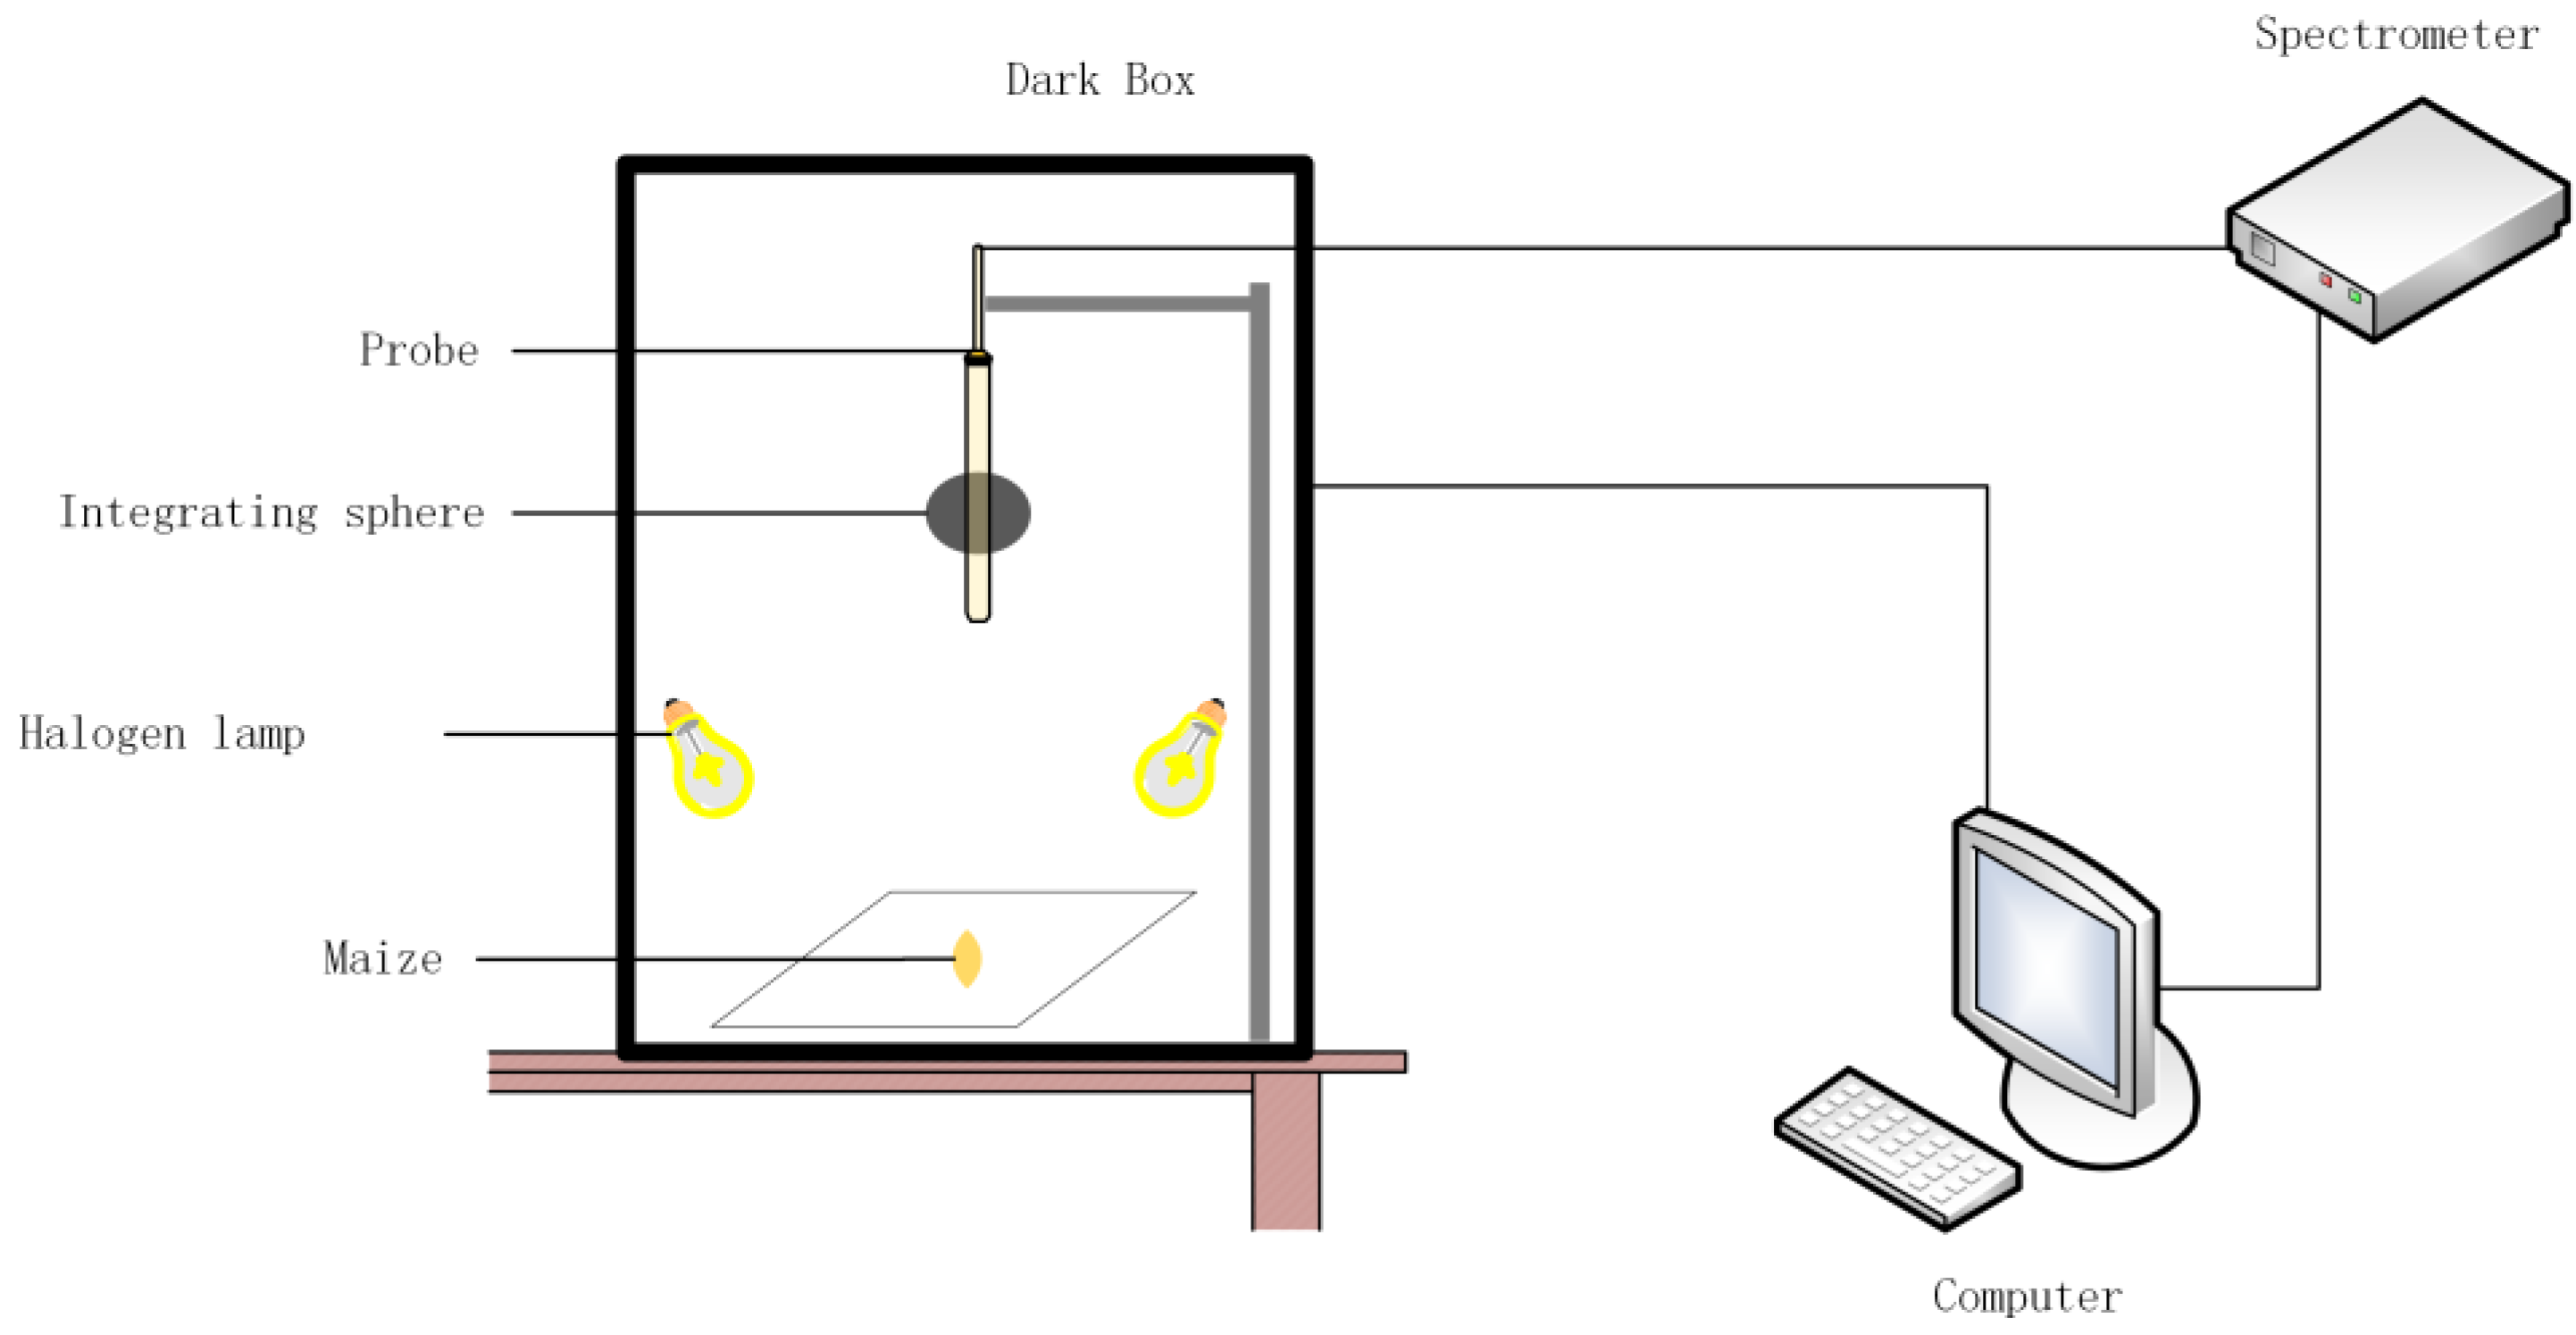
2.1.2. Hyperspectral Data Acquisition

The hyperspectral data of the maize seeds were acquired using the FieldSpec4 portable ground spectrometer manufactured by ASD Inc., (Santa Clara, CA, USA). Spectral reflectance in the 350–2500 nm region is measured by the apparatus. The spectrometer’s probe is 10 cm away from the sample surface, its wavelength precision and repeatability are 0.5 and 0.1 nm, the spectrum sampling interval is 1 nm, and a 20 W halogen lamp serves as the light source. Figure 3 displays the equipment acquisition schematic diagram. Spectral calibration was performed using a standard white plate prior to the determination. The number of spectral averages was set to 10, and the integration time was set to 100 ms. A total of 150 samples of maize seeds for each varieties were randomly selected without repetition for the measurement.

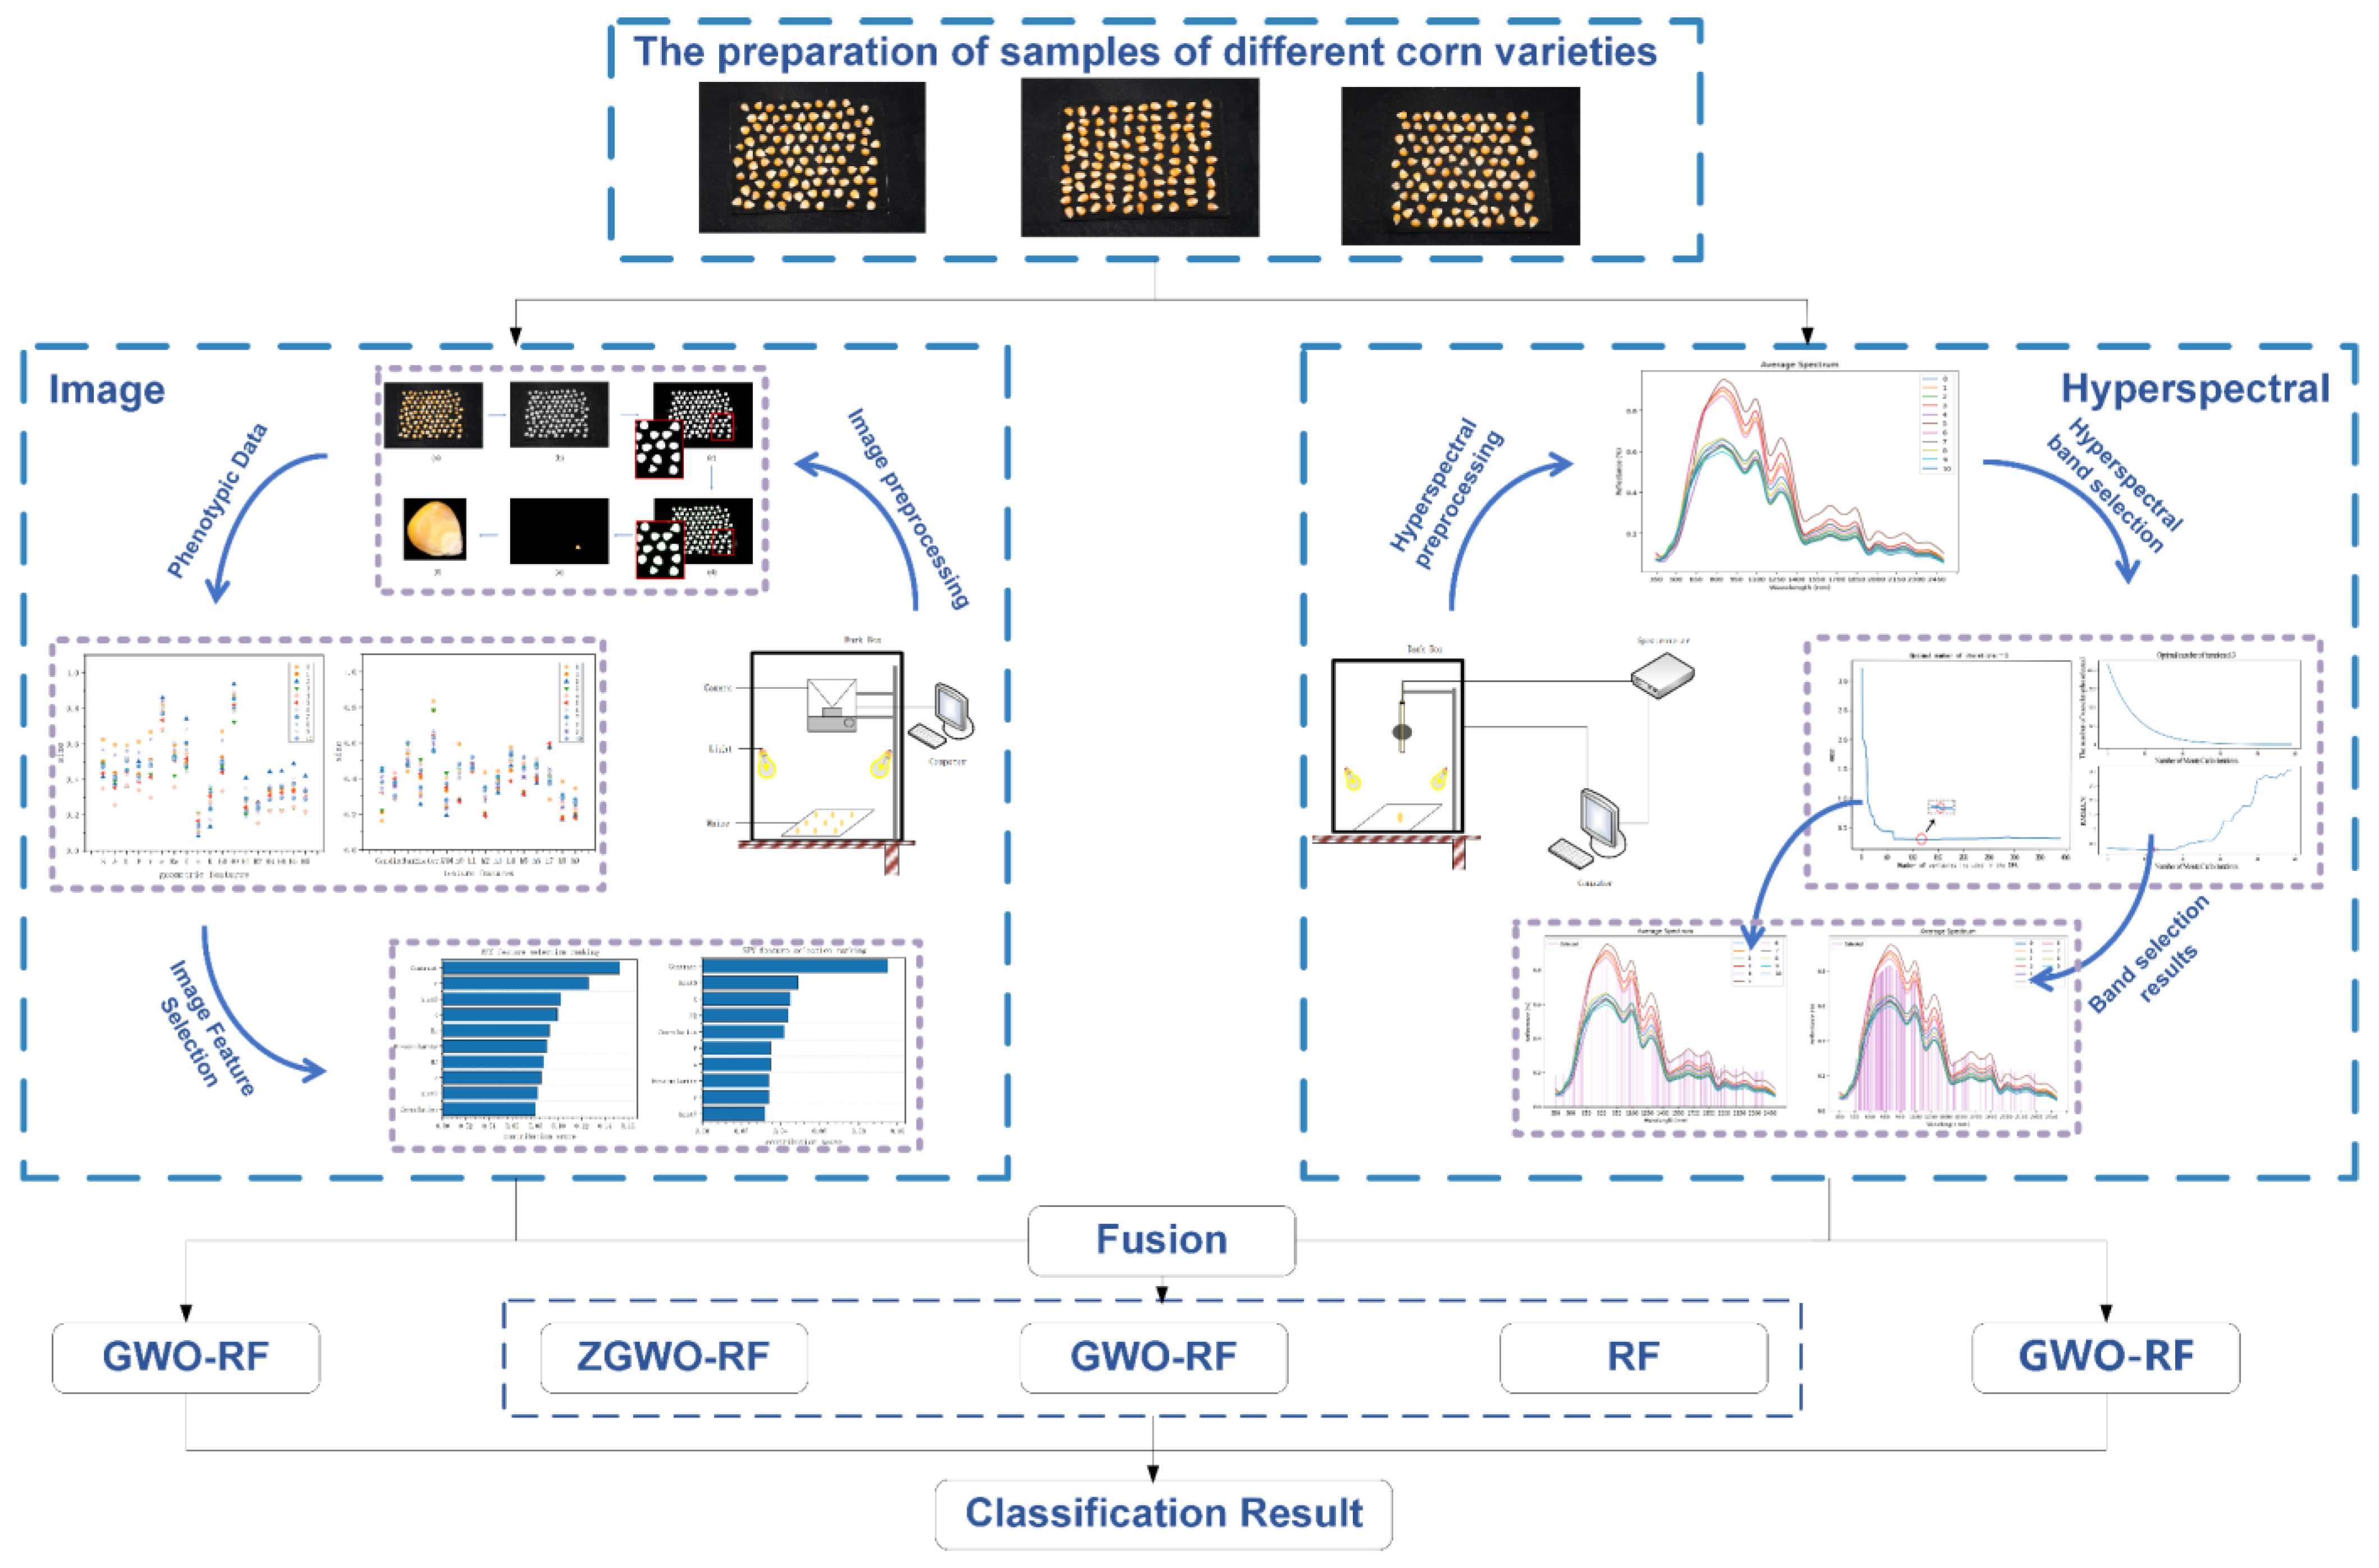
2.2. Experimental Procedure

This study was conducted using the 64-bit Windows 10 operating system with Python version 3.8. The computational setup featured an Intel(R) Xeon(R) Gold 6246R CPU @ 3.40GHz, supported by 128 GB of RAM, and an NVIDIA Quadro RTX 8000 graphics card. The overall flowchart is shown in Figure 4.
In order to classify different varieties of maize seeds, morphological data were initially extracted from the RGB images. Subsequently, the morphological and hyperspectral data underwent independent preprocessing, followed by the application of a feature selection algorithm to obtain a subset of features. To determine the optimal combination pattern, the model incorporates input from the morphological characteristics of seeds, hyperspectral bands, and their combination. The ideal machine learning hyperparameters are discovered using the swarm intelligence optimization technique during the interim stage, followed by the algorithm’s final optimization.

2.3. Data Preprocessing

2.3.1. Image Data Preprocessing

Previous studies have shown that the morphological data of seeds can effectively represent genetic traits, making them crucial for crop breeding studies [48,49]. To preserve relevant information from the seed images, the captured data undergo grayscale conversion and noise reduction using a Gaussian filter. The Otsu thresholding method is then utilized to determine the image threshold for creating a binary image, which is further refined through morphological opening operations to eliminate any existing holes. Subsequently, the contour edges of each maize seed are extracted using a boundary-tracking algorithm, and the minimum bounding rectangle for each seed region is calculated. Individual seed regions are isolated and processed with a masking operation to extract the RGB image for each seed. The process is shown in Figure 5.
The geometric and texture features of individual seeds were extracted from 1000 seeds of each variety using image processing techniques to determine their morphological characteristics. Geometric features act as indicators reflecting the biological and genetic characteristics of seeds [50]. A total of 18 key parameters are derived from the maize seed images, including the circumference, area, length, width, radius of the inscribed circle, circularity, rectangularity, elongation, dispersion, aspect ratio, equivalent circle diameter, and Hu moments (comprising 7 moments). Texture features represent the global attributes used to characterize the surface properties of an image [51]. A set of 16 key parameters is obtained by extracting six attributes, such as the contrast, dissimilarity, angular second moment, energy, correlation, and homogeneity, from the gray-level co-occurrence matrix of the maize seed’s grayscale image, along with ten Local Binary Pattern (LBP) attributes. Given the significant variations in magnitude among the extracted features, normalization is essential prior to model training.

2.3.2. Hyperspectral Data Preprocessing

Various characteristics of the sample surface’s diffuse reflection, light scattering, and other elements might cause unintentional interference during the hyperspectral data gathering process, causing variations in the hyperspectral data between samples of the same type. Consequently, hyperspectral preprocessing can enhance the classification performance of the model by further reducing the impact of noise on the hyperspectral data. In this study, the Savitzky–Golay (SG) smoothing technique was used to treat the spectra. By utilizing polynomial fitting techniques to mitigate the influence of random noise and enhance the signal-to-noise ratio of the spectral peaks, the SG smoothing algorithm effectively enhances the correlation between the spectra and the data.

2.4. Maize Seed Classification odel

2.4.1. Random Forest Classification Model

Decision trees make up the fundamental building block of the random forest classification model, which is based on integrated learning. By merging several decision trees, the model’s capacity for generalization is enhanced. In order to achieve the best segmentation possible based on the features, a random subset of the original data is chosen at each node of the decision tree. Every decision tree in the random forest classifies the samples that need to be forecasted during prediction. The classification outcome is then determined by voting or averaging the decisions made by all the decision trees. In addition to producing superior results when handling high-dimensional data and a large number of training samples, the random forest model can lower the danger of overfitting.
The hyperparameters of the model are often manually selected in practical applications, introducing subjectivity and randomness into the process. In order to improve the accuracy of hyperparameter selection and reduce the repetitive effort involved in manual selection, this study employs a swarm intelligence optimization algorithm to optimize the model. The algorithm undergoes continuous iterative optimization to identify the optimal parameter values, leading to an improved classification performance. This approach enables a more precise and efficient hyperparameter tuning process, ultimately achieving better classification results.

2.4.2. Grey Wolf Optimization Algorithm and Its Improvements

The Grey Wolf Optimization (GWO) algorithm is a swarm intelligence-based optimization algorithm that mimics the hierarchical structure and social dynamics of grey wolf packs [52]. Inspired by the predatory behavior of grey wolves, the GWO algorithm divides them into four categories, namely α, β, δ, and ω, which represent various hierarchical strata within the wolf packs and simulate the leadership hierarchy and hunting mechanism of grey wolves in the wild. In the GWO algorithm, potential solutions in the problem space are treated as individuals within a pack of grey wolves, where their collaborative and competitive behaviors simulate the search process for solutions. Throughout the entire search process, the alpha wolf (α), with the best fitness ranking, leads the pack’s actions, while the wolves with the second (β) and third (δ) best fitness rankings assist the alpha wolf in guiding the pack, and the remaining wolves update their positions based on them.
The strengths of grey wolf optimization encompass minimal parameters and an exceptional convergence performance. However, owing to the hunting behavior of wolves, which often leads to diminished convergence speed in later stages, and the fact that the pack leader may not consistently occupy the global optimal location, challenges pertaining to local optimization and other complexities can readily manifest throughout the iterative process. Therefore, the ZGWO algorithm is proposed with the following enhancements.
During the population initialization stage, improvements have been made to the random initialization method for the wolf pack to ensure better population diversity, and a logistic chaotic mapping mechanism with reverse learning has been added. The mechanism generates a random population based on the logistic equation. The mathematical expression of the equation is shown below:
X i   = a   ×   X i 1   ×   ( 1   X i 1 ) ,
where i represents the current iteration number, and a is the control parameter that determines the evolution of the logistic mapping. In this study, the value of a is set to 4. After obtaining the population information, reverse learning is performed. The position of each wolf is solved in reverse using the following formula:
X i   ¯ = λ   × lb i   + ub i   X i ,
where lb i and u b i represent the boundary values of X i , while λ is a random number within the (0, 1) interval. After the random backpropagation learning process, the resulting population is compared with the originally constructed solution space, and positions with higher fitness values are retained to create a new population.
This study introduces the Cauchy variation operator, which is incorporated into the algorithm’s iteration process since the grey wolf optimization technique is prone to premature convergence and local optimum formation. Based on the characteristics of the Cauchy distribution, the Cauchy mutation operator generates random perturbations near the potential optimal solution range, enabling a local area search for individual grey wolves. Applying random perturbations to the alpha wolf’s position increases algorithm diversity, facilitating a local area search for the alpha wolf and aiding in the discovery of potential optimal solutions. The improved local search capacity not only makes it easier for the algorithm to deviate from the local optimum, but it also facilitates the global search, which speeds up convergence to the optimal solution’s neighborhood. The current optimal solution is mutated using the following equation:
P new _ best =   P best _ i   + P best _ i   ×   C ( 0 ,   1 ) ,
where P best _ i is the current optimal solution, and C ( 0 ,   1 ) is a standard Cauchy distributed random number. When comparing the fitness value of the obtained new solution to that of the original optimal solution, if the new solution proves to be more efficient than the present one, the global optimal solution is updated to reflect the new solution; if not, it stays the same.
To improve the capacity for localized search, an end-of-population replacement mechanism are included in the population position update phase at the same time. The fitness of the wolves is sorted from least to most, with those in the bottom 20% being considered inferior and needing to be replaced. The positions of other wolves are kept, and new positions are created in their vicinity based on the head wolf’s position as a standard. The following formula can be used to update the i-th wolf’s position:
X i = x 1   +   x 2   +   x 3 3 ,   i < P × 0.8 P best _ i + r ,   o t h e r ,
where x 1   , x 2   and x 3   are position vectors obtained based on the alpha, beta, and delta wolves, respectively; P is the population size; and r is a random number within the interval [−2, 2] used to control the position of the new wolf.

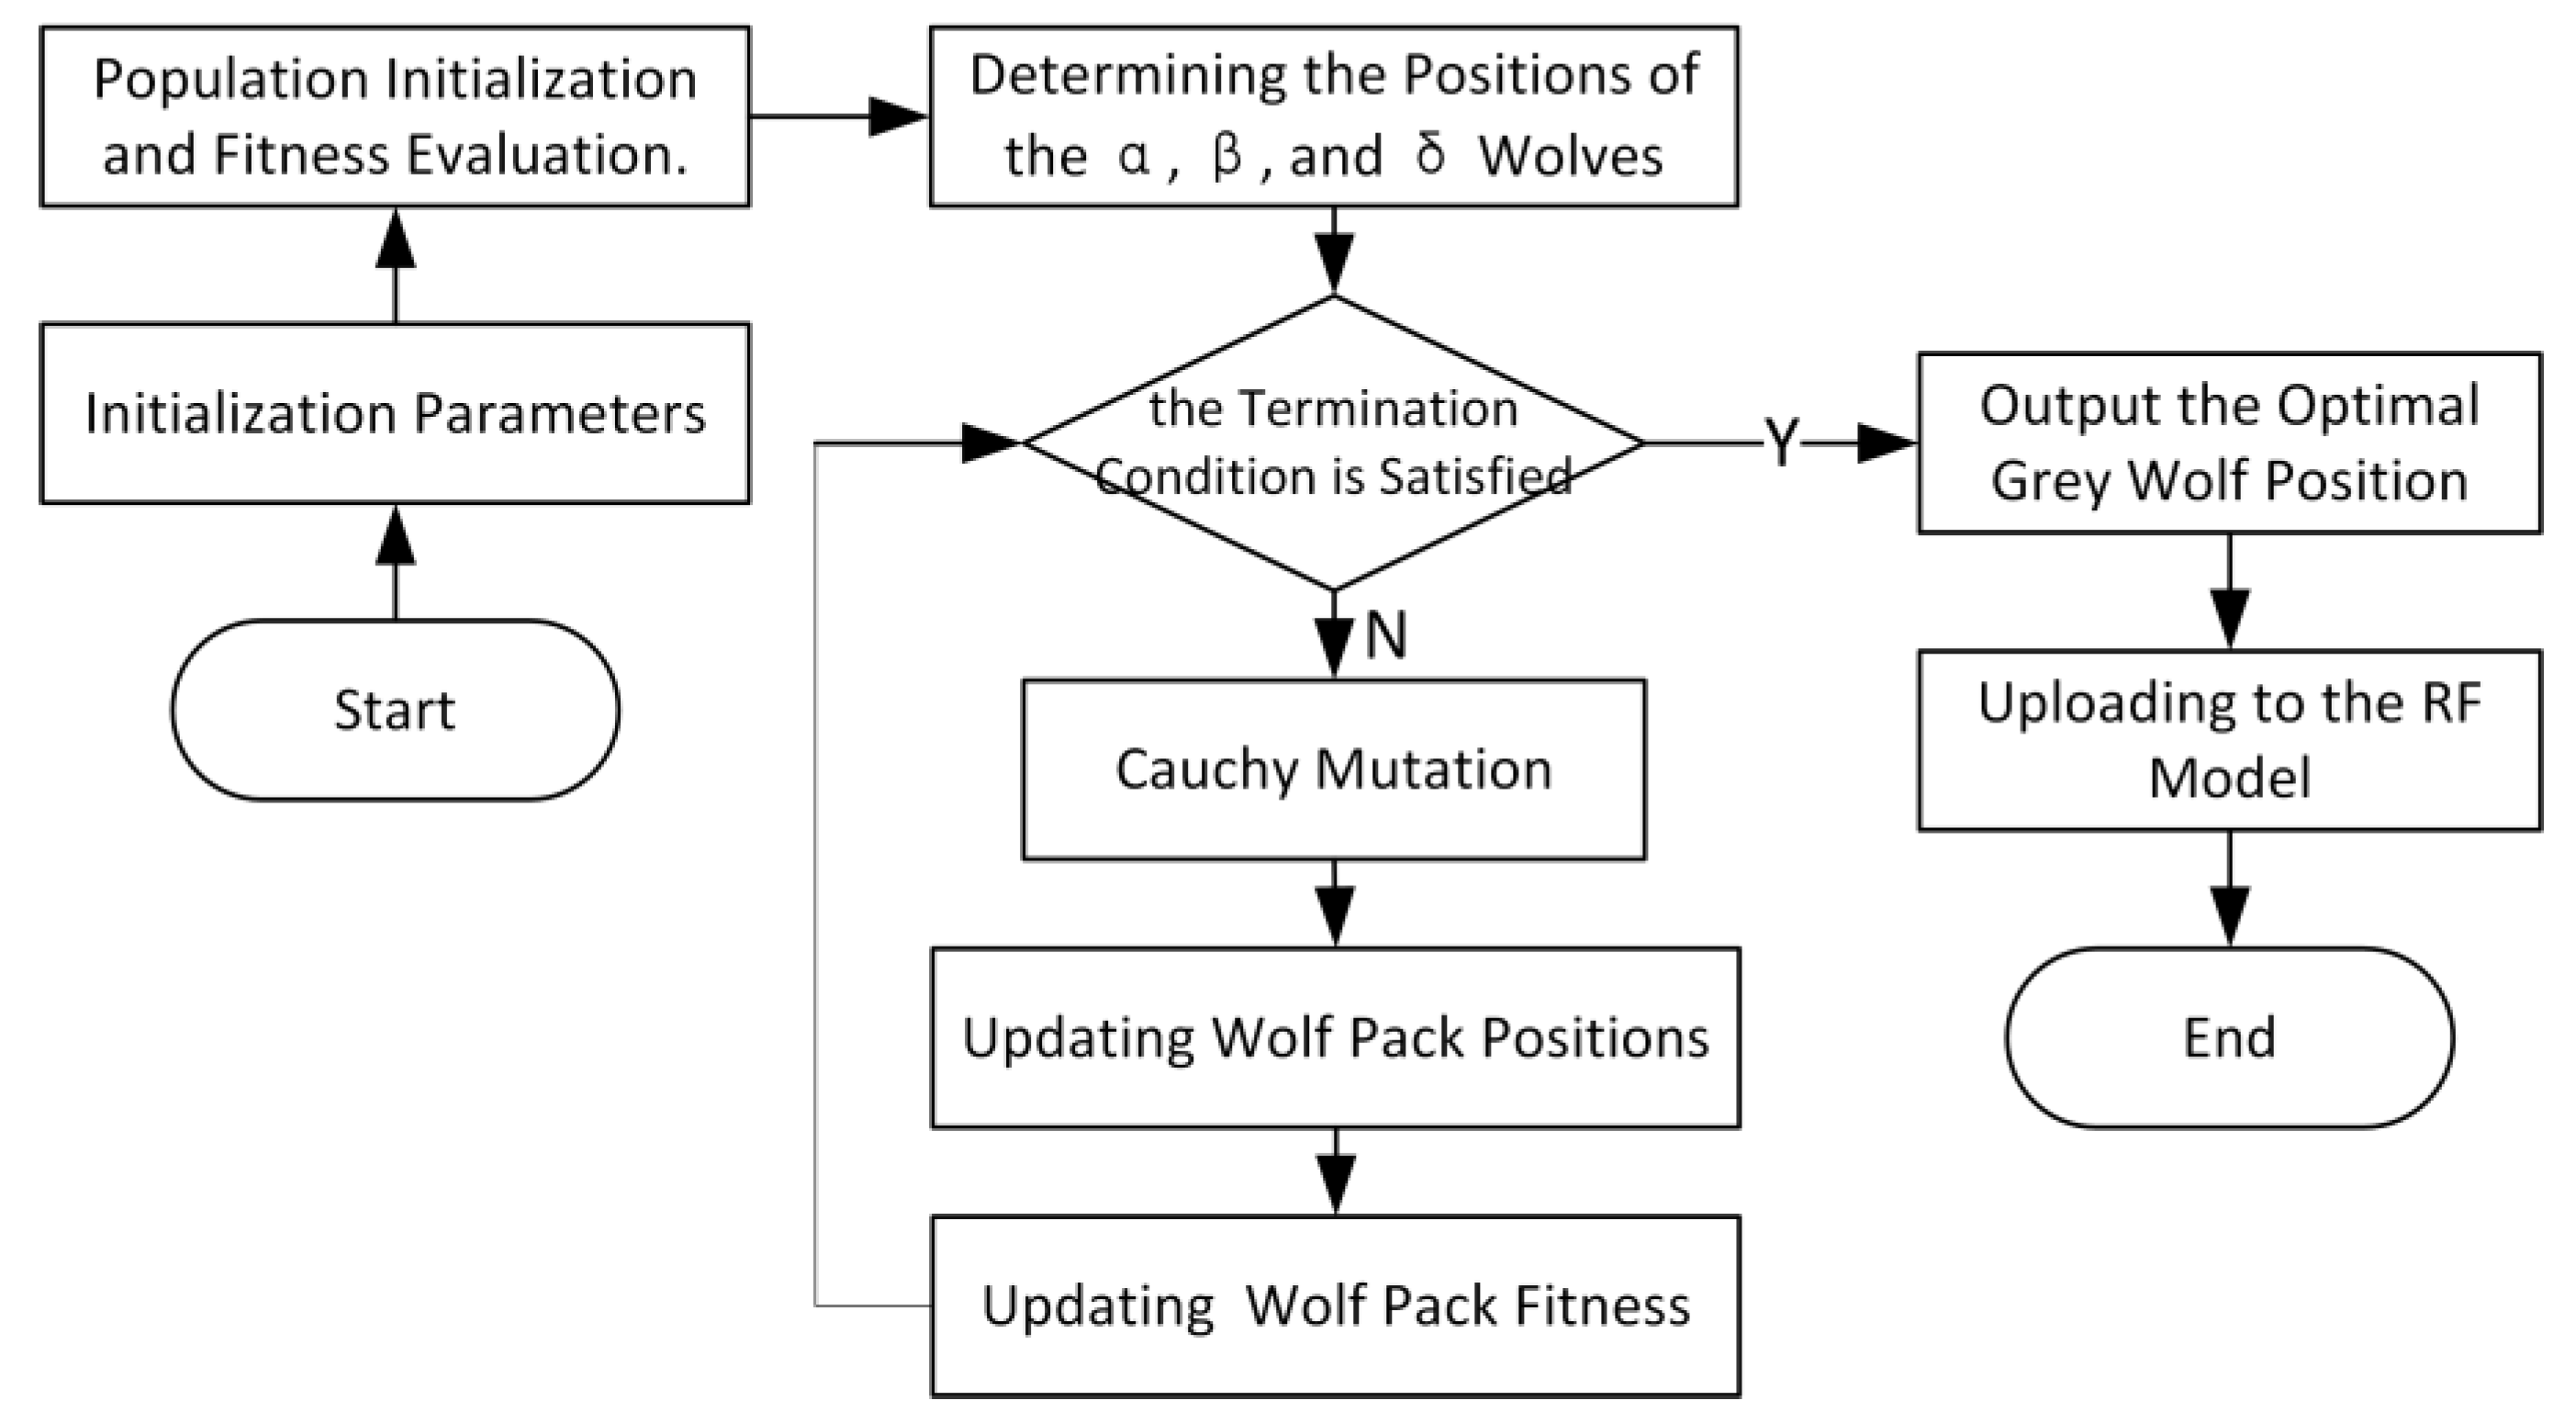
2.4.3. Classification Model Based on ZGWO-RF

The advantages of Random Forest (RF) include randomness and resistance to overfitting. The number of decision trees and the size of the largest feature subset in a random forest model directly impact its classification performance [53]. The optimal hyperparameter values depend on the size of the dataset, the complexity of the features, and the nature of the task in academic research. The model with too few decision trees may suffer from underfitting, while the model with tot many decision trees may become overly complex, leading to overfitting and high computational costs. The model will be more robust with smaller feature subsets, but if the value is taken too small, significant information will be lost and underfitting results could occur; on the other hand, if the value is taken too high, the variability between decision trees will diminish and the overfitting of the model could occur. In order to determine the parameter values that provide the best match, this study utilizes the GWO for optimization. Figure 6 shows the ZGWO process of random forest model optimization. The steps of this process are as follows:
(1)
Create new populations by utilizing reverse learning to establish wolves based on a hierarchy and initialize packs of wolves.
(2)
Determine the fitness of every single wolf pack and use the RF model to rank them from smallest to largest.
(3)
Determine the fitness and make public the version of (4) for the head wolf.
(4)
Relocate every wolf in the pack to their new location.
(5)
Sort, recalculate the fitness value, and feed back to the RF model.
(6)
Check to see if the maximum number of iterations has been reached and output if it has; if not, go back to steps (3)–(5).
Figure 6. Flowchart of ZGWO-RF.
Agronomy 14 00645 g006

2.5. Classification Model Evaluation Indicators

The evaluation metrics used to assess the quality of a model are accuracy (A), precision (P), and recall (R). The formulas are displayed beneath. The proportion of all correctly predicted results to the total data is indicated by the accuracy rate; the proportion of samples in which the model correctly predicted a positive class is indicated by the precision rate; and the proportion of samples in which the model actually predicted a positive class is indicated by the recall rate.
A = i = 1 m T i C o r n s u m ,
P = 1 m i = 1 m T i T i + F i ,
R = 1 m i = 1 m T i T i + Y i ,
where C o r n s u m represents the total number of samples, T i represents the number of correctly predicted instances in class i, m represents the number of classes, F i represents the number of instances incorrectly predicted as class i, and Y i represents the number of instances incorrectly predicted as other classes. Since this is a multi-class classification task, the average precision and recall values are calculated as the final evaluation metrics.

3. Results and Discussion

3.1. Construction of a Classification Model for Morphological Traits of Maize Seeds

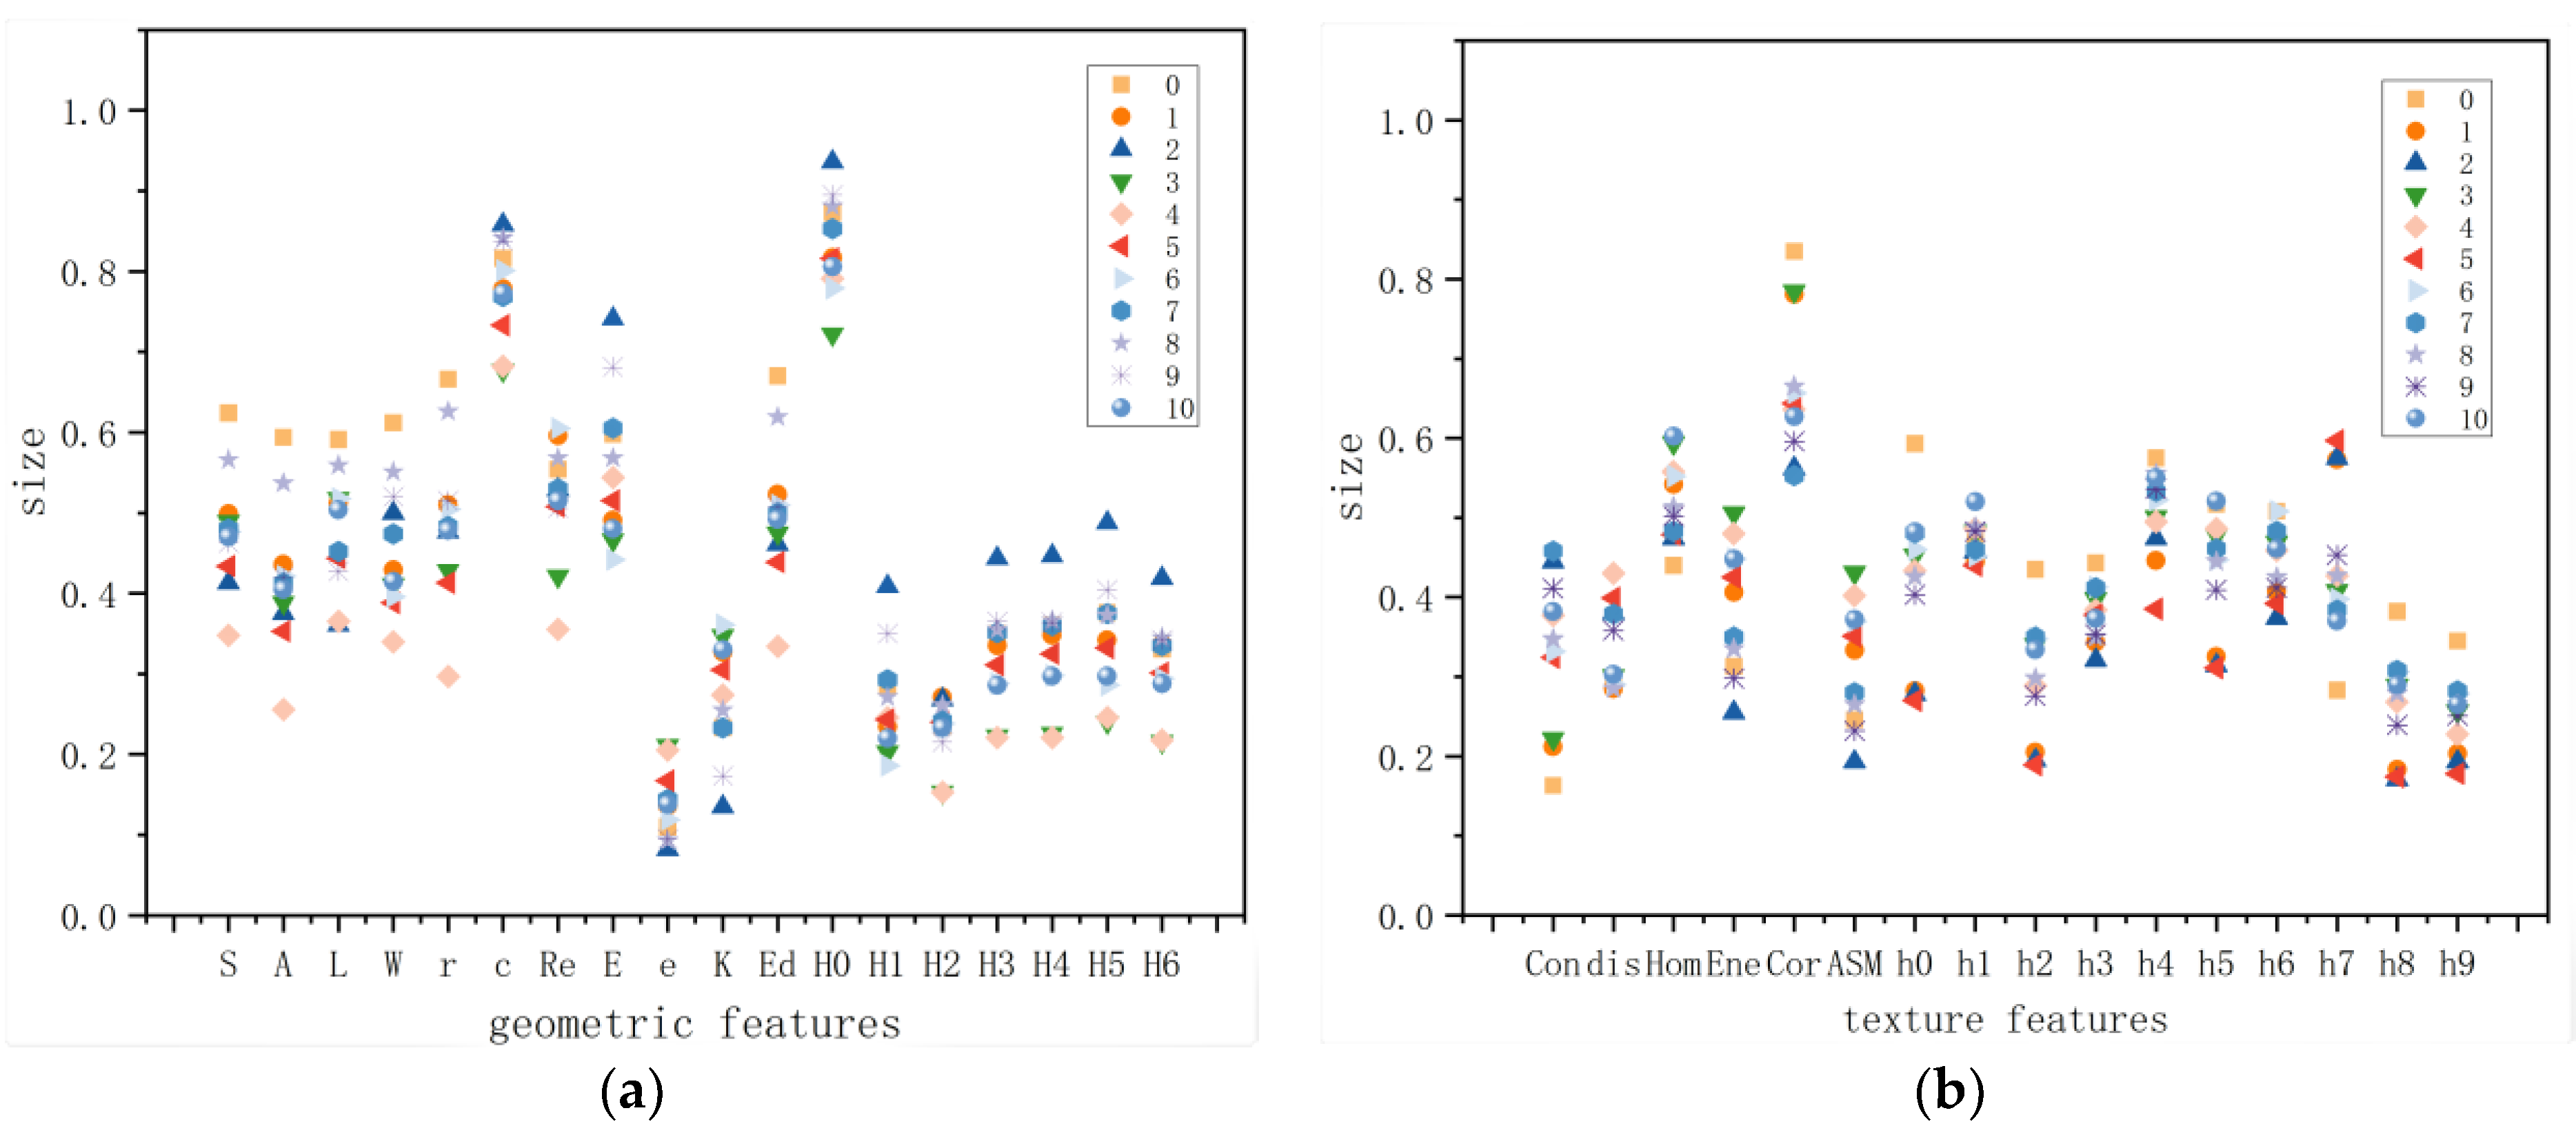
3.1.1. Parameter Analysis Based on Morphological Feature Averages

A total of thirty-four morphological features were extracted from the maize seeds, and Figure 7 showcases the normalized mean values of these traits across different seed categories. It is evident that the distribution of morphological traits varies significantly among the majority of maize seed classes.
The geometric feature mean values for the diverse seed types are shown in Figure 7a. Notably, the geometric features in category 4 exhibit a notably smaller scale compared to other categories, while the indicators in category 0 (such as perimeter, area, and radius of the in-circle) are relatively larger. Moreover, the feature values in category 9 (encompassing elongation and Hu1) showcase significant differences in mean values. The texture feature mean values for the distinct seed categories are shown in Figure 7b. The characterization index mean values demonstrate variation across categories. For instance, category 2 displays lower mean values for energy and angular second moment compared to the other categories, whereas category 10 exhibits higher mean values for homogeneity and hist1. In conclusion, the differentiation of various maize seed types based on their morphological traits is a viable approach.

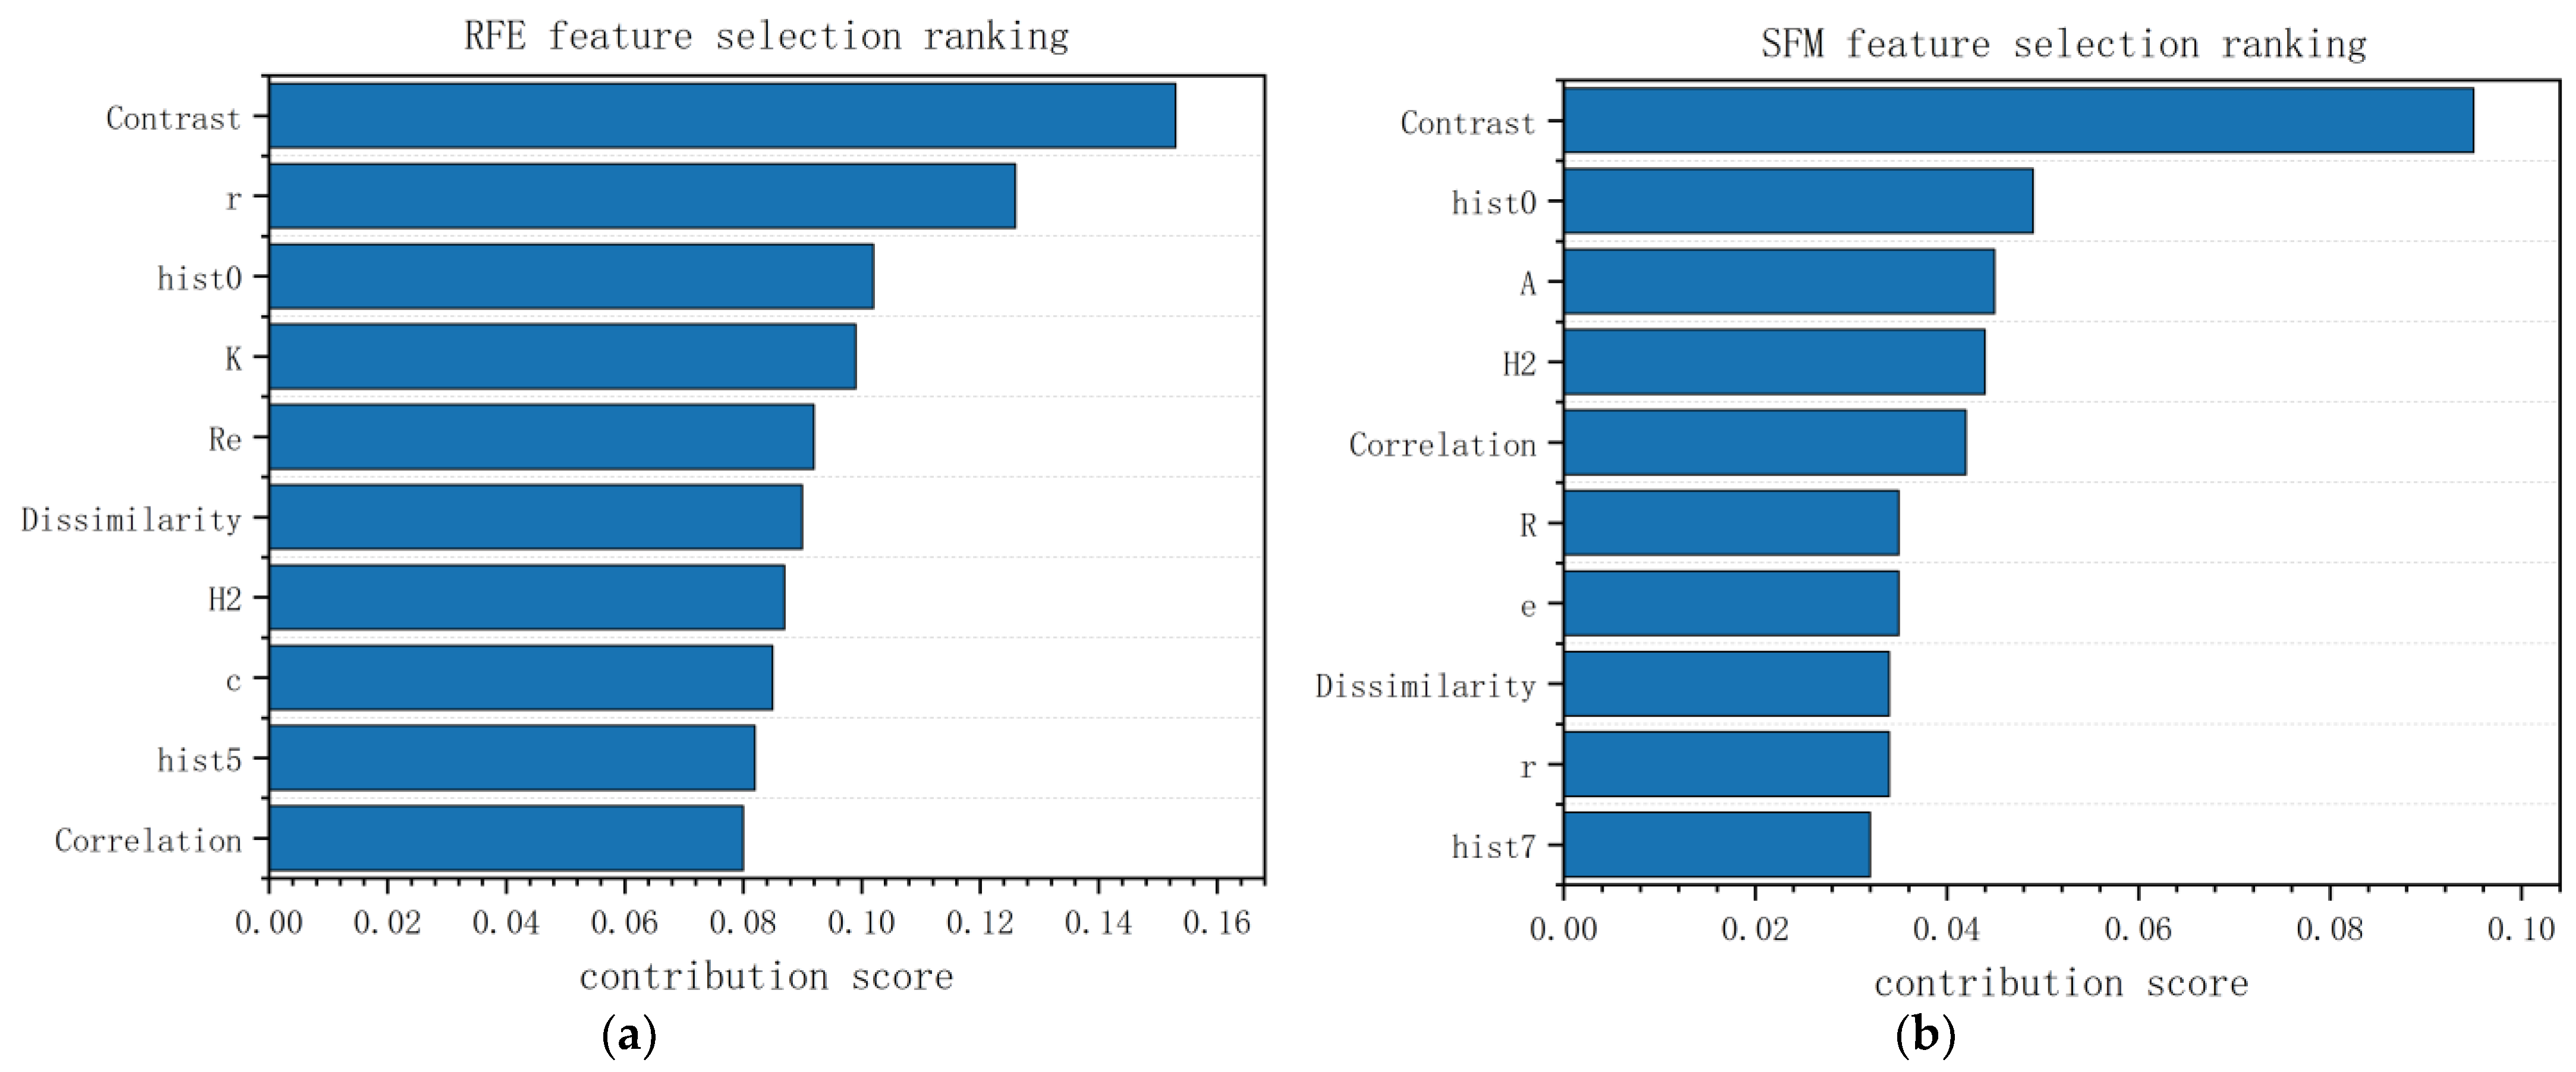
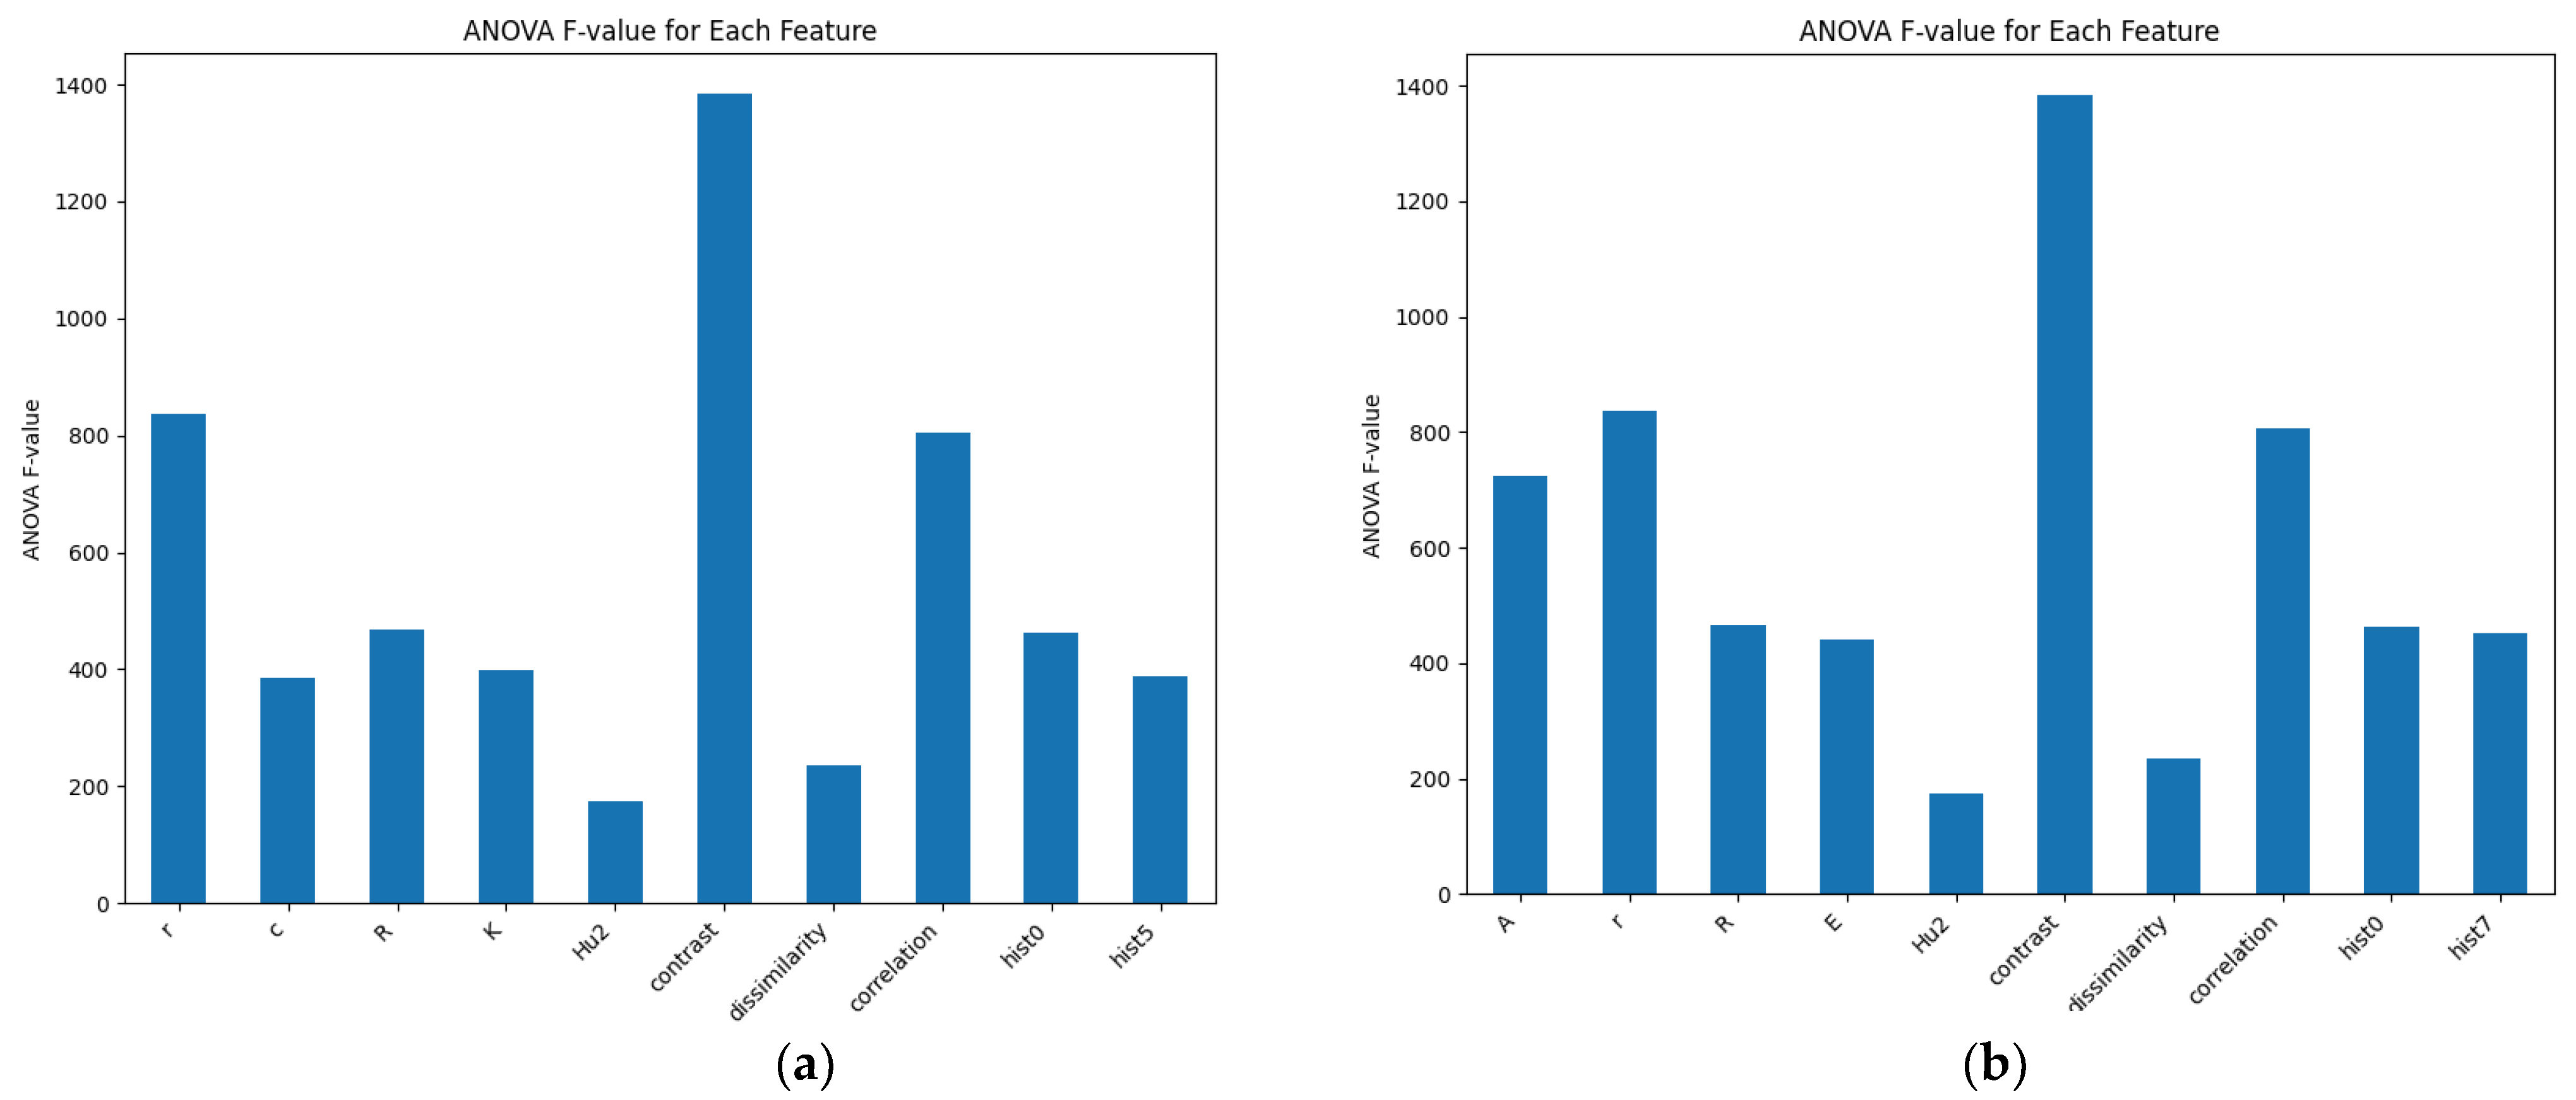
3.1.2. Morphological Feature Selection Using RFE and SFM

Due to the potential intercorrelation among the extracted morphological features, not all features exert significant influence on the construction of the model. Consequently, Recursive Feature Elimination (RFE) and Select From Model (SFM) methods based on feature importance were implemented for the optimal selection of the morphological features.
(1)
RFE
RFE entails a recursive feature elimination process designed to ascertain the optimal feature combination through iterative model training and feature elimination. After each training iteration, several features with low importance are eliminated, and a new feature set is trained until a predefined criterion is met. RFE was employed to select the top ten most important features, which are shown in Figure 8a. The selected features include the internal tangent circle radius, circularity, rectangularity, aspect ratio, Hu2, contrast, dissimilarity, correlation, LBP1, and LBP6.
(2)
SFM
SFM is a model-based feature selection method that focuses on features with higher importance, as determined by a predefined machine learning model. A tree-based evaluator was used to select the top ten features, as shown in Figure 8b. The selected features include the area, radius of tangent circle, rectangularity, discretization, Hu2, contrast, dissimilarity, correlation, LBP1, and LBP8.
Figure 8. Results of selection for morphological characterization of maize seeds: (a) results of feature selection using RFE; (b) results of feature selection using SFM.
Agronomy 14 00645 g008
Analysis of variance (ANOVA) was employed to assess the selected features. By comparing the between-group mean square and within-group mean square, as well as their ratio (F statistic), whether there are significant differences among different groups can be determined. From Figure 9a,b, it can be observed that the features exhibit discrepancies across different categories, with the contrast feature showing the most significant disparity. Considering the importance ranking in Figure 9, it can be concluded that the “contrast” feature exhibits the highest correlation with classification outcomes.

3.1.3. Maize Seed Morphological Feature Classification Model Based on GWO-RF

The normalized morphological features data of all maize seeds, along with the selected features, were input into the GWO-RF model. The dataset was split into a training set and a test set at a ratio of 7:3 for subsequent analysis. The GWO algorithm was executed up to a maximum of 30 iterations, with a population size of 10. Concerning the hyperparameters of the RF model, the range of n_estimators was set from 1 to 50, while the range of max_features was set from 1 to 100. After a finite number of iterations, the optimal fitness was attained, giving rise to the optimal values of n_estimators and max_features for the classification model. The performance of the classification model is presented in the following Table 2.
Table 2 shows that the feature selection outcomes of the RFE algorithm surpass those of SFM, with a slight enhancement in the classification results achieved by reducing the input features by approximately one-third compared to the classification results attained by inputting all of the morphological features. These findings suggest that feature selection can enhance the classification effectiveness of the algorithm. Due to the high level of similarity in the external appearance of maize seeds, there may be overlaps or blurred boundaries between certain categories, which makes it challenging for models to accurately distinguish them. Consequently, some categories may be confused, which illustrates the limitations of relying solely on morphological characteristics for classification, especially when dealing with a large number of categories. Therefore, it is essential to incorporate more comprehensive and diverse seed data, such as spectral data, to enrich the features and improve the classification accuracy.

3.2. Construction of a Classification Model for Hyperspectral Data of Maize Seeds

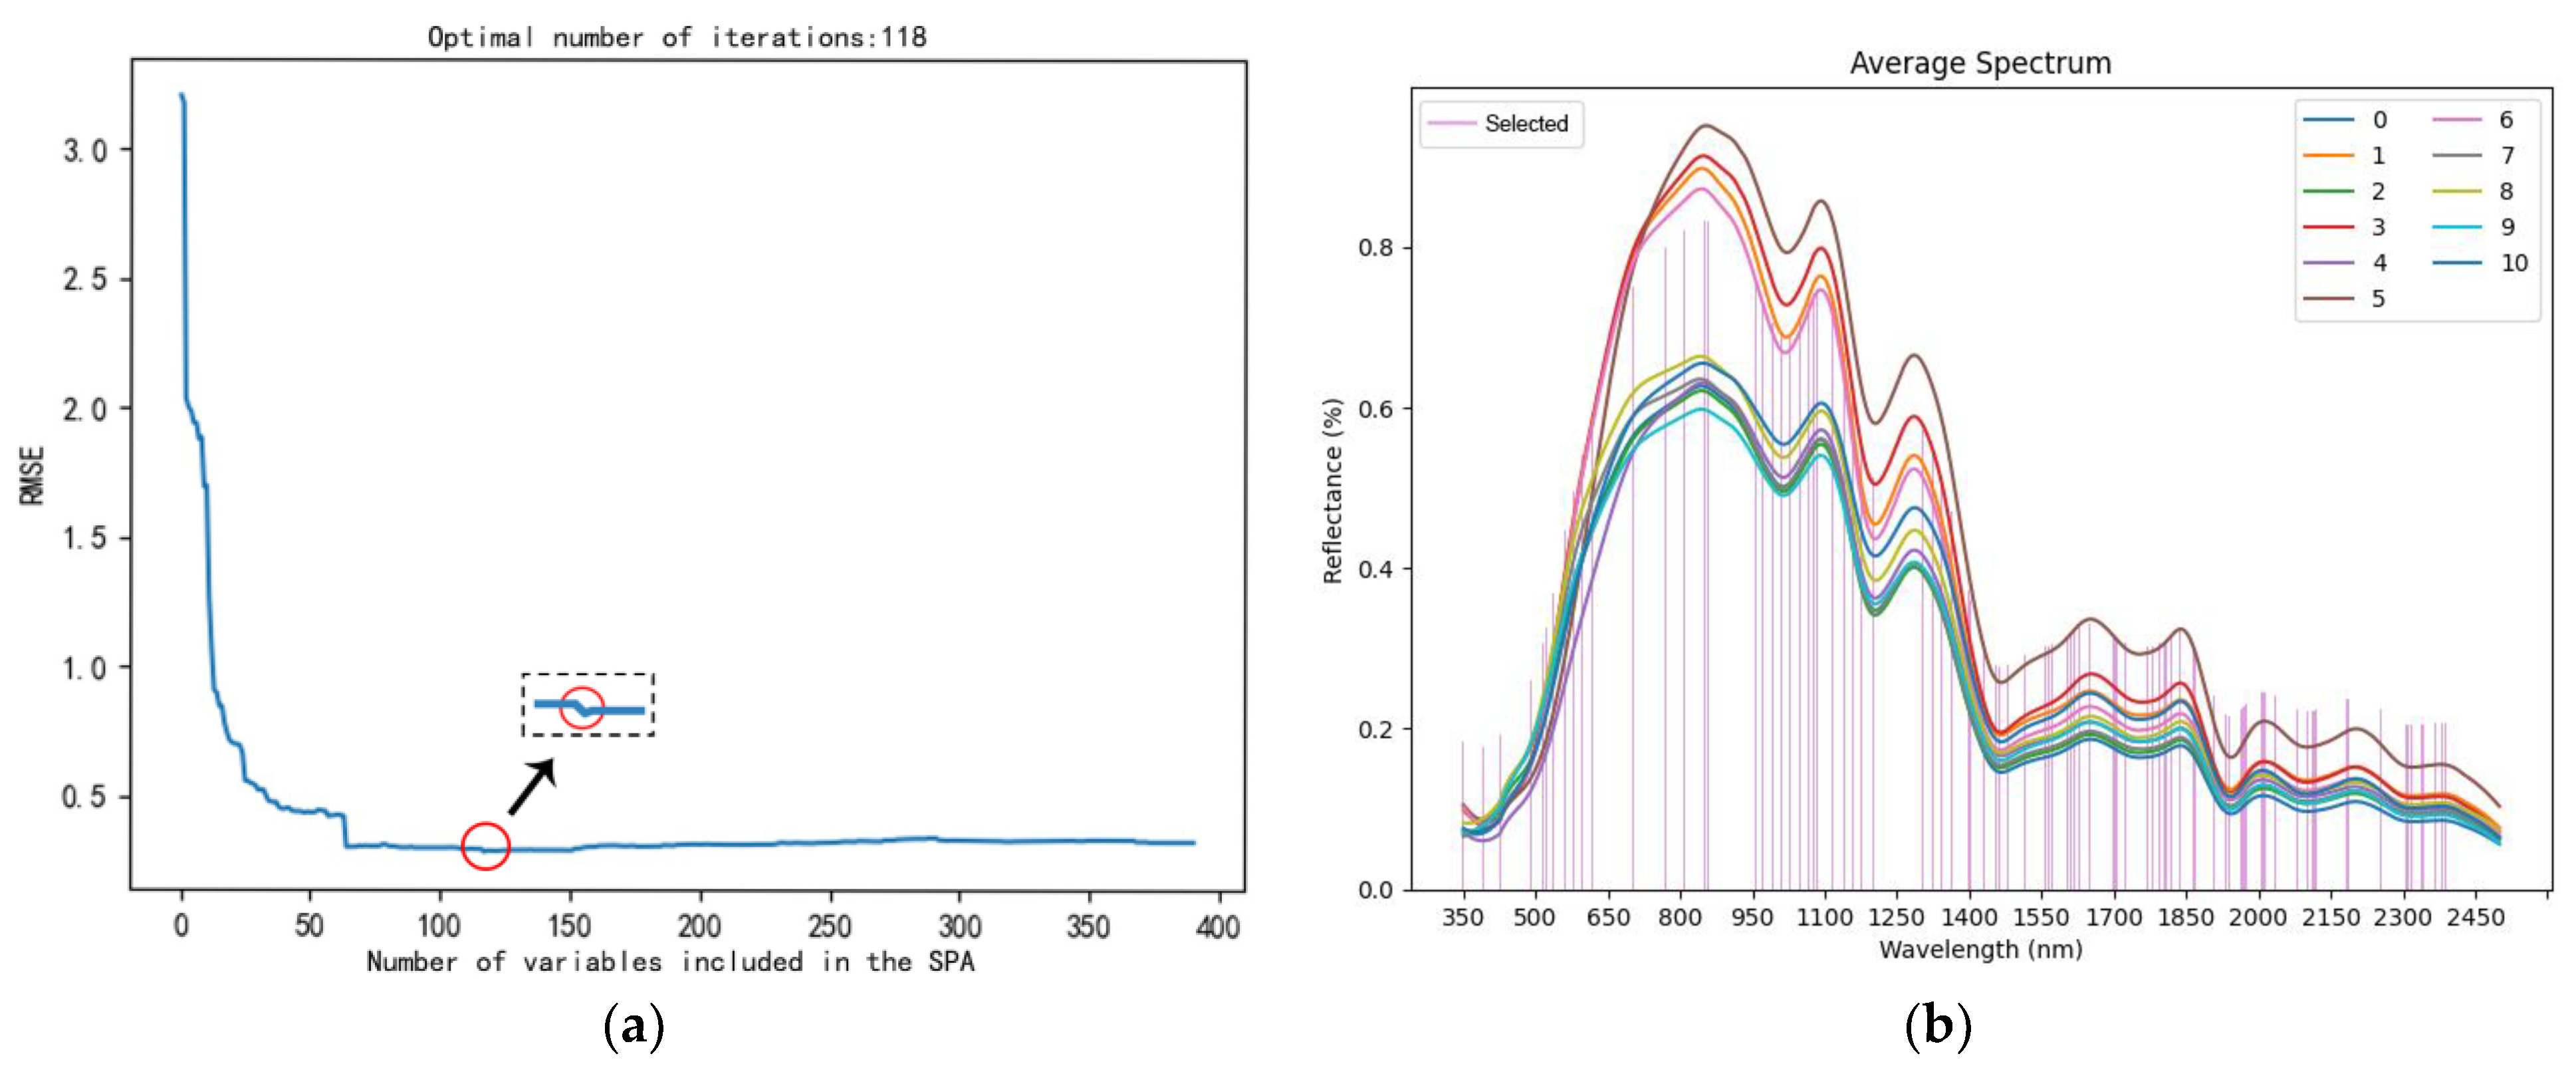
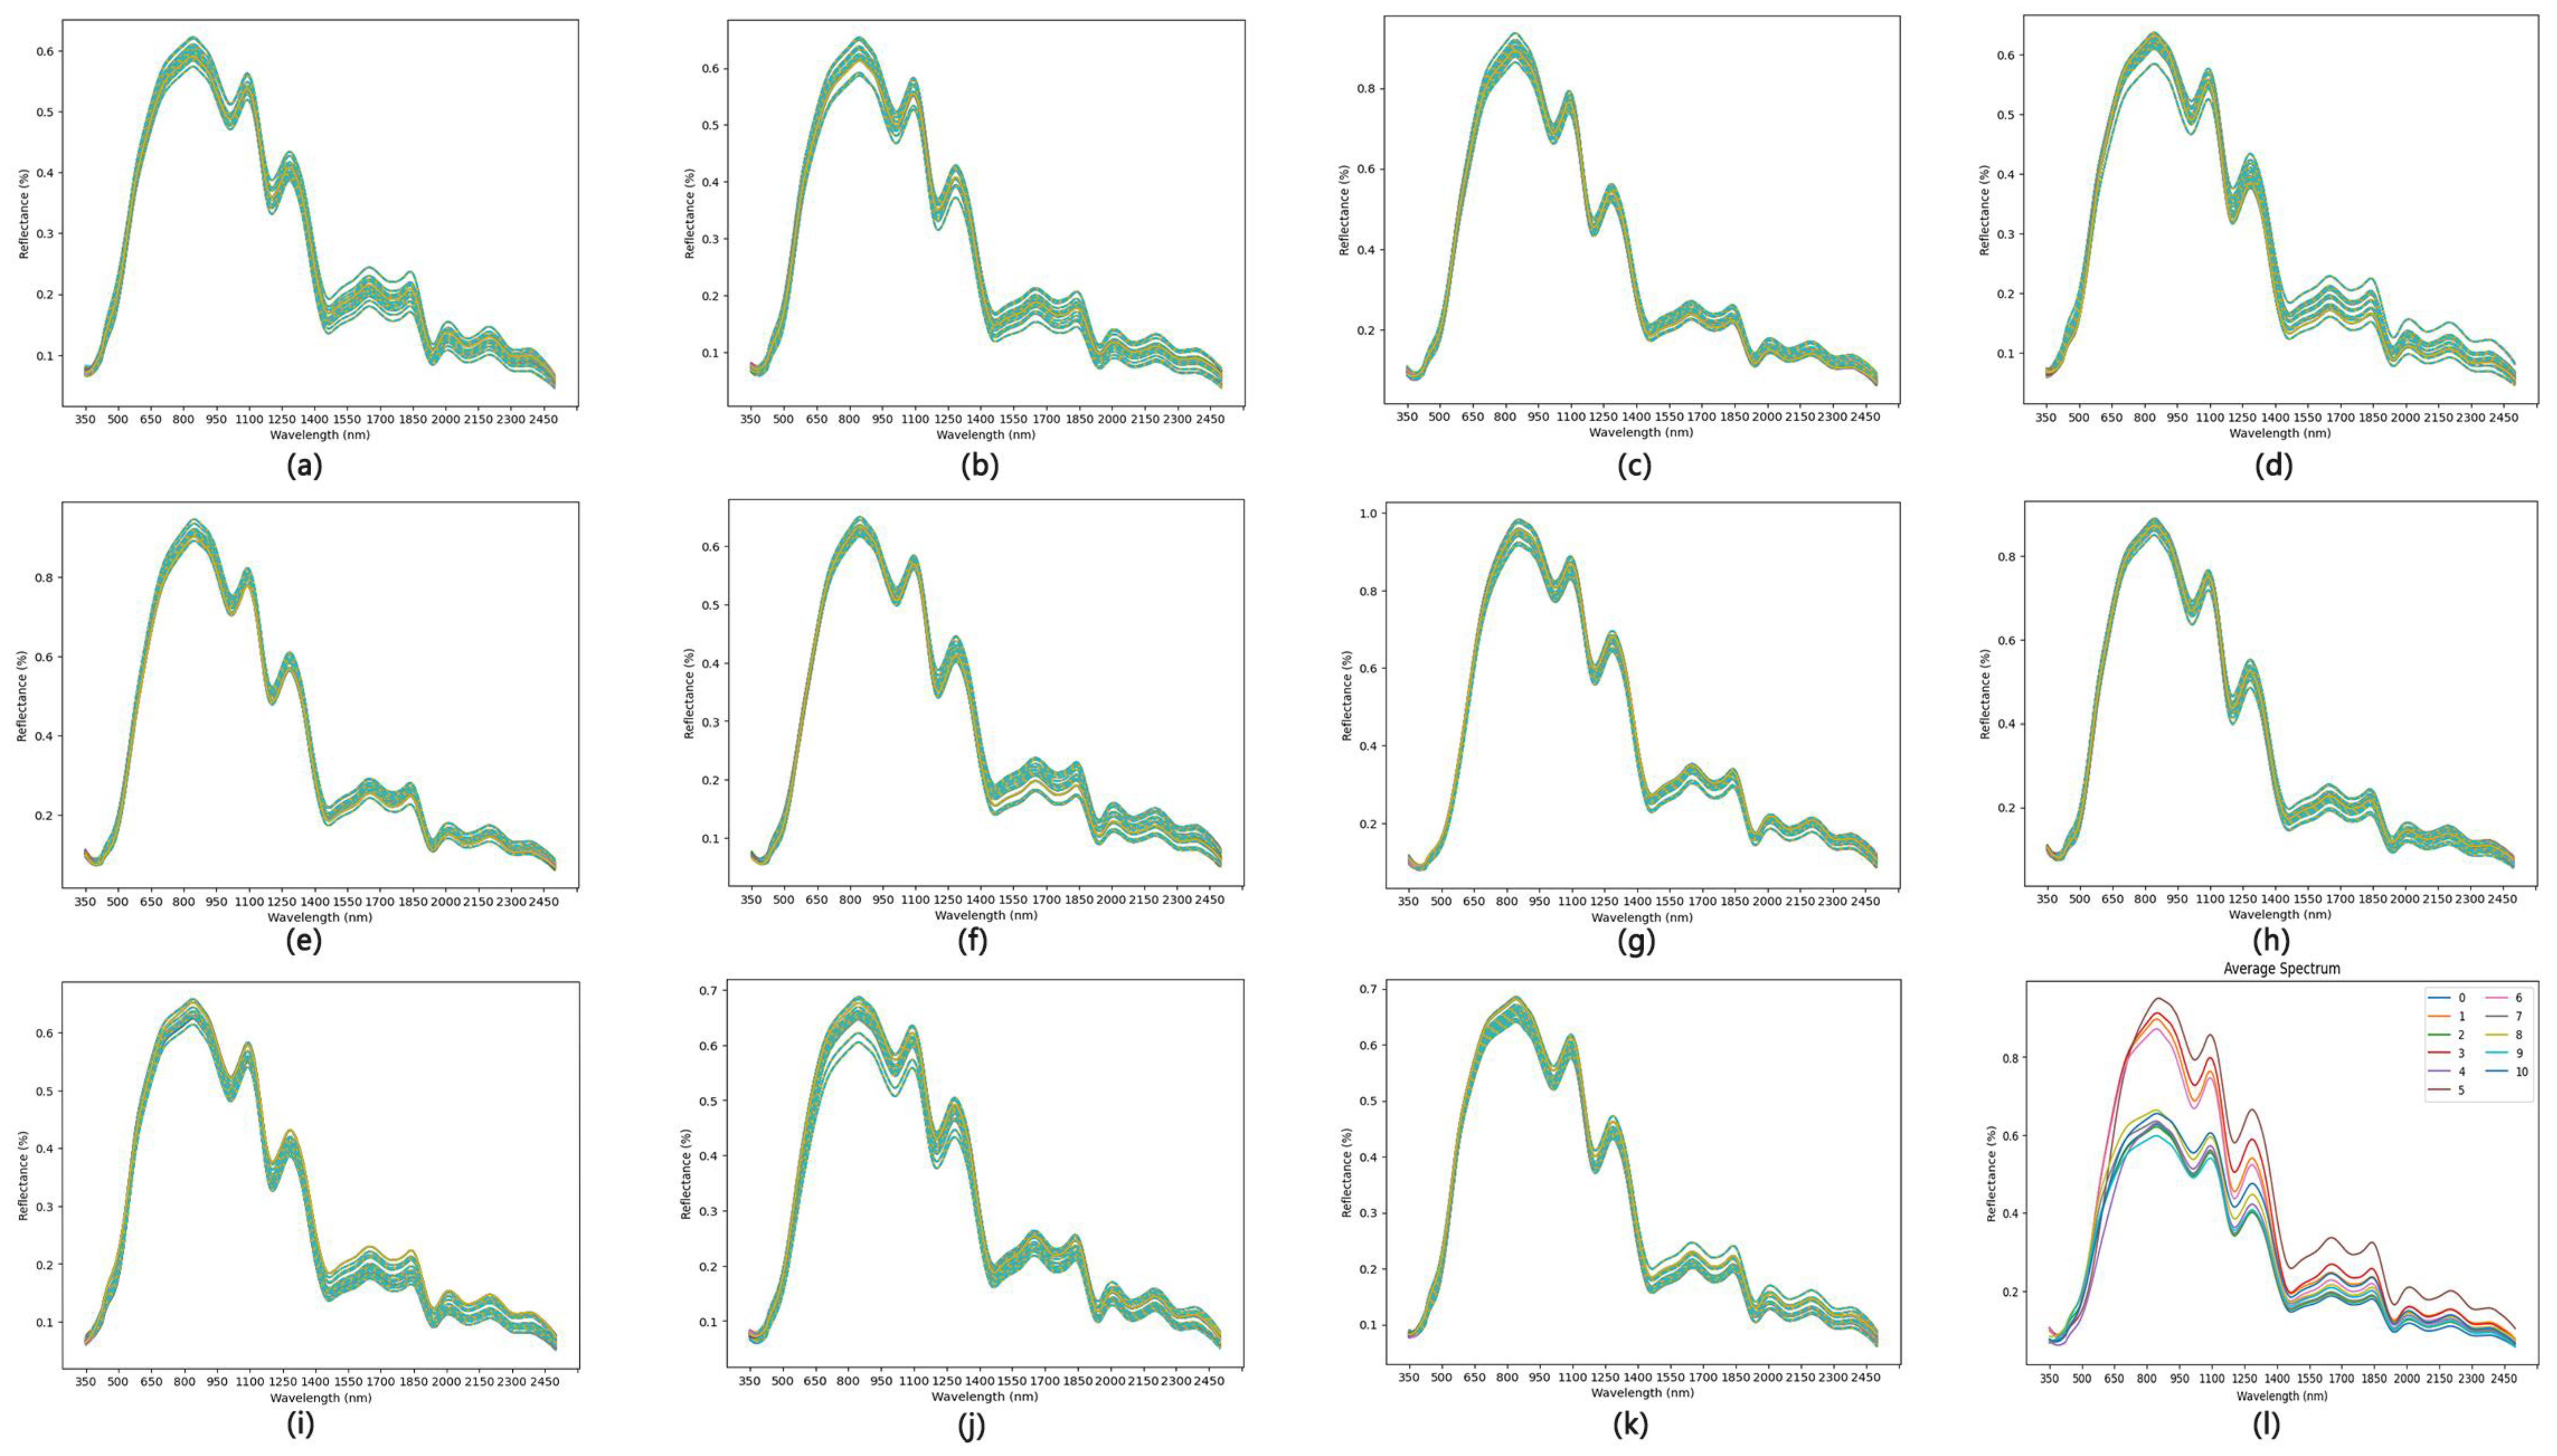
3.2.1. Spectral Curve Analysis

Figure 10 shows the spectral curves and average spectra of all varieties, with a total of 150 seeds per category. The images show that the maize seeds have a broad near-infrared spectral distribution, but the general trend of the spectral curves is similar for all the varieties, with noticeable peaks around 863 nm, 1105 nm, 1295 nm, 1680 nm, and 2015 nm, and noticeable valleys around 980 nm, 1175 nm, 1450 nm, 1780 nm, and 1915 nm. It is apparent that differences in the absorption intensities of the C-H, N-H, and O-H-containing groups present in the organic components within the aforementioned spectral range reflect variations in the protein content, fat content, and carbohydrate content among different maize varieties. Therefore, these distinctions serve as the fundamental basis for seed classification using hyperspectral data in agricultural applications.
The SG smoothing algorithm is utilized to process the spectral curve, effectively reducing the impact of noise. Figure 11 shows the processed spectrum, showcasing a marked improvement in eliminating the original spectral curve’s noise and baseline drift. As discussed in Section 2.3.2, the SG smoothing algorithm achieves this by segmenting the data into multiple windows and fitting polynomials to generate a smoothed curve, thereby eliminating noise and signal interference. Consequently, there is a discernible enhancement in the spectrum and data correlation. This approach significantly enhances the signal-to-noise ratio of the spectral peaks while effectively mitigating the impact of noise.

3.2.2. Selection of Hyperspectral Feature Bands Using SPA and CARS

Due to the presence of collinear spectral bands in the hyperspectral data, there is significant redundancy, resulting in an increased model training time and reduced accuracy. Therefore, it is necessary to select feature bands prior to inputting the data into the model in order to mitigate the impact of redundant bands on the model.
(1)
SPA
The Successive Projections Algorithm (SPA) is an iterative search algorithm that aims to minimize the linear relationship between each newly selected feature and the previously selected features. As a result, it effectively reduces data complexity, maximizes the inclusion of relevant information, minimizes interference from irrelevant information, and decreases data redundancy. The SPA can identify the optimal combination of feature wavelengths for spectral analysis. Therefore, the SPA was employed to select feature wavelengths from 2151 bands ranging from 350 nm to 2500 nm. The process of feature wavelength selection is illustrated in Figure 12. Figure 12a demonstrates that the minimum root mean square error (RMSE) is achieved when 118 feature wavelengths are selected, indicated by a red circle marking the lowest point. Figure 12b depicts the index positions of the selected feature wavelengths.
(2)
CARS
The Competitive Adaptive Reweighted Sampling (CARS) algorithm selects wavelength points with large regression coefficients to create a subset for the PLS model. It is based on the concept of “survival of the fittest” and combines Monte Carlo sampling with PLS model regression coefficients to serve as a feature variable selection method. After performing several successive ten-fold cross-validated RMSECV calculations for multiple PLS subset models, the CARS selects the subset with the smallest RMSECV as the optimal feature set. Figure 13a shows that as the number of runs increases, the selected feature wavelengths gradually decrease. The ideal feature subset is obtained after 13 runs, with marked by a red square, where traits unrelated to variety classification have been removed. Figure 13b displays the index positions of the selected 338 feature wavelengths.
Figure 12 and Figure 13 show the sets of spectral feature wavelengths selected for various maize varieties using the SPA and CARS algorithms, respectively. The SPA algorithm reduced the original 2151 bands to 118, marking a reduction of about 94.5% in feature wavelengths. On the other hand, CARS reduced the feature wavelengths to 338, representing a reduction of approximately 84.2% in feature wavelengths. This significantly decreased the input data for the model.
Figure 12. Feature band selection of maize seeds based on SPA algorithm. (a) Represents the curve of RMSE variation as the number of selected feature bands increases. (b) Represents the index corresponding to the 118 feature wavelengths.
Agronomy 14 00645 g012
Figure 13. Feature band selection of maize seeds based on CARS algorithm. (a) The RMSECV variation curve as the number of selected feature wavelengths increases. (b) The index corresponding to the 338 feature wavelengths.
Agronomy 14 00645 g013

3.2.3. Maize Seed Hyperspectral Data Classification Model Based on GWO-RF

The training and test sets were randomly selected at a 7:3 ratio from a pool of 150 samples for each category. Prior to inputting the data variables into the GWO-RF model, the selected feature bands underwent SG smoothing. The GWO setup parameters mentioned in Section 3.1.3. were used. The classification results of the model are presented in Table 3.
Table 3 demonstrates a noteworthy enhancement in the accuracy of the maize categorization model based on spectral bands. The utilization of the SPA for band extraction results in optimal outcomes for the model. This indicates that the selection of spectral bands plays a crucial role in improving model accuracy and can be leveraged to identify the most relevant bands for feature extraction, thereby enhancing the overall maize classification accuracy. Consequently, the spectral information of the seeds can be effectively utilized as supplementary data to enrich the feature information of the samples through feature fusion, leading to further improvements in the model’s recognition accuracy.

3.3. Construction of a Maize Seed Classification Model Based on GWO-RF Feature Fusion

According to the previous description, it is known that spectral bands can reflect the selectivity of the reflection, absorption, and transmission of incident radiation among different varieties of maize. Additionally, the morphological features of seeds can provide insights into their surface properties, as well as structural and organizational changes that are not visible to the naked eye. Therefore, integrating morphological data with spectral data can offer richer feature information for model training. Consequently, the morphological features selected through RFE and SFM, in combination with the 118 feature wavelength combinations chosen by SPA and the 338 feature wavelength combinations chosen by CARS, were fused and incorporated into the classification model for maize seed categorization based on their varieties. Table 4 demonstrates the classification results.
It can be observed from Table 4 that incorporating results from RFE and SPA into the GWO-RF model leads to the most superior classification performance for different varieties of maize seeds, achieving the highest accuracy among the four combinations. Moreover, in comparison to fusing all seed morphological features and the complete spectral information, there is a notable 7.5% enhancement in accuracy. This indicates that information fusion can effectively reduce misclassifications and greatly improve detection outcomes. In contrast to the misclassification issues encountered in spectral band and image feature classification models, the fusion model maximizes the utilization of information from diverse data sources due to the complementary and correlated nature of image and spectral features. This significantly enriches the information content of the model, boosting the classification accuracy and stability.

3.4. Classification Model of Maize Seeds Based on Improved Grey Wolf Optimization Algorithm

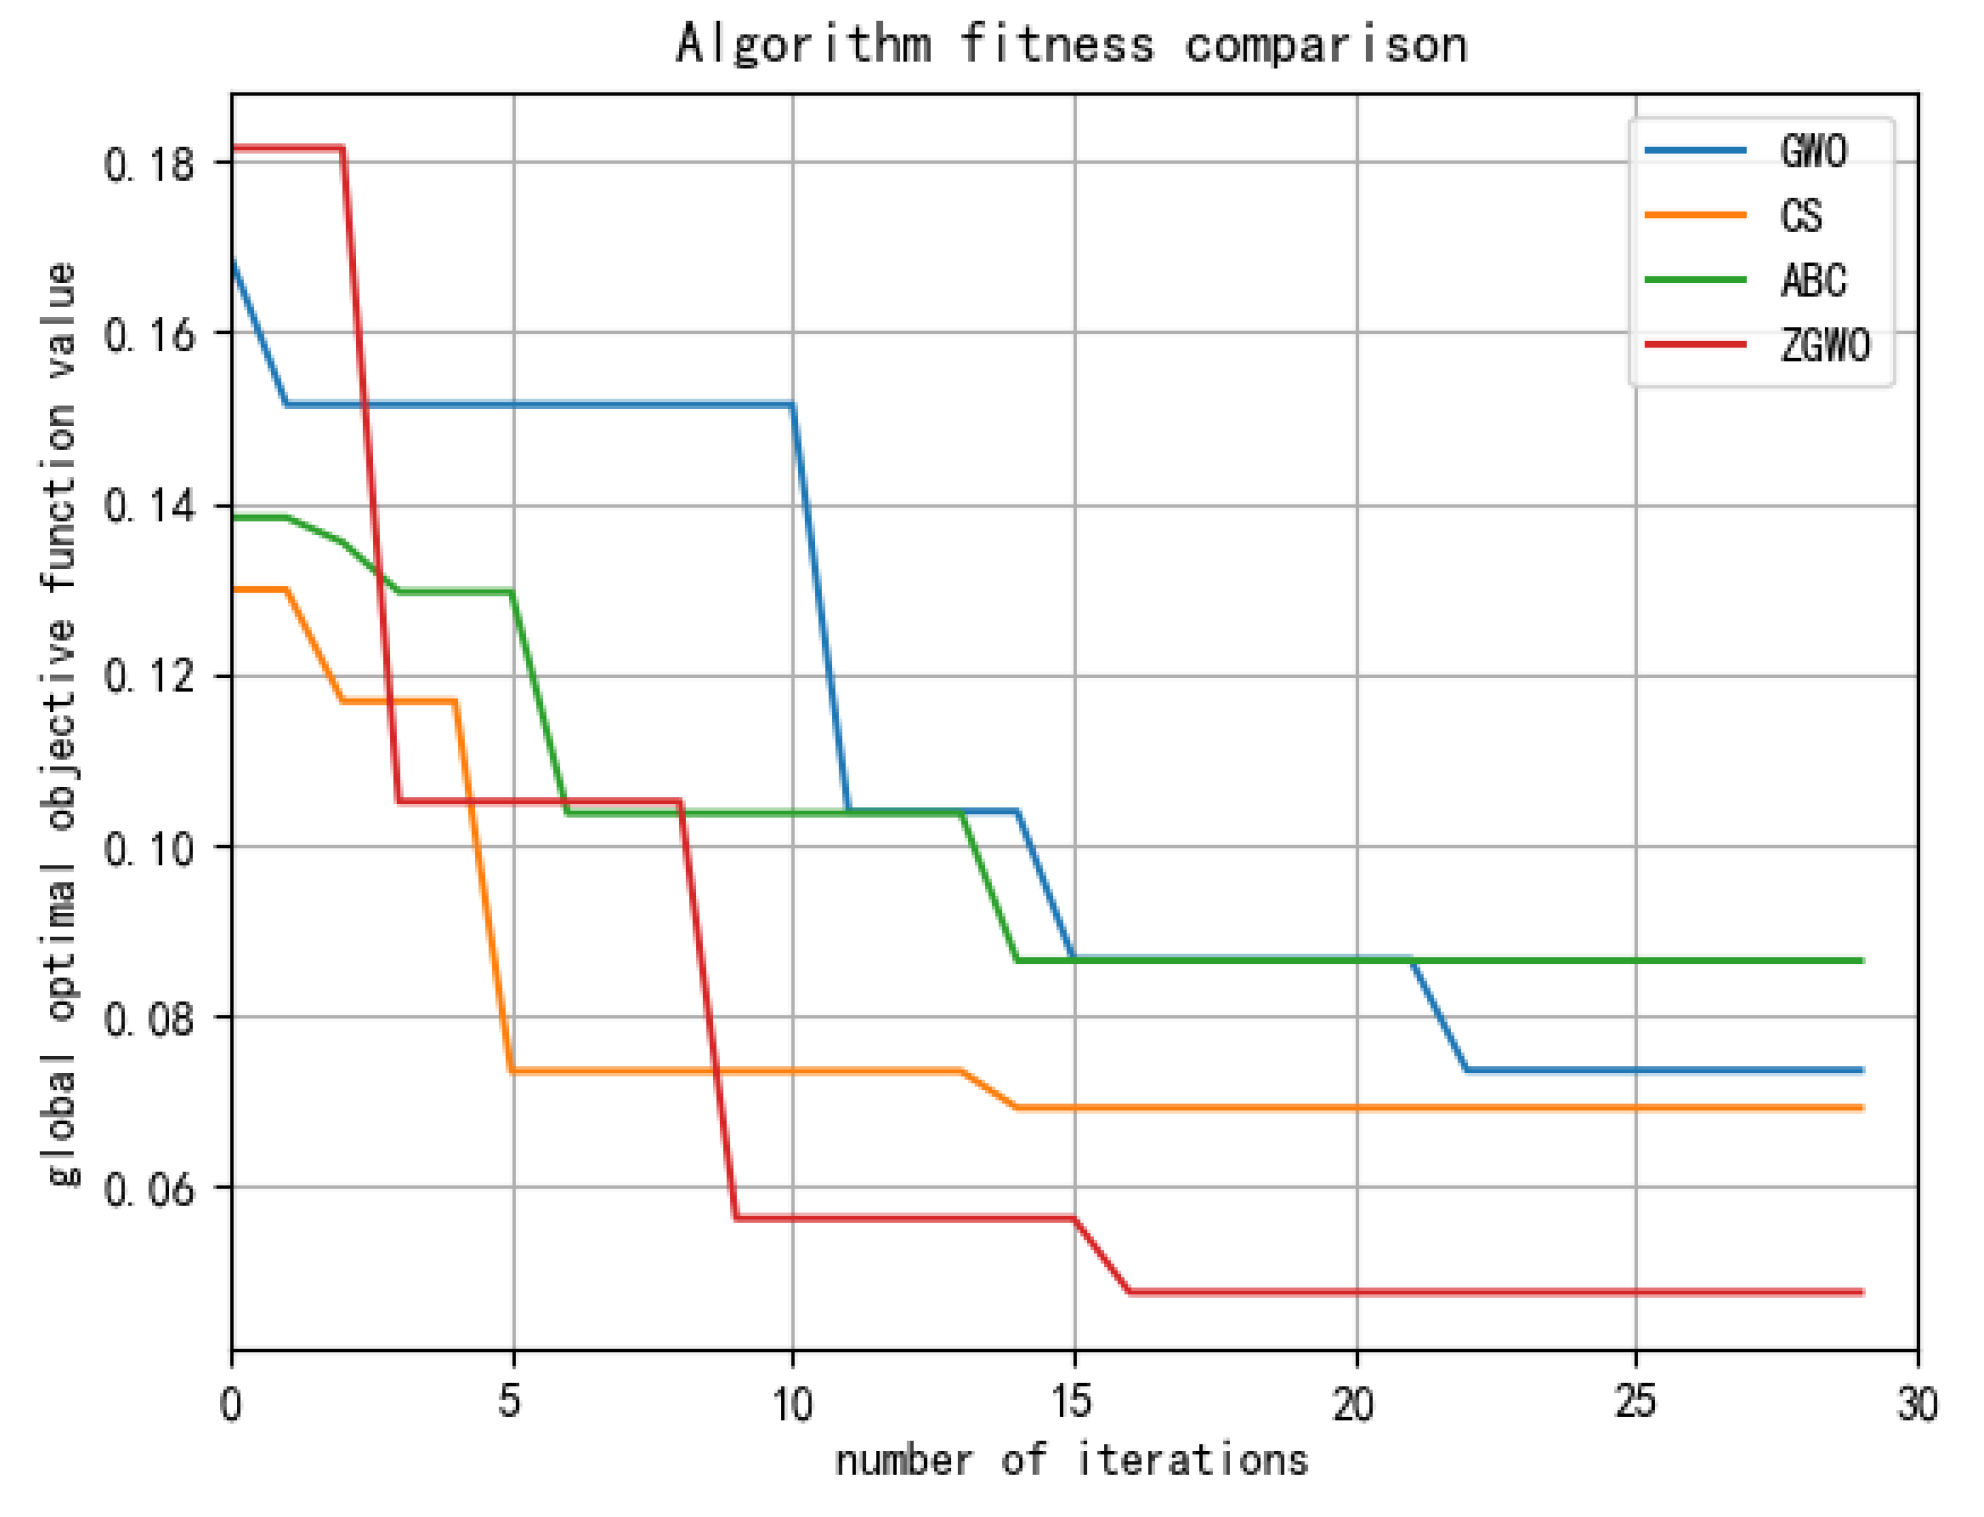
3.4.1. The Comparative Experimental Analysis

During the model training and testing, the optimal feature fusion combination was divided into a training set and a test set at a ratio of 7:3. To assess the effectiveness of the ZGWO-RF model, the optimal feature combinations were classified using the RF model and Grey Wolf Optimization (GWO), Artificial Bee Colony (ABC), and Cuckoo Search (CS) algorithms for academic refinement. The RF model’s default parameters were utilized, with n_estimators set to 100 and max_features selected as “sqrt”. The results are demonstrated in Table 5.
Based on the comparative experimental results presented in Table 6, it becomes apparent that the ZGWO-RF model outperforms the other four models, achieving the highest accuracy rate of 95.9%. This reflects a notable 2.6% improvement in accuracy when compared to the GWO-RF model, and it also demonstrates a relatively favorable level of accuracy compared to the ABC and CS models. For the default RF model, there is also a significant improvement in accuracy. In terms of precision, the ZGWO-RF model shows a 2.1% increase over the GWO-RF model on the dataset. Additionally, in terms of recall, the ZGWO-RF model demonstrates improvements compared to other models on the dataset. In Figure 14, a comparison is presented on the convergence and fitness of four algorithms by leveraging the best fitness value from each algorithm for performance assessment. The fitness metric is computed based on the error rate, with lower values indicating the improved predictive performance of the algorithm. It is evident that the ABC, CS, and GWO algorithms converge towards local optima, highlighting the superior search capability of ZGWO.
Table 6 presents the results of utilizing the complete feature combination model as an input feature. The comparison clearly indicates that the outcomes of the best combination, achieved through feature selection, outperform those of the entire set of features. This suggests that model categorization benefits from the outcomes of feature selection.

3.4.2. Analysis of Classification Results

Table 7 shows a comparison between the classification results based on the morphological, hyperspectral and morphological–hyperspectral fusion features after feature selection, as well as the classification results based on ZGWO-RF. It can be observed that the fusion of morphological and spectral features outperforms the others in terms of classification accuracy. This indicates that by fusing morphological and spectral features, the model’s performance can be enhanced. The synergistic effect of combining morphological and spectral features confirms that the classification model comprehensively utilizes different feature information. This fusion strategy enables the model to better differentiate between different types of maize seeds, thereby improving accuracy. Furthermore, it visually demonstrates that the proposed ZGWO algorithm exhibits good performance in practical seed classification tasks, affirming the algorithm’s high effectiveness and potential in seed classification problems.

3.4.3. Confusion Matrix

The confusion matrix is a tool widely used in machine learning to compare the performance of supervised learning models in classification tasks. Each column of the confusion matrix represents the predicted class, while each row represents the actual class. This study conducts a comparative analysis of the confusion matrix to showcase the actual recognition of each variety by the ZGWO-RF model, as depicted in Figure 15, to illustrate the model’s performance. Due to the similarities in characteristics among seeds of different varieties, there may be instances of misclassification, such as with JiDan 83 and JiDan 436. However, overall, the model demonstrates high accuracy and recognition abilities. This indicates that the ZGWO-RF model performs exceptionally well in classifying 11 different maize seed varieties, even yielding satisfactory results for highly similar seeds. It can provide new ideas for future non-destructive seed identification.

4. Conclusions

The purity of varieties serves as a crucial factor in evaluating the quality of maize seeds, with far-reaching implications for the final yield and economic benefits for farmers. As different maize varieties are suitable for different soil types, the purity of maize seeds directly impacts quality and yield, with a decrease in purity leading to a decline in both quality and yield. Therefore, the classification of seed varieties holds significant importance.
Due to the less distinct differences in morphological features among some maize seeds within the same series, the classification performance based on morphological features is not satisfactory. However, the spectra of different categories of maize seeds exhibit noticeable variations, which can effectively compensate for this issue. This research makes two main contributions: the improvement of the GWO algorithm and its application in a classification model, reducing the randomness and subjectivity of manual parameter tuning. Based on the morphological dataset and spectral dataset of maize varieties, a feature-fused GWO-RF classification model is constructed. The results demonstrate that the fusion of spectral and morphological data significantly enhances the classification accuracy of the model. By employing feature selection, the accuracy on the test set reaches 93.3%, exhibiting a remarkable improvement compared to both the morphological dataset and the spectral dataset alone. This indicates the effectiveness of the multi-source data fusion approach combining spectral features and morphological data, which compensates for the limitations of individual feature information and fully exploits the advantages of different features to enhance the performance of the classification model.
The ZGWO algorithm is introduced by incorporating the implementation of chaotic mapping through reverse learning and a position perturbation strategy. Comparative analysis reveals that the ZGWO-RF model exhibits a notable 2.65% increase in accuracy on the test set, surpassing the performance of the GWO-RF model. The findings of this study indicate the efficacy of the fusion model, integrating morphological information and spectral features, in significantly enhancing the classification precision of eleven categories of maize seeds. Moreover, the utilization of the ZGWO algorithm demonstrates its effectiveness in optimization. By reducing manual testing, the selection time, and economic costs, this research methodology holds paramount importance for the swift classification of seeds in agricultural breeding.
In future studies, a broader spectrum of morphological information will be selected to enrich the model features, thereby accentuating the distinctions between different categories. Concurrently, variables including the year of cultivation, seed aging, frost damage, and mold infestation will be integrated to develop a more comprehensive maize seed classification model.

Author Contributions

Conceptualization, C.B., L.S. and S.Z.; methodology, C.B, L.S. and S.Z.; software, C.B. and S.Z.; validation, C.B., S.Z. and H.C.; formal analysis, S.Z. and J.L.; investigation, H.C., X.B. and H.X.; resources, C.B.; data curation, H.Y.; writing—original draft preparation, S.S., C.B. and S.Z.; writing—review and editing, S.S., H.Y., C.B., L.S., S.Z., H.C., X.B., J.L. and H.X.; visualization, S.S., C.B., S.Z. and H.X.; supervision, C.B.; project administration, S.S. and C.B.; funding acquisition, S.S. and C.B. All authors have read and agreed to the published version of the manuscript.

Funding

This research was funded by the Science and Technology Development Program of Jilin Province: The “Cloud Brain” Technology and Platform for Unmanned Corn Operation (20220202032NC), the Natural Science Foundation of Jilin Province (No.2020122348JC) and Innovation Capacity Project on Development and Reform Commission of Jilin Province (2020C019-6).

Data Availability Statement

Data are available from the author upon reasonable request.

Acknowledgments

The authors would like to thank the Jilin Agricultural University and Jilin Engineering Normal University for their help with the provision of experimental equipment for this study.

Conflicts of Interest

The authors declare no conflicts of interest.

References

  1. Kumar, C.; Mubvumba, P.; Huang, Y.; Dhillon, J.; Reddy, K. Multi-Stage Corn Yield Prediction Using High-Resolution UAV Multispectral Data and Machine Learning Models. Agronomy 2023, 13, 1277. [Google Scholar] [CrossRef]
  2. Wang, S.; Liu, C.; Han, L.; Li, T.; Yang, G.; Chen, T. Corn Grain or Corn Silage: Effects of the Grain-to-Fodder Crop Conversion Program on Farmers&rsquo; Income in China. Agriculture 2022, 12, 976. [Google Scholar] [CrossRef]
  3. Shah, A.N.; Tanveer, M.; Abbas, A.; Yildirim, M.; Shah, A.A.; Ahmad, M.I.; Wang, Z.W.; Sun, W.W.; Song, Y.H. Combating Dual Challenges in Maize Under High Planting Density: Stem Lodging and Kernel Abortion. Front. Plant Sci. 2021, 12, 699085. [Google Scholar] [CrossRef]
  4. Cui, Y.J.; Xu, L.J.; An, D.; Liu, Z.; Gu, J.C.; Li, S.M.; Zhang, X.D.; Zhu, D.H. Identification of maize seed varieties based on near infrared reflectance spectroscopy and chemometrics. Int. J. Agric. Biol. Eng. 2018, 11, 177–183. [Google Scholar] [CrossRef]
  5. Yang, S.; Zhu, Q.B.; Huang, M.; Qin, J.W. Hyperspectral Image-Based Variety Discrimination of Maize Seeds by Using a Multi-Model Strategy Coupled with Unsupervised Joint Skewness-Based Wavelength Selection Algorithm. Food Anal. Methods 2017, 10, 424–433. [Google Scholar] [CrossRef]
  6. Wang, H.; Wang, K.; Wu, J.Z.; Han, P. Progress in Research on Rapid and Non-Destructive Detection of Seed Quality Based on Spectroscopy and Imaging Technology. Spectrosc. Spectr. Anal. 2021, 41, 52–59. [Google Scholar]
  7. Ali, A.; Qadri, S.; Mashwani, W.K.; Belhaouari, S.B.; Naeem, S.; Rafique, S.; Jamal, F.; Chesneau, C.; Anam, S. Machine learning approach for the classification of corn seed using hybrid features. Int. J. Food Prop. 2020, 23, 1110–1124. [Google Scholar] [CrossRef]
  8. Zhu, D.Z.; Wang, C.; Pang, B.S.; Shan, F.H.; Wu, Q.; Zhao, C.J. Identification of Wheat Cultivars Based on the Hyperspectral Image of Single Seed. J. Nanoelectron. Optoelectron. 2012, 7, 167–172. [Google Scholar] [CrossRef]
  9. Lesiak, A.D.; Cody, R.B.; Dane, A.J.; Musah, R.A. Plant Seed Species Identification from Chemical Fingerprints: A High-Throughput Application of Direct Analysis in Real Time Mass Spectrometry. Anal. Chem. 2015, 87, 8748–8757. [Google Scholar] [CrossRef]
  10. Setimela, P.S.; Warburton, M.L.; Erasmus, T. DNA fingerprinting of open-pollinated maize seed lots to establish genetic purity using simple sequence repeat markers. S. Afr. J. Plant Soil 2016, 33, 141–148. [Google Scholar] [CrossRef]
  11. Liu, S.X.; Zhang, H.J.; Wang, Z.; Zhang, C.Q.; Li, Y.; Wang, J.X. Determination of maize seed purity based on multi-step clustering. Appl. Eng. Agric. 2018, 34, 659–665. [Google Scholar] [CrossRef]
  12. Xu, P.; Tan, Q.; Zhang, Y.P.; Zha, X.T.; Yang, S.M.; Yang, R.B. Research on Maize Seed Classification and Recognition Based on Machine Vision and Deep Learning. Agriculture 2022, 12, 232. [Google Scholar] [CrossRef]
  13. Wang, L.X.; Liu, L.H.; Zhang, F.T.; Li, H.B.; Pang, B.S.; Zhao, C.P. Detecting seed purity of wheat varieties using microsatellite markers based on eliminating the influence of non-homozygous loci. Seed Sci. Technol. 2014, 42, 393–413. [Google Scholar] [CrossRef]
  14. Zhang, L.; Wang, D.; Liu, J.C.; An, D. Vis-NIR hyperspectral imaging combined with incremental learning for open world maize seed varieties identification. Comput. Electron. Agric. 2022, 199, 107153. [Google Scholar] [CrossRef]
  15. Huang, S.; Fan, X.F.; Sun, L.; Shen, Y.L.; Suo, X.S. Research on Classification Method of Maize Seed Defect Based on Machine Vision. J. Sens. 2019, 2019, 2716975. [Google Scholar] [CrossRef]
  16. Yasmin, J.; Lohumi, S.; Ahmed, M.R.; Kandpal, L.M.; Faqeerzada, M.A.; Kim, M.S.; Cho, B.K. Improvement in Purity of Healthy Tomato Seeds Using an Image-Based One-Class Classification Method. Sensors 2020, 20, 2690. [Google Scholar] [CrossRef] [PubMed]
  17. Yang, X.L.; Hong, H.M.; You, Z.H.; Cheng, F. Spectral and Image Integrated Analysis of Hyperspectral Data for Waxy Corn Seed Variety Classification. Sensors 2015, 15, 15578–15594. [Google Scholar] [CrossRef] [PubMed]
  18. ElMasry, G.; Mandour, N.; Wagner, M.H.; Demilly, D.; Verdier, J.; Belin, E.; Rousseau, D. Utilization of computer vision and multispectral imaging techniques for classification of cowpea (Vigna unguiculata) seeds. Plant Methods 2019, 15, 24. [Google Scholar] [CrossRef]
  19. Ma, R.; Wang, J.; Zhao, W.; Guo, H.J.; Dai, D.N.; Yun, Y.L.; Li, L.; Hao, F.Q.; Bai, J.Q.; Ma, D.X. Identification of Maize Seed Varieties Using MobileNetV2 with Improved Attention Mechanism CBAM. Agriculture 2023, 13, 11. [Google Scholar] [CrossRef]
  20. Bodor, Z.; Majadi, M.; Benedek, C.; Zaukuu, J.L.Z.; Bálint, M.V.; Csobod, E.C.; Kovacs, Z. Detection of Low-Level Adulteration of Hungarian Honey Using near Infrared Spectroscopy. Chemosensors 2023, 11, 89. [Google Scholar] [CrossRef]
  21. Barreto, L.C.; Martinez-Arias, R.; Schechert, A. Field Detection of Rhizoctonia Root Rot in Sugar Beet by Near Infrared Spectrometry. Sensors 2021, 21, 8068. [Google Scholar] [CrossRef] [PubMed]
  22. Stejskal, V.; Vendl, T.; Li, Z.H.; Aulicky, R. Efficacy of visual evaluation of insect-damaged kernels of malting barley by Sitophilus granaries from various observation perspectives. J. Stored Prod. Res. 2020, 89, 101711. [Google Scholar] [CrossRef]
  23. Cui, Y.J.; Ge, W.Z.; Li, J.; Zhang, J.W.; An, D.; Wei, Y.G. Screening of maize haploid kernels based on near infrared spectroscopy quantitative analysis. Comput. Electron. Agric. 2019, 158, 358–368. [Google Scholar] [CrossRef]
  24. Ambrose, A.; Kandpal, L.M.; Kim, M.S.; Lee, W.H.; Cho, B.K. High speed measurement of corn seed viability using hyperspectral imaging. Infrared Phys. Technol. 2016, 75, 173–179. [Google Scholar] [CrossRef]
  25. Dong, G.; Guo, J.; Wang, C.; Chen, Z.L.; Zheng, L.; Zhu, D.Z. The Classification of Wheat Varieties Based on Near Infrared Hyperspectral Imaging and Information Fusion. Spectrosc. Spectr. Anal. 2015, 35, 3369–3374. [Google Scholar]
  26. Jin, S.L.; Zhang, W.D.; Yang, P.F.; Zheng, Y.; An, J.L.; Zhang, Z.Y.; Qu, P.X.; Pan, X.P. Spatial-spectral feature extraction of hyperspectral images for wheat seed identification. Comput. Electr. Eng. 2022, 101, 108077. [Google Scholar] [CrossRef]
  27. Huang, B.A.S.; Liu, J.; Jiao, J.Y.; Lu, J.; Lv, D.J.; Mao, J.W.; Zhao, Y.J.; Zhang, Y. Applications of machine learning in pine nuts classification. Sci. Rep. 2022, 12, 8799. [Google Scholar] [CrossRef]
  28. Bao, Y.D.; Mi, C.X.; Wu, N.; Liu, F.; He, Y. Rapid Classification of Wheat Grain Varieties Using Hyperspectral Imaging and Chemometrics. Appl. Sci. 2019, 9, 4119. [Google Scholar] [CrossRef]
  29. Xu, P.; Yang, R.B.; Zeng, T.W.; Zhang, J.; Zhang, Y.P.; Tan, Q. Varietal classification of maize seeds using computer vision and machine learning techniques. J. Food Process Eng. 2021, 44, e13846. [Google Scholar] [CrossRef]
  30. Bi, C.G.; Hu, N.; Zou, Y.Q.; Zhang, S.; Xu, S.Z.; Yu, H.L. Development of Deep Learning Methodology for Maize Seed Variety Recognition Based on Improved Swin Transformer. Agronomy 2022, 12, 1843. [Google Scholar] [CrossRef]
  31. Wang, Y.; Song, S.R. Variety identification of sweet maize seeds based on hyperspectral imaging combined with deep learning. Infrared Phys. Technol. 2023, 130, 104611. [Google Scholar] [CrossRef]
  32. Duan, L.; Yan, T.Y.; Wang, J.L.; Ye, W.X.; Chen, W.; Gao, P.; Lü, X. Combine Hyperspectral Imaging and Machine Learning to Identify the Age of Cotton Seeds. Spectrosc. Spectr. Anal. 2021, 41, 3857–3863. [Google Scholar]
  33. Ye, W.C.; Luo, S.Y.; Li, J.H.; Li, Z.R.; Fan, Z.W.; Xu, H.T.; Zhao, J.; Lan, Y.B.; Deng, H.D.; Long, Y.B. Research on Classification Method of Hybrid Rice Seeds Based on the Fusion of Near-Infrared Spectra and Images. Spectrosc. Spectr. Anal. 2023, 43, 2935–2941. [Google Scholar]
  34. Yang, D.F.; Hu, J. Accurate Identification of Maize Varieties Based on Feature Fusion of Near Infrared Spectrum and Image. Spectrosc. Spectr. Anal. 2023, 43, 2588–2595. [Google Scholar]
  35. Owoyele, O.; Pal, P.; Torreira, A.V.; Probst, D.; Shaxted, M.; Wilde, M.; Senecal, P.K. Application of an automated machine learning-genetic algorithm (AutoML-GA) coupled with computational fluid dynamics simulations for rapid engine design optimization. Int. J. Engine Res. 2022, 23, 1586–1601. [Google Scholar] [CrossRef]
  36. Franco, M.A.; Krasnogor, N.; Bacardit, J. Automatic Tuning of Rule-Based Evolutionary Machine Learning via Problem Structure Identification. IEEE Comput. Intell. Mag. 2020, 15, 28–46. [Google Scholar] [CrossRef]
  37. Yang, L.; Shami, A. On hyperparameter optimization of machine learning algorithms: Theory and practice. Neurocomputing 2020, 415, 295–316. [Google Scholar] [CrossRef]
  38. Dong, G.R.; Liu, C.Y.; Liu, D.Z.; Mao, X.A. Adaptive Multi-Level Search for Global Optimization: An Integrated Swarm Intelligence-Metamodelling Technique. Appl. Sci. 2021, 11, 2277. [Google Scholar] [CrossRef]
  39. Mashwani, W.K.; Hamdi, A.; Jan, M.A.; Göktas, A.; Khan, F. Large-scale global optimization based on hybrid swarm intelligence algorithm. J. Intell. Fuzzy Syst. 2020, 39, 1257–1275. [Google Scholar] [CrossRef]
  40. Tang, J.; Liu, G.; Pan, Q.T. A Review on Representative Swarm Intelligence Algorithms for Solving Optimization Problems: Applications and Trends. IEEE/CAA J. Autom. Sin. 2021, 8, 1627–1643. [Google Scholar] [CrossRef]
  41. Yildirim, S.; Kaya, Y.; Kiliç, F. A modified feature selection method based on metaheuristic algorithms for speech emotion recognition. Appl. Acoust. 2021, 173, 107721. [Google Scholar] [CrossRef]
  42. Xie, X.J.; Xia, F.; Wu, Y.F.; Liu, S.Y.; Yan, K.; Xu, H.L.; Ji, Z.W. A Novel Feature Selection Strategy Based on Salp Swarm Algorithm for Plant Disease Detection. Plant Phenomics 2023, 2023, 39. [Google Scholar] [CrossRef]
  43. Belge, E.; Altan, A.; Hacioglu, R. Metaheuristic Optimization-Based Path Planning and Tracking of Quadcopter for Payload Hold-Release Mission. Electronics 2022, 11, 1208. [Google Scholar] [CrossRef]
  44. Hamdi, M.; Hilali-Jaghdam, I.; Khayyat, M.M.; Elnaim, B.M.E.; Abdel-Khalek, S.; Mansour, R.F. Chicken Swarm-Based Feature Subset Selection with Optimal Machine Learning Enabled Data Mining Approach. Appl. Sci. 2022, 12, 6787. [Google Scholar] [CrossRef]
  45. Shao, C.X.; Cheng, F.X.; Mao, S.; Hu, J. Vehicle Intelligent Classification Based on Big Multimodal Data Analysis and Sparrow Search Optimization. Big Data 2022, 10, 547–558. [Google Scholar] [CrossRef] [PubMed]
  46. Bedolla-Ibarra, M.G.; Cabrera-Hernandez, M.D.; Aceves-Fernández, M.A.; Tovar-Arriaga, S. Classification of attention levels using a Random Forest algorithm optimized with Particle Swarm Optimization. Evol. Syst. 2022, 13, 687–702. [Google Scholar] [CrossRef]
  47. Dogan, M.; Taspinar, Y.S.; Cinar, I.; Kursun, R.; Ozkan, I.A.; Koklu, M. Dry bean cultivars classification using deep cnn features and salp swarm algorithm based extreme learning machine. Comput. Electron. Agric. 2023, 204, 107575. [Google Scholar] [CrossRef]
  48. Colmer, J.; O’Neill, C.M.; Wells, R.; Bostrom, A.; Reynolds, D.; Websdale, D.; Shiralagi, G.; Lu, W.; Lou, Q.J.; Le Cornu, T.; et al. SeedGerm: A cost-effective phenotyping platform for automated seed imaging and machine-learning based phenotypic analysis of crop seed germination. New Phytol. 2020, 228, 778–793. [Google Scholar] [CrossRef]
  49. Carles, S.; Lamhamedi, M.S.; Beaulieu, J.; Stowe, D.C.; Colas, F.; Margolis, H.A. Genetic Variation in Seed Size and Germination Patterns and their Effect on White Spruce Seedling Characteristics. Silvae Genet. 2009, 58, 152–161. [Google Scholar] [CrossRef]
  50. Neuweiler, J.E.; Maurer, H.P.; Würschum, T. Long-term trends and genetic architecture of seed characteristics, grain yield and correlated agronomic traits in triticale (×Triticosecale Wittmack). Plant Breed. 2020, 139, 717–729. [Google Scholar] [CrossRef]
  51. Bhargava, A.; Bansal, A. Fruits and vegetables quality evaluation using computer vision: A review. J. King Saud Univ.-Comput. Inf. Sci. 2021, 33, 243–257. [Google Scholar] [CrossRef]
  52. Mirjalili, S.; Mirjalili, S.M.; Lewis, A. Grey Wolf Optimizer. Adv. Eng. Softw. 2014, 69, 46–61. [Google Scholar] [CrossRef]
  53. Probst, P.; Wright, M.N.; Boulesteix, A.L. Hyperparameters and tuning strategies for random forest. Wiley Interdiscip. Rev.-Data Min. Knowl. Discov. 2019, 9, e1301. [Google Scholar] [CrossRef]
Figure 1. Sample of maize seeds. (a) JiDan 27; (b) JiDan 50; (c) JiDan 83, (d) JiDan 209, (e) JiDan 407; (f) JiDan 436; (g) JiDan 505; (h) JiDan 626; (i) JiDan 953; (j) LY9915; (k) ZhengDan 958.
Agronomy 14 00645 g001
Figure 2. Seed image data acquisition schematic.
Agronomy 14 00645 g002
Figure 3. Schematic of seed hyperspectral data acquisition.
Agronomy 14 00645 g003
Figure 4. Experimental flow chart.
Agronomy 14 00645 g004
Figure 5. Extraction process of single maize seeds: (a) sample photography; (b) grayscale image; (c) Binary image; (d) seed contour image; (e) single seed mask image; (f) single seed segmentation image.
Agronomy 14 00645 g005
Figure 7. Mean values of morphological features for different seed categories: (a) mean values of geometric features; (b) mean values of texture features.
Agronomy 14 00645 g007
Figure 9. The results of ANOVA: (a) results of ANOVA for feature selection using RFE; (b) results of ANOVA for feature selection using SFM.
Agronomy 14 00645 g009
Figure 10. The original spectral curves of eleven different maize seeds and the average curve for each category: (a) JiDan 27; (b) JiDan 50; (c) JiDan 83; (d) JiDan 209; (e) JiDan 407; (f) JiDan 436; (g) JiDan 505; (h) JiDan 626; (i) JiDan 953; (j) LY 9915; (k) Zhengdan 958. (l) The average reflectance spectra of different maize seed varieties.
Agronomy 14 00645 g010
Figure 11. The preprocessed spectral curves of eleven different maize seed varieties using SG filter and the average spectral curves for each category: (a) JiDan 27; (b) JiDan 50; (c) JiDan 83; (d) JiDan 209; (e) JiDan 407; (f) JiDan 436; (g) JiDan 505; (h) JiDan 626; (i) JiDan 953; (j) LY 9915; (k) Zhengdan 958. (l) The average reflectance spectra of different maize seed varieties.
Agronomy 14 00645 g011
Figure 14. Algorithm fitness curve.
Agronomy 14 00645 g014
Figure 15. Confusion matrix of ZGWO-RF test set.
Agronomy 14 00645 g015
Table 2. The classification results of GWO-RF under morphological features.
Selection AlgorithmTraining SetTest Set
APRAPR
None0.4910.4850.4870.4750.4680.463
RFE0.4990.5190.4900.4970.4920.486
SFM0.4850.4890.4810.4890.4910.478
Table 3. Comparison results of the GWO-RF classification model under hyperspectral bands.
Selection AlgorithmTraining SetTest Set
APRAPR
None0.8760.7960.8710.8370.7740.852
SPA0.8800.9010.8780.8820.8880.884
CARS0.8760.7950.8710.8260.7670.842
Table 4. Comparative results of GWO-RF classification models under fused features.
Selection AlgorithmTraining SetTest Set
APRAPR
RFE-SPA0.9260.9150.9270.9330.9410.937
RFE-CARS0.8960.8870.8890.9150.9240.919
SFM-SPA0.8960.8950.8920.9070.9150.911
SFM-CARS0.8570.9010.8760.9050.9400.910
None0.8870.8850.8880.8580.8790.866
Table 5. Comparative results of the optimal feature combination model for classification.
ModelTraining SetTest Set
APRAPR
ZGWO-RF0.9520.9430.9510.9590.9620.961
GWO-RF0.9260.9150.9270.9330.9410.937
ABC-RF0.9130.8650.8590.870.887875
CS-RF0.9310.9230.9310.9430.9530.945
RF0.7370.8150.7600.7510.8210.741
Table 6. Comparative results of the full feature combination model for classification.
ModelTraining SetTest Set
APRAPR
ZGWO-RF0.8520.9090.8690.8970.9390.902
GWO-RF0.8870.8850.8880.8580.8770.866
ABC-RF0.8760.7710.8460.8280.7740.84
CS-RF0.8830.8770.8840.8580.8740.866
RF0.7290.8190.7180.7010.8110.726
Table 7. Comparison of classification results for different features.
Models with Different FeaturesResult
APR
Img-GWO-RF0.4970.4920.486
Hyperspectral-GWO-RF0.8820.8880.884
Fusion-GWO-RF0.9330.9410.937
Fusion-ZGWO-RF0.9590.9620.961
Disclaimer/Publisher’s Note: The statements, opinions and data contained in all publications are solely those of the individual author(s) and contributor(s) and not of MDPI and/or the editor(s). MDPI and/or the editor(s) disclaim responsibility for any injury to people or property resulting from any ideas, methods, instructions or products referred to in the content.

