Article

Phytoplasma-Induced Leaf Reddening as a Monitoring Symptom of Apple Proliferation Disease with Regard to the Development of Remote Sensing Strategies

1
RLP AgroScience, Breitenweg 71, D-67435 Neustadt, Germany
2
Department of Agriculture, Ecotrophology and Landscape Development, Anhalt University, Strenzfelder Allee 28, D-06406 Bernburg, Germany
*
Author to whom correspondence should be addressed.
Agronomy 2024, 14(2), 376; https://doi.org/10.3390/agronomy14020376
Submission received: 13 December 2023 / Revised: 3 February 2024 / Accepted: 10 February 2024 / Published: 15 February 2024
(This article belongs to the Section Precision and Digital Agriculture)

Abstract

:
Apple proliferation (AP) is an economically important disease in many apple-growing regions caused by ‘Candidatus Phytoplasma mali’ which is spread by migrating psyllid vectors on a regional scale. As infected trees in orchards are the only inoculum source, the early eradication of those trees is one of the most efficient strategies to prevent further spread of AP. Remote sensing is a promising rapid and cost-effective tool to identify infected trees on a regional scale. AP-induced premature leaf reddening was evaluated as a reliable symptom for remote sensing by monitoring more than 20,000 trees in 68 different orchards with 20 representative cultivars from 2019 to 2022 in a highly AP-affected region in Southwest Germany. Specific AP symptoms were almost 100% correlated with molecular detection of ‘Ca. P. mali’ and these specific symptoms were almost 100% correlated with leaf reddening. ‘Ca. P. mali’ was detected in 71–97% of trees which showed partial or entire reddening without any other AP symptom. Experimental and field data showed that reddening was induced by cold night and warm day temperatures (about 5 °C vs. 20 °C) in September. Quantification of the phytoplasma by real-time PCR showed no correlation with the intensity of reddening in the leaf. PCR-RFLP subtyping revealed no influence of different ‘Ca. P. mali’ strains on the symptom expression. In conclusion, leaf reddening in late September/early October was a reliable symptom useful for remote sensing of AP.

1. Introduction

Apple proliferation (AP) is one of the economically most important diseases of apple which is widespread in the temperate climatic zones of Europe and neighboring regions. It causes undersized fruits with poor fruit quality, rendering them unmarketable, which leads to major economic losses, e.g., about EUR 100 million in 2001 in Italy [1,2]. The causative agent of AP is the phloem-limited cell wall-less bacterium ‘Candidatus Phytoplasma mali’, a member of the phytoplasma 16Sr group X [3]. It is naturally very efficiently transmitted on a regional scale by two psyllid species: Cacopsylla picta (Förster) and Cacopsylla melanoneura (Förster 1848) [4]. Long-distance spread can occur by planting latently infected material.
So far, there are no curative treatments against AP. Due to its economic importance, AP is regarded as a quarantine pest in many countries, and recently ‘Ca. P. mali’ was classified as a regulated non-quarantine pest (RNQP) in the European Union (EU Regulation 2016/2031). To limit the spread of AP, preventive measures such as insecticide treatments against the vectors and the uprooting of infected trees are applied. In some heavily affected apple-growing regions like in Italy, the uprooting of infected trees and chemical control of insect vectors are mandatory [5]. Since the implementation of these measures in the Province of Trento in 2006, the AP infection rate decreased rapidly. However, monitoring of AP on a regional scale as performed by the Phytosanitary Office of the Province of Trento is laborious, time-consuming and expensive. It relies on the visual inspection of typical symptoms of AP such as witches’ brooms and enlarged stipules [1]. Although the expression of these symptoms varies from year to year influenced by climatic conditions, they are on their own highly indicative for an AP infection. In a previous study in Germany, we found an almost 100% correlation of one of these symptoms with the PCR detection of ‘Ca. P. mali’ [6]. However, enlarged stipules are difficult to determine as they vary from cultivar to cultivar and are, thus, often overlooked. In addition, there are some more easily detectable secondary symptoms like stunted shoot branches, undersized fruits and leaf reddening. In the past, these symptoms were regarded as less specific because they might be caused also by mechanical tree damage, fungal infections or certain physiological conditions [5]. However, the simultaneous occurrence of two or more of these symptoms is considered a reliable indicator of AP infection [5,7]. A definitive diagnosis of an infection can only be achieved by molecular means [8]. Various PCR detection protocols of the causal pathogen ‘Ca. P. mali’ are well established [1]. However, molecular diagnosis is labor- and cost-intensive and can hardly be applied on a large scale.
The use of new technologies in the context of precision agriculture paves the way for novel approaches for disease mapping of AP. Both satellite- and UAV-based imaging can be used for monitoring orchards [9,10]. Vegetation indices (VI) are commonly used to measure plant vitality [11], nutrition [12] and biotic and abiotic stresses [13,14], e.g., the well-established normalized difference vegetation index (NDVI) uses the reflectance of red light and near-infrared light and is correlated to biomass [15], leaf area index [16] and chlorophyll content [17]. Satellite imaging provides high coverage of a growing region at canopy level with a single image [18], while UAV-based imaging is more flexible and provides measurements with a significantly higher spatial resolution [19]. AP-induced reflectance changes due to leaf reddening can be detected using RGB cameras, as they are visible to the human eye. Multispectral and hyperspectral imaging may yield potentials for early detection as well as improved discrimination from other stresses [20,21,22]. However, focusing on a single symptom requires prior investigation of its significance. In this regard, we analyzed in the present study whether phytoplasma-induced leaf reddening might be a suitable symptom for remote sensing of AP. Premature foliar reddening in AP-infected trees is the consequence of phytoplasma-induced chlorophyll breakdown [23]. The results of Mittelberger et al. [24] indicate that chlorophyll breakdown in senescent and phytoplasma-infected leaves proceeds via a common pathway. Zorer et al. [25] identified the anthocyane cianidin-3-glucoside as the pigment responsible for the AP-induced leaf reddening.
Recently, two different approaches to the use of spectral analyses for the diagnosis of AP have been reported. Near-infrared (NIR) spectroscopy has been successfully applied to distinguish AP-infected and healthy apple leaves [8]. However, this is a destructive approach as it uses dried and ground leaves. It is still lab-based and labor-intensive. Barthel et al. [26] developed a sensor-based method to distinguish AP-infected from healthy leaves in the field with a portable spectroradiometer. By analyzing leaf hyperspectral signatures between 350 and 2500 nm, they were able to identify relevant wavelengths for AP infection. Zorer et al. [25] made the first attempts to use the specific spectra of leaf reddening for remote sensing of AP. Progress in customized low-cost UAVs has now made it feasible to pursue this approach. This strategy has already been successfully applied for airborne detection of grapevine yellows-infected vine [27,28].
Remote sensing of AP by UAVs has great potential for monitoring larger apple orchards or entire apple-growing regions and thus in limiting the spread of AP by early detection of infected trees. Therefore, remote sensing of AP with drones and satellite images using hyperspectral data was investigated in parallel to this study [29]. AP-infected trees could be identified in high-resolution satellite images.
However, as only a symptom but not the pathogen was detected by remote sensing, the objective of our study was to evaluate the reliability of the premature foliar reddening as a marker for AP infection. For this, we investigated different orchards in the highly AP-infected fruit-growing region of Palatinate in Southwest Germany in four consecutive years for the occurrence of reddening and its correlation with specific AP symptoms, as well as with the PCR detection of ‘Ca. P. mali’. The differences between the cultivars in terms of AP-induced reddening were considered. Since the timing of remote sensing of foliar reddening is important for specificity, we conducted experiments to induce reddening in infected plants under controlled conditions.
Numerous studies have addressed the question of how an infection with ‘Ca. P. mali’ alters the phloem physiology and leads to tissue occlusion and callose deposition in the sieve tubes [30]. It is still poorly understood whether these are direct localized effects due to the presence of the phytoplasma or more unspecific downstream metabolic changes in the plant. Therefore, quantitative real-time PCR was applied to test whether the foliar reddening is directly linked to the phytoplasma concentration in the leaf. Finally, as different strains of ‘Ca. P. mali’ might induce foliar reddening with different intensities, we analyzed the genetic phytoplasma variability with PCR-RFLP subtyping [31].

2. Materials and Methods

2.1. Plant Samples

Monitoring of AP was performed in four apple-growing regions of Palatinate in Southwest Germany in three consecutive years from 2019 to 2022. A total of 68 commercial apple orchards were monitored with varying intensity, and a total of 5549, 7813, 6377 and 1185 trees were monitored in 2019, 2020, 2021 and 2022, respectively. In order to find a large number of infected trees, monitoring was focused on older orchards with an age of 10–50 years. Selected orchards were monitored every year and some several times within a year from the beginning of September until the end of October. However, most orchards were observed in the first half of October, when symptoms were most pronounced. Typical AP symptoms such as witches’ broom and enlarged stipules as well as secondary symptoms like stunted branches and undersized fruits were recorded. With regard to reddening symptoms, a distinction was made between leaf reddening of only part of a tree (partial reddening) and reddening of the entire tree crown. Examples are shown in Figure 1. A subset of the samples with typical or secondary symptoms was tested by PCR for infection with ‘Ca. P. mali’. However, the focus of PCR analyses was on trees showing partial or entire reddening as the only symptom. Table 1 gives a summary of the number of orchards and trees monitored in each year.

2.2. Experimental Induction of Reddening

Based on the observation by Zorer et al. [25] that cold night temperatures induce premature foliar reddening of AP-infected trees, we investigated this induction in more detail under standardized conditions. We used 2-year-old ex vitro plants of M. × domestica cv. Golden Delicious infected with a defined strain (PM28) of ‘Ca. P. mali’. This strain was transmitted by field-collected C. picta in previous transmission trials [32] and the infected plant was multiplied by micropropagation. Healthy ex vitro plants of M. × domestica cv. Golden Delicious served as controls. The induction experiments were carried out in a climatic chamber (MLR-351, Sanyo Electric Co., Osaka, Japan) with constant temperatures of 5 °C in darkness and constant 20 °C in light. Trials were conducted in the second half of August (11 August–3 September 2020) with 14 h light and 10 h night, in the first half of September (5 September–20 September 2019) and at the end of September (21 September–2 October 2020) with 12 h light and 12 h night each. In all experiments, the control plants were kept in a greenhouse chamber under controlled temperature conditions of 22 °C in natural daylight and 15 °C at night—only in the last experiment was the night temperature in the greenhouse changed to 10 °C. Each variant consisted of three AP-infected and three healthy plants. For each plant, ten leaves were marked and the intensity of foliar reddening was monitored regularly (every 1–3 days) as soon as the first symptoms were observed. The development of the intensity of reddening was recorded as factor y with the following index scheme: 0 (normal green), 1 (pale green), 2 (light red), 3 (dark red). In addition, the percentage of the area of each leaf that reddened was estimated (factor x = 0–100%). Both values were multiplied together to obtain an index for each leaf: R index = (surface rate x/100) × intensity factor y. The index values for all ten leaves of a plant were added to obtain the final reddening index value of the whole plant. The mean index values were used to compare the experimental groups.
At the end of each experiment, the petioles of each leaf of infected plants were preserved and frozen for subsequent qPCR analyses.

2.3. PCR Detection

From field samples, 1–3 symptomatic branches per tree were taken and the phloem was prepared. Total nucleic acids were extracted from these phloem preparations as well as from leaf petioles of the induction experiments with a CTAB-based method according to Jarausch et al. [32].
Phytoplasma DNA was amplified in the extracts with primers fO1/rO1 [33] which sensitively amplify European fruit tree phytoplasmas. A DreamTaq Mastermix (Life Technologies GmbH, Darmstadt, Germany) was used and cycle conditions were as published. Samples with reddening symptoms that were negative in direct PCR were retested using a nested PCR approach. For the first PCR, primers fO1 [33] and P7 [34] were applied for 30 cycles consisting of 15 s 95 °C, 15 s 55 °C and 90 s 72 °C. Subsequently, 1 µL was transferred in the second PCR with primers fU5/rU4 [35] for 30 cycles of 15 s 95 °C, 15 s 55 °C and 45 s 72 °C. Aliquots of each PCR product were analyzed by agarose gel electrophoresis.

2.4. Quantitative Real-Time PCR

The phytoplasma concentration in extracts of petioles was determined by quantitative real-time PCR using the assay based on SYBR Green™ technology described by Jarausch et al. [36]. A specific gene fragment of ‘Ca. P. mali’ was amplified with primers AP3/AP4 using TEMPase Mastermix (VWR International GmbH, Darmstadt, Germany) with 3 mM Mg2+ and SYBR Green™ I (Lumiprobe GmbH, Hannover, Germany) diluted to 1:66,000 in 20 µL reactions. Each sample was amplified in duplicate in two independent runs in a Chromo4 Real-Time PCR detector (Bio-Rad Laboratories GmbH, München, Germany). Absolute quantification was performed according to the standard curve method described by Jarausch et al. [36] using a plasmid containing the target sequence diluted in healthy plant extract in serial 10-fold dilutions from 1 × 10⁸ target copies per µL to 1 copy per µL. The cycle threshold (Ct) values of the standard dilutions were plotted and checked to obtain a linear relationship that served as the standard curve. The quality of the standard curve was manually adjusted for each run according to the best linear regression coefficient. The Ct values of each sample were then compared to this standard curve and the copy number in each sample was calculated.
Phytoplasma concentrations were normalized to a single-copy chromosomal gene of Malus according to the method developed by Liebenberg [37]. The primers SbeI Malus f (5′-ggcacatgttggaatgagtagc-3′)/SbeI Malus r (5′-gttccagatctactgctgacggc-3′) selected by Liebenberg [37] in the sequence of the single-copy nuclear gene Sbe I [38] were used in a SYBR Green™-based assay. The reaction mix consisted of 0.5 U Taq polymerase (New England Biolabs GmbH, Frankfurt am Main, Germany), 0.22 µM of each primer and 0.5 mM dNTPs in 1× buffer supplemented with 3 mM Mg2+ in 20 µL reactions. SYBR Green™ I (Lumiprobe GmbH, Hannover, Germany) was added in 1:66,000 dilution. Cycle conditions were 1 min denaturation at 95 °C followed by 40 cycles of 15 s 95 °C and 45 s 69 °C and a final elongation step of 4 min at 72 °C, followed by a melting curve analysis. A plasmid containing the target sequence was diluted in sterile water in serial 10-fold dilutions from 1 × 10⁸ target copies per µL to 1 copy per µL. Quantification of the SbeI gene in Malus samples was performed as described above. Finally, the phytoplasma concentration in each sample was calculated as phytoplasma cell per plant cell.

2.5. AP Phytoplasma Subtype Characterisation by PCR-RFLP

The three subtypes of ‘Ca. P. mali’ defined by Jarausch et al. [31] were identified by PCR-RFLP in all positive field samples. The amplification of the informative chromosomal fragment was improved by developing a new reverse primer AP15 (5′-acccataagggtaattcacg-3′) used in combination with the forward primer AP3 [39]. PCR reactions were carried out in 30 µL volumes with TEMPase Mastermix (VWR International GmbH, Darmstadt, Germany). PCR cycle conditions were 15 min denaturation at 95 °C followed by 40 cycles of 15 s 95 °C, 20 s 60 °C and 1 min 69 °C, and a final elongation step of 4 min at 72 °C.
For RFLP analysis, 10 µL of the 850 bp PCR product was digested with BspHI (isoschizomer of RcaI; New England BioLabs GmbH, Frankfurt am Main, Germany) and with TaqI (Life Technologies GmbH, Darmstadt, Germany) according to the supplier’s instructions. Restriction enzyme digests were separated in 2% agarose gel electrophoresis. Restriction patterns of PCR products obtained from known subtypes served as controls to characterize the subtype of the field isolates.
The ‘Ca. P. mali’ subtype was correlated to the severity of AP symptoms. For this purpose, the cumulative disease index developed by Seemüller et al. [40] was applied as follows: partial reddening = 0.5, entire reddening, enlarged stipules = 1, small-sized fruits, witches’ broom = 3. These scores were added to obtain the cumulative disease index (CDI).

2.6. Statistical Analyses

Statistical analysis used the biostatistics software R v3.1.2 [41] with the packages anova, kruskal, laercio, ttest and wilcoxon. The analysis was based on an initial test for normal distribution using the Shapiro–Wilk normality test. In the case of normally distributed data and homogeneity of variances as determined by Bartlett’s test, a Welch two-sample t-test was applied. If data were not normally distributed, the Bartlett test of homogeneity of variances was used to demonstrate that variances were not homogeneous. A Wilcoxon rank sum test with continuity correction or a Kruskal–Wallis rank sum test were then used to determine differences among medians. If the Kruskal–Wallis rank sum test confirmed such differences, a Duncan test (confidence level = 95%) was used to rank differences.

3. Results

3.1. Correlation of Typical Symptoms of AP with PCR Detection of ‘Ca. P. mali’

Monitoring data obtained in 68 different commercial apple orchards in the years 2019–2022 were first analyzed for correlations of primary and secondary AP symptoms with detection of ‘Ca. P. mali’ by PCR. The data are summarized in Table 2. As previously reported [6], witches’ brooms and enlarged stipules were almost 100% indicative of AP infection, based on data from a large number of different orchards and samples. In the absence of primary symptoms, secondary symptoms such as stunted branches and undersized fruits also showed a 100% correlation with the presence of the pathogen. These symptoms often accompany the primary symptoms.

3.2. Correlation of Leaf Reddening with Typical Symptoms of AP

Based on the results presented in Table 2, primary symptoms of witches’ broom and enlarged stipules were considered indicators of AP infection. Thus, AP infection could be detected in a large number of trees in the monitoring without the need for molecular confirmation. Table 3 shows the analysis of the data in which way the reddening symptom was associated with primary and secondary AP symptoms. The data show an almost perfect correlation of reddening with primary AP symptoms for a large number of different orchards and a very high number of trees. The data for the correlation of reddening with secondary symptoms were more influenced by the year and the number of samples. In 2021, the correlation reached 98%, whereas in 2020, a correlation of approximately 70% was observed. As the secondary symptoms are considered less specific for AP if they appear alone, a 70% correlation with reddening is still high. Thus, it is concluded that reddening is a reliable indicator for AP infection that can be used for remote sensing of AP.
It is interesting to note that the expression of the primary symptoms of witches’ brooms and enlarged stipules varied between the years. The years 2019 and 2020 were characterized by hot summers with 31 and 17 hot days (Tmax ≥ 30 °C), respectively, and mean temperatures from July to September—when the growth of the trees starts again—of 19.58 °C and 19.97 °C, respectively. Witches’ broom formation was rare in these years, while it was high in 2021, a year with moderate summer conditions (9 hot days, mean temperature 18.39 °C). In contrast, expression of enlarged stipules was more common in 2019 and 2020 than in 2021. As this symptom is often very difficult to monitor, it is likely to underestimate an AP infection in less vigorous years.

3.3. PCR Detection of ‘Ca. P. mali’ in Red-Leafed Trees without Typical Symptoms of AP

As the aim of this work was to clarify the relationship between premature leaf reddening and AP infection, a substantial number of trees which only had reddening symptoms—either only on parts of the tree or on the whole tree—were tested. The data are presented in Table 2. In all four years, 71 to 97% of the reddened trees without any other AP symptoms tested positive for ‘Ca. P. mali’. No obvious difference was observed between partial or entire reddening of a tree. Reddening can be considered an early indicator of an AP infection and was thus a more sensitive symptom than the other primary and secondary symptoms.

3.4. AP-Correlated Leaf Reddening in Different Cultivars

Twenty different commercially grown cultivars were monitored in the survey 2019–2022. Table 4 shows that the proportion of reddening trees varies considerably between the different cultivars. Some cultivars like Royal Gala tend to express the reddening better than others like Rubinola. Overall, 28% of the trees in the orchards showed this symptom and 69% of these trees were infected with AP as verified by typical AP symptom expression or PCR detection. When investigating a subgroup of trees lacking typical AP symptoms through molecular analysis, it was additionally discovered that an average of 86% of the trees were infected. Thus, the correlation of reddening with AP infection was high in almost all cultivars studied. It was less pronounced in the early-ripening cultivar Delbarestivale.

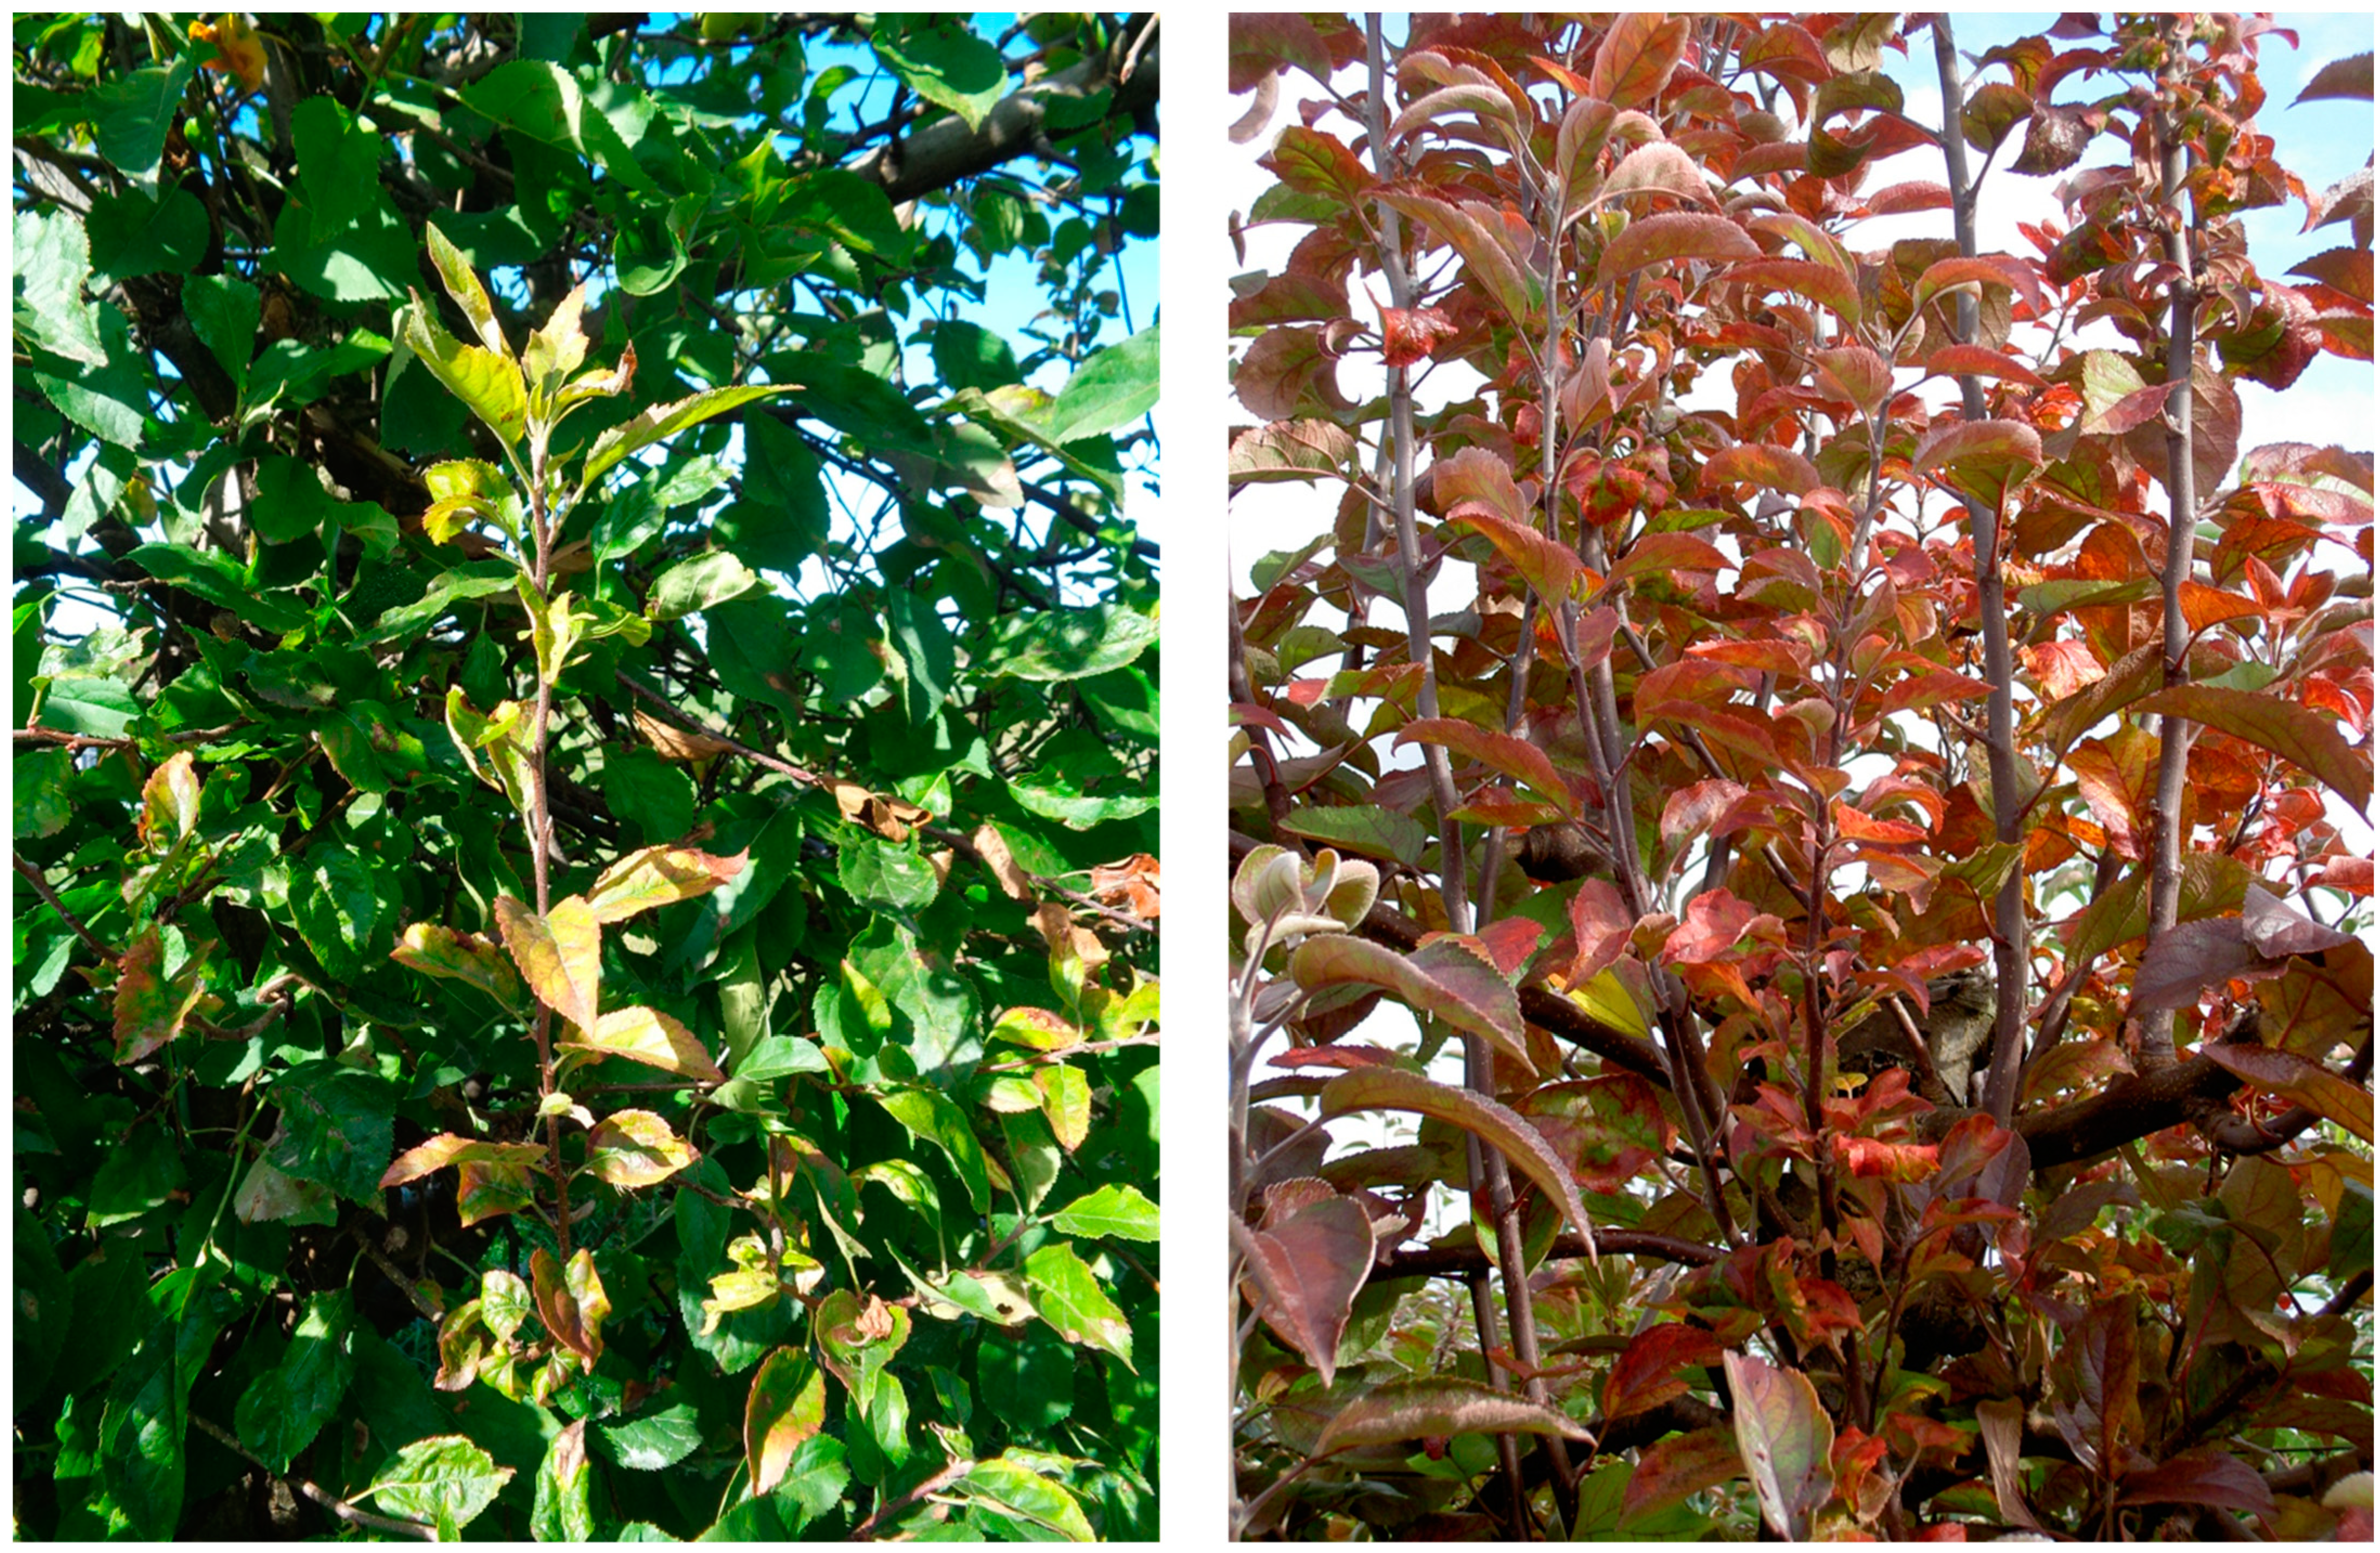
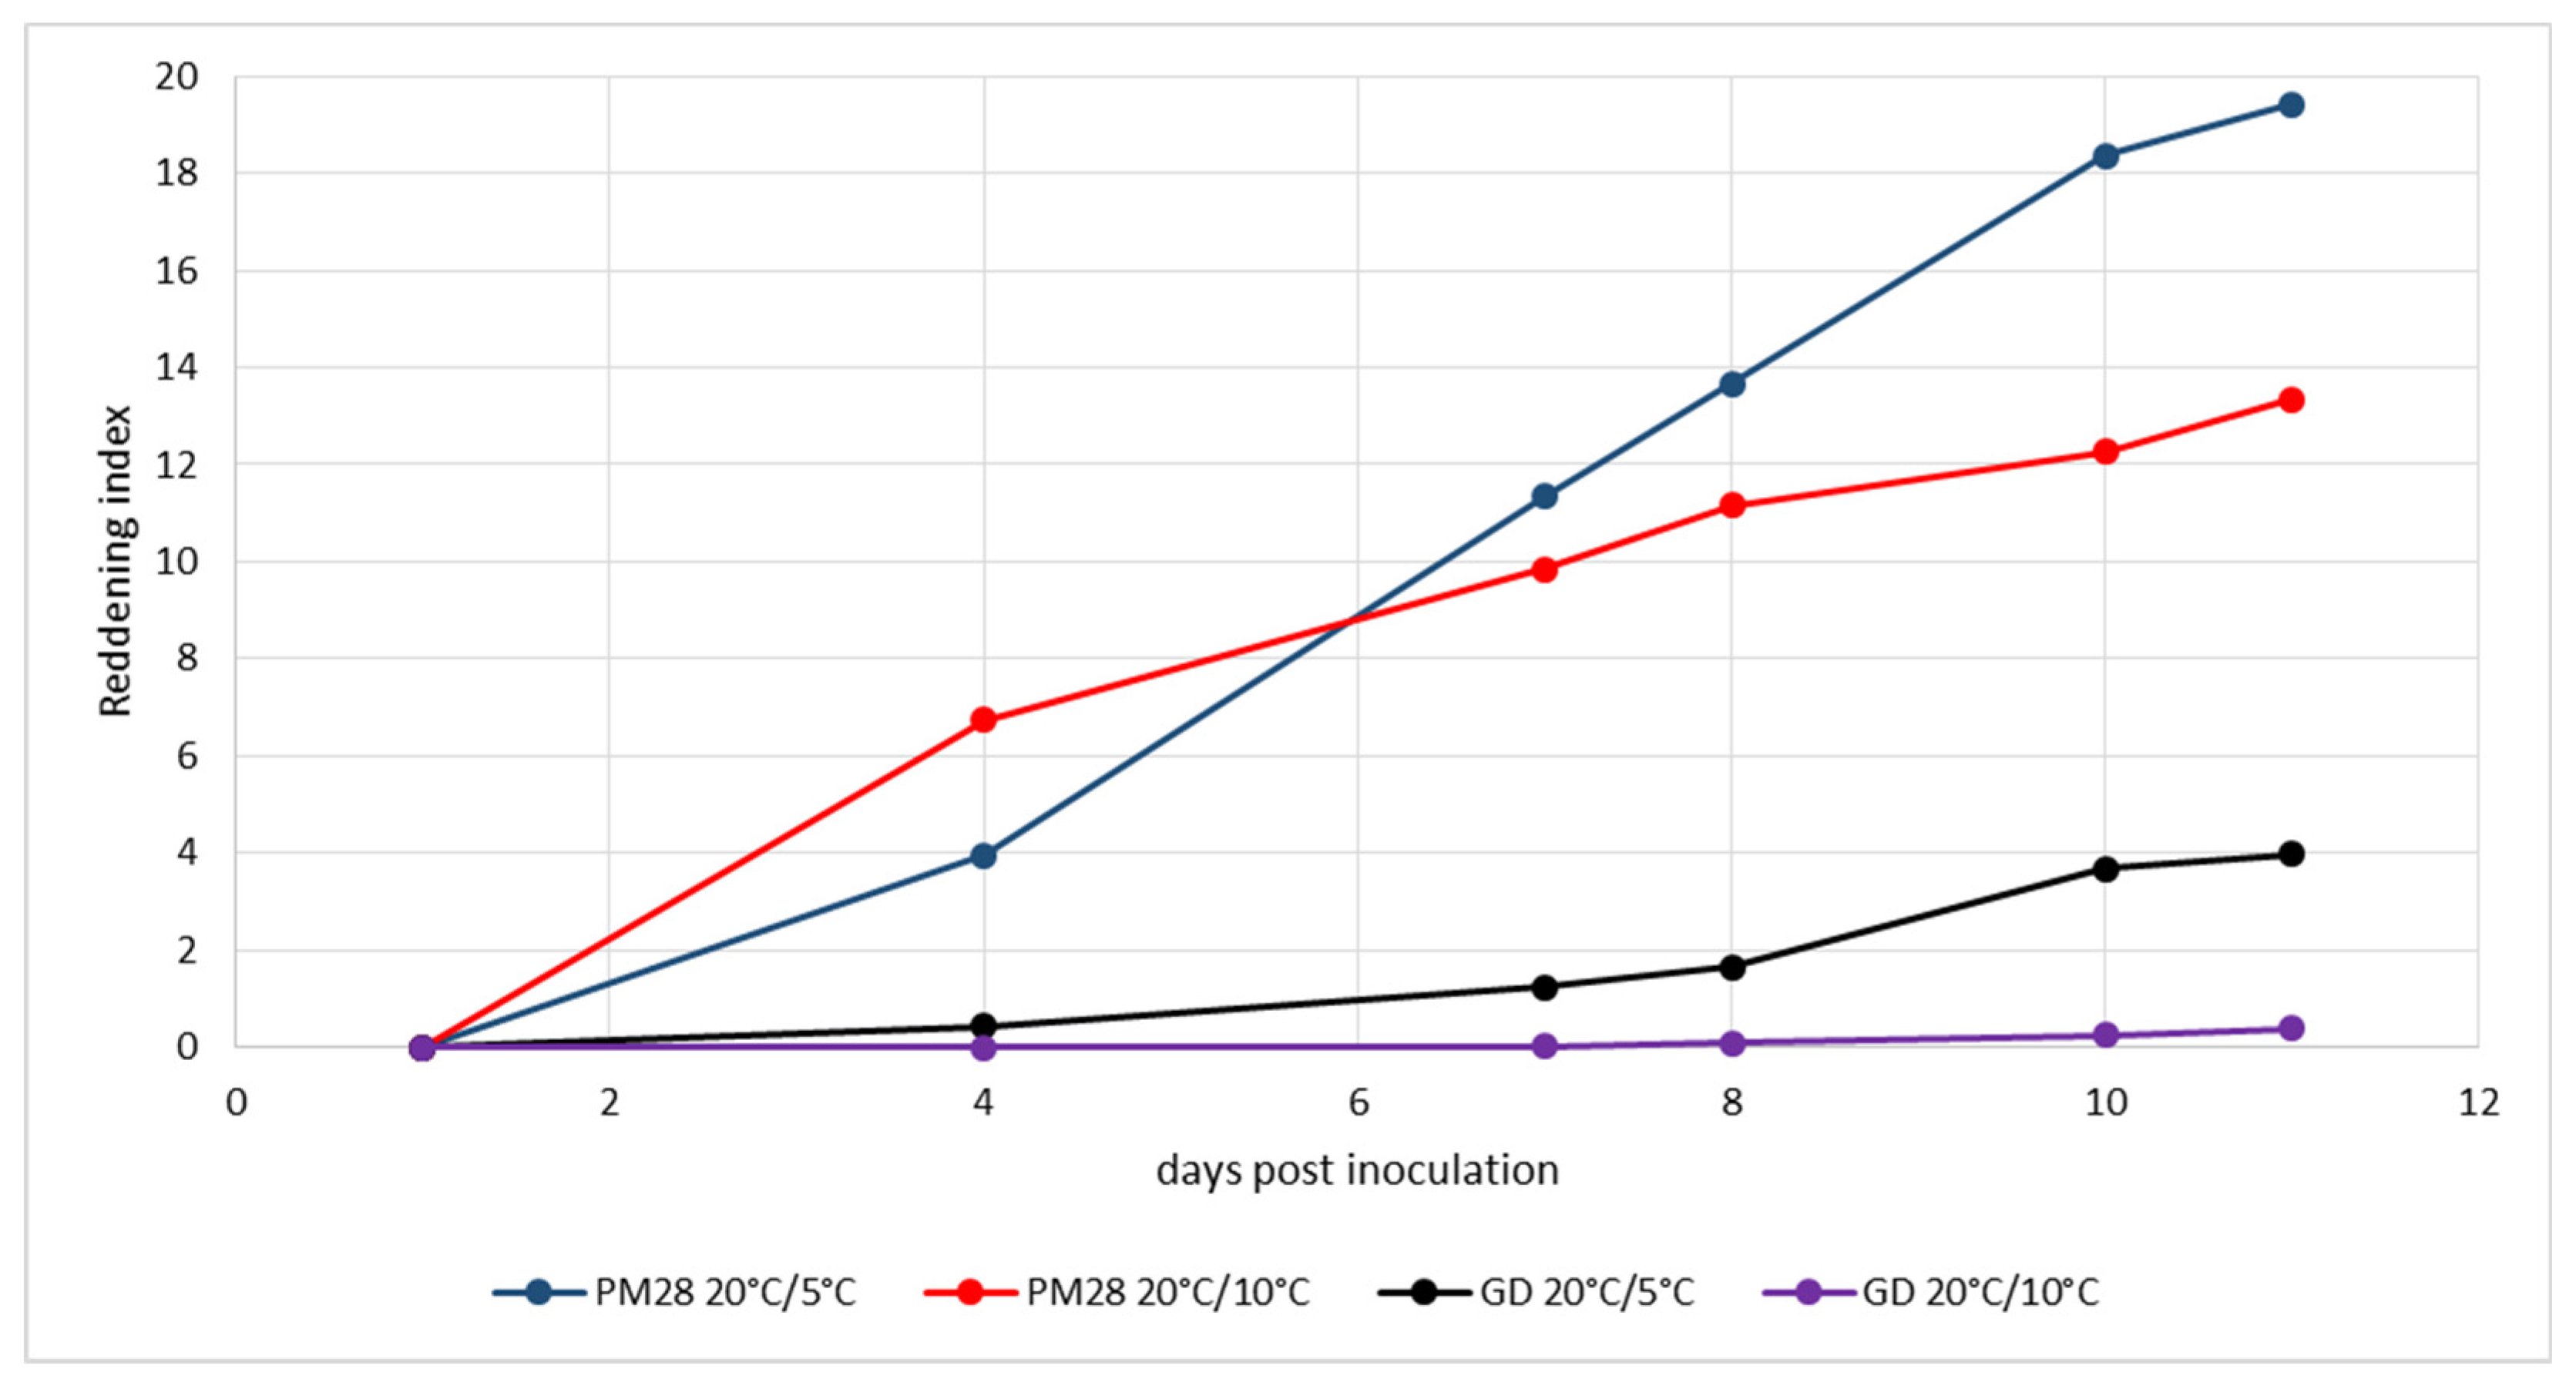
3.5. Experimental Induction of Phytoplasma-Induced Leaf Reddening

Ex vitro plants homogenously infected with a defined strain of ‘Ca. P. mali’ as well as non-infected control plants were maintained under controlled greenhouse conditions at 22 °C during the day and 15 °C at night without additional light prior to the experiment to respect the natural photoperiod. Cold induction was performed in a climatic chamber at a constant 20 °C with light and 5 °C in the dark. Control plants were kept under the above greenhouse conditions. To monitor the development of leaf reddening, an index was established that took into account the intensity of the color and the surface area turning red. Figure 2 shows the development of leaf reddening in the experiment from mid-August. Healthy Golden Delicious plants showed no reddening under either condition, and AP-infected plants in the greenhouse exhibited only weak reddening symptoms on very small leaf areas. Cold-induced reddening started at day 13 and progressed slowly until day 23, when the experiment was terminated. The experiment which began at the beginning of September (Figure 3) showed similar results. Only the cold-induced reddening of AP-infected plants started as early as day 11 and progressed more rapidly, reaching a much higher reddening index by day 15, when the experiment was terminated.
The third experiment (Figure 4) was started at the end of September under slightly different conditions. Whereas cold induction in the climatic chamber remained the same as in the previous experiments, conditions in the greenhouse were colder: 20 °C during natural daylight and 10 °C at night. In this experiment, reddening of AP-infected trees was monitored at day 4 under both temperature regimes and progressed rapidly. High reddening index values were already reached at day 11, but they were significantly higher in plants kept at 5 °C in the dark. While healthy plants showed no reddening under greenhouse conditions, those plants kept at 5 °C in the dark began to show leaf discoloration in small areas.

3.6. Correlation with Field Observations

The results obtained under experimental conditions were confirmed by the field observations during the monitoring periods 2019–2022. Weather data of the station at Neustadt/Weinstrasse showed that each year, a period of 3–5 days occurred in which the mean minimum temperature was between 5 and 7 °C at night, while the mean maximum temperature at day was largely above 20 °C (Table 5). In all years, leaf reddening of AP-infected trees in the orchards started about one week after cold induction.

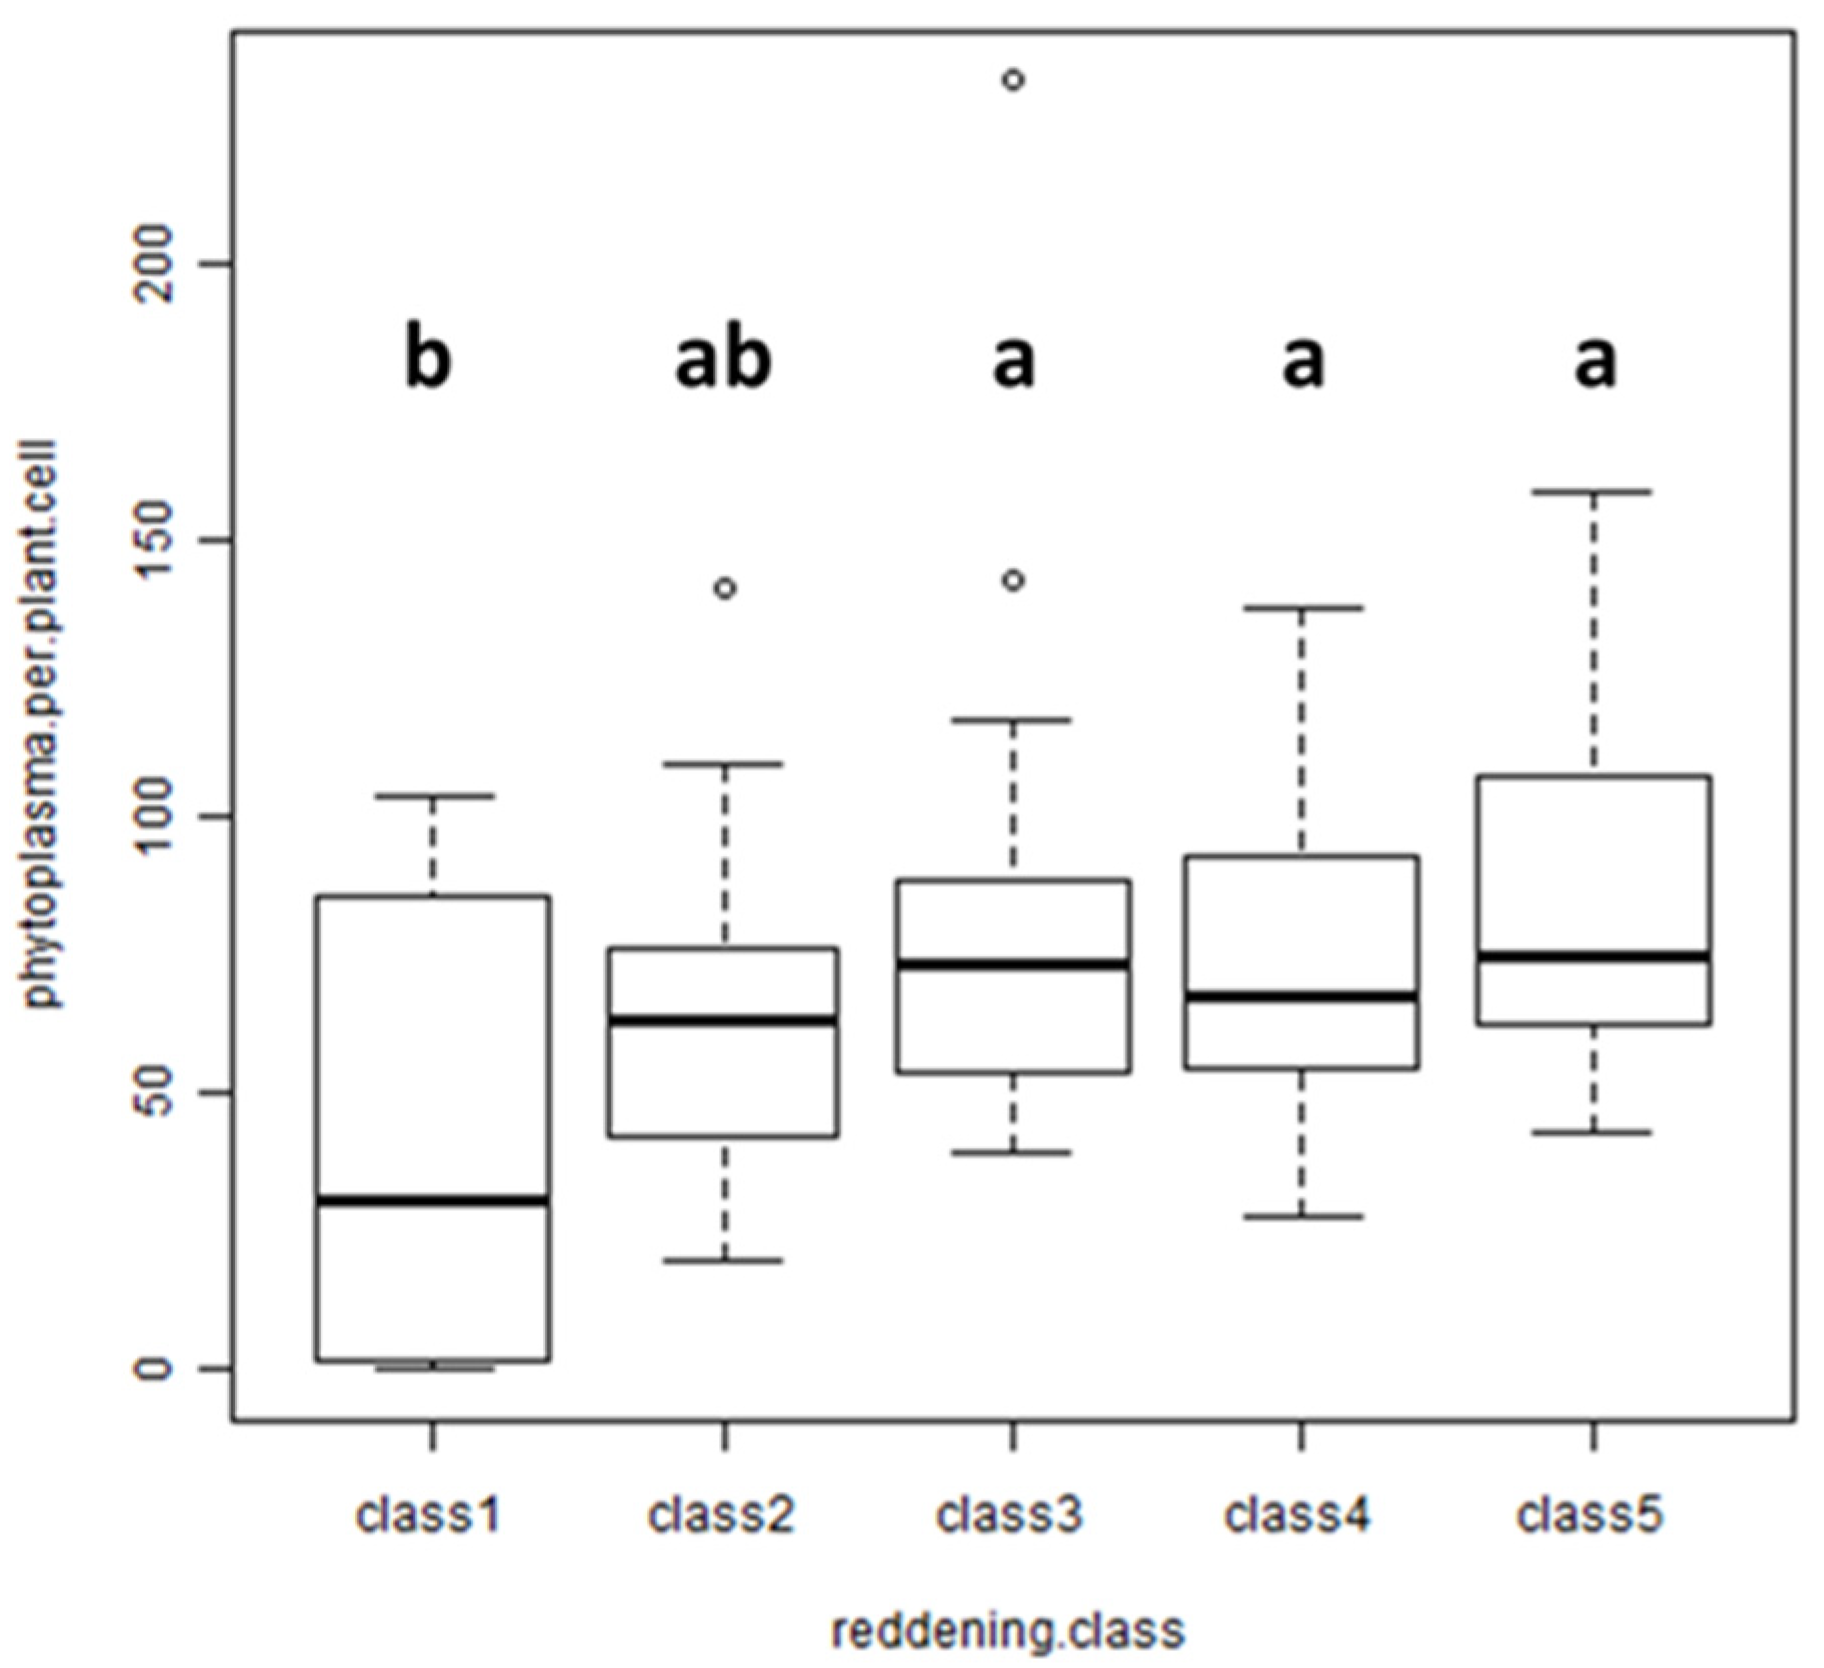
3.7. Correlation of Leaf Reddening with Phytoplasma Titer

At the end of each induction experiment (Figure 2, Figure 3 and Figure 4), total nucleic acids were extracted from each of the ten leaves per plant for which a reddening index had been calculated. The phytoplasma titer in each sample was measured by quantitative real-time PCR. Table 6 shows the mean phytoplasma titer in cold-induced versus control plants for the three experiments. Phytoplasma titers varied greatly among the different plants, and the differences among induced and control plants were not statistically significant in the first two experiments. Only in the third experiment did cold-induced plants have a significantly higher titer. The reddening index per leaf was also statistically evaluated at the end of each experiment. As shown in Table 6, cold-induced plants always had a significantly higher reddening index. The data for all individual leaves regarding reddening index and phytoplasma titer were analyzed for a possible correlation of reddening intensity with the phytoplasma titer. No correlation was found in all three experiments (Table 6).
To verify the correlation between reddening and phytoplasma titer under natural conditions, field-collected leaves were analyzed. Four AP-infected trees with varying degrees of red-colored leaves per tree were sampled. Ten leaves were selected per tree, and the intensity of reddening was recorded by estimating the red-colored area per leaf. The data were grouped into classes: up to 5% leaf area (class 1), 25% ± 5% (class 2), 50% ± 10% (class 3), 75% ± 10% (class 4) and 100% (class 5). The phytoplasma titer in each leaf was measured by quantitative real-time PCR in total nucleic acid extracts obtained from the petiole of each leaf. Statistical analysis of the data revealed no significant difference between the titers of each class (Figure 5), although leaves with almost no reddening (class 1) had a remarkably lower titer than leaves with a high percentage of reddening.

3.8. Correlation of Leaf Reddening with ‘Ca. Phytoplasma mali’ Subtype

Because different ‘Ca. P. mali’ strains could influence the plant’s response and thus the development of leaf reddening, we applied the PCR-RLP screening system of Jarausch et al. [31] to analyze a large amount of samples. For this purpose, we improved the efficiency of amplification with the new reverse primer AP15. Table 7 shows that all three ‘Ca. P. mali’ subtypes defined by Jarausch et al. [31] could be detected in the 238 samples obtained from different regions and orchards of the Palatinate area. Subtype AP was dominant (49% of samples) and widespread, whereas subtype AT-2 was rare (14% of samples). Subtype AT-1 occurred in 38% of the samples. The cumulative disease index developed by Seemüller et al. [40] revealed no statistically significant difference between trees infected with the three subtypes. The percentage of partially reddened trees was higher for subtypes AP and AT-2, while entirely reddened trees were more often infected with subtype AT-1. The data did not suggest any obvious influence of the phytoplasma strain on the expression of leaf reddening.

4. Discussion

Apple proliferation is an economically very important disease which is spread by univoltine migrating psyllid vectors on a regional scale [4]. Diseased trees are the only known inoculum sources. Thus, uprooting of infected trees is so far the only successful means to limit the disease spread apart from regular insecticide treatments against the vectors. However, to be successful, uprooting of infected trees must also be achieved on a regional scale. In heavily AP-affected apple-growing regions of Italy, this is even mandatory [5]. If performed at all, monitoring of AP infections on a regional scale is so far only possible by visual inspection. This is laborious and time-consuming and, thus, expensive. It is based on the accurate recognition of AP symptoms. The great advantage in this regard is that ‘Ca. P. mali’ induces very typical primary symptoms (witches’ brooms and enlarged stipules) which are correlated to almost 100% with the molecular detection of the pathogen. Our data confirm the results of previous studies [6,42]. However, our results and others [42] have also shown that, in particular, the development of witches’ brooms highly depends on the physiological state of the tree, which in turn depends on the climatic conditions during the phase of second growth starting in late summer. Induction of enlarged stipules is more regular, but varies strongly among cultivars and is very often difficult to detect on the tree. All these aspects limit the accuracy of visual inspections.
As phytoplasmas interact widely with their plant hosts, they induce many biochemical modifications, including impairment of photosynthetic activity. An infection with AP disrupts the carbohydrate balance, resulting in the inhibition of photosynthesis and chlorosis [43]. The levels of chlorophyll a + b and carotenoids decrease, causing an inhibition of photosystem 2 [23]. Aldaghi et al. [44] reported that genes associated with photosynthesis pathways were deregulated in AP-infected apple trees. Additionally, the breakdown of chlorophyll induced by AP follows the same pathways as seasonal leaf senescence [24]. Unlike leaf senescence in the fall, premature AP-induced chlorophyll breakdown leads to foliar reddening due to the presence of the anthocyanin cyanidin-3-glucoside in the leaf [25]. This compound is a common antioxidant in apples.
Although this symptom is easily detectable in visual inspection, it has always remained unclear how accurately it indicates an AP infection. Therefore, we conducted this detailed study to evaluate premature foliar reddening as a reliable symptom for remote sensing. We conducted our monitoring in the Palatinate region in Southwest Germany, which is historically heavily affected by AP. To be representative, we included a wide range of different orchards and different cultivars. Due to the high accuracy of the primary AP symptoms, careful visual inspection enabled the monitoring of a high number of trees, always by the same experts. Molecular detection of ‘Ca. P. mali’ confirmed not only a high correlation with witches’ brooms and enlarged stipules, but also to secondary symptoms like undersized fruits and stunted shoots. Our data confirmed the strategy adopted in Trentino and South Tyrol [5,7] that the contemporaneous occurrence of two secondary symptoms is also a highly accurate indication of an AP infection. Consequently, we focused our PCR detection efforts on examining those trees that exhibited a premature reddening only on one part of the tree or on the entire tree without any other AP symptoms. In every year, we found a high correlation between 71 and 97% with the presence of ‘Ca. P. mali’. In contrast to the observation reported by Öttl et al. [45], we observed no difference between partial and entire reddening. This observed accuracy is much higher than previously reported [6]. One explanation could be climate change, as we observed more premature foliar reddening in trees stressed during the hot summer in 2019 and 2020.
We conclude that premature reddening is a suitable symptom for non-destructive diagnosis of AP. The recent work of Barthel et al. [26] demonstrated that it can be successfully applied to proximal sensing with a spectroradiometer. Our work is a prerequisite for the establishment of remote sensing strategies for AP. For this, multi- or hyperspectral data obtained by UAVs or satellites can be used. Preliminary data indicate that remote sensing of AP with drones or satellite images is feasible but mainly the visible leaf reddening and the disease-induced plant stress were detected [29]. Therefore, the overall accuracy of the reddening symptom is decisive for remote sensing of AP. In this regard, it is important to note that we found a 94–99% correlation of primary AP symptoms with foliar reddening. The secondary symptoms of stunted shoots and undersized fruits were also associated with reddening at a very high percentage. The expression of secondary symptoms and their correlation with premature leaf reddening was more variable among different years and reflects the climatic influences on the physiological state of the tree. Taken together, premature reddening was even the most sensitive symptom, as it indicated infection even in trees without typical AP symptoms. However, the expression of reddening varied among the different cultivars. For example, the common cultivar Golden Delicious—which was also analyzed in other studies—had a 76% correlation with typical AP symptoms (Table 4), but PCR testing of reddened trees without AP symptoms exhibited a 100% correlation. This indicates that an important number of trees showed no typical AP symptoms but were indeed infected. While premature foliar reddening was a good indicator for AP in most cultivars, only a few cultivars exhibited a lower percentage of correlation, e.g., the early-maturing cv. Delbarestivale. In contrast to all other cultivars, only 55% of reddened trees tested positive for an AP infection by PCR. This exceptional case could be related to the different physiological behavior of the early-maturing cultivar, which leads to a certain number of false positive results.
The timing of remote sensing is important to achieve an accurate and sensitive detection of AP. If remote sensing is performed too early in the season, it may be accurate but may not detect all infected trees; if it is conducted too late in autumn, it may be disturbed by natural leaf senescence. ‘Ca. P. mali’-induced leaf reddening is considered to occur before the natural senescence of leaves in autumn. Therefore, the timing of when leaf reddening is used as a symptom is crucial. According to the work of Zorer et al. [25], reddening induced by ‘Ca. P. mali’ is expressed after a period of cold night and warm day temperatures. We performed laboratory experiments under controlled conditions with homogenously infected and healthy plants to better define these induction conditions. We used the cv. Golden Delicious, which usually has a good correlation between reddening and AP infection. Our results confirm the data of Zorer et al. [25] that 5 °C at dark and 20 °C at light induce foliar reddening in infected but not in healthy apples. The induction took place in late summer in the second half of August. In this period, unusual for cold nights, foliar reddening began about 2 weeks later and was clearly visible only after three weeks. Induction experiments in later periods (first and second halves of September) showed that the expression of reddening occurs earlier in time and reaches a higher intensity. An analysis of the natural temperature profiles in the four years of observation showed that every year, the experimentally defined induction conditions were fulfilled in the second half of September. Reddening symptoms of infected trees in the orchards were then observed about one week later as predicted by the experimental data. Thus, a good forecast model for the best timing of remote sensing of AP could be established.
The phytoplasma colonization of AP-infected trees follows a seasonal trend: the phytoplasma is eliminated during winter in the above-ground parts due to phloem degeneration and recolonizes the crown from the roots to the top from spring onwards [46]. This colonization might be hampered by plant defense reactions to the infection with ‘Ca. P. mali’ which alter the phloem physiology and lead to tissue occlusion and callose deposition in the sieve tubes [30]. However, it is still poorly understood whether these are direct localized effects due to the presence of the phytoplasma or due to long-distance signaling of the plant response [30]. Therefore, we analyzed whether the intensity of leaf reddening is directly linked to the concentration of phytoplasmas in the leaf. We first established an index to quantify the intensity of the reddening and applied it to the leaves monitored during the induction experiments. This allowed a statistical analysis, which showed that induced plants had a significantly higher reddening index than the control plants in all three experiments. By measuring the phytoplasma titer in the petiole of each leaf at the end of the induction period, we were able to correlate the phytoplasma concentration with the intensity of leaf reddening. We found no correlation between titer and reddening index and, at least in the first two experiments, no significant difference between the phytoplasma titers in induced and control plants. This result was also confirmed in field-collected leaves of AP-infected plants. Only in non-symptomatic leaves was the titer lower than in highly reddened leaves. These data suggest that AP-induced leaf reddening is a long-distance effect rather than a local one, and that the reddening symptom is a sensitive indication for ‘Ca. P. mali’ infection of the tree. This result is in line with recent data of near-infrared reflectance analyses of AP-infected leaves [8]. Due to the non-systemic colonization of the tree, this could also explain the failure of molecular phytoplasma detection in some cases.
We also tried to address the question of whether different strains of ‘Ca. P. mali’ are responsible for the observed variations in the reddening symptomatology. ‘Ca. P. mali’ isolates can be grouped into three subtypes, AP, AT-1 and AT-2 [31], and we showed in a previous study that subtype AT-1 was more prevalent in apple trees exhibiting leaf reddening, while subtype AP was considered more virulent [47]. To verify this result, we analyzed the majority of our positive samples with an improved PCR-RFLP approach that we published previously [31]. It is based on conserved SNP markers and has been widely used to study the ‘Ca. P. mali’-strain spectrum in different geographic regions. Our data based on 238 samples showed that the symptom expression of the apple trees, expressed as cumulative disease index, was similar for all three subtypes of ‘Ca. P. mali’, indicating no differences in virulence between the subtypes. Partial and entire reddening of the trees was observed in almost identical percentages with subtypes AP and AT-2, whereas the reddening of the entire tree was more often correlated with the ‘Ca. P. mali’ subtype AT-1 confirming our previous results. In conclusion, the reliability of premature leaf reddening as a symptom of AP is not significantly impaired by genetic variants of ‘Ca. P. mali’. However, latent infections or infections with avirulent strains that do not induce symptoms [48] cannot be detected by visual inspections. Hyperspectral analyses are needed to identify potential spectral signatures in invisible wavelength ranges so that asymptomatic infections can also be detected by remote sensing.
Compared to our previous study [47], an important difference was found in the proportion and distribution of the three subtypes. Subtype AT-1 was found in only 12% of samples from 2000 to 2002, all coming from abandoned or scattered orchards, while in the samples from 2019 to 2021 it was detected in 38% of the samples derived from all kinds of orchards in all regions studied. On the contrary, the portion of subtype AP decreased from 72% to 49%. However, it was still encountered for the majority of the samples, which is consistent with data from France [31], Poland [49] and North-East Italy [50]. Subtypes AP and AT-2 are almost absent in North-Western Italy [51], where C. melanoneura is the only vector of AP. Analysis of the temporal distribution of subtype frequencies in apple trees in Trentino and South Tyrol (Northern Italy) showed a shift from the prevalence of subtype AT-1 to AT-2 [52,53]. This was related to the appearance of C. picta as the main vector of AP in these regions and suggests that subtype AT-1 is more efficiently spread by the vector C. melanoneura, while the AP and AT-2 subtypes are more efficiently spread by C. picta [53]. However, German populations of C. melanoneura are considered to be unable to transmit ‘Ca. P. mali’ [54], whereas C. picta was described as a very efficient vector [32]. Thus, the observed spread of subtype AT-1 in the Palatinate region of Germany is either due to a change in German populations of C. melanoneura, which are now able to transmit ‘Ca. P. mali,’ or due to different AT-1 genetic lineages as proposed by Casati et al. [51], where the German AT-1 subtypes can also be efficiently transmitted by C. picta. Although the observed genetic differences in populations of C. melanoneura in Germany and Italy [55] have to be revised, our data from successful transmission trials with C. picta [32] are more in favor of the second hypothesis, as C. picta efficiently transmitted AP as well as AT-1 subtypes. The observed spread of AT-1 subtypes from abandoned and scattered orchards into commercial orchards highlight the importance of new vector control strategies in apple orchards in Germany.

5. Conclusions

Premature partial leaf reddening or reddening of the entire crown is a good indicator of AP infection in apple and can therefore be used for the remote sensing of AP. This result is based on the analysis of a large number of trees in a large number of different orchards with varying cultivars monitored and PCR tested in four consecutive years. AP-induced leaf reddening is induced by cold night and high day temperatures in September, as shown under both experimental and field conditions. The intensity of leaf reddening is not correlated with the phytoplasma titer in the leaf, confirming the inhomogeneous distribution of ‘Ca. P. mali’ in an infected tree. Therefore, premature leaf reddening can also be considered a sensitive indicator of an AP infection. It is a general response of the plant to phytoplasma infection and not only related to specific ‘Ca. P. mali’ strains.

Author Contributions

Conceptualization, W.J.; methodology, W.J. and M.R.; validation, W.J. and U.K.; formal analysis, W.J. and U.K.; investigation, W.J., M.R., N.S. and B.J.; resources, W.J. and M.R.; data curation, W.J. and M.R.; writing—original draft preparation, W.J.; writing—review and editing, W.J., B.J. and U.K.; visualization, W.J. and U.K.; supervision, W.J.; project administration, W.J.; funding acquisition, W.J. and U.K. All authors have read and agreed to the published version of the manuscript.

Funding

This research was funded by LANDWIRTSCHAFTLICHE RENTENBANK, grant number 857 727. We acknowledge support by the German Research Foundation (Deutsche Forschungsgemeinschaft DFG) and the Open Access Publishing Fund of Anhalt University of Applied Sciences.

Data Availability Statement

The data presented in this study are available on request from the corresponding author. The data are not publicly available due to legal and privacy issues.

Acknowledgments

We thank the growers for allowing us access to their orchards for monitoring and sampling.

Conflicts of Interest

The authors declare no conflicts of interest. The funders had no role in the design of the study; in the collection, analyses, or interpretation of data; in the writing of the manuscript; or in the decision to publish the results.

References

  1. Seemüller, E.; Carraro, L.; Jarausch, W.; Schneider, B. Apple Proliferation Phytoplasma. In Virus and Virus-like Diseases of Pome and Stone Fruits; Hadidi, A., Barba, M., Candresse, T., Jelkmann, W., Eds.; APS Press: Saint Paul, MN, USA, 2011; pp. 67–73. ISBN 978-0-89054-396-2. [Google Scholar]
  2. Strauss, E. Microbiology. Phytoplasma research begins to bloom. Science 2009, 325, 388–390. [Google Scholar] [CrossRef] [PubMed]
  3. Seemüller, E.; Schneider, B. ‘Candidatus Phytoplasma mali’, ‘Candidatus Phytoplasma pyri’ and ‘Candidatus Phytoplasma prunorum’, the causal agents of apple proliferation, pear decline and European stone fruit yellows, respectively. Int. J. Syst. Evol. Microbiol. 2004, 54, 1217–1226. [Google Scholar] [CrossRef] [PubMed]
  4. Jarausch, B.; Tedeschi, R.; Sauvion, N.; Gross, J.; Jarausch, W. Psyllid vectors. In Phytoplasmas: Plant Pathogenic Bacteria—II. Transmission and Management of Phytoplasma—Associated Diseases; Bertaccini, A., Weintraub, P.G., Rao, G.P., Mori, N., Eds.; Springer: Singapore, 2019; pp. 53–78. [Google Scholar] [CrossRef]
  5. Barthel, D.; Fischnaller, S.; Letschka, T.; Janik, J.; Mittelberger, C.; Öttl, S.; Panassiti, B.; Angeli, G.; Baldessari, M.; Bianchedi, P.L.; et al. Scopazzi del Melo: Stato Attuale della Ricerca—Apfeltriebsucht: Aktueller Stand der Forschung; Janik, K., Barthel, D., Oppedisano, T., Anfora, G., Eds.; Fondazione Edmund Mach: San Michele all’Adige, Italy; Centro di Sperimentazione Laimburg: Ora, Italy, 2020; pp. 1–153. ISBN 9788878430532. [Google Scholar]
  6. Jarausch, W. Apfeltriebsucht. 2007. Available online: https://www.apfeltriebsucht.de (accessed on 4 September 2023).
  7. Mattedi, L.; Forno, F.; Branz, A.; Bragagna, P.; Battocletti, I.; Gualandri, V.; Pedrazzoli, F.; Bianchedi, P.; Deromedi, M.; Filippi, M.; et al. Come riconoscere la malattia in campo: Novità sulla sintomatologia. In Scopazzi del Melo—Apple Proliferation; Ioriatti, C., Jarausch, W., Eds.; Fondazione Edmund Mach: San Michele all’Adige, Italy, 2008; pp. 41–50. [Google Scholar]
  8. Barthel, D.; Dordevic, N.; Fischnaller, S.; Kerschbamer, C.; Messner, M.; Eisenstecken, D.; Robatscher, P.; Janik, K. Detection of apple proliferation disease in Malus × domestica by near infrared reflectance analysis of leaves. Spectrochim. Acta Part A Mol. Biomol. Spectrosc. 2021, 263, 120178. [Google Scholar] [CrossRef]
  9. Berni, J.A.J.; Zarco-Tejada, P.J.; Suárez, L.; González-Dugo, V.; Fereres, E. Remote sensing of vegetation from UAV platforms using lightweight multispectral and thermal imaging sensors. Int. Arch. Photogramm. Remote Sens. Spatial Inform. Sci. 2009, 38, 6. [Google Scholar]
  10. Jones, H.G.; Robin, A.V. Remote Sensing of Vegetation: Principles, Techniques, and Applications, 1st ed.; Oxford University Press: New York, NY, USA, 2010. [Google Scholar]
  11. Boochs, F.; Kupfer, G.; Dockter, K.; Kühbauch, W. Shape of the red edge as vitality indicator for plants. Int. J. Remote Sens. 1990, 11, 1741–1753. [Google Scholar] [CrossRef]
  12. Sharifi, A. Remotely sensed vegetation indices for crop nutrition mapping. J. Sci. Food Agric. 2020, 100, 5191–5196. [Google Scholar] [CrossRef] [PubMed]
  13. Delalieux, S.; Somers, B.; Verstraeten, W.W.; van Aardt, J.A.N.; Keulemans, W.; Coppin, P. Hyperspectral indices to diagnose leaf biotic stress of apple plants, considering leaf phenology. Int. J. Remote Sens. 2009, 30, 1887–1912. [Google Scholar] [CrossRef]
  14. Kim, Y.J.; Glenn, D.M.; Park, J.; Ngugi, H.K.; Lehman, B.L. Hyperspectral image analysis for water stress detection of apple trees. Comput. Electron. Agric. 2011, 77, 155–160. [Google Scholar] [CrossRef]
  15. Zhu, X.; Liu, D. Improving forest aboveground biomass estimation using seasonal Landsat NDVI time-series. ISPRS J. Photogramm. Remote Sens. 2015, 102, 222–231. [Google Scholar] [CrossRef]
  16. Liu, Z.; Guo, P.; Liu, H.; Fan, P.; Zeng, P.; Liu, X.; Feng, C.; Wang, W.; Yang, F. Gradient boosting estimation of the leaf area index of apple orchards in UAV remote sensing. Remote Sens. 2021, 13, 3263. [Google Scholar] [CrossRef]
  17. Li, C.; Zhu, X.; Wei, Y.; Cao, S.; Guo, X.; Yu, X.; Chang, C. Estimating apple tree canopy chlorophyll content based on Sentinel-2A remote sensing imaging. Sci Rep. 2018, 8, 3756. [Google Scholar] [CrossRef]
  18. Zhu, Y.; Yang, G.; Yang, H.; Wu, J.; Lei, L.; Zhao, F.; Fan, L.; Zhao, C. Identification of apple orchard planting year based on spatiotemporally fused satellite images and clustering analysis of foliage phenophase. Remote Sens. 2020, 12, 1199. [Google Scholar] [CrossRef]
  19. Zhang, C.; Valente, J.; Kooistra, L.; Guo, L.; Wang, W. Orchard management with small unmanned aerial vehicles: A survey of sensing and analysis approaches. Precis. Agric. 2021, 22, 2007–2052. [Google Scholar] [CrossRef]
  20. Liu, Y.; Zhang, Y.; Jiang, D.; Zhang, Z.; Chang, Q. Quantitative assessment of apple mosaic disease severity based on hyperspectral images and chlorophyll content. Remote Sens. 2023, 15, 2202. [Google Scholar] [CrossRef]
  21. Pieczywek, P.M.; Cybulska, J.; Szymańska-Chargot, M.; Siedliska, A.; Zdunek, A.; Nosalewicz, A.; Baranowski, P.; Kurenda, A. Early detection of fungal infection of stored apple fruit with optical sensors–Comparison of biospeckle, hyperspectral imaging and chlorophyll fluorescence. Food Control 2018, 85, 327–338. [Google Scholar] [CrossRef]
  22. Genangeli, A.; Allasia, G.; Bindi, M.; Cantini, C.; Cavaliere, A.; Genesio, L.; Giannotta, G.; Miglietta, F.; Gioli, B. A Novel hyperspectral method to detect moldy core in apple fruits. Sensors 2022, 22, 4479. [Google Scholar] [CrossRef] [PubMed]
  23. Bertamini, M.; Grando, M.S.; Nedunchezhian, N. Effects of Phytoplasma Infection on Pigments, Chlorophyll-Protein Complex and Photosynthetic Activities in Field Grown Apple Leaves. Biol. Plant 2003, 47, 237–242. [Google Scholar] [CrossRef]
  24. Mittelberger, C.; Pichler, C.; Yalcinkaya, H.; Erhart, T.; Gasser, J.; Schumacher, S.; Janik, K.; Robatscher, P.; Kräutler, B.; Oberhuber, M. Pathogen-Induced Leaf Chlorosis: Products of Chlorophyll Breakdown Found in Degreened Leaves of Phytoplasma-Infected Apple (Malus × domestica Borkh.) and Apricot (Prunus armeniaca L.) Trees Relate to the Pheophorbide a Oxygenase/Phyllobilin Pathway. J. Agric. Food Chem. 2017, 65, 2651–2660. [Google Scholar] [CrossRef] [PubMed]
  25. Zorer, R.; Bianchedi, P.L.; Mattedi, L.; Branz, A. Arrossamento fogliare autunnale. Relazioni con la presenza del fitoplasma e possibili utilizzi nel monitoraggio prossimale o remoto. In Scopazzi del Melo—Apple Proliferation; Ioriatti, C., Jarausch, W., Eds.; Fondazione Edmund Mach: San Michele all’Adige, Italy, 2008; pp. 51–62. [Google Scholar]
  26. Barthel, D.; Cullinan, C.; Mejia-Aguilar, A.; Chuprikova, E.; McLeod, B.A.; Kerschbamer, C.; Trenti, M.; Monsorno, R.; Prechsl, U.E.; Janik, K. Identification of spectral ranges that contribute to phytoplasma detection in apple trees—A step towards an on-site method. Spectrochim. Acta Part A Mol. Biomol. Spectrosc. 2023, 303, 123246. [Google Scholar] [CrossRef] [PubMed]
  27. Albetis, J.; Duthoit, S.; Guttler, F.; Jacquin, A.; Goulard, M.; Poilvé, H.; Féret, J.-B.; Dedieu, G. Detection of Flavescence dorée grapevine disease using unmanned aerial vehicle (UAV) multispectral imagery. Remote Sens. 2017, 9, 308. [Google Scholar] [CrossRef]
  28. Albetis, J.; Jacquin, A.; Goulard, M.; Poilvé, H.; Rousseau, J.; Clenet, H.; Dedieu, G.; Duthoit, S. On the potentiality of UAV multispectral imagery to detect Flavescence dorée and grapevine trunk diseases. Remote Sens. 2018, 11, 23. [Google Scholar] [CrossRef]
  29. Jarausch, W.; Menz, P.; Al Masri, A.; Runne, R.; Thielert, B.; Kohler, K.; Warnemünde, S.; Kilias, D.; Jarausch, B.; Knauer, U. Digital Phytoplasmology: Remote sensing of fruit tree phytoplasma diseases. Phytopath. Mollicutes 2023, 13, 135–136. [Google Scholar] [CrossRef]
  30. Musetti, R.; Paolacci, A.; Ciaffi, M.; Tanzarella, O.A.; Polizzotto, R.; Tubaro, F.; Mizzau, M.; Ermacora, P.; Badiani, M.; Osler, R. Phloem cytochemical modification and gene expression following the recovery of apple plants from apple proliferation disease. Phytopathology 2010, 100, 390–399. [Google Scholar] [CrossRef] [PubMed]
  31. Jarausch, W.; Saillard, C.; Helliot, B.; Garnier, M.; Dosba, F. Genetic variability of apple proliferation phytoplasmas as determined by PCR-RFLP and sequencing of a non-ribosomal fragment. Mol. Cell. Probes 2000, 14, 17–24. [Google Scholar] [CrossRef]
  32. Jarausch, B.; Schwind, N.; Fuchs, A.; Jarausch, W. Characteristics of the spread of apple proliferation by its vector Cacopsylla picta. Phytopathology 2011, 101, 1471–1480. [Google Scholar] [CrossRef] [PubMed]
  33. Lorenz, K.H.; Schneider, B.; Ahrens, U.; Seemüller, E. Detection of the apple proliferation and pear decline phytoplasmas by PCR amplification of ribosomal and nonribosomal DNA. Phytopathology 1995, 85, 771–776. [Google Scholar] [CrossRef]
  34. Schneider, B.; Seemüller, E.; Smart, C.D.; Kirkpatrick, B.C. Phylogenetic classification of plant pathogenic mycoplasma-like organism or phytoplasmas. In Molecular and Diagnostic Procedures in Mycoplasmology; Razin, S., Tully, J.G., Eds.; Academic Press: San Diego, CA, USA, 1995; pp. 369–380. [Google Scholar]
  35. Ahrens, U.; Seemüller, E. Detection of DNA of plant pathogenic mycoplasmalike organisms by a polymerase chain-reaction that amplifies a sequence of the 16S RNA gene. Phytopathology 1992, 82, 828–832. [Google Scholar] [CrossRef]
  36. Jarausch, W.; Peccerella, T.; Schwind, N.; Jarausch, B.; Krczal, G. Establishment of a quantitative real-time PCR assay for the quantification of apple proliferation phytoplasmas in plants and insects. Acta Hort. 2004, 657, 415–420. [Google Scholar] [CrossRef]
  37. Liebenberg, A. Influence of Latent Apple Viruses on Malus sieboldii-Derived Apple Proliferation Resistant Rootstocks. Ph.D. Thesis, Heidelberg University, Heidelberg, Germany, 2013; p. 165. [Google Scholar]
  38. Han, Y.; Gasic, K.; Sun, F.; Xu, M.; Korban, S.S. A gene encoding starch branching enzyme I (SBEI) in apple (Malus × domestica, Rosaceae) and its phylogenetic relationship to Sbe genes from other angiosperms. Mol. Phylogenetic Evol. 2007, 43, 852–863. [Google Scholar] [CrossRef]
  39. Jarausch, W.; Saillard, C.; Dosba, F.; Bové, J.M. Differentiation of mycoplasmalike organisms (MLOs) in European fruit trees by PCR using specific primers derived from the sequence of a chromosomal fragment of the apple proliferation MLO. Appl. Environ. Microbiol. 1994, 60, 2916–2923. [Google Scholar] [CrossRef]
  40. Seemüller, E.; Moll, E.; Schneider, B. Apple proliferation resistance of Malus sieboldii-based rootstocks in comparison to rootstocks derived from other Malus species. Eur. J. Plant Pathol. 2008, 121, 109–119. [Google Scholar] [CrossRef]
  41. R Development Core Team. R: A Language and Environment for Statistical Computing. Available online: http://www.R-project.org/ (accessed on 17 November 2023).
  42. Seemüller, E. Apple proliferation. In Compendium of Apple and Pear Diseases; Jones, A.L., Aldwinkle, H.S., Eds.; APS Press: St. Paul, MN, USA, 1990; pp. 67–68. [Google Scholar]
  43. Bertamini, M.; Muthuchelian, K.; Grando, M.S.; Nedunchezhian, N. Effects of phytoplasma infection on growth and photosynthesis in leaves of field grown apple. Photosynthetica 2002, 40, 157–160. [Google Scholar] [CrossRef]
  44. Aldaghi, M.; Bertaccini, A.; Lepoivre, P. cDNA-AFLP analysis of gene expression changes in apple trees induced by phytoplasma infection during compatible interaction. Eur. J. Plant Pathol. 2012, 134, 117–130. [Google Scholar] [CrossRef]
  45. Öttl, S.; Baric, S.; Dalla Via, J. Teilweise Rotfärbung weist nicht auf Apfeltriebsucht hin. Obstbau Weinbau 2008, 2, 58–59. [Google Scholar]
  46. Schaper, U.; Seemüller, E. Condition of the phloem and the persistence of mycoplasmalike organisms associated with apple proliferation and pear decline. Phytopathology 1982, 72, 736–742. [Google Scholar] [CrossRef]
  47. Jarausch, W.; Schwind, N.; Jarausch, B.; Krczal, G. Analysis of the distribution of apple proliferation phytoplasma subtypes in a local fruit growing region in Southwest Germany. Acta Hort. 2004, 657, 421–424. [Google Scholar] [CrossRef]
  48. Seemüller, E.; Schneider, B. Differences in Virulence and Genomic Features of Strains of ‘Candidatus Phytoplasma mali’, the Apple Proliferation Agent. Phytopathology 2007, 97, 964–970. [Google Scholar] [CrossRef] [PubMed]
  49. Cieślińska, M.; Hennig, E.; Kruczyńska, D.; Bertaccini, A. Genetic diversity of ‘Candidatus Phytoplasma mali’ strains in Poland. Phytopathol. Mediterr. 2015, 54, 477–487. [Google Scholar]
  50. Martini, M.; Ermacora, P.; Falginella, L.; Loi, N.; Carraro, L. Molecular differentiation of ‘Candidatus Phytoplasma mali’ and its spreading in Friuli Venezia Giulia Region (north-east Italy). Acta Hort. 2008, 781, 395–402. [Google Scholar] [CrossRef]
  51. Casati, P.; Quaglino, F.; Tedeschi, R.; Spiga, M.F.; Alma, A.; Spadone, P. Identification and molecular characterization of ‘Candidatus Phytoplasma mali’ isolates in Northwestern Italy. J. Phytopath. 2010, 158, 81–87. [Google Scholar] [CrossRef]
  52. Cainelli, C.; Bisognin, C.; Vindimian, M.E.; Grando, M.S. Genetic variability of AP phytoplasmas detected in the apple growing area of Trentino (Nord Italy). Acta Hort. 2004, 657, 425–430. [Google Scholar] [CrossRef]
  53. Baric, S.; Berger, J.; Cainelli, C.; Kerschbamer, C.; Dalla Via, J. Molecular typing of ‘Candidatus Phytoplasma mali’ and epidemic history tracing by a combined T-RFLP/VNTR analysis approach. Eur. J. Plant Pathol. 2011, 131, 573–584. [Google Scholar] [CrossRef]
  54. Mayer, C.J.; Jarausch, B.; Jarausch, W.; Jelkmann, W.; Vilcinskas, A.; Gross, J. Cacopsylla melanoneura has no relevance as vector of apple proliferation in Germany. Phytopathology 2009, 99, 729–738. [Google Scholar] [CrossRef]
  55. Malagnini, V.; Pedrazzoli, F.; Papetti, C.; Cainelli, C.; Zasso, R.; Gualandri, V.; Pozzebon, A.; Ioriatti, C. Ecological and Genetic Differences between Cacopsylla melanoneura (Hemiptera, Psyllidae) Populations Reveal Species Host Plant Preference. PLoS ONE 2013, 8, e69663. [Google Scholar] [CrossRef] [PubMed]
Figure 1. AP-induced partial reddening (left) or entire reddening of the tree (right).
Agronomy 14 00376 g001
Figure 2. Experimental induction of AP-induced leaf reddening with ex vitro plants infected or not with strain ‘Ca. P. mali’ PM28. Induction period: 11 August–3 September 2020; day/night temperatures 20 °C/5 °C and 22 °C/15 °C.
Agronomy 14 00376 g002
Figure 3. Experimental induction of AP-induced leaf reddening with ex vitro plants infected or not with strain ‘Ca. P. mali’ PM28. Induction period: 5 September–20 September 2019; day/night temperatures 20 °C/5 °C and 22 °C/15 °C.
Agronomy 14 00376 g003
Figure 4. Experimental induction of AP-induced leaf reddening with ex vitro plants infected or not with strain ‘Ca. P. mali’ PM28. Induction period: 21 September–2 October 2020; day/night temperatures 20 °C/5 °C and 20 °C/10 °C.
Agronomy 14 00376 g004
Figure 5. Analysis of the phytoplasma titer in field-collected leaves with different intensities of reddening: up to 5% (class 1), 25% (class 2), 50% (class 3), 75% (class 4), 100% (class 5). Kruskal–Wallis chi-squared = 8.7003, df = 4, p-value = 0.06904; n = 40. Different lowercase letters indicate significant differences among the classes (Duncan’s test: p-value = 0.05).
Agronomy 14 00376 g005
Table 1. Apple orchards with partial and complete reddening monitored between 2019 and 2022.
YearLocal Fruit-Growing RegionNo. Orchards MonitoredNo. Trees MonitoredNo. Trees with Partial ReddeningNo. Trees with Entire Reddening% Trees with Reddening
in Total
2019Meckenheim638195899517.9%
Ilbesheim817302305816.6%
2020Erpolzheim–Weisenheim12615304712.5%
Meckenheim5250154820029.9%
Ilbesheim1428022713310.8%
Winden10189531115824.7%
2021Erpolzheim–Weisenheim21249440317023.0%
Meckenheim8262936719721.5%
Ilbesheim9693882816.7%
Winden45611583233.9%
2022Meckenheim284923711541.5%
Ilbesheim3336815339.9%
Table 2. Correlation of AP symptoms with PCR detection of ‘Ca. P. mali’.
Symptom 2019 2020 2021 2022
No. OrchardsNo. Positive/
Total Samples
% CorrelationNo. OrchardsNo. Positive/
Total Samples
% CorrelationNo. OrchardsNo. Positive/
Total Samples
% CorrelationNo. OrchardsNo. Positive/
Total Samples
% Correlation
Witches’ broom
Enlarged stipule
Stunted branch
Small-sized fruit
Leaf reddening alone
636/36100518/1810028/8100210/10100
1076/7798.70871/7298.61218/18100112/12100
12/210025/510025/510012/2100
715/15100628/2810024/410013/3100
12125/14288.0327123/14684.252298/11982.25572/10171.29
Partial leaf reddening
Leaf reddening of entire crown
1190/10684.912166/7884.621345/5286.54525/3571.43
1135/3697.221957/6883.821853/6779.10447/6671.21
Table 3. Correlation of reddening with AP infection associated with specific symptoms and/or PCR detection.
Symptom 2019 2020 2021 2022
No.
Orchards
No. Trees
Reddened/
Total
% CorrelationNo.
Orchards
No. Trees
Reddened/
Total
% CorrelationNo.
Orchards
No. Trees
Reddened/
Total
% CorrelationNo.
Orchards
No. Trees
Reddened/
Total
% Corre-lation
Witches’ broom
Enlarged stipule
Small-sized fruit
Stunted branch
12102/10696.2327222/23694.0731328/33398.50354/5696.43
12417/43296.5330826/87194.8338693/71397.19546/5092.00
1034/4280.95942/5971.1922150/15497.40444/4695.65
35/510044/666.6732305/30699.67410/1376.92
Table 4. Proportion of reddening trees within different apple cultivars and their relationship to AP infection based on AP symptoms or PCR detection of ‘Ca. P. mali’.
CultivarNo. Orchards MonitoredNo. Trees with Reddening per Total No. MonitoredNo. Infected Trees per Total No. Reddening Trees 1No. PCR-Positive Trees per No. Reddening Trees without Symptoms 2
Axam274/121 (61.16%)23/74 (31.08%)4/5 (80.00%)
Berlepsch280/236 (33.90%)52/80 (65.00%)6/7 (85.71%)
Boskoop3112/259 (43.24%)62/112 (56.25%)16/16 (100%)
Braeburn3119/620 (19.19%)88/119 (73.95%)8/8 (100%)
Celest116/57 (28.07%)15/16 (93.75%)10/10 (100%)
Delbarestivale3115/271 (42.43%)41/115 (35.65%)16/29 (55.17%)
Falstaff117/46 (36.96%)11/17 (64.71%)2/2 (100%)
Fuji213/130 (10.00%)10/13 (76.92%)2/2 (100%)
Gala6230/824 (27.91%)174/230 (75.65%)25/28 (89.29%)
Golden Delicious5489/1303 (37.53%)373/489 (76.28%)39/39 (100%)
Idared342/275 (15.27%)38/42 (90.48%)1/1 (100%)
Jonagold6158/622 (25.40%)94/158 (59.49%)13/14 (92.86%)
Melrose222/212 (10.38%)15/22 (68.18%)8/8 (100%)
Pilot219/83 (22.89%)12/19 (63.16%)5/6 (83.33%)
Pink Lady221/76 (27.63%)18/21 (85.71%)5/5 (100%)
Pinova8166/965 (17.20%)126/166 (75.90%)13/16 (81.25%)
Royal Gala298/171 (57.03%)92/98 (93.88%)10/11 (90.90%)
Rubinette5152/602 (25.25%)107/152 (70.39%)34/40 (85.00%)
Rubinola254/350 (15.43%)27/54 (50.00%)13/19 (68.42%)
Topaz296/334 (28.74%)63/96 (65.63%)26/33 (78.79%)
Total622093/7557 (27.70%)1441/2093 (68.85%)256/299 (85.62%)
1 based on AP symptoms and/or PCR detection. 2 based on PCR detection.
Table 5. Mean minimum and maximum day temperatures in putative AP induction periods in 2019–2022 (weather station Neustadt/Weinstrasse).
2019202020212022
Night18 September–21 September19 September–21 September21 September–25 September21 September–24 September
mean Tmin5.15 °C7.3 °C7.34 °C4.05 °C
Day19 September–23 September19 September–24 September22 September–27 September21 September–24 September
mean Tmax21.80 °C24.97 °C23.42 °C20.05 °C
Table 6. Mean phytoplasma titer in leaf petioles of ‘Ca. P. mali’-infected plants after cold night induction compared to control plants after 23, 15 or 11 days, respectively, and correlation between leaf reddening and phytoplasma titer.
Period of InductionNo. PlantsTemperature Regime (12 h Light/12 h dark)Phytoplasma Titer
(Phytoplasma/Plant Cell)
Reddening IndexCorrelation
11 August 2020–3 September 2020220 °C/5 °C7.03 n.s. 10.76 4−0.24269
11 August 2020–3 September 2020222 °C/15 °C5.30 n.s.0.100.15467
5 September 2019–20 September 2019320 °C/5 °C39.91 n.s. 21.70 50.05243
5 September 2019–20 September 2019322 °C/15 °C46.48 n.s.0.300.36145
21 September 2020–2 October 2020320 °C/5 °C6.15 31.89 60.06469
21 September 2020–2 October 2020422 °C/15 °C3.311.28−0.49252
1 Wilcoxon rank sum test: W = 245, p-value = 0.2315; n = 20. 2 Welch two-sample t-test: t = −1.4206, df = 55.85, p-value = 0.161; n = 30. 3 Wilcoxon rank sum test: W = 890, p-value = 0.0001682; n = 30. 4 Wilcoxon rank sum test: W = 302.5, p-value = 0.004559; n = 20. 5 Wilcoxon rank sum test: W = 756, p-value = 1.139 × 10⁻⁶; n = 30. 6 Wilcoxon rank sum test: W = 814, p-value = 0.004485.
Table 7. Correlation of AP symptoms and reddening with ‘Ca. P. mali’ subtypes.
Origin of SamplesCorrelation with Different Symptoms
Ca. P. mali’ SubtypeNo. RegionsNo.
Orchards
Total No. AnalyzedWitches’
Broom
Enlarged
Stipules
Partial
Reddening
Entire
Reddening
Mean CDI 1
AT-17208915/89
(16.85%)
31/89
(34.83%)
49/89
(55.06%)
32/89
(35.96%)
1.80 n.s. 2
AT-2513331/33
(3.03%)
17/33
(51.52%)
22/33
(66.67%)
7/33
(21.21%)
1.67 n.s.
AP72511628/116 (24.14%)56/116
(48.28%)
73/116
(62.93%)
25/116
(21.55%)
2.10 n.s.
1 cumulative disease index (see Materials and Methods). 2 statistically not significant (Kruskal–Wallis chi-squared = 1.2286, df = 2, p-value = 0.541).
Disclaimer/Publisher’s Note: The statements, opinions and data contained in all publications are solely those of the individual author(s) and contributor(s) and not of MDPI and/or the editor(s). MDPI and/or the editor(s) disclaim responsibility for any injury to people or property resulting from any ideas, methods, instructions or products referred to in the content.

