Article

Exogenous Melatonin Affects the Morphometric Characteristics and Glucosinolates during the Initial Growth Stages of Broccoli

1
Department of Agriculture, Food and Environment (Di3A), University of Catania, Via Valdisavoia 5, 95123 Catania, Italy
2
Laboratory of Molecular Genetics Immunology and Biotechnology (LR99ES12), Faculty of Sciences of Tunis, University of Tunis El Manar, Tunis 2092, Tunisia
3
Group of Genetics, Breeding and Biochemistry of Brassicas, Misión Biológica de Galicia, Spanish Council for Scientific Research (CSIC), Apartado 28, 36080 Pontevedra, Spain
*
Author to whom correspondence should be addressed.
Agronomy 2024, 14(2), 286; https://doi.org/10.3390/agronomy14020286
Submission received: 27 December 2023 / Revised: 23 January 2024 / Accepted: 24 January 2024 / Published: 27 January 2024
(This article belongs to the Section Plant-Crop Biology and Biochemistry)

Abstract

:
Nowadays, there is a global surge in interest surrounding novel foods, particularly sprouts, microgreens, and baby leaves, attributed to their rich content of bioactive compounds, such as phenolic derivatives, glucosinolates, and vitamins. This study delves into the impact of exogenously applied melatonin on novel foods derived from Brassica oleracea L. Two distinct cultivars of broccoli (Brassica oleracea var. italica Plenck), namely Sicilian sprouting broccoli (Broccolo nero) and a commercial variety (Cavolo Broccolo Ramoso Calabrese), were compared across the sprouts, microgreens, and baby leaves stages, adhering to organic farming practices. Various doses of melatonin (0, 50, and 100 µM) were administered at each harvesting stage. Plantlets were collected at different growth stages and assessed for key morphometric traits, including the weight, hypocotyl length, and cotyledon dimensions during the sprouts stage. For microgreens, the number and dimensions of the true leaves were recorded, while for baby leaves, the stem length was additionally measured. The analysis of glucosinolates was carried out using a high-performance liquid chromatograph with a diode array detector (HPLC-DAD). The results revealed significant variations among the experimental factors considered. Melatonin application significantly influenced the morphometric parameters at different growth stages, exhibiting notable variations in the weight, hypocotyl length, cotyledon width, and leaf width. The GLSs profile exhibited significant variations between the different growth stages and genotypes studied. Particularly noteworthy was the tendency for the GLSs content to be higher during the sprouts stage compared to the baby leaves stage, ranging from 24.07 to 4.61 µmol g−1 d.w. from sprouts to baby leaves, respectively.

1. Introduction

The Brassicaceae family, also known as cruciferous vegetables, is well spread all over the world and encompasses herbaceous, annual, biennial, and perennial plants. It includes, in particular, 338–360 genera and about 3709 species adapted to different environmental conditions [1]. They are distinguished by their typical cross-shaped flowers and can be classified based on different plant morphologies, shaped by selective breeding for specific plant parts, including the leaves, petioles, buds, flowers, roots, or seeds [2].
Brassica oleracea L. is a taxonomically significant species, encompassing different crops with relevant economic importance. It comprises different species, such as Brassica oleracea L. (broccoli, cauliflower, cabbage, Brussels sprouts, kale), Brassica nigra (black mustard), Brassica napus (rapeseed) and Brassica rapa (turnip, rape, Chinese cabbage) [3,4]. Among the B. oleracea crops, Brassica oleracea var. italica L., commonly known as broccoli, is emerging as a noteworthy vegetable, characterized by its hypertrophic reproductive organ, with different curd sizes and shapes. Several crop wild relatives (CWRs) and landraces are overspread and distinguished based on their typical morphometric characteristics [5] and biochemical profiles, such as the glucosinolates amount, polyphenols, ascorbic acid, and vitamins [6,7]. Brassica oleracea L. products can be utilized for various purposes, from food and fodder to medicinal use, acting as model plants for research, high-yielding crops, and even ornamental plants. They represent a rich source of bioactive compounds, such as glucosinolates, polyphenols, ascorbic acid, and vitamins [8,9,10].
Glucosinolates are the primary secondary metabolites found in Brassica plants. These sulfur compounds consist of a thioglucoside group and a side chain derived from specific amino acids, namely alanine, valine, leucine, isoleucine, phenylalanine, methionine, tyrosine, and tryptophan. Consequently, glucosinolates can be categorized into three distinct chemical groups: aliphatic, aromatic, and indolic. This classification is based on the types of amino acids present in the side chain, providing a systematic framework for understanding the variations in the glucosinolate structures [11]. Glucosinolates are not biologically active until they undergo enzymatic hydrolysis via the plant’s endogenous enzyme, myrosinase (thioglucoside glucohydrolase, E.C. 3.2.1.147). The result of this enzymatic breakdown is different bioactive products, including isothiocyanates, nitriles, thiocyanates, epithionitriles, oxazolidine-2-thiones, and epithioalkanes [12].
The process depends on different factors, such as the substrate, pH conditions, the presence of ferrous ions, and the amount and activity of specific proteins, like the epithio-specifier protein (ESP) [13]. The profile and amount of glucosinolates varies among the Brassica species and cultivars, the different conditions for growing and harvesting, the different parts of plants considered, and the processing conditions. Several studies have shown an increase in glucosinolates in the leaves in comparison to the roots, particularly in response to drought stress [14]. Sinigrin, glucobrassicin, and glucoiberin are recognized as the pre-dominant GLSs in kale and cabbage, while glucoraphanin, glucobrassicin, and neoglucobrassicin are the prevalent GLSs in broccoli [15]. Numerous research findings have shown their potential preventive action against chronic-degenerative human disease due to their influence during the initiation and promotion phases of cancer development [16,17,18]. The treatments with various elicitors could affect the morphometric parameters of the plants and the secondary metabolite production.
Melatonin, chemically known as N-acetyl-5-methoxytryptamine, constitutes an amphiphilic, low-molecular-weight hormone, which is characterized by its indolic structure. It is synthesized by various organisms, including plants, where its production plays an important role in different physiological functions [19,20,21]. In plants, melatonin biosynthesis involves multiple enzymatic steps, starting with tryptophan as the precursor and serotonin as the intermediate in the process [22,23,24]. Several studies have demonstrated the effects on various physiological processes in plants [25], enhancing seed germination, biomass production, photosynthesis rate, fruit ripening, osmoregulation, and root development, and the response of the plants to abiotic/biotic stress [26,27,28]. It can also regulate the antioxidant pathways of the plants and the biosynthesis of secondary metabolites, including the amount and the profile of the glucosinolates [29,30]. It is well-established that the application of exogenous melatonin significantly benefits the growth and development of plants under abiotic stress [31,32]. This positive impact is realized through multiple mechanisms, including the alleviation of oxidative stress via activating antioxidant systems and inducing alterations in the expression of stress-responsive genes and heat shock proteins (HSPs) [33].
Nowadays, consumers are currently preferring foods not only for their taste but also for their perception of the health and well-being benefits. The food supply chain, in response to this trend, has introduced novel foods, such as sprouts, microgreens, and baby leaves. These products are ready to eat and represent good sources of antioxidant compounds, such as glucosinolates, phenolic compounds, vitamins, and minerals. Sprouts (germinating seeds with a cotyledon discloser without true leaves), microgreens (plantlets with the appearance of the first true leaf) and baby leaves (plantlets with almost three true leaves) are considered novel foods due to their bioactive compound content, potentially contributing positively to human health [34]. Sprouts, microgreens, and baby leaves can be easily cultivated in urban or peri-urban settings. This can be undertaken by specialized vegetable farmers or even by consumers themselves. They present a short growth cycle and can be adopted by different cultivation systems, such as hydroponic, aeroponic systems, or modulating light conditions and temperature regimes [35,36]. These novel food items are primarily consumed in their raw state, employing simple processing that includes cleaning, cutting, packaging, and refrigerated storage. This approach is designed to prevent the degradation of bioactive compounds, which is generally associated with heat processes such as cooking and sterilization. Sprouts, microgreens, and baby leaves can be used in many dishes as condiments and ingredients.
The objective of this study is to assess the impact of melatonin application on the early growth stages of broccoli, with a focus on enhancing both the growth and glucosinolate content of novel food products, including sprouts, microgreens, and baby leaves. Specifically, our investigation targets two varieties: Sicilian sprouting black broccoli, Broccolo nero (Brassica oleracea var. italica Plenck), and a commercial variety, Cavolo Broccolo Ramoso Calabrese (Brassica oleracea var. italica Plenck). Comprehensive evaluations at various growth stages involve the characterization of the morphometric parameters and glucosinolate profiles. The ultimate goal is to optimize the cultivation methods to enhance the antioxidant properties of these innovative foods.

2. Materials and Methods

2.1. Experimental Design

One Sicilian sprouting black broccoli, Broccolo nero (BN), belonging to the Di3A active brassica genebank collection, was compared to a commercial variety of broccoli, Cavolo Broccolo Ramoso Calabrese (CR), provided by the S.A.I.S. S.p.A. seed company located in Cesena, Italy. The sowing was carried out on 21 April 2023, in a cold greenhouse located in Catania (South Italy, 37°31′10″ N, 15°04′18″ E; 105 m above sea level (m a.s.l.)), under natural light and temperature conditions. The seeds were sown in cellular trays, each comprising 104 holes, and filled with the organic substrate Brill® Semina Bio from Geotec, Italy. Specifically, twenty seeds were allocated to each hole and one cellular tray was considered as a replicate unit. The experimental design adopted was a split-plot with three experimental factors: the first one was the different melatonin treatments (TLC 73-31-4—Millipore Sigma, St. Louis, MO, USA) (melatonin, M: M0, M50, and M100 µM L–1); the second factor was the different growth stages of the plants (GS), while the third one was the genotype (GE). Each experimental condition was replicated three times. The melatonin treatment was as follows: H2O and 0 μmol L–1 melatonin (M0), H2O and 50 μmol L–1 melatonin (M50), H2O and 100 μmol L–1 melatonin (M100). Melatonin was applied for sprouts, a single dosage at sowing through soil drench; for microgreens, two applications (at sowing and post-sprout collection); and three applications for baby leaves (at sowing, after sprout collection, and post-harvesting microgreens) using the foliar spray method. The plants were harvested at three different initial growth stages: sprouts were collected when the cotyledons were disclosed, precisely 7 days from sowing on average; microgreens were harvested at the appearance of the first leaf, around 15 days from sowing on average; and baby leaves were collected when 3–4 true leaves were present, after an average of 1 month from sowing.

2.2. Plant Materials

The plants were washed and analyzed in terms of their main morphometric parameters, including the weight of 10 individual plants (W), hypocotyl length (HL), cotyledon length and width (CL and CW, respectively) for sprouts. Additionally, for microgreens, the number (N), length and width of the true leaves (LL and LW, respectively) were registered. For baby leaves, in addition, the stem length (SL) was recorded [37,38]. The morphometric measurements were carried out using an Epson Perfection V850 Pro scanner ( SEIKO EPSON CORPORATION, Nagano-ken, Japan) with WinFolia Regular 2020 software. The plants, consequently, were frozen at −80 °C, freeze-dried, ground into a fine powder, and utilized for glucosinolates analysis.

2.3. Glucosinolates Extraction

The glucosinolate extraction was performed according to Kliebenstein et al., 2001, with some modifications [39]. A total of 10 milligrams of lyophilized materials for each sample was extracted in 400 μL of methanol, 10 μL of 0.3 M lead acetate, 120 μL of water, and 10 μL of glucotrapaeolin as an internal standard. The samples were mixed for 1.30′ at 25 1/s to facilitate the extraction and incubated for 60 min at 250 rpm at room temperature. The mixture was pelleted via centrifuging for 12 min at 3700 rpm (2250 FCR). Ninety-six-well filter plates were loaded with 45 μL of diethylaminoethyl Sephadex A-25 using a Millipore multiscreen column loader. Then, 300 μL of water was added to equilibrate for 2 to 4 h. Consequently, 150 µL of supernatants was added to the columns after the water was removed with 2 to 5 s of vacuum. This step was repeated once to bring the total volume of 300 μL. To disulfate the glucosinolates on the column, 10 μL of water and 10 μL of sulfatase (Sigma-Aldrich, St. Louis, MO, USA) solution were added to each column and the plates were incubated overnight at room temperature. The desulfoglucosinolates were eluted twice with 100 μL of 60% (by volume) methanol and twice with 100 μL of water. The supernatant was collected and utilized for HPLC analysis.

2.4. High-Performance Liquid Chromatography (HPLC) Analysis

The chromatographic analyses were carried out on a high-performance liquid chromatograph ACQUITY UPLC H-Class PLUS (Waters, Milford, MA, USA) equipped with a photodiode array detector. The UPLC column was a C18 ACQUITY UPLC HSS T3 (Waters, Milford, MA, USA) (1.8 μm particle size, 50 × 2.1 mm i.d.) and was protected with a C18 guard column (Waters). The oven temperature was set at 35 °C. The mobile phase was a mixture of (A) 100% H2O and (B) 25% acetonitrile (v/v). The flow rate was set at 0.6 mL·min−1, starting with 95% of solvent A, followed by a linear gradient from 0.2 to 1.2 min to 90% A, 1.2–2.5 min to 70% A, 2.5–4.0 to 30% A, 4.0–5.4 to 0% A, keeping 0% A for 1.6 min and returning to 95% A for 1 min. Compounds were detected at 229 nm. Five microliters of the sample’s extracts were used to identify and quantify the glucosinolates. The results were expressed as the µmol g−1 of dry weight (d.w.). The GLSs standards were: GRA = glucoraphanin, GER = glucoerucin, GIB = glucoiberin, GBS = glucobrassicin, MeOHGBS = 4-methoxyglucobrassicin, NeoGBS = neoglucobrassicin, OHGBS = 4-hydroxiglucobrassicin, and GTP = glucotrapeolin (Figures S1 and S2). All the standards were purchased from ChromaDex (Santa Ana, CA, USA).

2.5. Statistical Analysis

A two-way analysis of variance (ANOVA) was performed to evaluate the effects of the melatonin and genotype on the morphometric plant traits. The mean values associated with the main factors, as well as their interactions, were evaluated using Tukey’s post hoc test (p < 0.05). The significance of the differences for the glucosinolates profile was elaborated via a three-way analysis of variance (ANOVA). All the statistical analyses were conducted using CoStat version 6.451 (CoHort Software in Birmingham, UK). The statistical analysis was performed using the SPSS software version 27. Heat maps of the Pearson’s correlation was produced using GraphPad Prism version 8.0 (GraphPad Software, Inc., San Diego, CA, USA). The Principal Component Analysis (PCA) was conducted using the XLSTAT2018 software (Addinsoft, Paris, France).

3. Results

3.1. Morphometric Traits

For the sprouts, with regard to the weight, no significant interaction of M × GE was observed. However, it was affected by the genotype and its value varied from 0.76 to 0.61 for the CR and BN, respectively (Table 1). For the hypocotyl length, a significant variation was ascertained and its value ranged from 31.68 to 19.58 mm for the CR M100 and BN M100, respectively. The cotyledon length was significantly affected by the genotype, with values ranging from 10.55 to 9.90 mm for the CR and BN, respectively. Additionally, for the cotyledon width, we observed a significant interaction, with the values varying from 12.63 to 10.14 mm for the BN and CR, respectively, in the M50 treatment. For the other parameters, no significant interactions were detected. The hypocotyl length and cotyledon width were most significantly influenced by the melatonin treatment, with the CR displaying more noticeable variations compared to the other genotype.
For the microgreens, a significant interaction was ascertained for the weight, with the values varying from 2.01 to 1.09 g for the CR M50 and BN M100, respectively (Table 2). For the hypocotyl length, we observed a significant interaction of M × GE and its values ranged from 32.62 to 22.29 mm for the CR M100 and BN M0, respectively. The cotyledon length was affected by the genotype, with values ranging from 10.96 to 10.28 mm for the CR and BN, respectively. However, for the cotyledon width, no significant variations were observed. The dimensions of the leaves were affected by the genotype. The leaf length varied from 13.07 to 11.31 mm for the CR and BN, respectively, while the leaf width values fluctuated from 9.86 to 7.96 mm for the CR and BN, respectively. During this plant growth stage, the melatonin treatment notably influenced the weight and hypocotyl length, showing many variations for the CR.
For the baby leaves, concerning the weight, no significant interaction was observed, while it was affected by the genotype, with values varying from 7.31 to 5.96 for the CR and BN, respectively (Table 3). A significant interaction of M × GE was determined for the stem length, with values ranging from 57.79 to 48.03 mm for the CR M0 and CR M50, respectively. No significant variation was observed for the number of leaves and leaf length, whereas for the leaf width, we ascertained a significant interaction, with values varying from 23.43 to 19.53 mm for the CR M100 and BN M0, respectively. For the baby leaves, we observed a significant interaction for the stem length and leaf width, constituting an important factor in determining the overall dimensions of the plant.

3.2. Glucosinolates Profile

The analysis of variance (ANOVA) showed significant variations between the total and individual glucosinolate amount in relation to the different experimental factors considered (Table 4). The growth stage and the genotype affected significantly the glucosinolates profile. The results offer valuable insights into the different pathways of glucosinolates during the first growth stage of the plant (sprouts, microgreens, and baby leaves).
The total glucosinolate content (µmol g−1 d.w.) varied significantly in relation to the growth stage and genotype, showing an interaction of GS × GE (Table 4). The total glucosinolate amount ranged from 2.98 to 28.07 µmol g−1 d.w. for the BN M100 baby leaves and CR M100 sprouts, respectively (Figure 1). The total glucosinolate content was higher for the sprouts compared to the baby leaves for the two genotypes tested. The CR showed the highest amount of total glucosinolates, particularly during the sprouts stage, while it exhibited a comparable amount to the BN during the microgreens and baby leaves stages.

3.3. The Variation of Individual Glucosinolates

The individual glucosinolates showed significant variations concerning the experimental factors considered (Figure 2). Specifically, aliphatic and indolic glucosinolates were detected. The glucoraphanin, glucoerucin, and glucoiberin were identified as the aliphatic glucosinolates during the first growth stage of the plants in all the tested genotypes.
The glucoraphanin content exhibited a significant interaction of GS × GE, with values varying from 6.33 to 15.26 µmol g−1 d.w. for the BN and CR at the sprouts stage, respectively. The glucoraphanin content during the sprouts stage is shown to be more than double that of the baby leaves stage.
A significant interaction between GS × GE was observed for the glucoerucin amount, whose value fluctuated from 0.02 to 3.12 µmol g−1 d.w. for the CR baby leaves and CR sprouts, respectively. The glucoerucin was not detected for the BN baby leaves in the different melatonin applications.
The glucoiberin profile varied significantly in relation to the growth stage and genotype, showing as mentioned before for glucoraphanin and glucoerucin, a significant interaction of GS × GE. Its value fluctuated from 0.02 to 3.10 µmol g−1 d.w. for the CR microgreens and BN sprouts, respectively. The glucoiberin was not found for the CR microgreens considering the M50 plot and in the CR baby leaves grown in the M50 and M100 conditions.
Concerning the indolic glucosinolates, the glucobrassicin, 4-methoxyglucobrassicin, neoglucobrassicin and 4-hydroxiglucobrassicin were detected.
The glucobrassicin content was affected significantly by the interaction of M × GE, with values ranging from 0.87 to 5.56 µmol g−1 d.w. for the BN baby leaves grown in the M100 plot and the BN microgreens in the M0 condition, respectively. The highest amount was generally detected during the microgreens stage for both tested genotypes.
The 4-methoxyglucobrassicin amount varied significantly in relation to the growth stage and genotype. The highest value was detected for the BN sprouts (1.07 µmol g−1 d.w.), whereas the lowest value was observed for the CR sprouts (0.95 µmol g−1 d.w.).
The neoglucobrassicin showed a significant interaction of GS × GE and its value varied from 0.13 to 1.18 µmol g−1 d.w. for the BN baby leaves and BN sprouts grown in the M100 and M0 plots, respectively. The neoglucobrassicin, generally, was detected in lower amounts in all the conditions tested.
The 4-hydroxiglucobrassicin content, finally, was affected significantly by the interaction of GS × GE, which varied from 0.70 to 4.50 µmol g−1 d.w. for the BN baby leaves and CR microgreens, respectively. The 4-hydroxiglucobrassicin was found in lower amounts in the experimental conditions considered.
The aliphatic glucosinolates were predominant in the sprouts stage for both genotypes studied (Figure 2). The glucoraphanin for the BN represents 44.75% of the total glucosinolates; in relation to the melatonin application, a decrease to 7.42% was observed, while the glucoiberin increased from 8.35% to 18.36% for the M0 and M100 conditions, respectively. The glucoerucin was found in very low percentages for the BN sprouts. The glucoraphanin increased from 52.87% to 57.37% of the total glucosinolates in relation to the melatonin treatment for the CR M0 and CR M50, respectively. The glucoerucin under the melatonin treatment increased from 8.86% to 11.10%. For the glucoiberin, a minimal percentage was detected.
The aliphatic glucosinolates decreased during the microgreens and baby leaves stages for both genotypes, while an increase in the indolic glucosinolates was observed. The glucobrassicin represents 38.86% of the total glucosinolates for the BN baby leaves and its value decreased to 29.02% under the M100 treatment. The 4-methoxyglucobrassicin increased from 14.15% to 33.84% for the M0 to M100 conditions at the baby leaves stage. The neoglucobrassicin increased to 6.96% of the total glucosinolates under the M100 conditions for the microgreens. The 4-hydroxiglucobrassicin represents 29.63% of the total glucosinolates for the baby leaves; under the melatonin treatment, a decrease to 23.22% was determined.
For the CR, the percentage of glucobrassicin was 36.50% of the total glucosinolates in the microgreens stage. The 4-methoxyglucobrassicin was found in the highest percentage for baby leaves stage and its value was 21.08%. The neoglucobrassicin indicates 5.38% of the total glucosinolates for the baby leaves. The percentage of glucobrassicin and neoglucobrassicin, generally, decreased under the melatonin conditions, while the 4-hydroxiglucobrassicin increased from 30.48% to 40.64% for the M0 and M100 conditions.

3.4. Correlation and Principal Component Analysis (PCA)

The correlation analysis among the different GLSs detected for the genotypes studied was performed to show the GLS profile and their pathway concerning the plant’s growth stages variation in the melatonin conditions.
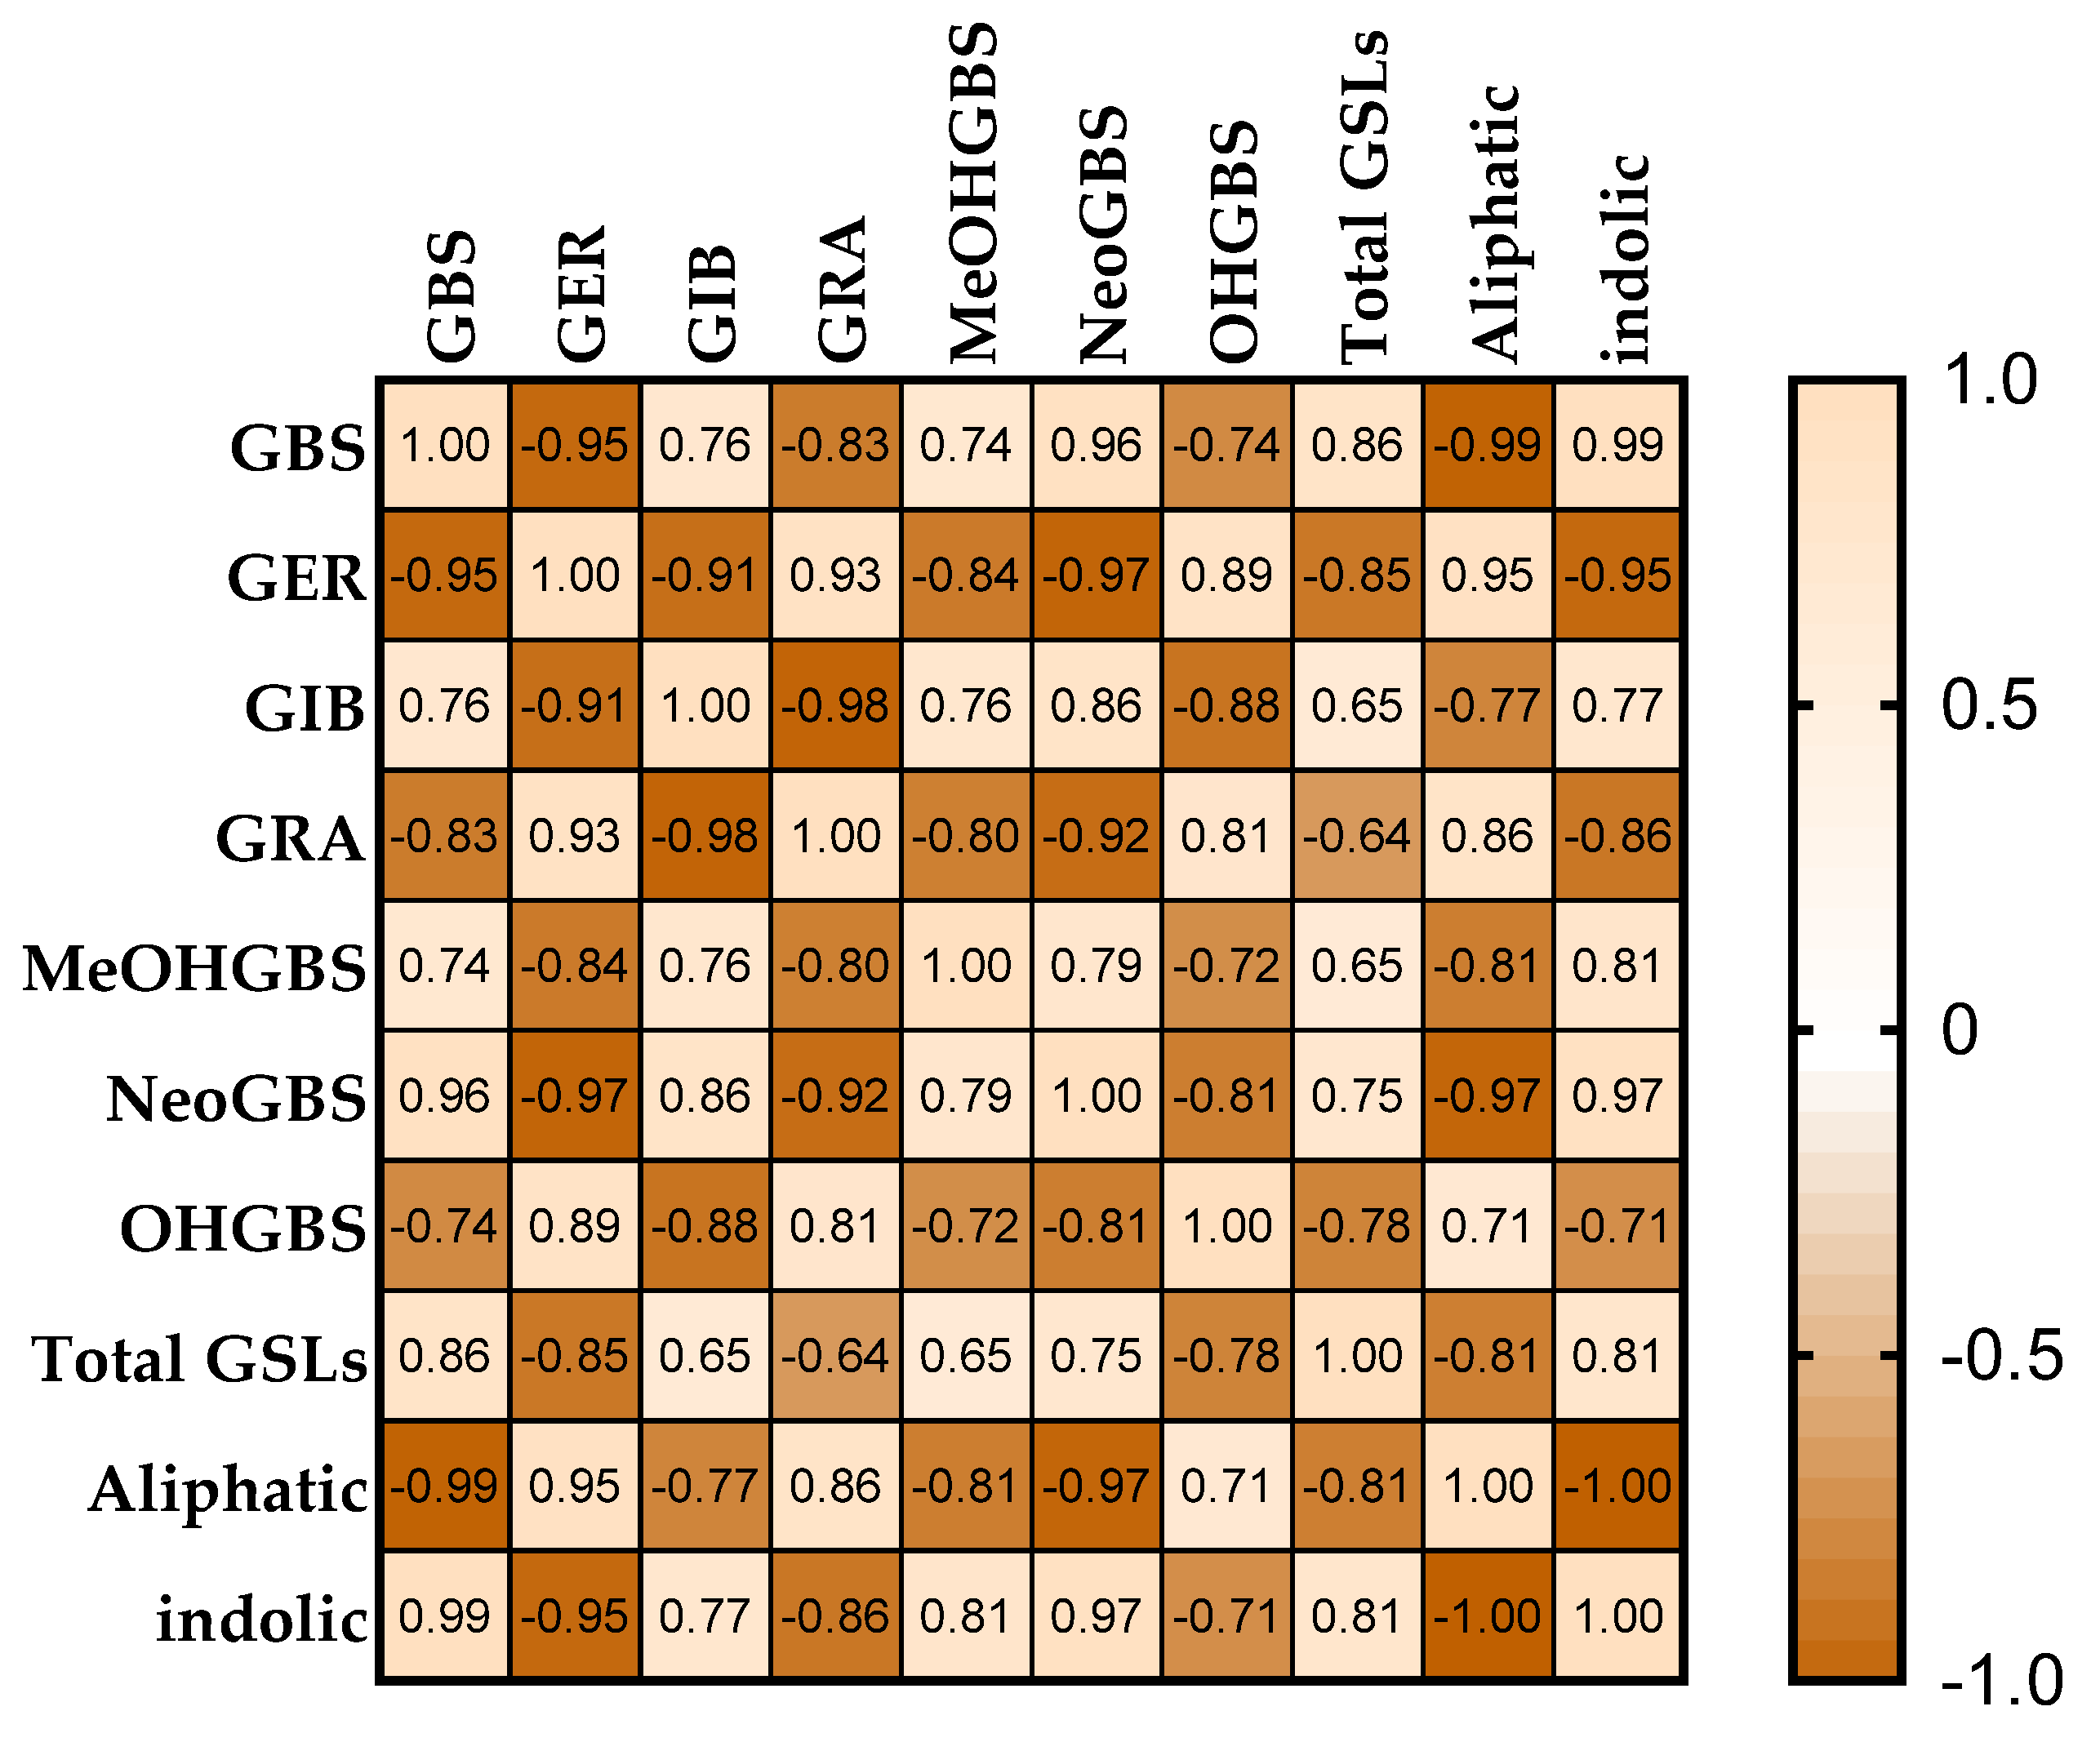
For the sprouts, the glucoraphanin showed a high significant correlation with the aliphatic glucosinolate glucoerucin (r = 0.926, p < 0.001), while a strong negative correlation was observed between the glucoraphanin and glucoiberin (r = −0.964, p < 0.001) (Figure 3). The glucoraphanin was significantly highly negatively correlated with the indolic glucosinolates, glucobrassicin, 4-methoxyglucobrassicin, neoglucobrassicin and the total amount of the indolic glucosinolates, as they are characterized by different metabolic pathways. A strong negative correlation was observed between the glucoerucin and glucoiberin. In addition, the glucoerucin showed a negative correlation with the indolic glucosinolates glucobrassicin, 4-methoxyglucobrassicin, neoglucobrassicin, while a high positive correlation was observed between the glucoerucin and 4-hydroxiglucobrassicin. The glucoerucin showed, additionally, a strong positive correlation with the total aliphatic glucosinolates. The glucoiberin was correlated positively with the indolic glucosinolates, 4-methoxyglucobrassicin and neoglucobrassicin.
For the indolic glucosinolates, glucobrassicin was highly positively correlated with 4-methoxyglucobrassicin and neoglucobrassicin, while it was highly negatively correlated with the total aliphatic glucosinolates, as the metabolic pathways are different. The 4-methoxyglucobrassicin showed a high positive correlation with the neoglucobrassicin and the total indolic glucosinolates, while it was negatively correlated with the total aliphatic glucosinolates. The indolic glucosinolate neoglucobrassicin showed a high negative correlation with the total aliphatic glucosinolates, while a strong positive correlation was observed between the neoglucobrassicin and the total indolic glucosinolates.
For the microgreens, the glucoraphanin showed a positive correlation with the total aliphatic glucosinolates, while it was negatively correlated with the total indolic glucosinolates (Figure 4). The glucoerucin showed no correlation with all the glucosinolates detected. The aliphatic glucosinolate glucoiberin was high positively correlated with the neoglucobrassicin and the total aliphatic glucosinolates, while it was high negatively correlated with the 4-hydroxiglucobrassicin and the total indolic glucosinolates. The glucobrassicin showed no correlation with all the glucosinolates detected. The indolic glucosinolate 4-methoxyglucobrassicin showed no correlation with all the glucosinolates detected, except for a significant negative correlation with the total GLSs. The neoglucobrassicin showed a high significant negative correlation with the 4-hydroxiglucobrassicin and the total indolic glucosinolates. A strong negative correlation was observed between the 4-hydroxiglucobrassicin and the total aliphatic glucosinolates, while it showed a high positive correlation with the total indolic glucosinolates.
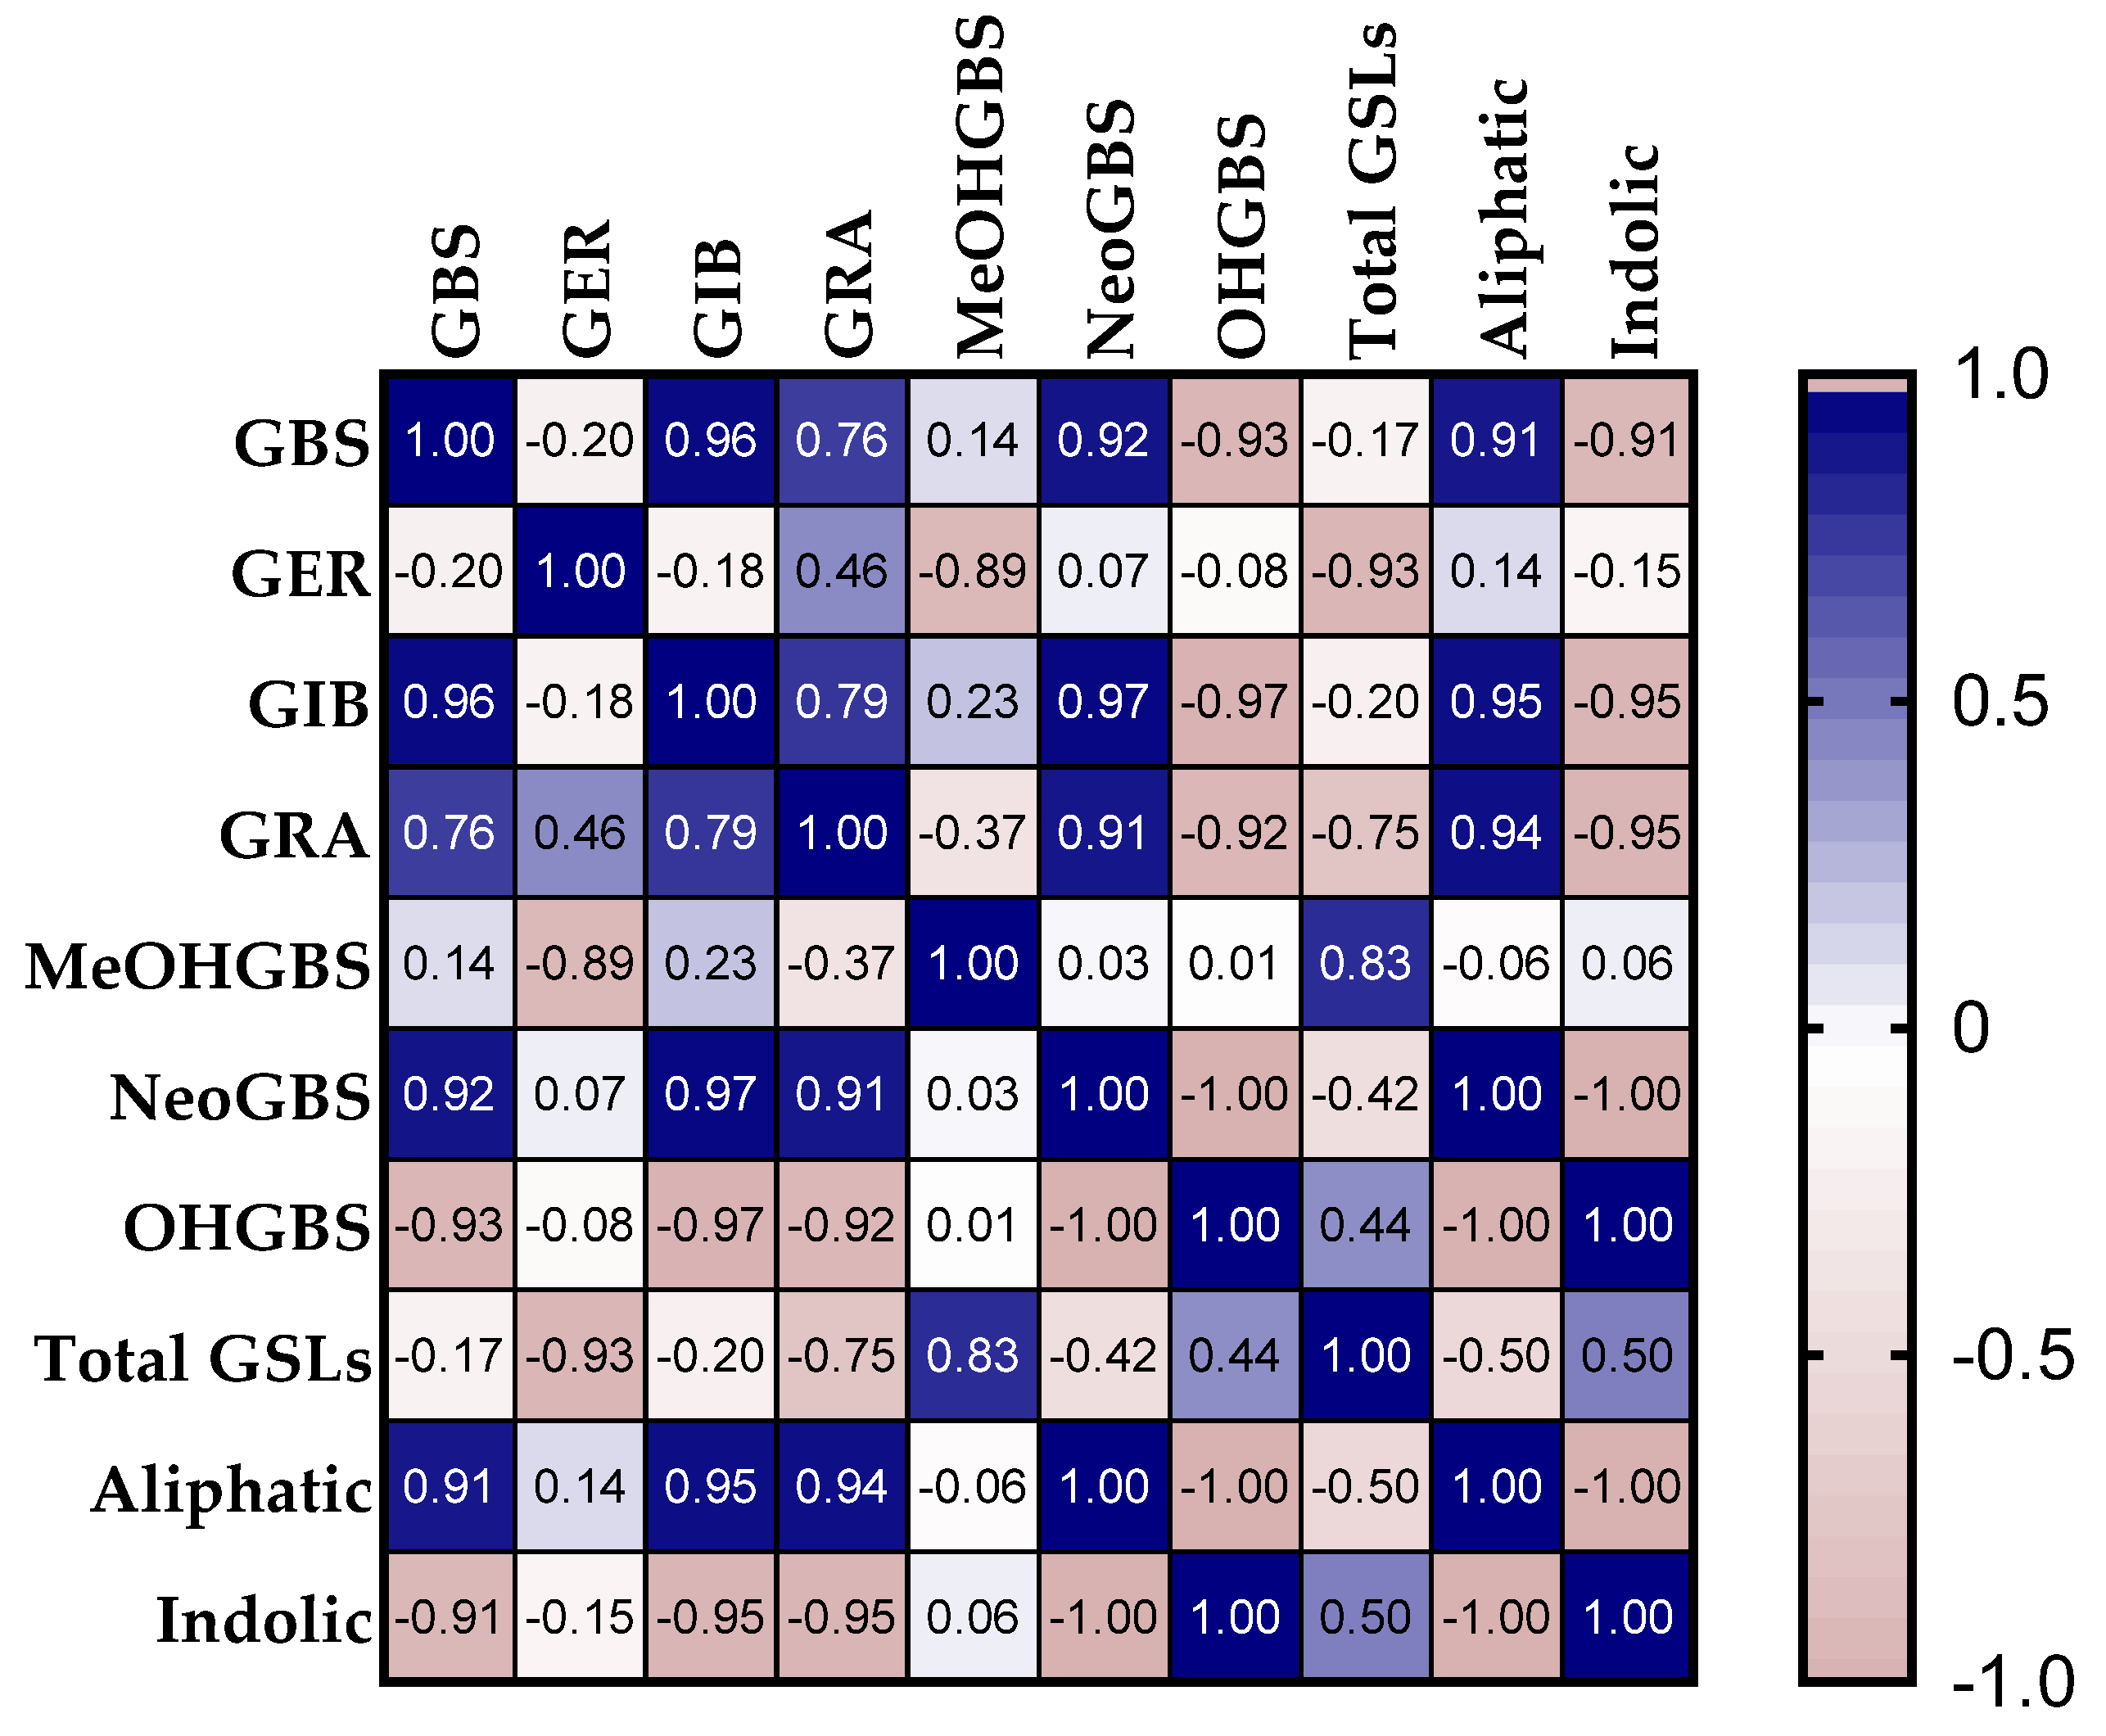
For the baby leaves, the glucoraphanin was positively correlated with the aliphatic glucosinolate glucoerucin (Figure 5). In addition, a strong positive correlation was observed between the glucoraphanin and the total aliphatic glucosinolates. The glucoerucin showed a high negative correlation with the aliphatic glucosinolate glucoiberin, while a strong positive correlation was observed between the glucoerucin and 4-hydroxiglucobrassicin. The glucoiberin showed no correlation with all the glucosinolates detected, except for a significant negative correlation with the indolic glucosinolate 4-hydroxiglucobrassicin. No correlation was observed for the glucobrassicin. The indolic glucosinolate 4-methoxyglucobrassicin showed a significant negative correlation with the neoglucobrassicin and the total GLSs. The neoglucobrassicin was positively correlated with the total GLSs.
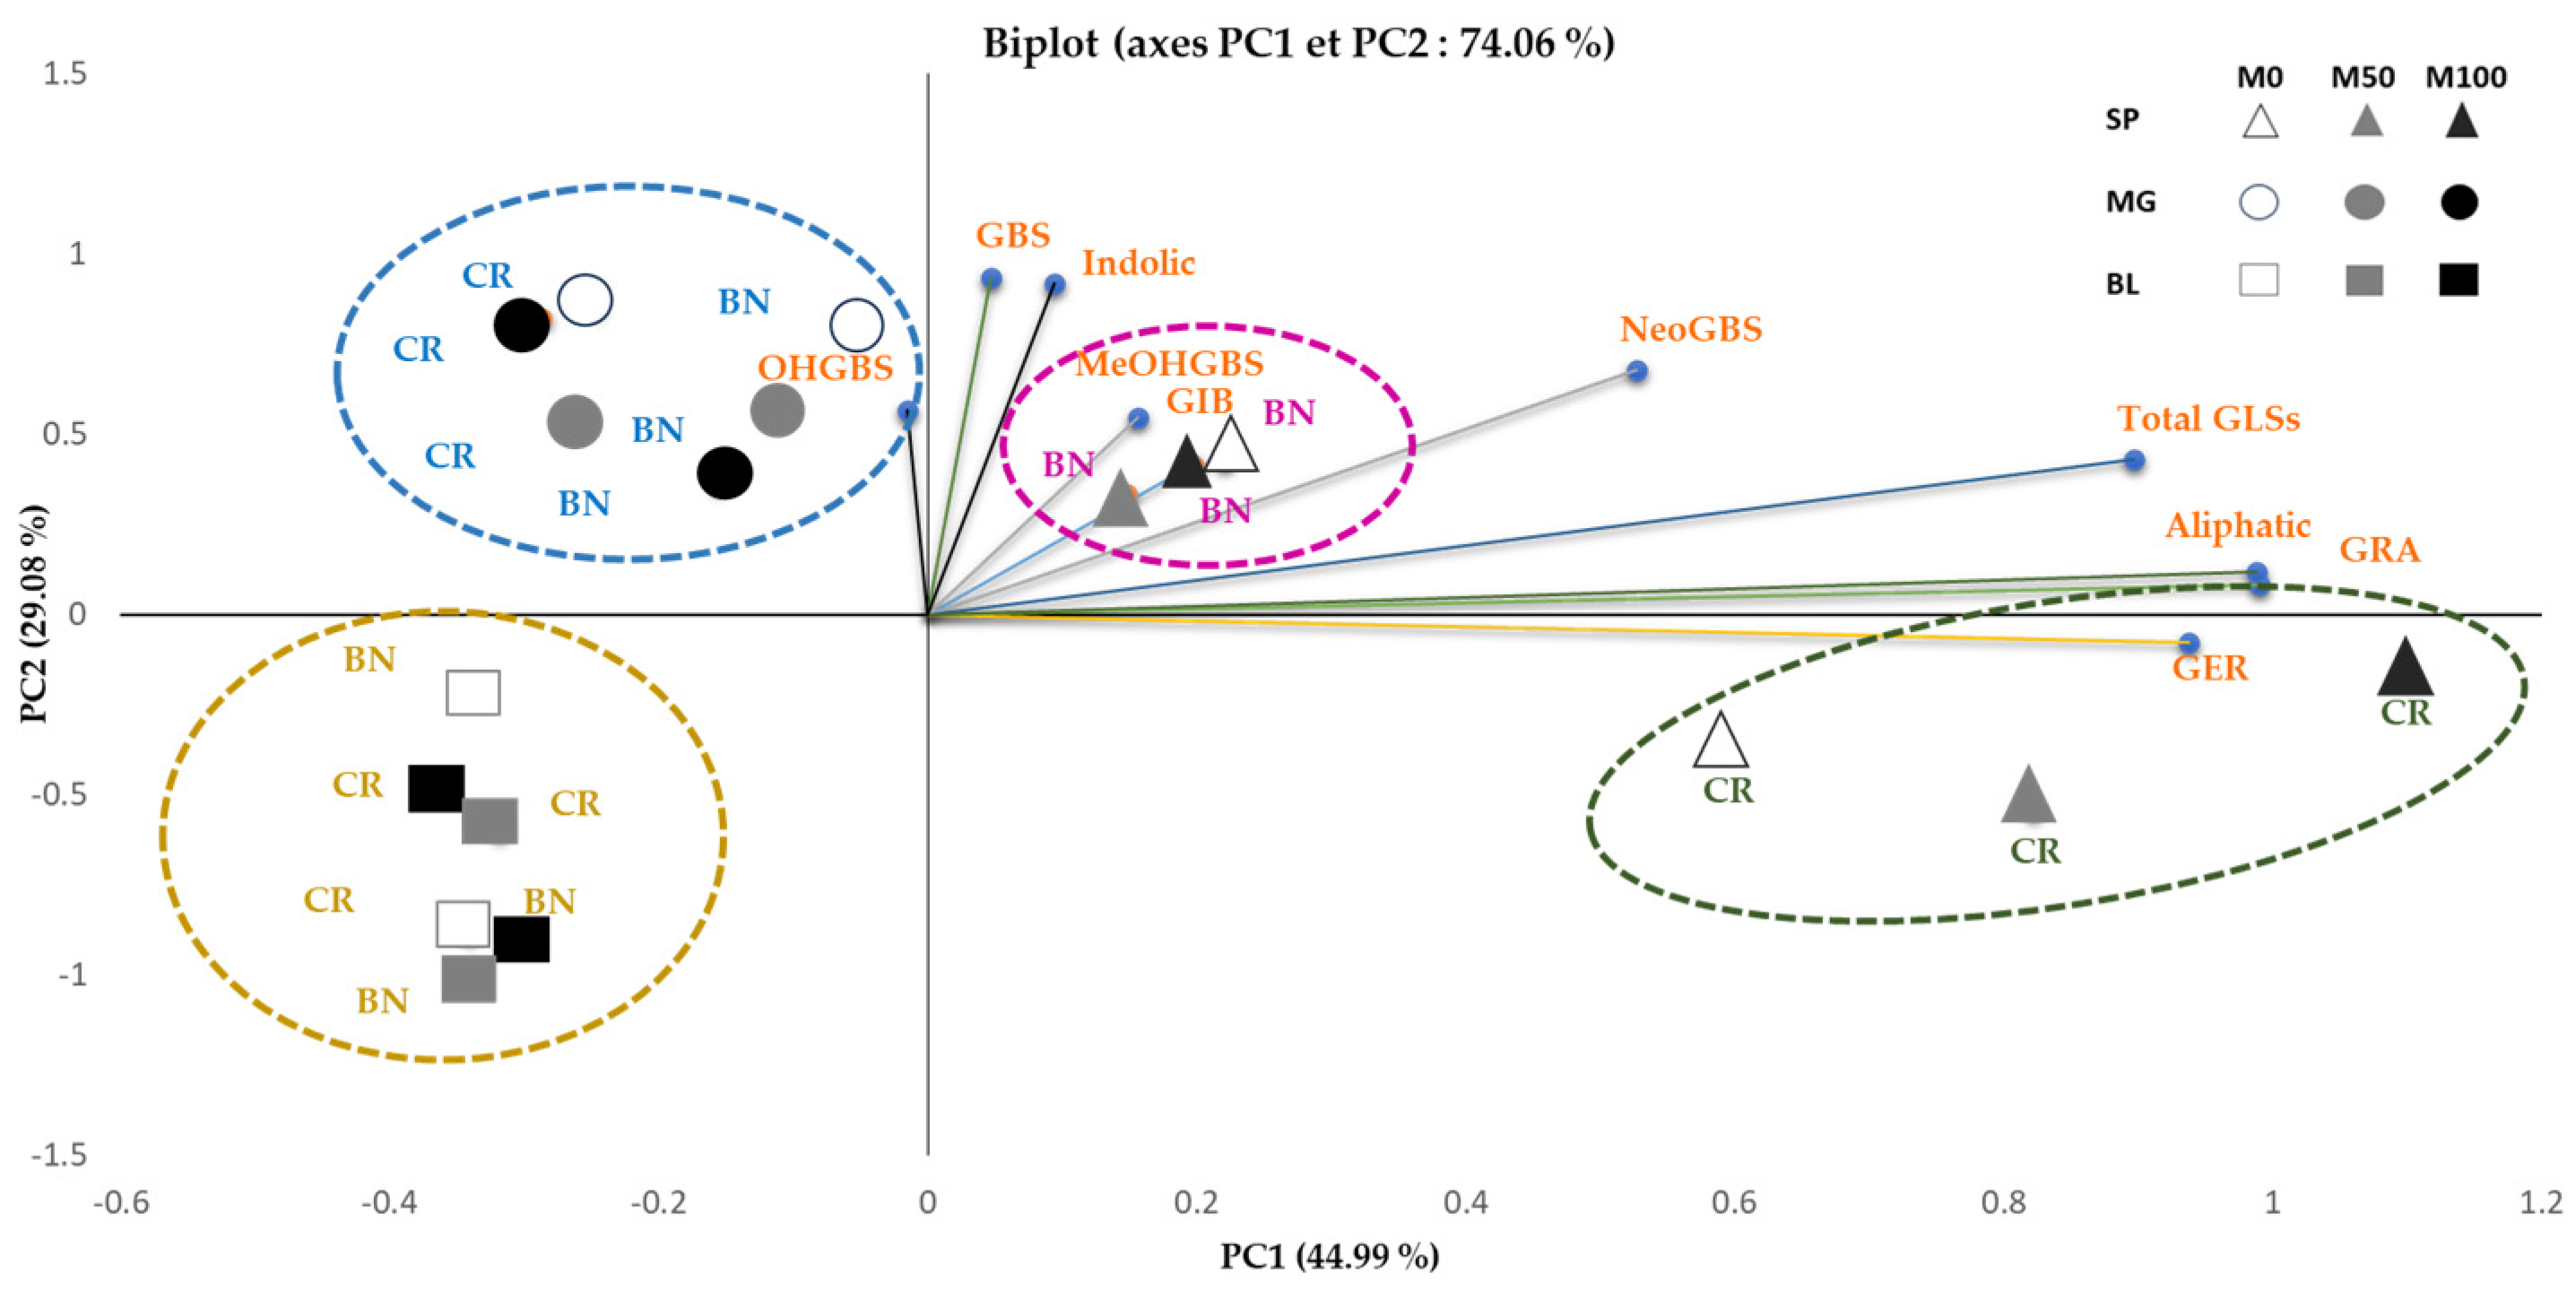
Principal Component Analysis (PCA) was performed on the GLS data to highlight the variations in the GLS profiles, considering both the two genotypes and their relationship to the plant growth stage and melatonin treatment (Figure 6). PC1 explained 44.99% of the total variation, showing a positive association with the aliphatic and indolic glucosinolates (excluding 4-hydroxyglucobrassicin, which was linked to PC2), while PC2 accounted for 29.08% of the total variation. The PCA revealed distinct differences in the GLS profiles based on the genotype. The PCA revealed a discriminant effect, leading to the identification of four distinct groups. In the first group, circled in green, the genotype CR during the sprouts stage exhibited a notable correlation with the glucoerucin, showcasing a sensitivity to different concentrations of melatonin (M0, M50, M100). Contrarily, the second group (circled on blue) showcased the same genotype CR during the microgreen stage, albeit positioned at the other extreme of the plot and correlated with the indolic glucosinolate 4-hydroxiglucobrassicin. Notably, this group also included the genotype BN at the microgreen stage. The third group (circled on purple) emerged with the genotype BN during the sprout growth stage, demonstrating a correlation with the 4-hydroxyglucobrassicin and glucoiberin. In contrast, the fourth group (encircled on yellow) comprised both genotypes in the baby leaves growth stage, showcasing distinctions under the various treatment concentrations, with a negative correlation with the aliphatic glucosinolates. This specific categorization highlights the relationships between the genotypes, growth stages, and melatonin concentrations.

4. Discussion

Novel foods, including sprouts, microgreens, and baby leaves, are gaining popularity due to their cultivation techniques and their antioxidant properties [40]. Our study aligns with this trend, supporting the cultivation of these innovative crops. We emphasize the role of exogenous melatonin treatment and specific plant growth stages in optimizing the yield and influencing the glucosinolate (GLSs) content and profile in Brassica oleracea L. The investigation revealed significant interactions and variations influenced by the melatonin treatment and genotype, particularly in the sprouts. Notably, changes in the sprout parameters, such as the weight, hypocotyl length, cotyledon length, and cotyledon width, were observed. It is crucial to clarify that these changes were dose-dependent, with the highest dose (M100) exhibiting the most substantial effects. In our experimental design, various doses, including M50 and M100, were examined. Particularly noteworthy was the revelation that the highest dose, M100, exerted the most substantial effects on the measured sprout parameters. This implies a dose–response relationship, indicating that as the melatonin dosage increased, the intensity or extent of the observed effects on the sprout growth became more pronounced. Regarding the sprouts, the application of melatonin exhibited a significant interaction (M × GE), with a notable increase in weight observed, particularly at M100, indicating a dose-dependent effect. In both varieties, BN and CR, the mean values showed a consistent pattern of increase with higher melatonin concentrations. The highest melatonin concentration (M100) induced a considerable increase, signifying a dose-dependent influence on the hypocotyl length. While cotyledon length did not show significant differences, the cotyledon width displayed a significant interaction (M × GE). The variations, especially at M100, indicate the influence of the melatonin concentration on the cotyledon width, pointing to a nuanced response in these parameters under different melatonin treatments.
Melatonin also acts as a growth promoter, inducing the active growth of hypocotyls in etiolated seedlings of lupin at micromolar concentrations while displaying an inhibitory effect at 100 μM [41]. Generally, growth inhibition by melatonin only occurs at a high concentration (>100 μM). High-concentration melatonin repressed the root growth and reduced the biomass, as well as retarded the plant leaf growth, by reducing both the cell size and cell proliferation [42,43]. Although melatonin plays an important role in the regulation of plant growth and development, the underlying mechanism is still unclear and remains to be elucidated. In summary, the data strongly support the assertion that melatonin treatment, especially at higher concentrations, induces a notable increase in various morphometric parameters crucial for plant development. These findings hold considerable agronomic and commercial importance, emphasizing the potential of melatonin as a biostimulant for optimizing plant growth. The nuanced responses observed in different morphometric traits underline the need for precise dosage considerations in practical applications, offering valuable insights for the cultivation of broccoli varieties. Conversely, microgreens exhibited pronounced impacts on the weight (W) and hypocotyl length (HL) in response to melatonin treatment. The substantial variations observed in the plant weight across the different melatonin concentrations and genotypes underscore the intricate relationship between the melatonin treatment and overall plant mass. The significant differences in weight, especially at M100, suggest a dose-dependent response, emphasizing the potential of melatonin to enhance the biomass of both the BN and CR broccoli varieties. The observed substantial variations in weight, particularly at M100, indicate a dose-dependent response, underscoring the promising capacity of melatonin to augment the biomass of both the BN and CR broccoli varieties. This finding aligns seamlessly with the research conducted by Sardar et al. [44], which demonstrated that exogenous application of melatonin under salinity stress conditions contributes to an enhanced plant growth response. Notably, under salt stress conditions, the application of 50 µM melatonin emerged as the optimal dose for improving the overall growth of broccoli plants. Our study deepens this understanding, providing further evidence of melatonin’s potential to positively impact biomass, especially in the context of different broccoli varieties. This reinforces the practical application of melatonin in agricultural settings, showcasing its ability to mitigate environmental stressors and promote plant growth. The increase in the hypocotyl length, particularly at M100, indicates that melatonin plays a crucial role in promoting the elongation of the stem below the cotyledons. This response is pivotal for enhancing the overall plant height, with implications for improved structural integrity and potentially increased light interception. The significant variations observed highlight the sensitivity of the hypocotyl length to the melatonin concentration, offering valuable insights into the regulatory role of melatonin in this morphometric trait. While the cotyledon length did not exhibit significant differences, the cotyledon width showed consistent responses across the melatonin concentrations and genotypes. The lack of a significant variation in the cotyledon traits suggests a more stable response, indicating that melatonin may have a selective impact on specific morphometric parameters. The considerable increases in both the leaf length and width, particularly at M100, highlight melatonin’s influence on leaf morphogenesis. These findings imply that melatonin, especially at higher concentrations, positively impacts the elongation and expansion of leaves, as reported by Xioang et al. [45]. The significant differences observed underscore the importance of considering the melatonin dosage when optimizing leaf development, which has implications for the photosynthetic efficiency and overall plant performance. Concerning baby leaves, the observed differences in the plant weight across the melatonin concentrations and genotypes are noteworthy. Although not statistically significant, there is a clear trend indicating that higher melatonin concentrations, especially at M100, may contribute to increased plant mass. The Newman–Keuls method reveals a significant difference in weight concerning the genotype (GE), emphasizing the importance of genetic factors in influencing the overall plant weight. The shoot length data reveal an intriguing pattern, with the highest shoot lengths observed in the M50 for both varieties. While not statistically significant, the Newman–Keuls method indicates a significant interaction between the melatonin concentration and genotype (M × GE). This suggests that the response to melatonin treatment may vary between the two broccoli varieties, influencing the shoot length differentially. The number of leaves does not exhibit significant differences across the melatonin concentrations or genotypes. This implies that melatonin treatment may not strongly influence leaf proliferation under the conditions studied. The leaf length variations are not statistically significant, indicating a consistent response across the melatonin concentrations and genotypes. The lack of significant differences suggests that melatonin may not be a prominent factor in influencing the elongation of individual leaves. The data on the leaf width, however, demonstrate significant differences, particularly regarding the melatonin concentration (M) and its interaction with genotype (GE). Notably, the Newman–Keuls method highlights the significance of the melatonin concentration and its interaction with the genotype, underscoring the nuanced influence of melatonin on the leaf width in different broccoli varieties. These results provide valuable insights into the complex interactions between the melatonin concentration, genotype, and various growth parameters in broccoli. While certain parameters, like the shoot length and leaf width, exhibit notable responses, others, such as the weight and leaf length, show less pronounced variations. These findings contribute to a deeper understanding of how melatonin treatment can modulate specific aspects of plant growth in distinct broccoli varieties, providing a foundation for further exploration and potential applications in agricultural practices. In a recent study by Erdal [46], it was unveiled that melatonin (MT) assumes a pivotal role in plant physiology. The research highlighted that MT serves as a potent stimulator of vegetative growth in plants, notably by fostering the development of lateral roots and increasing both the shoot length and leaf area.
Furthermore, our investigation unveiled distinct changes in the glucosinolate content across the growth stages, including a notable variation of glucosinolates in the Sicilian sprouting black broccoli in response to the melatonin treatment. While our findings strongly suggest the efficacy of melatonin in promoting sprout growth, we recognize the importance of further exploration to determine its broader applications in the cultivation of various broccoli varieties. The analysis of the glucosinolate (GLS) profile provided further insights into the influence of the melatonin, genotype, and growth stage on the bioactive compounds in broccoli. Previous studies [47,48,49] identified a total of 26 glucosinolate compounds (GLSs) in both broccoli sprouts and microgreens. Key GLSs in this array include glucoraphanin, glucoiberin, glucoerucin, glucobrassicin, and neoglucobrassicin, with glucoraphanin being the most abundant, constituting over 50% of the total GLS content. The quantification of the GLSs ranged from 605 to 1172 mg per 100 g of fresh weight (FW). In our study, the total GLS content varied significantly, highlighting the influence of the growth stage and genotype. The sprouts exhibited higher GLS levels compared to the microgreens and baby leaves, suggesting a dynamic change in GLS production influenced by the growth stage. During the sprouting stage, characterized by rapid cell division and metabolism, Brassica plants initiated heightened synthesis of GLSs. This strategic response focused on accumulating essential nutrients and bioactive compounds, which serve as a natural defense mechanism against external threats. The substantial GLS levels in sprouts play a crucial role in fortifying the young plant. As the plant progresses through subsequent growth stages, like microgreens and baby leaves, the metabolic activities may shift toward other aspects of growth and development. Our study is consistent with prior research that has documented higher levels of antioxidant compounds, particularly glucosinolates, during the sprouting phase. Subsequently, a decline in these compounds is observed as the plants progress and mature [50,51,52]. Melatonin treatments induced distinct expression patterns in genes associated with cell wall formation, carbohydrate metabolic processes, oxidation/reduction processes, and catalytic activity [53]. Additionally, melatonin may interact with key enzymes in metabolic pathways, influencing the flow of intermediates toward secondary metabolite production. This interaction can lead to alterations in the types and quantities of secondary metabolites, affecting the overall profile of compounds like glucosinolates [54].
The observed trends in the glucosinolate levels with varying melatonin doses underscore the intricate relationship between external factors, such as the treatment dosage, and the inherent genetic characteristics of the plant. As the melatonin doses increase, a consistent decrease in the glucosinolate levels is evident, reflecting not only the direct impact of melatonin but also the underlying influence of the plant’s genotype. This suggests that the interplay between external stimuli, like melatonin treatment, and the inherent genetic makeup of the plant contributes to the observed variations in glucosinolate levels. Melatonin has been observed to enhance the expression of various genes associated with glucosinolate biosynthesis. The correlation analysis during the sprouts stage uncovered relationships among the glucosinolates, providing insight into their regulatory dynamics. The strong positive correlations observed between the glucoraphanin (GRA) and aliphatic glucoerucin (GER) highlight their coordinated response, while GRA shows a contrasting negative correlation with glucoiberin (GIB), suggesting potential regulatory divergence in the aliphatic pathway. Similar correlation patterns were observed in the microgreens, underscoring the intricate regulatory network governing glucosinolates during different growth stages.
The absence of precise correlations for certain glucosinolates (GLSs) in the microgreens underscores the unique, stage-specific reactions to melatonin, highlighting the intricate nature of regulatory mechanisms. In contrast, the correlation analysis for the baby leaves reveals evolving relationships among the GLSs, reflecting changes in the growth stages. The positive correlation between the glucoraphanin (GRA) and glucoerucin (GER) with the total aliphatic GLSs suggests a coordinated response within the aliphatic pathway. Consistent with a prior study by Bhandari et al. [55], significant positive correlations between the progoitrin (PRO), glucoraphanin (GRA), glucoerucin (GER), and total glucosinolates were found, given their shared aliphatic characteristics with 4-carbon side chains, leading to similar biosynthetic pathways [56]. The negative correlation between the glucoerucin and glucoiberin (GIB), along with a positive correlation with the 4-methoxyglucobrassicin (OHGBS), implies specific regulatory changes associated with the growth stage. Additionally, the negative correlation of the 4-methoxyglucobrassicin (MeOHGBS) with neoglucobrassicin (NeoGBS) and total GLSs further illustrates the nuanced interplay of GLSs during the baby leaves stage. The correlations in the baby leaves underscore the dynamic regulation of GLSs in response to melatonin doses, emphasizing the necessity for a comprehensive understanding of the glucosinolate pathway’s involvement in these alterations. These correlation dynamics align with the known pathways of glucosinolate biosynthesis [57]. The positive correlations within the aliphatic or indolic groups suggest coordinated regulation, possibly influenced by shared enzymatic processes. Conversely, the negative correlations between the aliphatic and indolic GLSs highlight potential pathway competition or regulatory crosstalk. Changes in the levels of a single metabolite derived from one branching pathway can be affected by enzymatic changes in a competing branch [58].
As the plant progresses through the stages of sprouts, microgreens, and baby leaves, the correlation patterns reflect the qualified adjustments within the glucosinolate pathway, emphasizing the stage-specific responses to melatonin treatment. These insights contribute to a more comprehensive understanding of the regulatory mechanisms governing glucosinolate profiles in Brassica oleracea L. across the different growth stages. Furthermore, defining the optimal dosage for effective application is essential, involving a comprehensive examination of the biostimulant’s composition to establish accurate dosage recommendations for optimal efficacy [59].

5. Conclusions

In conclusion, our study successfully demonstrated the positive impact of melatonin treatment on the growth parameters of Brassica oleracea L., particularly in sprouts. The dose-dependent relationship observed, especially at M100, led to significant increases in the weight, hypocotyl length, and cotyledon width. However, it is crucial to note that these effects varied across the different growth stages and genotypes. While our findings support the enhancement of growth through melatonin treatment, the dose-dependent reduction in the glucosinolate levels raises considerations for its potential impact on the antioxidant properties of these crops. This suggests a nuanced relationship between melatonin, growth, and the glucosinolate content. In terms of recommendations, our study underscores the need for precise dosage considerations in practical applications. While melatonin may be beneficial for promoting growth, its potential trade-off with glucosinolate levels should be carefully evaluated. Future research should focus on optimizing the melatonin application for specific growth stages and cultivars, taking into account both growth promotion and the desired antioxidant properties. These insights provide valuable agronomic indications for the strategic use of melatonin in Brassica cultivation, emphasizing the importance of balancing growth optimization and nutritional attributes.

Supplementary Materials

The following supporting information can be downloaded at https://www.mdpi.com/article/10.3390/agronomy14020286/s1, Figure S1: High performance liquid chromatography (HPLC) chromatograms of desulfo-GLSs standards. Figure S2: High performance liquid chromatography (HPLC) chromatogram of brassica sample extract.

Author Contributions

Conceptualization, F.B., V.M.R. and P.V.; methodology, F.B., V.M.R. and P.V.; software, D.A. and H.B.A.; validation, F.B., V.M.R. and P.V.; formal analysis, F.B., D.A., V.M.R. and P.V.; investigation, D.A., R.C., G.G. and H.B.A.; resources, F.B.; data curation, F.B., V.M.R., P.V., H.B.A. and D.A.; writing—original draft preparation, D.A. and H.B.A.; writing—review and editing, F.B., V.M.R. and P.V.; visualization, F.B., V.M.R. and P.V.; supervision, F.B., V.M.R. and P.V.; project administration, F.B.; funding acquisition, F.B. All authors have read and agreed to the published version of the manuscript.

Funding

This research was supported by the project BRESOV (Breeding for Resilient. Efficient and Sustainable Organic Vegetable production) funded by EU H2020 Program SFS-07-2017. Grant Agreement n. 774244.

Data Availability Statement

Data are contained within the article and supplementary materials.

Conflicts of Interest

The authors declare no conflicts of interest.

References

  1. Raza, A.; Hafeez, M.B.; Zahra, N.; Shaukat, K.; Umbreen, S.; Tabassum, J.; Charagh, S.; Ahmad Khan, R.S.; Hasanuzzaman, M. The plant family Brassicaceae: Introduction, Biology, and Importance. In The Plant Family Brassicaceae; Hasanuzzaman, M., Ed.; Springer: Singapore, 2020; pp. 1–43. [Google Scholar] [CrossRef]
  2. Rakow, G. Species Origin and Economic Importance of Brassica. In Brassica; Pua, E.C., Douglas, C.J., Eds.; Biotechnology in Agriculture and Forestry; Springer: Berlin/Heidelberg, Germany, 2004; Volume 54. [Google Scholar] [CrossRef]
  3. Gómez-Campo, C. (Ed.) Biology of Brassica coenospecies; Elsevier: Amsterdam, The Netherlands, 1999; ISBN 9780444502780. [Google Scholar]
  4. Al-Shehbaz, I.A. A generic and tribal synopsis of the Brassicaceae (Cruciferae). Taxon 2012, 61, 931–954. [Google Scholar] [CrossRef]
  5. Maggioni, L.; von Bothmer, R.; Poulsen, G.; Branca, F.; Bagger Jørgensen, R. Genetic diversity and population structure of leafy kale and Brassica rupestris Raf. in south Italy. Hereditas 2014, 151, 145–158. [Google Scholar] [CrossRef]
  6. Arena, D.; Treccarichi, S.; Di Bella, M.C.; Achkar, N.; Ben Ammar, H.; Picchi, V.; Lo Scalzo, R.; Amari, M.; Branca, F. Evaluation of Brassica oleracea L. crops and wild relatives for bio-morphometric and biochemical characteristics. Acta Hortic. 2022, 1355, 71–80. [Google Scholar] [CrossRef]
  7. Ben Ammar, H.; Picchi, V.; Arena, D.; Treccarichi, S.; Bianchi, G.; Lo Scalzo, R.; Marghali, S.; Branca, F. Variation of Bio-Morphometric Traits and Antioxidant Compounds of Brassica oleracea L. Accessions in Relation to Drought Stress. Agronomy 2022, 12, 2016. [Google Scholar] [CrossRef]
  8. Bianchi, G.; Picchi, V.; Tava, A.; Doria, F.; Walley, P.G.; Dever, L.; Di Bella, M.C.; Arena, D.; Ben Ammar, H.; Lo Scalzo, R.; et al. Insights into the phytochemical composition of selected genotypes of organic kale (Brassica oleracea L. var. acephala). J. Food Compost Anal. 2024, 125, 105721. [Google Scholar] [CrossRef]
  9. Branca, F.; Arena, D.; Argento, S.; Frustaci, F.; Ciccarello, L.; Melilli, M.G. Recovery of healthy compounds in waste bracts of globe artichoke heads. Acta Hortic. 2021, 1354, 361–366. [Google Scholar] [CrossRef]
  10. Eberhardt, M.V.; Kobira, K.; Keck, A.S.; Juvik, J.A.; Jeffery, E.H. Correlation analyses of phytochemical composition, chemical, and cellular measures of antioxidant activity of broccoli (Brassica oleracea L. Var. italica). J. Agric. Food Chem. 2005, 53, 7421–7431. [Google Scholar] [CrossRef]
  11. Clarke, D.B. Glucosinolates, structures and analysis in food. Anal. Methods 2010, 2, 310–325. [Google Scholar] [CrossRef]
  12. Wu, X.; Huang, H.; Childs, H.; Wu, Y.; Yu, L.; Pehrsson, P.R. Glucosinolates in Brassica vegetables: Characterization and factors that influence distribution, content, and intake. Annu. Rev. Food Sci. Technol. 2021, 12, 485–511. [Google Scholar] [CrossRef]
  13. Fenwick, G.R.; Heaney, R.K.; Mullin, W.J.; VanEtten, C.H. Glucosinolates and their breakdown products in food and food plants. Crit. Rev. Food Sci. Nutr. 1983, 18, 123–201. [Google Scholar] [CrossRef]
  14. Del Carmen Martínez-Ballesta, M.; Moreno, D.A.; Carvajal, M. The Physiological Importance of Glucosinolates on Plant Response to Abiotic Stress in Brassica. Int. J. Mol. Sci. 2013, 14, 11607–11625. [Google Scholar] [CrossRef] [PubMed]
  15. Fahey, J.W.; Zalcmann, A.T.; Talalay, P. The chemical diversity and distribution of glucosinolates and isothiocyanates among plants. Phytochemistry 2001, 56, 5–51. [Google Scholar] [CrossRef] [PubMed]
  16. Jongen, W. Glucosinolates in Brassica: Occurrence and significance as cancer-modulating agents. Proc. Nutr. Soc. 1996, 55, 433–446. [Google Scholar] [CrossRef] [PubMed]
  17. Shapiro, T.A.; Fahey, J.W.; Wade, K.L.; Stephenson, K.K.; Talalay, P. Chemoprotective glucosinolates and isothiocyanates of broccoli sprouts: Metabolism and excretion in humans. Cancer Epidemiol. Biomarkers Prev. 2001, 10, 501–508. [Google Scholar] [PubMed]
  18. Soundararajan, P.; Kim, J.S. Anti-Carcinogenic Glucosinolates in Cruciferous Vegetables and Their Antagonistic Effects on Prevention of Cancers. Molecules 2018, 23, 2983. [Google Scholar] [CrossRef] [PubMed]
  19. Mir, A.R.; Siddiqui, H.; Alam, P.; Hayat, S. Melatonin modulates photosynthesis, redox status, and elemental composition to promote growth of Brassica juncea—A dose-dependent effect. Protoplasma 2020, 257, 1685–1700. [Google Scholar] [CrossRef] [PubMed]
  20. Sharif, R.; Xie, C.; Zhang, H.; Arnao, M.B.; Ali, M.; Ali, Q.; Muhammad, I.; Shalmani, A.; Nawaz, M.A.; Chen, P.; et al. Melatonin and Its Effects on Plant Systems. Molecules 2018, 23, 2352. [Google Scholar] [CrossRef] [PubMed]
  21. Debnath, B.; Islam, W.; Li, M.; Sun, Y.; Lu, X.; Mitra, S.; Hussain, M.; Liu, S.; Qiu, D. Melatonin Mediates Enhancement of Stress Tolerance in Plants. Int. J. Mol. Sci. 2019, 20, 1040. [Google Scholar] [CrossRef]
  22. Back, K.; Tan, D.X.; Reiter, R.J. Melatonin biosynthesis in plants: Multiple pathways catalyze tryptophan to melatonin in the cytoplasm or chloroplasts. J. Pineal Res. 2016, 61, 426–437. [Google Scholar] [CrossRef]
  23. Arnao, M.B.; Hernández-Ruiz, J. The Physiological Function of Melatonin in Plants. Plant Signal. Behav. 2006, 1, 89–95. [Google Scholar] [CrossRef]
  24. Nawaz, M.A.; Huang, Y.; Bie, Z.; Ahmed, W.; Reiter, R.J.; Niu, M.; Hameed, S. Melatonin: Current status and future perspectives in plant science. Front. Plant Sci. 2016, 6, 1230. [Google Scholar] [CrossRef] [PubMed]
  25. Hardeland, R. Melatonin in plants–diversity of levels and multiplicity of functions. Front. Plant Sci. 2016, 7, 198. [Google Scholar] [CrossRef] [PubMed]
  26. Dai, L.; Li, J.; Harmens, H.; Zheng, X.; Zhang, C. Melatonin enhances drought resistance by regulating leaf stomatal behaviour, root growth and catalase activity in two contrasting rapeseed (Brassica napus L.) genotypes. Plant Physiol. Biochem. 2020, 149, 86–95. [Google Scholar] [CrossRef] [PubMed]
  27. Zhao, C.; Nawaz, G.; Cao, Q.; Xu, T. Melatonin is a potential target for improving horticultural crop resistance to abiotic stress. Sci. Hortic. 2022, 291, 110560. [Google Scholar] [CrossRef]
  28. Fan, J.; Xie, Y.; Zhang, Z.; Chen, L. Melatonin: A multifunctional factor in plants. Int. J. Mol. Sci. 2018, 19, 1528. [Google Scholar] [CrossRef] [PubMed]
  29. Sun, C.; Liu, L.; Wang, L.; Li, B.; Jin, C.; Lin, X. Melatonin: A master regulator of plant development and stress responses. J. Integr. Plant Biol. 2021, 63, 126–145. [Google Scholar] [CrossRef]
  30. Tan, D.X.; Reiter, R.J. An evolutionary view of melatonin synthesis and metabolism related to its biological functions in plants. J. Exp. Bot. 2020, 71, 4677–4689. [Google Scholar] [CrossRef]
  31. Wei, L.; Liu, C.; Zheng, H.; Zheng, L. Melatonin treatment affects the glucoraphanin-sulforaphane system in postharvest fresh-cut broccoli (Brassica oleracea L.). Food Chem. 2020, 307, 125562. [Google Scholar] [CrossRef]
  32. Teng, Z.; Zheng, W.; Yu, Y.; Hong, S.B.; Zhu, Z.; Zang, Y. Melatonin regulated glucosinolate profile via modulation of genes related with sulfur and nitrogen metabolism in Brassica rapa ssp. pekinensis. Ind. Crops Prod. 2022, 177, 114538. [Google Scholar] [CrossRef]
  33. Karumannil, S.; Khan, T.A.; Kappachery, S.; Gururani, M.A. Impact of Exogenous Melatonin Application on Photosynthetic Machinery under Abiotic Stress Conditions. Plants 2023, 12, 2948. [Google Scholar] [CrossRef]
  34. Di Gioia, F.; Renna, M.; Santamaria, P. Sprouts, Microgreens and “Baby Leaf” Vegetables. In Minimally Processed Refrigerated Fruits and Vegetables; Yildiz, F., Wiley, R., Eds.; Food Engineering Series; Springer: Boston, MA, USA, 2017. [Google Scholar] [CrossRef]
  35. Artés-Hernández, F.; Castillejo, N.; Martínez-Zamora, L. UV and Visible Spectrum LED Lighting as Abiotic Elicitors of Bioactive Compounds in Sprouts, Microgreens, and Baby Leaves—A Comprehensive Review including Their Mode of Action. Foods 2022, 11, 265. [Google Scholar] [CrossRef]
  36. Ragusa, L.; Picchi, V.; Tribulato, A.; Cavallaro, C.; Lo Scalzo, R.; Branca, F. The effect of the germination temperature on the phytochemical content of broccoli and rocket sprouts. Int. J. Food Sci. Nutr. 2017, 68, 411–420. [Google Scholar] [CrossRef]
  37. Cano-Lamadrid, M.; Martínez-Zamora, L.; Castillejo, N.; Cattaneo, C.; Pagliarini, E.; Artés-Hernández, F. How does the phytochemical composition of sprouts and microgreens from Brassica vegetables affect the sensory profile and consumer acceptability? Postharvest Biol. Technol. 2023, 203, 112411. [Google Scholar] [CrossRef]
  38. Di Gioia, F.; De Bellis, P.; Mininni, C.; Santamaria, P.; Serio, F. Physicochemical, agronomical and microbiological evaluation of alternative growing media for the production of rapini (Brassica rapa L.) microgreens. J. Sci. Food Agric. 2017, 97, 1212–1219. [Google Scholar] [CrossRef] [PubMed]
  39. Kliebenstein, D.J.; Kroymann, J.; Brown, P.; Figuth, A.; Pedersen, D.; Gershenzon, J.; Mitchell-Olds, T. Genetic Control of Natural Variation in Arabidopsis Glucosinolate Accumulation. Plant Physiol. 2001, 126, 811–825. [Google Scholar] [CrossRef] [PubMed]
  40. Ebert, A.W. Sprouts and microgreens—Novel food sources for healthy diets. Plants 2022, 11, 571. [Google Scholar] [CrossRef]
  41. Hernandez-Ruiz, J.; Cano, A.; Arnao, M.B. Melatonin: A growth-stimulating compound present in lupin tissues. Planta 2004, 220, 140–144. [Google Scholar] [CrossRef]
  42. Wang, Q.; An, B.; Shi, H.; Luo, H.; He, C. High concentration of melatonin regulates leaf development by suppressing cell proliferation and endoreduplication in Arabidopsis. Int. J. Mol. Sci. 2017, 18, 991. [Google Scholar] [CrossRef]
  43. Lin, L.; Li, J.; Chen, F.; Liao, M.; Tang, Y.; Liang, D.; Xia, H.; Lai, Y.; Wang, X.; Chen, C.; et al. Effects of melatonin on the growth and cadmium characteristics of Cyphomandra betacea seedlings. Environ. Monit. Assess 2018, 190, 119. [Google Scholar] [CrossRef]
  44. Sardar, H.; Ramzan, M.A.; Naz, S.; Ali, S.; Ejaz, S.; Ahmad, R.; Altaf, M.A. Exogenous Application of Melatonin Improves the Growth and Productivity of Two Broccoli (Brassica oleracea L.) Cultivars Under Salt Stress. J. Plant Growth Regul. 2023, 42, 5152–5166. [Google Scholar] [CrossRef]
  45. Xiong, F.; Zhuo, F.; Reiter, R.J.; Wang, L.; Wei, Z.; Deng, K.; Song, Y.; Qanmber, G.; Feng, L.; Yang, Z.; et al. Hypocotyl elongation inhibition of melatonin is involved in repressing brassinosteroid biosynthesis in Arabidopsis. Front. Plant Sci. 2019, 10, 1082. [Google Scholar] [CrossRef]
  46. Erdal, S. Melatonin promotes plant growth by maintaining integration and coordination between carbon and nitrogen metabolisms. Plant Cell Rep. 2019, 38, 1001–1012. [Google Scholar] [CrossRef]
  47. Di Bella, M.C.; Treccarichi, S.; Arena, D.; Nicotra, R.; Mazzaglia, A.; Melilli, M.G.; Bartoszek, A.; Kusznierewicz, B.; Parchem, K.; Branca, F. Evaluation of Sicilian landraces of broccoli (B. oleracea var. italica Plenck) for quality traits. Acta Hortic. 2022, 1354, 343–350. [Google Scholar] [CrossRef]
  48. Jambor, T.; Knizatova, N.; Valkova, V.; Tirpak, F.; Greifova, H.; Kovacik, A.; Lukac, N. Microgreens as a functional component of the human diet: A review. J. Microbiol. Biotechnol. Food Sci. 2022, 12, e5870. [Google Scholar] [CrossRef]
  49. Perez-Balibrea, S.; Moreno, D.A.; Garcia-Viguera, C. Glucosinolates in broccoli sprouts (Brassica oleracea var. italica) as conditioned by sulphate supply during germination. J. Food Sci. 2010, 75, 673–677. [Google Scholar] [CrossRef] [PubMed]
  50. Guo, L.; Yang, R.; Guo, Q.; Gu, Z. Glucoraphanin, sulforaphane and myrosinase activity in germinating broccoli sprouts as affected by growth temperature and plant organs. J. Funct. Foods 2014, 9, 70–77. [Google Scholar] [CrossRef]
  51. Le, T.N.; Chiu, C.H.; Hsieh, P.C. Bioactive compounds and bioactivities of Brassica oleracea L. var. italica sprouts and microgreens: An updated overview from a nutraceutical perspective. Plants 2020, 9, 946. [Google Scholar] [CrossRef] [PubMed]
  52. Omidbakhshfard, M.A.; Sokolowska, E.M.; Di Vittori, V.; de Souza, L.P.; Kuhalskaya, A.; Brotman, Y.; Alseekh, S.; Fernie, A.R.; Skirycz, A. Multi-omics analysis of early leaf development in Arabidopsis thaliana. Patterns 2021, 2, 100235. [Google Scholar] [CrossRef] [PubMed]
  53. Favela-González, K.M.; Hernández-Almanza, A.Y.; De la Fuente-Salcido, N.M. The value of bioactive compounds of cruciferous vegetables (Brassica) as antimicrobials and antioxidants: A review. J. Food Biochem. 2020, 44, e13414. [Google Scholar] [CrossRef]
  54. Baenas, N.; Moreno, D.A.; García-Viguera, C. Selecting sprouts of Brassicaceae for optimum phytochemical composition. J. Agric. Food Chem. 2012, 60, 11409–11420. [Google Scholar] [CrossRef]
  55. Bhandari, S.R.; Rhee, J.; Choi, C.S.; Jo, J.S.; Shin, Y.K.; Lee, J.G. Profiling of Individual Desulfo-Glucosinolate Content in Cabbage Head (Brassica oleracea var. capitata) Germplasm. Molecules 2020, 25, 1860. [Google Scholar] [CrossRef] [PubMed]
  56. Murch, S.J.; Erland, L.A.E. A Systematic Review of Melatonin in Plants: An Example of Evolution of Literature. Front. Plant Sci. 2021, 12, 683047. [Google Scholar] [CrossRef]
  57. Kim, M.J.; Chiu, Y.C.; Kim, N.K.; Park, H.M.; Lee, C.H.; Juvik, J.A.; Ku, K.M. Cultivar-specific changes in primary and secondary metabolites in pak choi (Brassica rapa, Chinensis group) by methyl jasmonate. Int. J. Mol. Sci. 2017, 18, 4. [Google Scholar] [CrossRef]
  58. Ishihara, A.; Matsuda, F.; Miyagawa, H.; Wakasa, K. Metabolomics for metabolically manipulated plants: Effects of tryptophan overproduction. Metabolomics 2007, 3, 319–334. [Google Scholar] [CrossRef]
  59. Almadi, L.; Paoletti, A.; Cinosi, N.; Daher, E.; Rosati, A.; Di Vaio, C.; Famiani, F. A Biostimulant Based on Protein Hydrolysates Promotes the Growth of Young Olive Trees. Agriculture 2020, 10, 618. [Google Scholar] [CrossRef]
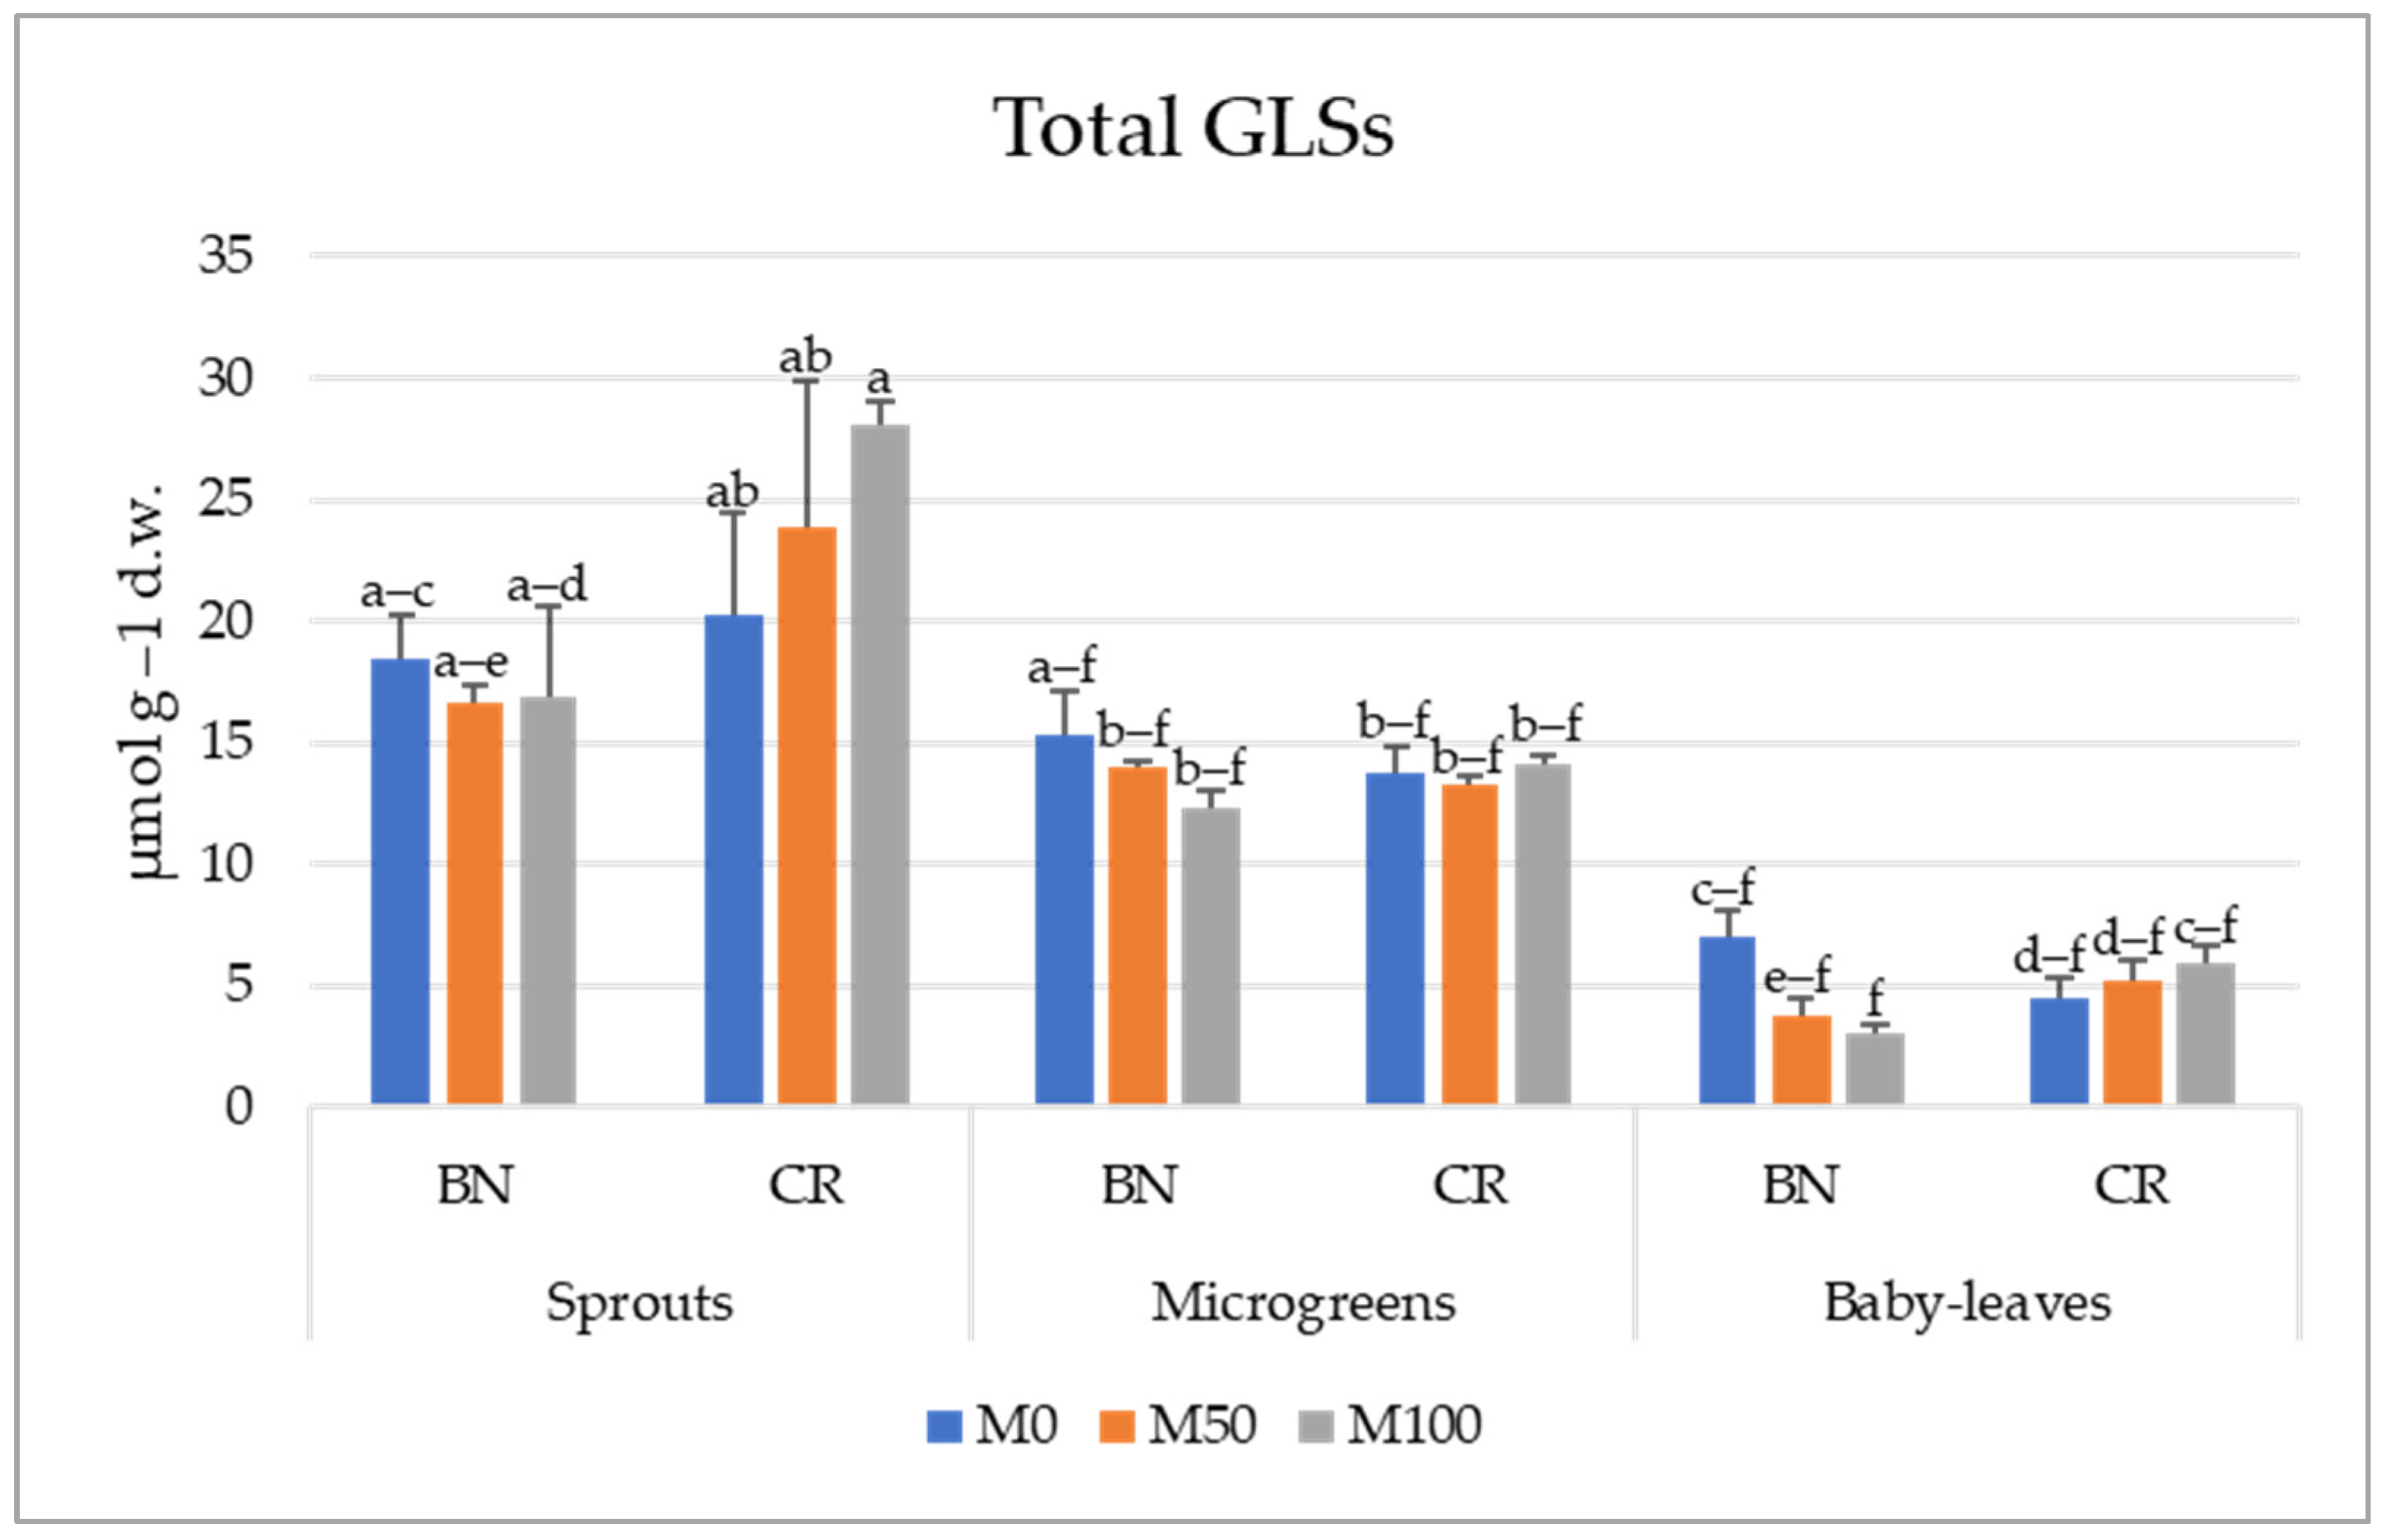
Figure 1. Variation in the total amount of GLSs (µmol g−1 d.w.) concerning the experimental factors studied. Different letters indicate significant differences according to Tukey test (p < 0.05).
Agronomy 14 00286 g001
Figure 2. Profile of the individual glucosinolates in the tested genotypes concerning the treatment and the different growth stages.
Agronomy 14 00286 g002
Figure 3. Heat maps of the Pearson’s correlation between the individual and total GLSs for the sprouts stage. GRA = glucoraphanin, GER = glucoerucin, GIB = glucoiberin, GBS = glucobrassicin, MeOHGBS = 4-methoxyglucobrassicin, NeoGBS = neoglucobrassicin, OHGBS = 4-hydroxiglucobrassicin, Aliphatic = aliphatic glucosinolates, Indolic = indolic glucosinolates, Total GLSs = total glucosinolates.
Agronomy 14 00286 g003
Figure 4. Heat maps of the Pearson’s correlation between the individual and total GLSs for the microgreens stage. GRA = glucoraphanin, GER = glucoerucin, GIB = glucoiberin, GBS = glucobrassicin, MeOHGBS = 4-methoxyglucobrassicin, NeoGBS = neoglucobrassicin, OHGBS = 4-hydroxiglucobrassicin, Aliphatic = aliphatic glucosinolates, Indolic = indolic glucosinolates, Total GLSs = total glucosinolates.
Agronomy 14 00286 g004
Figure 5. Heat maps of the Pearson’s correlation between the individual and total GLSs for the baby leaves stage. GRA = glucoraphanin, GER = glucoerucin, GIB = glucoiberin, GBS = glucobrassicin, MeOHGBS = 4-methoxyglucobrassicin, NeoGBS = neoglucobrassicin, OHGBS = 4-hydroxiglucobrassicin, Aliphatic = aliphatic glucosinolates, Indolic = indolic glucosinolates, Total GLSs = total glucosinolates.
Agronomy 14 00286 g005
Figure 6. PCA of the glucosinolate profile related to the experimental factors considered, with BN = Broccolo nero, CR = Cavolo Broccolo Ramoso Calabrese; SP = sprouts, MG = microgreens, BL = baby leaves. GBS = glucobrassicin, GER = glucoerucin, GIB = glucoiberin, GRA = glucoraphanin, MeOHGBS = 4-methoxyglucobrassicin, NeoGBS = neoglucobrassicin, OHGBS = 4-hydroxiglucobrassicin, Total GLSs = total glucosinolates, Aliphatic = aliphatic glucosinolates, Indolic = indolic glucosinolates. Sprouts are grouped in green and purple circles (CR and BN respectively); microgreens are represented by blue circles; and baby leaves are highlighted in yellow circles.
Agronomy 14 00286 g006
Table 1. Morphometric characteristics of the sprouts of Broccolo nero (BN) and Cavolo Broccolo Ramoso Calabrese (CR) studied. Data are reported as the mean ± S.E. (n = 10). W = weight of 10 individuals (g); HL = hypocotyl length of 10 individuals (mm); CL = cotyledon length of 10 individuals (mm); CW = cotyledon width of 10 individuals (mm).
M0M50M100Mean
BNCR x ¯ BNCR x ¯ BNCR x ¯ BNCR
W (g)0.52 ± 0.12 d0.81 ± 0.17 a0.66 ± 0.20 b0.71 ± 0.25 b0.64 ± 0.12 bc0.68 ± 0.05 b0.61 ± 0.02 c0.85 ± 0.06 a0.73 ± 0.17 a0.61 ± 0.09 b0.76 ± 0.11 a
HL (mm)21.08 ± 0.09 b21.35 ± 0.10 b21.22 ± 0.02 b20.18 ± 0.02 b28.23 ± 0.13 a24.21 ± 0.57 a19.58 ± 0.11 b31.68 ± 0.11 a25.63 ± 0.86 a20.28 ± 0.08 b27.09 ± 0.53 a
CL (mm)9.45 ± 0.0610.77 ± 0.0510.11 ± 0.0910.12 ± 0.0510.13 ± 0.0410.12 ± 0.0110.13 ± 0.0410.76 ± 0.0510.45 ± 0.049.90 ± 0.04 b10.55 ± 0.08 a
CW (mm)11.19 ± 0.03 ab10.21 ± 0.03 b10.70 ± 0.0712.63 ± 0.02 a10.14 ± 0.02 b11.38 ± 0.1710.92 ± 0.07 b10.33 ± 0.07 b10.63 ± 0.0811.58 ± 0.09 a10.22 ± 0.01 b
Significance of the differences via the ANOVA Newman–Keuls method
MGEM × GE
W (g)n.s.*n.s.
HL (mm)*********
CL (mm)n.s.**n.s.
CW (mm)n.s.****
The mean values associated with the two factors and their interaction were evaluated according to Tukey’s test. Means that are significantly different are indicated by different letters. n.s. not significant; * significant at p < 0.05; ** significant at p < 0.01; *** significant at p < 0.001.
Table 2. Morphometric characteristics of the microgreens of Broccolo nero (BN) and Cavolo Broccolo Ramoso Calabrese (CR) studied. Data are reported as the mean ± S.E. (n = 10). W = weight of 10 individuals (g); HL = hypocotyl length of 10 individuals (mm); CL = cotyledon length of 10 individuals (mm); CW = cotyledon width of 10 individuals (mm); LL = leaf length of 10 individuals (mm); LW = leaf width of 10 individuals (mm).
M0M50M100Mean
BNCR x ¯ BNCR x ¯ BNCR x ¯ BNCR
W (g)1.15 ± 0.16 d1.96 ± 0.22 ab1.56 ± 0.58 b1.32 ± 0.11 c2.01 ± 0.14 a1.66 ± 0.48 a1.09 ± 0.16 d1.86 ± 0.26 b1.47 ± 0.55 c1.18 ± 0.12 b1.94 ± 0.07 a
HL (mm)22.29 ± 0.23 c27.20 ± 0.16 b24.75 ± 3.4720.84 ± 0.09 c32.26 ± 0.03 a26.55 ± 0.8120.38 ± 0.08 c32.62 ± 0.06 a26.50 ± 0.8721.17 ± 1.00 b30.69 ± 0.30 a
CL (mm)9.55 ± 0.2510.86 ± 0.1610.21 ± 0.9210.92 ± 0.1710.21 ± 0.2910.57 ± 0.5010.36 ± 0.2211.80 ± 0.0211.08 ± 1.0210.28 ± 0.6910.96 ± 0.80
CW(mm)9.94 ± 0.429.56 ± 0.249.75 ± 0.2710.29 ± 0.0610.14 ± 0.3110.22 ± 0.1110.24 ± 0.0710.13 ± 0.1110.19 ± 0.0810.16 ± 0.199.94 ± 0.33
LL (mm)11.06 ± 0.0413.32 ± 0.1312.19 ± 1.5911.71 ± 0.0713.22 ± 0.1312.46 ± 1.0711.14 ± 0.0512.68 ± 0.0111.91 ± 1.0911.31 ± 0.35 b13.07 ± 0.34 a
LW (mm)7.96 ± 0.039.90 ± 0.118.93 ± 1.378.28 ± 0.0210.11 ± 0.079.19 ± 1.307.64 ± 0.059.57 ± 0.068.61 ± 11.377.96 ± 0.32 b9.86 ± 0.27 a
Significance of the differences via the ANOVA Newman–Keuls method
MGEM × GE
W (g)*******
HL (mm)n.s.******
CL (mm)n.s.***n.s.
CW (mm)n.s.n.s.n.s.
LL (mm)n.s.***n.s.
LW (mm)n.s.***n.s.
The mean values associated with the two factors and their interaction were evaluated according to Tukey’s test. Means that are significantly different are indicated by different letters. n.s. not significant; * significant at p < 0.05; *** significant at p < 0.001.
Table 3. Morphometric characteristics of the baby leaves of Broccolo nero (BN) and Cavolo Broccolo Ramoso Calabrese (CR) studied. Data are reported as the mean ± S.E. (n = 10). W = weight of 10 individuals (g); SL = stem length of 10 individuals (mm); N = number of true leaves of 10 individuals (n); LL = leaf length of 10 individuals (mm); LW = leaf width of 10 individuals (mm).
M0M50M100Mean
BNCR x ¯ BNCR x ¯ BNCR x ¯ BNCR
W (g)6.01 ± 0.476.88 ± 0.646.44 ± 0.625.85 ± 0.717.27 ± 1.536.56 ± 1.006.02 ± 1.127.75 ± 2.206.89 ± 1.225.96 ± 0.09 b7.31 ± 0.44 a
SL (mm)49.61 ± 0.10 ab57.79 ± 0.27 a53.70 ± 0.5852.28 ± 0.23 ab48.03 ± 0.16 b50.16 ± 0.3050.21 ± 0.18 ab54.83 ± 0.35 ab52.52 ± 0.3350.70 ± 0.1453.55 ± 0.50
N (n)3.23 ± 0.293.10 ± 0.103.17 ± 0.093.00 ± 0.273.10 ± 0.223.05 ± 0.073.17 ± 0.113.10 ± 0.223.13 ± 0.053.13 ± 0.123.10 ± 0.45
LL (mm)28.71 ± 0.0729.08 ± 0.1128.90 ± 0.0329.72 ± 0.0929.47 ± 0.0729.60 ± 0.0228.78 ± 0.2131.36 ± 0.1730.07 ± 0.1829.07 ± 0.0629.97 ± 0.12
LW (mm)19.53 ± 0.03 b21.27 ± 0.11 ab20.40 ± 0.12 b21.39 ± 0.09 a21.21 ± 0.02 ab21.30 ± 0.01 ab20.40 ± 0.06 b23.43 ± 0.19 a21.91 ± 0.21 a20.44 ± 0.09 b21.97 ± 0.13 a
Significance of the differences via the ANOVA Newman–Keuls method
MGEM × GE
W (g)n.s.***n.s.
SL (mm)n.s.n.s.**
N (n)n.s.n.s.n.s.
LL (mm)n.s.n.s.n.s.
LW (mm)****
The mean values associated with the two factors and their interaction were evaluated according to Tukey’s test. Means that are significantly different are indicated by different letters. n.s. not significant; * significant at p < 0.05; ** significant at p < 0.01; *** significant at p < 0.001.
Table 4. Variation of the total and individual GLSs (µmol g−1 d.w.) in relation to the experimental factors studied.
Total GLSsGRAGERGIBGBSMeOHGBSNeoGBSOHGBSAliphaticIndolic
M
M013.22 ± 2.254.42 ± 1.710.48 ± 0.270.43 ± 0.253.47 ± 0.641.01 ± 0.010.68 ± 0.152.27 ± 0.415.78 ± 2.217.44 ± 1.02
M5012.81 ± 3.044.52 ± 2.080.51 ± 0.320.68 ± 0.423.11 ± 0.681.04 ± 0.020.59 ± 0.142.02 ± 0.466.08 ± 2.696.72 ± 1.08
M10013.38 ± 3.624.58 ± 2.310.66 ± 0.490.79 ± 0.512.99 ± 0.691.01 ± 0.010.62 ± 0.152.24 ± 0.556.52 ± 3.156.86 ± 1.17
GS
Sprouts20.68 ± 1.84 a10.24 ± 1.50 a1.32 ± 0.48 a1.31 ± 0.53 a3.05 ± 0.17 b1.03 ± 0.02 a0.91 ± 0.09 a1.89 ± 0.23 b13.84 ± 1.75 a6.88 ± 0.26 b
Microgreens13.81 ± 0.40 b2.83 ± 0.24 b0.29 ± 0.02 b0.56 ± 0.26 b5.02 ± 0.15 a1.01 ± 0.01 ab0.73 ± 0.08 b3.08 ± 0.55 a3.96 ± 0.45 b9.85 ± 0.47 a
Baby leaves4.92 ± 0.60 c0.51 ± 0.07 c0.02 ± 0.08 b0.04 ± 0.01 c1.52 ± 0.26 c0.99 ± 0.01 b0.25 ± 0.04 c1.56 ± 0.28 b0.62 ± 0.09 c4.31 ± 0.51 c
GE
BN11.93 ± 1.953.58 ± 1.0 b0.22 ± 0.0 b1.19 ± 0.3 c3.37 ± 0.5 a1.02 ± 0.01 a0.75 ± 0.14 a1.52 ± 0.17 b5.27 ± 1.436.66 ± 0.79 b
CR14.34 ± 2.805.43 ± 2.0 a0.88 ± 0.3 a0.08 ± 0.0 b3.02 ± 0.5 b0.11 ± 0.01 b0.51 ± 0.07 b2.84 ± 0.39 a6.99 ± 2.647.35 ± 0.92 a
Significance of the differences via ANOVA Student–Newman–Keuls
Mn.s.n.s.n.s.n.s.n.s.n.s.n.s.n.s.n.s.n.s.
GS****************************
GE********n.s.*******n.s.n.s.
GS × Mn.s.n.s.n.s.n.s.n.s.n.s.n.s.n.s.n.s.n.s.
GS × GE*********n.s.n.s.********n.s.
M × GEn.s.n.s.n.s.n.s.**n.s.n.s.n.s.n.s.n.s.
GS × M × GEn.s.n.s.n.s.n.s.n.s.n.s.n.s.n.s.n.s.n.s.
The interaction of the factors *, **, and *** indicates that the Tukey test is significant at p < 0.05, p < 0.01 and p < 0.001, respectively. Means that are significantly different are indicated by different letters. GRA = glucoraphanin, GER = glucoerucin, GIB = glucoiberin, GBS = glucobrassicin, MeOHGBS = 4-methoxyglucobrassicin, NeoGBS = neoglucobrassicin, OHGBS = 4-hydroxiglucobrassicin, Aliphatic = aliphatic glucosinolates, Indolic = indolic glucosinolates, Total GLSs = total glucosinolates.
Disclaimer/Publisher’s Note: The statements, opinions and data contained in all publications are solely those of the individual author(s) and contributor(s) and not of MDPI and/or the editor(s). MDPI and/or the editor(s) disclaim responsibility for any injury to people or property resulting from any ideas, methods, instructions or products referred to in the content.