
Geochemical Profiles of Deep Sediment Layers from the Kolubara District (Western Serbia): Contamination Status and Associated Risks of Heavy Metals


Abstract
1. Introduction
2. Materials and Methods
2.1. Study Area and Sample Collection
2.2. Sample Preparation and Analysis
2.3. Contamination Status and Ecological Risk Assessment of Deep Sediment Samples
2.4. Statistical Analysis Methods
3. Results and Discussion
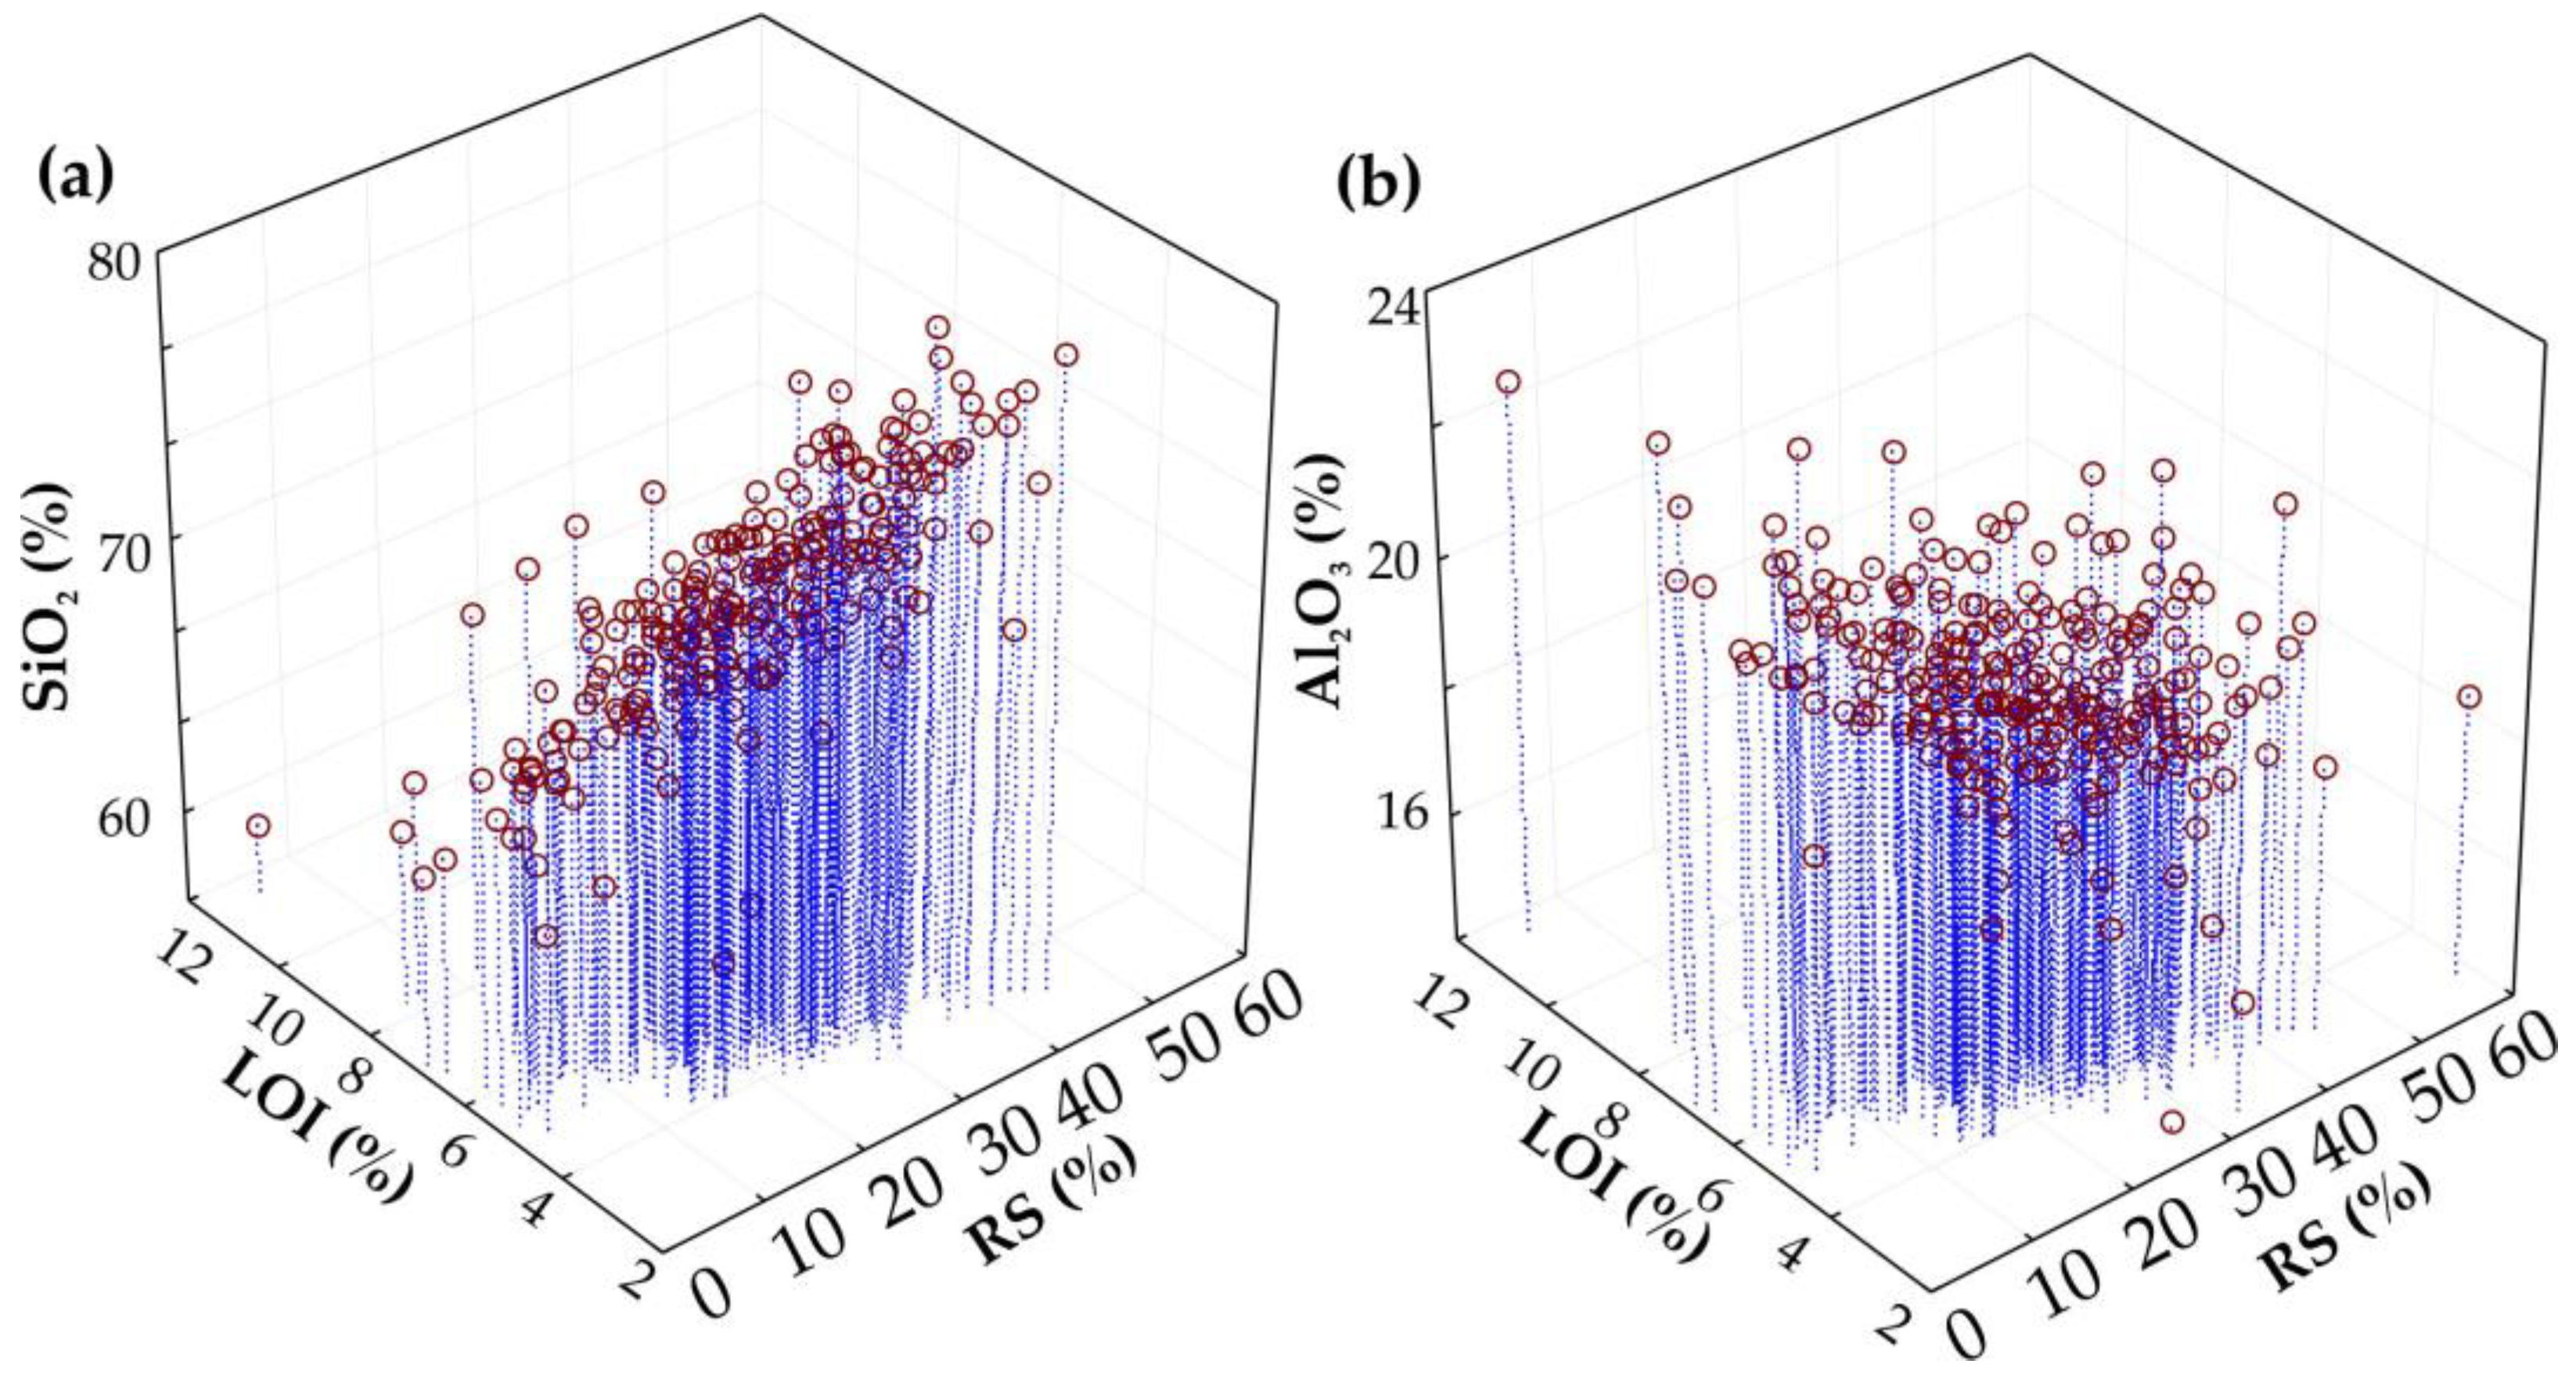
3.1. Overview of the Chemical Composition of Dry Samples
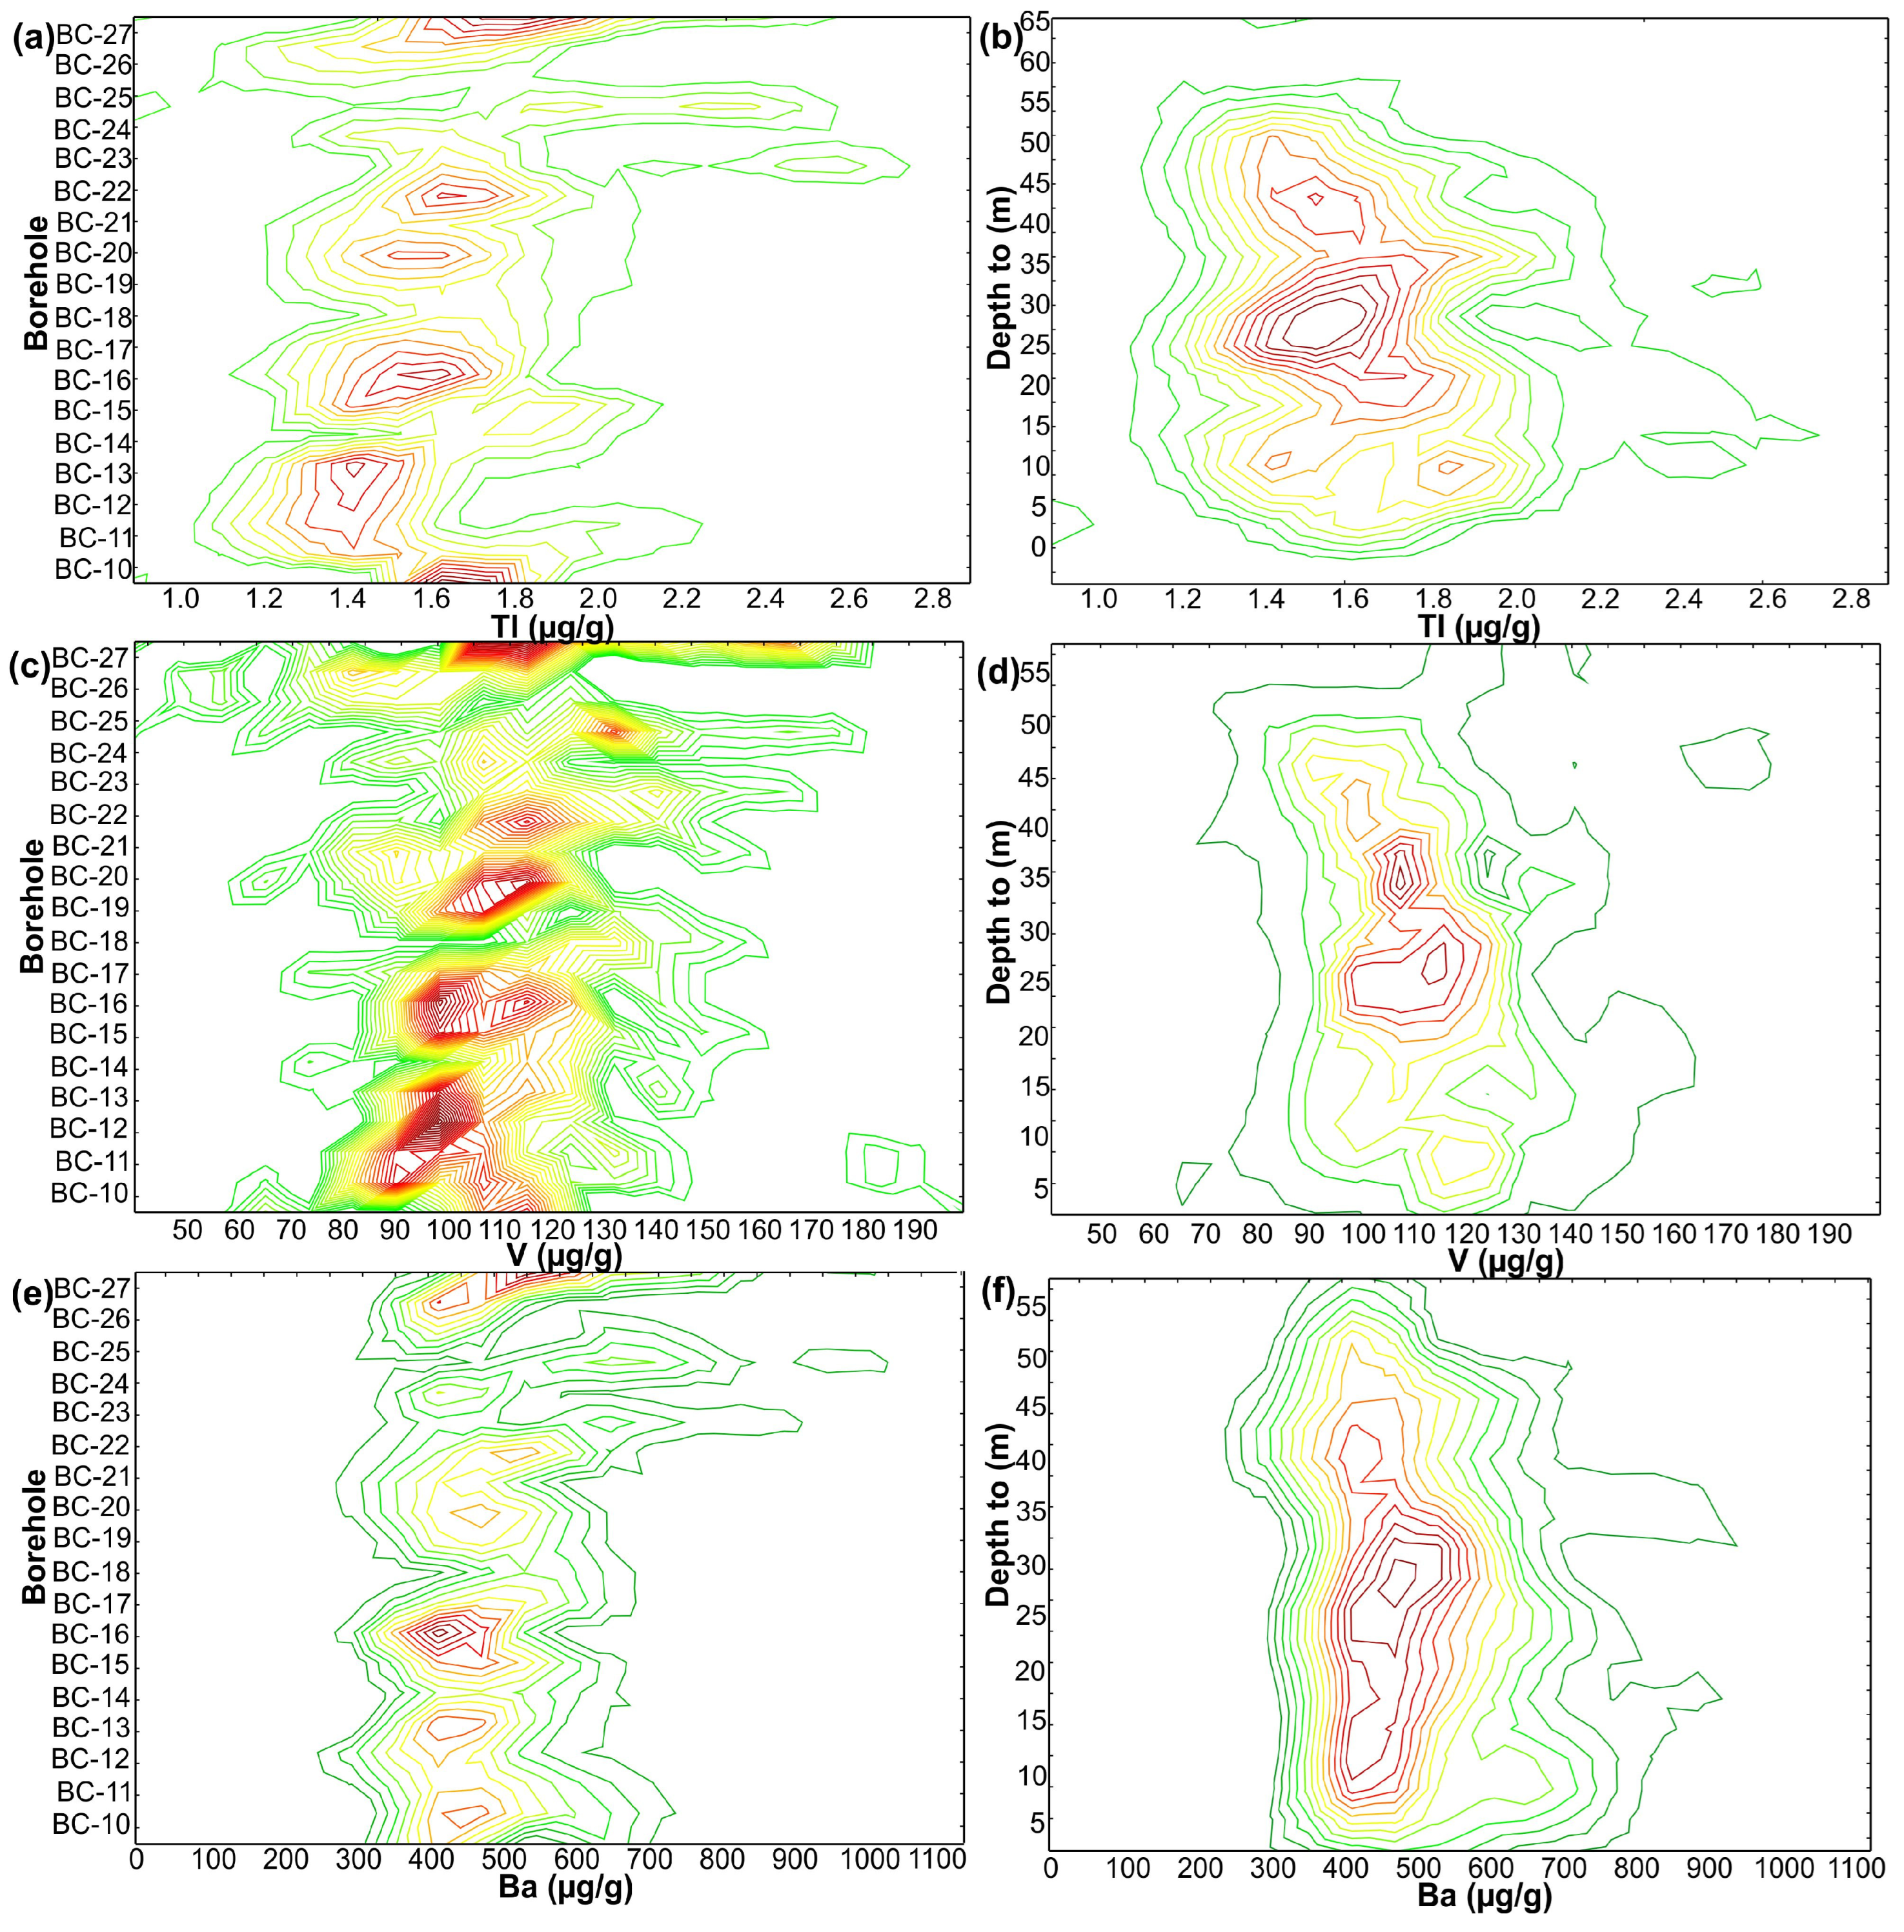
3.2. Vertical and Spatial Distributions of Elements in the Deep Sediment Profiles
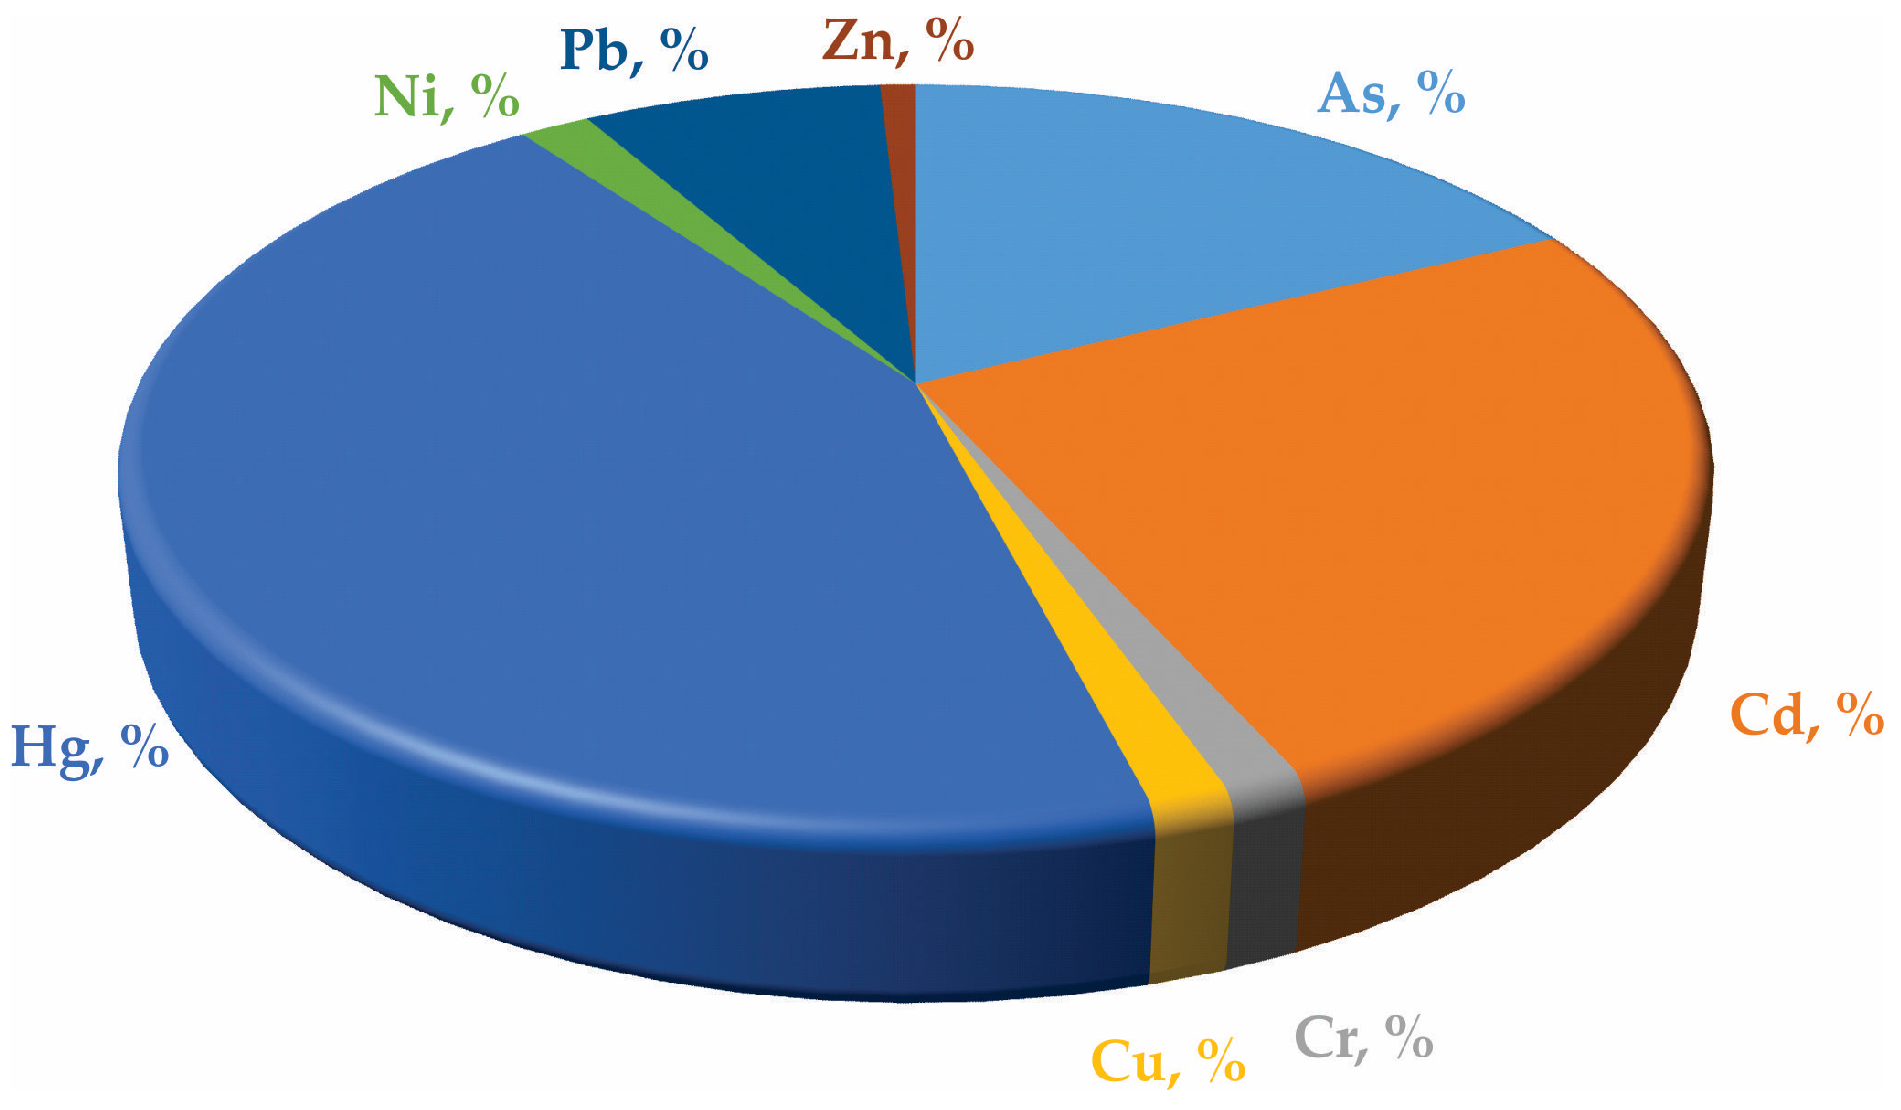
3.3. Contribution of Metals to the Contamination of Soil
3.4. Environmental Pollution Status of HMs in the Deep Sediment Profiles
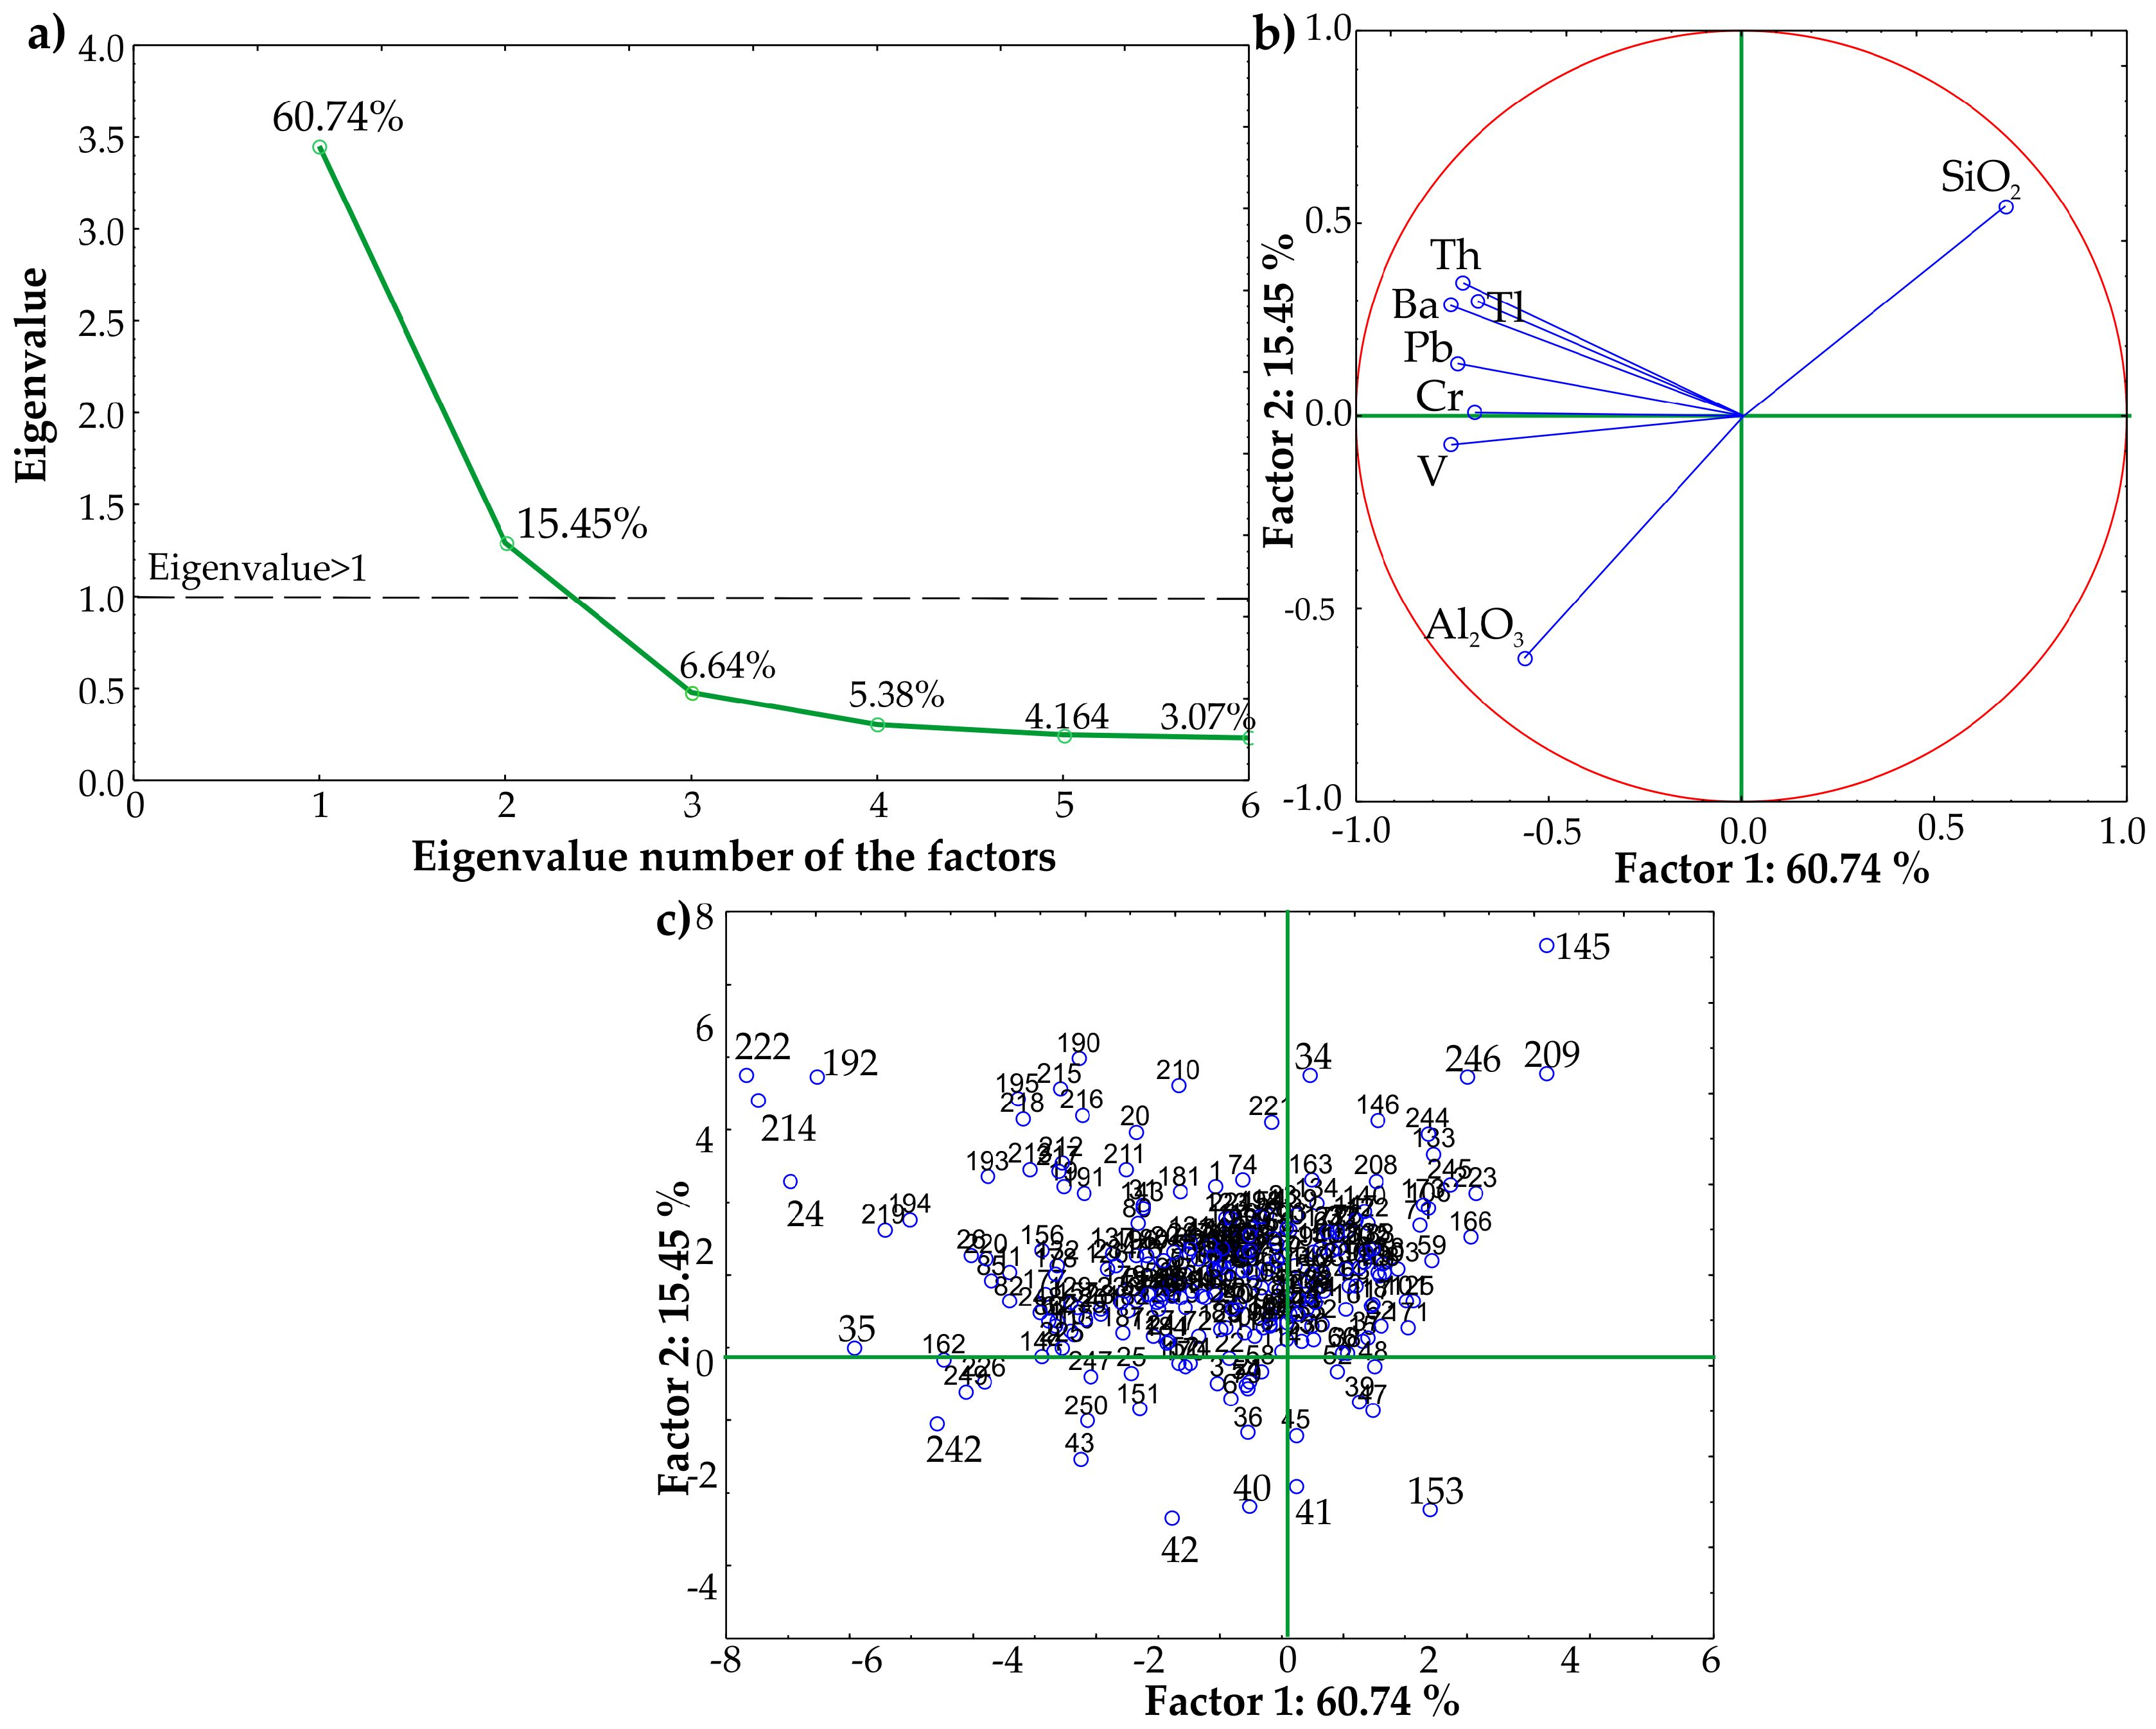
3.5. Statistical Analysis Results
4. Conclusions
Author Contributions
Funding
Data Availability Statement
Conflicts of Interest
Appendix A

| Boreholes | Latitude (N) | Longitude (E) | Altitude (m) |
|---|---|---|---|
| BC-01 | 44°25′56.05″ | 19°39′1.52″ | 202.12 |
| BC-02 | 44°25′44.34″ | 19°39′0.21″ | 204.14 |
| BC-03 | 44°25′35.58″ | 19°38′45.84″ | 225.43 |
| BC-04 | 44°25′33.98″ | 19°38′40.06″ | 225.67 |
| BC-05 | 44°25′39.04″ | 19°38′48.26″ | 242.59 |
| BC-06 | 44°25′37.88″ | 19°38′40.93″ | 241.17 |
| BC-07 | 44°25′42.60″ | 19°38′40.18″ | 250.44 |
| BC-08 | 44°25′49.09″ | 19°38′29.81″ | 219.01 |
| BC-09 | 44°25′38.54″ | 19°38′36.34″ | 239.12 |
| BC-10 | 44°25′32.39″ | 19°38′48.58″ | 224.58 |
| BC-11 | 44°25′33.31″ | 19°38′46.74″ | 225.73 |
| BC-12 | 44°25′34.24″ | 19°38′44.90″ | 229.83 |
| BC-13 | 44°25′35.16″ | 19°38′43.06″ | 234.03 |
| BC-14 | 44°25′32.31″ | 19°38′52.80″ | 214.51 |
| BC-15 | 44°25′33.82″ | 19°38′49.58″ | 224.34 |
| BC-16 | 44°25′34.70″ | 19°38′47.71″ | 228.19 |
| BC-17 | 44°25′36.46″ | 19°38′43.96″ | 230.78 |
| BC-18 | 44°25′33.74″ | 19°38′53.80″ | 219.85 |
| BC-19 | 44°25′35.25″ | 19°38′50.58″ | 230.41 |
| BC-20 | 44°25′36.13″ | 19°38′48.71″ | 235.38 |
| BC-21 | 44°25′37.01″ | 19°38′46.84″ | 235.68 |
| BC-22 | 44°25′37.89″ | 19°38′44.97″ | 230.07 |
| BC-23 | 44°25′39.28″ | 19°38′42.00″ | 237.02 |
| BC-24 | 44°25′35.93″ | 19°38′55.33″ | 216.06 |
| BC-25 | 44°25′37.37″ | 19°38′52.06″ | 233.81 |
| BC-26 | 44°25′40.61″ | 19°38′44.70″ | 243.25 |
| BC-27 | 44°25′32.25″ | 19°38′43.51″ | 225.48 |
| SiO2 | Al2O3 | Fe2O3 | CaO | MgO | Na2O | K2O | TiO2 | SO3 | |||||||||
|---|---|---|---|---|---|---|---|---|---|---|---|---|---|---|---|---|---|
| Group (%) | % | Group (%) | % | Group (%) | % | Group (%) | % | Group (%) | % | Group (%) | % | Group (%) | % | Group (%) | % | Group (%) | % |
| 60–70 | 60.8 | 16–20 | 2.8 | 0.8–1.5 | 8.8 | 0.0–0.5 | 98.8 | 1.0–1.5 | 45.6 | 0.0–0.5 | 95.2 | 1.8–3.0 | 28.8 | 0.1–0.2 | 2.0 | 0.00–0.02 | 71.6 |
| 70–80 | 39.2 | 20–25 | 81.2 | 1.5–3.0 | 84.8 | 0.5–1.0 | 1.2 | 1.5–2.0 | 52.8 | 0.5–1.0 | 4.8 | 3.0–4.0 | 66.8 | 0.2–0.3 | 84.8 | 0.02–0.04 | 21.6 |
| 25–28 | 16.0 | 3.0–6.6 | 6.4 | 2.0–3.9 | 1.6 | 4.0–4.6 | 4.4 | 0.3–0.4 | 13.2 | 0.04–0.08 | 6.8 | ||||||
| RS | CCC | TOC | |||||||||||||||
| Group (%) | % | Group (%) | % | Group (%) | % | ||||||||||||
| 0.0–20.0 | 40.4 | 0.0–0.6 | 99.6 | 0.00–0.02 | 92.8 | ||||||||||||
| 20.0–40.0 | 50.2 | 0.6–1.2 | 0.4 | 0.02–0.04 | 7.2 | ||||||||||||
| 40.0–60.0 | 9.4 | ||||||||||||||||
| Sample | Borehole | CFAs | CFCd | CFCr | CFCu | CFHg | CFNi | CFPb | CFZn | PLI | RI |
|---|---|---|---|---|---|---|---|---|---|---|---|
| S1 | BC-10 | 1.06 | 0.50 | 0.83 | 0.25 | 1.25 | 0.46 | 1.81 | 0.77 | 0.74 | 90.6 |
| S2 | BC-10 | 0.83 | 0.50 | 0.80 | 0.27 | 1.25 | 0.48 | 1.55 | 1.03 | 0.74 | 87.5 |
| S3 | BC-10 | 6.33 | 1.75 | 0.72 | 0.43 | 1.25 | 0.57 | 1.90 | 1.53 | 1.28 | 183.3 |
| S4 | BC-10 | 3.00 | 0.50 | 0.94 | 0.32 | 1.25 | 0.60 | 1.97 | 1.31 | 0.98 | 112.6 |
| S5 | BC-10 | 2.97 | 1.25 | 0.83 | 0.16 | 1.25 | 0.50 | 1.49 | 0.87 | 0.89 | 130.5 |
| S6 | BC-10 | 2.39 | 0.50 | 0.72 | 0.31 | 1.25 | 0.56 | 1.78 | 1.12 | 0.88 | 262.0 |
| S7 | BC-10 | 2.00 | 1.75 | 0.86 | 0.36 | 1.25 | 0.59 | 1.94 | 1.70 | 1.13 | 140.3 |
| S8 | BC-10 | 2.33 | 2.00 | 0.95 | 0.42 | 1.25 | 0.57 | 2.42 | 1.88 | 1.25 | 154.1 |
| S9 | BC-10 | 1.56 | 0.50 | 0.64 | 0.23 | 1.25 | 0.44 | 1.49 | 0.80 | 0.72 | 93.4 |
| S10 | BC-10 | 1.67 | 0.50 | 0.91 | 0.45 | 1.25 | 0.51 | 2.29 | 0.75 | 0.88 | 100.5 |
| S11 | BC-10 | 2.33 | 0.50 | 0.91 | 0.43 | 1.25 | 0.57 | 2.62 | 1.06 | 0.99 | 109.3 |
| S12 | BC-10 | 1.67 | 0.50 | 0.65 | 0.23 | 1.25 | 0.32 | 1.89 | 0.79 | 0.72 | 95.9 |
| S13 | BC-10 | 1.94 | 0.50 | 0.88 | 0.27 | 1.25 | 0.61 | 1.96 | 0.92 | 0.87 | 101.3 |
| S14 | BC-10 | 5.28 | 0.50 | 0.87 | 0.23 | 1.25 | 0.62 | 1.73 | 1.92 | 1.04 | 134.3 |
| S15 | BC-11 | 1.94 | 1.75 | 0.60 | 0.25 | 1.25 | 0.30 | 1.34 | 0.72 | 0.81 | 133.3 |
| S16 | BC-11 | 1.83 | 0.50 | 0.60 | 0.24 | 1.25 | 0.30 | 1.44 | 0.75 | 0.69 | 95.1 |
| S17 | BC-11 | 1.22 | 0.50 | 0.83 | 0.29 | 1.25 | 0.50 | 1.65 | 1.03 | 0.79 | 92.1 |
| S18 | BC-11 | 1.22 | 0.50 | 0.64 | 0.32 | 1.25 | 0.26 | 1.34 | 0.70 | 0.66 | 88.8 |
| S19 | BC-11 | 3.17 | 2.00 | 0.91 | 0.37 | 1.25 | 0.53 | 2.27 | 1.43 | 1.21 | 160.8 |
| S20 | BC-11 | 2.61 | 0.50 | 0.89 | 0.30 | 1.25 | 0.53 | 1.94 | 1.18 | 0.93 | 107.9 |
| S21 | BC-11 | 1.44 | 1.50 | 0.75 | 0.36 | 1.25 | 0.33 | 1.75 | 0.67 | 0.85 | 123.8 |
| S22 | BC-11 | 1.39 | 0.50 | 0.73 | 0.36 | 1.25 | 0.36 | 1.61 | 1.04 | 0.78 | 93.0 |
| S23 | BC-11 | 1.22 | 0.50 | 0.88 | 0.21 | 1.25 | 0.43 | 1.40 | 0.56 | 0.68 | 89.7 |
| S24 | BC-11 | 3.72 | 0.50 | 1.02 | 0.54 | 1.25 | 0.68 | 2.93 | 1.96 | 1.22 | 127.0 |
| S25 | BC-11 | 2.06 | 0.50 | 0.79 | 0.45 | 1.25 | 0.35 | 2.22 | 0.86 | 0.86 | 103.1 |
| S26 | BC-11 | 2.78 | 0.50 | 1.02 | 0.30 | 1.25 | 0.50 | 2.33 | 1.02 | 0.94 | 111.4 |
| S27 | BC-11 | 1.89 | 0.50 | 0.81 | 0.21 | 1.25 | 0.60 | 1.77 | 0.93 | 0.82 | 99.3 |
| S28 | BC-11 | 1.78 | 0.50 | 0.89 | 0.13 | 1.25 | 0.50 | 2.14 | 1.03 | 0.78 | 99.4 |
| S29 | BC-11 | 1.50 | 0.50 | 0.82 | 0.17 | 1.25 | 0.53 | 1.83 | 0.91 | 0.76 | 95.2 |
| S30 | BC-11 | 1.67 | 0.50 | 0.80 | 0.18 | 1.25 | 0.50 | 1.70 | 1.00 | 0.77 | 96.2 |
| S31 | BC-11 | 2.00 | 4.00 | 0.85 | 0.17 | 1.25 | 0.45 | 1.82 | 0.95 | 1.01 | 204.9 |
| S32 | BC-11 | 2.78 | 0.50 | 0.77 | 0.13 | 1.25 | 0.51 | 1.61 | 0.84 | 0.77 | 106.4 |
| S33 | BC-11 | 2.61 | 0.50 | 0.72 | 0.25 | 1.25 | 0.49 | 1.58 | 0.73 | 0.80 | 104.9 |
| S34 | BC-11 | 1.56 | 0.50 | 0.84 | 0.18 | 1.25 | 0.43 | 1.56 | 1.03 | 0.75 | 94.1 |
| S35 | BC-11 | 1.06 | 0.50 | 1.12 | 0.42 | 1.25 | 0.30 | 3.15 | 0.45 | 0.78 | 97.6 |
| S36 | BC-12 | 2.39 | 1.75 | 0.67 | 0.32 | 3.75 | 0.35 | 1.52 | 1.07 | 1.08 | 239.7 |
| S37 | BC-12 | 1.72 | 1.75 | 0.61 | 0.35 | 1.25 | 0.38 | 1.57 | 1.35 | 0.95 | 133.8 |
| S38 | BC-12 | 0.89 | 0.50 | 0.67 | 0.30 | 1.25 | 0.31 | 1.18 | 0.71 | 0.64 | 84.9 |
| S39 | BC-12 | 0.94 | 1.75 | 0.67 | 0.31 | 1.25 | 0.34 | 1.16 | 0.86 | 0.79 | 123.2 |
| S40 | BC-12 | 1.56 | 0.50 | 0.74 | 0.35 | 1.25 | 0.32 | 1.31 | 0.87 | 0.74 | 92.8 |
| S41 | BC-12 | 1.78 | 0.50 | 0.74 | 0.33 | 1.25 | 0.38 | 1.22 | 1.15 | 0.79 | 95.0 |
| S42 | BC-12 | 3.11 | 1.75 | 0.77 | 0.16 | 1.25 | 0.41 | 1.74 | 1.12 | 0.95 | 147.8 |
| S43 | BC-12 | 3.39 | 0.50 | 0.82 | 0.25 | 1.25 | 0.42 | 1.90 | 0.89 | 0.86 | 114.3 |
| S44 | BC-12 | 2.44 | 0.50 | 0.72 | 0.23 | 1.25 | 0.33 | 1.70 | 0.50 | 0.72 | 102.7 |
| S45 | BC-12 | 0.67 | 6.50 | 0.70 | 0.18 | 1.25 | 0.38 | 0.98 | 0.39 | 0.75 | 261.2 |
| S46 | BC-12 | 1.39 | 1.75 | 0.87 | 0.43 | 1.25 | 0.22 | 1.30 | 0.51 | 0.80 | 128.3 |
| S47 | BC-12 | 1.17 | 0.50 | 0.62 | 0.24 | 1.25 | 0.21 | 0.89 | 0.44 | 0.55 | 85.0 |
| S48 | BC-12 | 1.00 | 0.50 | 0.59 | 0.24 | 1.25 | 0.22 | 1.33 | 0.42 | 0.57 | 85.6 |
| S49 | BC-13 | 1.11 | 0.50 | 0.67 | 0.15 | 1.25 | 0.43 | 1.27 | 1.13 | 0.67 | 87.8 |
| S50 | BC-13 | 1.50 | 5.00 | 0.76 | 0.21 | 1.25 | 0.74 | 2.01 | 2.23 | 1.22 | 233.5 |
| S51 | BC-13 | 3.39 | 0.50 | 0.73 | 0.33 | 1.25 | 0.42 | 1.55 | 1.70 | 0.93 | 113.6 |
| S52 | BC-13 | 2.28 | 0.50 | 0.70 | 0.24 | 1.25 | 0.36 | 1.28 | 1.00 | 0.76 | 99.6 |
| S53 | BC-13 | 1.28 | 0.50 | 0.70 | 0.20 | 1.25 | 0.30 | 1.22 | 0.74 | 0.65 | 88.5 |
| S54 | BC-13 | 1.39 | 1.75 | 0.82 | 0.44 | 1.25 | 0.50 | 1.57 | 1.27 | 1.01 | 131.8 |
| S55 | BC-13 | 11.06 | 1.75 | 0.64 | 0.30 | 1.25 | 0.35 | 1.67 | 0.51 | 1.04 | 226.5 |
| S56 | BC-13 | 0.94 | 4.50 | 0.72 | 0.44 | 1.25 | 0.29 | 1.36 | 0.62 | 0.89 | 206.9 |
| S57 | BC-13 | 1.61 | 1.75 | 1.06 | 0.46 | 1.25 | 0.41 | 2.29 | 0.78 | 1.03 | 137.3 |
| S58 | BC-13 | 1.39 | 0.50 | 0.68 | 0.25 | 1.25 | 0.36 | 1.47 | 0.54 | 0.67 | 91.2 |
| S59 | BC-13 | 0.72 | 0.50 | 0.57 | 0.28 | 1.25 | 0.38 | 1.27 | 0.47 | 0.60 | 83.5 |
| S60 | BC-13 | 1.44 | 0.50 | 0.81 | 0.39 | 1.25 | 0.21 | 1.70 | 0.61 | 0.71 | 93.2 |
| S61 | BC-13 | 1.33 | 0.50 | 0.72 | 0.32 | 1.25 | 0.29 | 1.99 | 0.50 | 0.70 | 93.3 |
| S62 | BC-13 | 1.28 | 0.50 | 0.58 | 0.33 | 1.25 | 0.22 | 1.39 | 0.54 | 0.63 | 91.1 |
| S63 | BC-13 | 1.11 | 0.50 | 0.71 | 0.37 | 1.25 | 0.31 | 1.24 | 0.70 | 0.69 | 252.5 |
| S64 | BC-13 | 1.11 | 0.50 | 0.66 | 0.34 | 1.25 | 0.24 | 1.59 | 0.54 | 0.65 | 131.5 |
| S65 | BC-13 | 2.22 | 4.50 | 0.60 | 0.27 | 1.25 | 0.35 | 2.24 | 0.49 | 0.97 | 105.7 |
| S66 | BC-13 | 1.50 | 0.50 | 0.52 | 0.28 | 1.25 | 0.26 | 2.58 | 0.57 | 0.69 | 109.4 |
| S67 | BC-14 | 1.94 | 8.00 | 0.84 | 0.49 | 1.25 | 0.49 | 2.20 | 1.46 | 1.37 | 165.4 |
| S68 | BC-14 | 2.67 | 0.50 | 0.77 | 0.34 | 1.25 | 0.36 | 1.53 | 0.86 | 0.82 | 104.8 |
| S69 | BC-14 | 1.56 | 0.50 | 0.72 | 0.40 | 1.25 | 0.46 | 1.83 | 1.46 | 0.88 | 107.4 |
| S70 | BC-14 | 2.00 | 1.75 | 0.75 | 0.36 | 1.25 | 0.42 | 1.87 | 1.44 | 1.04 | 88.4 |
| S71 | BC-14 | 1.39 | 6.50 | 0.63 | 0.32 | 1.25 | 0.33 | 1.31 | 1.00 | 1.00 | 106.8 |
| S72 | BC-14 | 3.28 | 3.50 | 0.78 | 0.38 | 1.25 | 0.43 | 1.81 | 0.99 | 1.16 | 146.9 |
| S73 | BC-14 | 2.61 | 0.50 | 0.72 | 0.48 | 1.25 | 0.55 | 2.02 | 1.81 | 1.02 | 206.5 |
| S74 | BC-14 | 4.17 | 5.00 | 0.70 | 0.42 | 1.25 | 2.07 | 2.26 | 3.20 | 1.81 | 111.2 |
| S75 | BC-14 | 2.06 | 4.50 | 0.74 | 0.33 | 1.25 | 0.40 | 1.70 | 1.13 | 1.10 | 130.0 |
| S76 | BC-15 | 1.78 | 4.00 | 0.66 | 0.25 | 1.25 | 0.34 | 1.72 | 0.75 | 0.95 | 180.9 |
| S77 | BC-15 | 2.22 | 0.50 | 0.77 | 0.33 | 1.25 | 0.45 | 1.78 | 1.42 | 0.89 | 89.2 |
| S78 | BC-15 | 1.89 | 0.50 | 0.72 | 0.26 | 1.25 | 0.37 | 1.62 | 1.16 | 0.79 | 104.3 |
| S79 | BC-15 | 1.83 | 0.50 | 0.77 | 0.47 | 1.25 | 0.65 | 1.69 | 1.63 | 0.96 | 92.4 |
| S80 | BC-15 | 1.72 | 0.50 | 0.84 | 0.46 | 1.25 | 0.40 | 2.05 | 1.12 | 0.89 | 109.0 |
| S81 | BC-15 | 2.00 | 0.50 | 0.78 | 0.33 | 1.25 | 0.29 | 1.34 | 0.82 | 0.75 | 125.3 |
| S82 | BC-15 | 2.28 | 0.50 | 0.83 | 0.45 | 1.25 | 0.42 | 2.22 | 1.31 | 0.95 | 83.9 |
| S83 | BC-15 | 3.94 | 0.50 | 0.97 | 0.31 | 1.25 | 0.52 | 1.63 | 1.39 | 0.98 | 92.2 |
| S84 | BC-15 | 2.17 | 0.50 | 0.72 | 0.33 | 1.25 | 0.39 | 1.71 | 1.15 | 0.84 | 99.9 |
| S85 | BC-15 | 3.11 | 4.00 | 1.50 | 0.43 | 1.25 | 0.56 | 1.98 | 0.74 | 1.30 | 109.0 |
| S86 | BC-15 | 3.56 | 0.50 | 0.83 | 0.46 | 1.25 | 0.50 | 2.15 | 2.12 | 1.09 | 104.3 |
| S87 | BC-15 | 2.50 | 1.75 | 0.74 | 0.35 | 1.25 | 0.40 | 2.03 | 1.41 | 1.06 | 93.1 |
| S88 | BC-15 | 2.33 | 0.50 | 0.81 | 0.29 | 1.25 | 0.37 | 2.09 | 1.04 | 0.85 | 91.9 |
| S89 | BC-15 | 1.56 | 0.50 | 0.76 | 0.29 | 1.25 | 0.35 | 1.59 | 0.72 | 0.74 | 94.3 |
| S90 | BC-15 | 2.89 | 0.50 | 0.70 | 0.24 | 1.25 | 0.41 | 1.94 | 0.89 | 0.82 | 752.2 |
| S91 | BC-15 | 3.00 | 0.50 | 0.72 | 0.31 | 1.25 | 0.38 | 2.06 | 1.10 | 0.88 | 93.7 |
| S92 | BC-16 | 3.00 | 0.50 | 0.82 | 0.29 | 1.25 | 0.43 | 1.68 | 1.19 | 0.89 | 211.2 |
| S93 | BC-16 | 1.61 | 0.50 | 0.81 | 0.30 | 1.25 | 0.35 | 1.92 | 0.88 | 0.78 | 116.8 |
| S94 | BC-16 | 1.06 | 0.50 | 0.75 | 0.41 | 1.25 | 0.41 | 1.42 | 1.20 | 0.78 | 97.8 |
| S95 | BC-16 | 1.06 | 0.50 | 0.72 | 0.29 | 1.25 | 0.31 | 1.27 | 0.74 | 0.67 | 128.0 |
| S96 | BC-16 | 2.39 | 2.00 | 0.85 | 0.39 | 1.25 | 0.43 | 1.45 | 0.91 | 1.01 | 511.2 |
| S97 | BC-16 | 1.56 | 0.50 | 0.75 | 0.36 | 1.25 | 0.32 | 1.73 | 0.96 | 0.78 | 232.3 |
| S98 | BC-16 | 2.72 | 0.50 | 0.74 | 0.38 | 1.25 | 0.48 | 1.44 | 1.48 | 0.91 | 92.9 |
| S99 | BC-16 | 2.50 | 0.50 | 0.75 | 0.36 | 1.25 | 0.34 | 1.87 | 0.86 | 0.83 | 120.2 |
| S100 | BC-16 | 2.39 | 0.50 | 0.76 | 0.41 | 1.25 | 0.41 | 1.93 | 1.16 | 0.90 | 98.6 |
| S101 | BC-16 | 2.67 | 1.75 | 0.83 | 0.20 | 1.25 | 0.29 | 1.22 | 0.59 | 0.82 | 105.3 |
| S102 | BC-16 | 2.89 | 0.50 | 0.72 | 0.24 | 1.25 | 0.35 | 1.85 | 0.94 | 0.81 | 100.7 |
| S103 | BC-16 | 2.50 | 0.50 | 0.70 | 0.17 | 1.25 | 0.32 | 1.42 | 0.71 | 0.70 | 84.0 |
| S104 | BC-16 | 1.78 | 0.50 | 0.76 | 0.19 | 1.25 | 0.33 | 1.40 | 0.68 | 0.69 | 93.3 |
| S105 | BC-16 | 3.94 | 0.50 | 0.79 | 0.26 | 1.25 | 0.38 | 1.83 | 0.90 | 0.87 | 88.7 |
| S106 | BC-16 | 1.89 | 0.50 | 0.67 | 0.16 | 1.25 | 0.28 | 1.40 | 0.60 | 0.65 | 96.4 |
| S107 | BC-16 | 1.56 | 0.50 | 0.74 | 0.42 | 1.25 | 0.26 | 1.62 | 0.42 | 0.69 | 95.1 |
| S108 | BC-16 | 0.89 | 0.50 | 0.75 | 0.34 | 1.25 | 0.23 | 1.22 | 0.34 | 0.58 | 126.8 |
| S109 | BC-16 | 1.00 | 0.50 | 0.75 | 0.45 | 1.25 | 0.25 | 1.59 | 0.37 | 0.65 | 149.2 |
| S110 | BC-16 | 0.72 | 4.50 | 0.87 | 0.45 | 1.25 | 0.23 | 1.49 | 0.44 | 0.83 | 101.8 |
| S111 | BC-17 | 1.61 | 0.50 | 0.70 | 0.19 | 1.25 | 0.36 | 1.47 | 1.11 | 0.73 | 100.1 |
| S112 | BC-17 | 1.94 | 0.50 | 0.75 | 0.21 | 1.25 | 0.38 | 1.73 | 1.24 | 0.79 | 113.1 |
| S113 | BC-17 | 4.89 | 1.75 | 0.83 | 0.43 | 1.25 | 0.45 | 2.16 | 1.67 | 1.25 | 132.3 |
| S114 | BC-17 | 1.94 | 0.50 | 0.73 | 0.26 | 1.25 | 0.38 | 1.38 | 1.11 | 0.78 | 187.3 |
| S115 | BC-17 | 0.81 | 2.50 | 0.74 | 0.34 | 1.25 | 0.33 | 1.34 | 0.82 | 0.83 | 118.0 |
| S116 | BC-17 | 1.39 | 0.50 | 0.72 | 0.37 | 1.25 | 0.40 | 1.66 | 0.99 | 0.79 | 134.6 |
| S117 | BC-17 | 1.22 | 0.50 | 0.69 | 0.35 | 1.25 | 0.37 | 1.35 | 1.21 | 0.76 | 159.9 |
| S118 | BC-17 | 1.28 | 1.75 | 0.82 | 0.46 | 1.25 | 0.44 | 1.81 | 2.39 | 1.09 | 102.2 |
| S119 | BC-17 | 1.33 | 4.00 | 0.75 | 0.42 | 1.25 | 0.34 | 1.52 | 0.80 | 0.99 | 101.0 |
| S120 | BC-17 | 1.28 | 0.50 | 0.76 | 0.39 | 1.25 | 0.26 | 1.58 | 0.62 | 0.70 | 91.9 |
| S121 | BC-17 | 1.33 | 0.50 | 0.87 | 0.36 | 1.25 | 0.25 | 1.33 | 0.59 | 0.69 | 187.1 |
| S122 | BC-17 | 1.17 | 1.75 | 0.64 | 0.20 | 1.25 | 0.24 | 1.42 | 0.40 | 0.68 | 117.2 |
| S123 | BC-17 | 0.67 | 0.50 | 0.78 | 0.24 | 1.25 | 0.23 | 1.76 | 0.44 | 0.59 | 91.9 |
| S124 | BC-17 | 2.17 | 0.50 | 0.74 | 0.21 | 1.25 | 0.24 | 1.43 | 0.50 | 0.66 | 126.2 |
| S125 | BC-17 | 1.44 | 0.50 | 0.60 | 0.20 | 1.25 | 0.26 | 1.55 | 0.41 | 0.60 | 91.1 |
| S126 | BC-18 | 2.11 | 5.50 | 0.76 | 0.39 | 1.25 | 0.32 | 2.13 | 0.62 | 1.08 | 252.5 |
| S127 | BC-18 | 2.06 | 1.50 | 0.77 | 0.32 | 1.25 | 0.41 | 1.91 | 1.13 | 0.98 | 131.5 |
| S128 | BC-18 | 2.44 | 0.50 | 0.73 | 0.38 | 1.25 | 0.36 | 2.02 | 1.00 | 0.86 | 105.7 |
| S129 | BC-18 | 2.50 | 0.50 | 0.86 | 0.41 | 1.25 | 0.45 | 2.34 | 1.76 | 1.00 | 109.4 |
| S130 | BC-18 | 5.22 | 1.50 | 0.73 | 0.44 | 1.25 | 0.64 | 1.71 | 2.77 | 1.33 | 165.4 |
| S131 | BC-18 | 2.11 | 0.50 | 0.77 | 0.45 | 1.25 | 0.42 | 2.20 | 1.81 | 0.97 | 104.8 |
| S132 | BC-18 | 2.22 | 0.50 | 0.81 | 0.47 | 1.25 | 0.38 | 2.62 | 1.19 | 0.94 | 107.4 |
| S133 | BC-19 | 1.22 | 0.50 | 0.66 | 0.22 | 1.25 | 0.32 | 1.27 | 0.77 | 0.66 | 88.4 |
| S134 | BC-19 | 2.83 | 0.50 | 0.66 | 0.19 | 1.25 | 0.37 | 1.69 | 0.88 | 0.77 | 106.8 |
| S135 | BC-19 | 2.39 | 2.00 | 0.69 | 0.33 | 1.25 | 0.35 | 1.46 | 0.92 | 0.94 | 146.9 |
| S136 | BC-19 | 2.17 | 4.00 | 0.74 | 0.25 | 1.25 | 0.47 | 1.70 | 1.21 | 1.09 | 206.5 |
| S137 | BC-19 | 2.67 | 0.50 | 0.85 | 0.40 | 1.25 | 0.67 | 2.14 | 1.78 | 1.05 | 111.2 |
| S138 | BC-19 | 0.78 | 2.00 | 0.70 | 0.29 | 1.25 | 0.31 | 1.41 | 0.83 | 0.78 | 130.0 |
| S139 | BC-19 | 1.28 | 3.50 | 0.76 | 0.27 | 1.25 | 0.33 | 1.53 | 0.90 | 0.92 | 180.9 |
| S140 | BC-19 | 1.25 | 0.50 | 0.70 | 0.21 | 1.25 | 0.29 | 1.41 | 0.77 | 0.66 | 89.2 |
| S141 | BC-19 | 2.28 | 0.50 | 0.79 | 0.42 | 1.25 | 0.50 | 1.78 | 1.46 | 0.94 | 104.3 |
| S142 | BC-19 | 1.39 | 0.50 | 0.72 | 0.31 | 1.25 | 0.34 | 1.53 | 1.17 | 0.76 | 92.4 |
| S143 | BC-19 | 2.61 | 0.50 | 0.84 | 0.45 | 1.25 | 0.53 | 1.87 | 1.93 | 1.02 | 109.0 |
| S144 | BC-19 | 4.06 | 0.50 | 0.90 | 0.47 | 1.25 | 0.63 | 2.10 | 1.94 | 1.14 | 125.3 |
| S145 | BC-20 | 0.89 | 0.50 | 0.58 | 0.14 | 1.25 | 0.29 | 1.14 | 1.04 | 0.59 | 83.9 |
| S146 | BC-20 | 1.56 | 0.50 | 0.71 | 0.19 | 1.25 | 0.33 | 1.36 | 0.88 | 0.69 | 92.2 |
| S147 | BC-20 | 2.28 | 0.50 | 0.72 | 0.20 | 1.25 | 0.37 | 1.39 | 0.86 | 0.74 | 99.9 |
| S148 | BC-20 | 2.94 | 0.50 | 0.73 | 0.29 | 1.25 | 0.42 | 1.69 | 1.14 | 0.86 | 109.0 |
| S149 | BC-20 | 2.56 | 0.50 | 0.69 | 0.23 | 1.25 | 0.41 | 1.59 | 1.19 | 0.82 | 104.3 |
| S150 | BC-20 | 1.50 | 0.50 | 0.76 | 0.37 | 1.25 | 0.29 | 1.48 | 0.87 | 0.75 | 93.1 |
| S151 | BC-20 | 1.17 | 0.50 | 0.80 | 0.38 | 1.25 | 0.38 | 1.75 | 1.13 | 0.80 | 91.9 |
| S152 | BC-20 | 1.33 | 0.50 | 0.89 | 0.47 | 1.25 | 0.59 | 1.56 | 1.17 | 0.88 | 94.3 |
| S153 | BC-20 | 1.17 | 4.50 | 0.72 | 0.34 | 15.00 | 0.32 | 0.01 | 0.74 | 0.70 | 752.2 |
| S154 | BC-20 | 1.44 | 0.50 | 0.75 | 0.36 | 1.25 | 0.38 | 1.56 | 1.23 | 0.80 | 93.7 |
| S155 | BC-20 | 1.33 | 4.50 | 0.76 | 0.34 | 1.25 | 0.26 | 1.54 | 0.62 | 0.91 | 211.2 |
| S156 | BC-20 | 3.33 | 0.50 | 0.86 | 0.41 | 1.25 | 0.53 | 2.14 | 1.31 | 1.01 | 116.8 |
| S157 | BC-20 | 1.67 | 0.50 | 1.25 | 0.34 | 1.25 | 0.50 | 1.70 | 0.93 | 0.88 | 97.8 |
| S158 | BC-20 | 1.33 | 1.75 | 0.70 | 0.27 | 1.25 | 0.36 | 1.37 | 0.70 | 0.81 | 128.0 |
| S159 | BC-20 | 1.14 | 3.75 | 0.74 | 0.30 | 9.38 | 0.36 | 1.34 | 0.82 | 1.17 | 511.2 |
| S160 | BC-20 | 3.22 | 4.50 | 0.73 | 0.26 | 1.25 | 0.44 | 1.86 | 0.90 | 1.12 | 232.3 |
| S161 | BC-20 | 1.67 | 0.50 | 0.69 | 0.27 | 1.25 | 0.32 | 1.24 | 0.67 | 0.69 | 92.9 |
| S162 | BC-20 | 3.44 | 0.50 | 0.91 | 0.30 | 1.25 | 0.56 | 2.54 | 1.96 | 1.06 | 120.2 |
| S163 | BC-21 | 2.11 | 0.50 | 0.67 | 0.21 | 1.25 | 0.40 | 1.38 | 1.23 | 0.77 | 98.6 |
| S164 | BC-21 | 2.56 | 0.50 | 0.75 | 0.37 | 1.25 | 0.39 | 1.70 | 0.91 | 0.85 | 105.3 |
| S165 | BC-21 | 2.17 | 0.50 | 0.79 | 0.23 | 1.25 | 0.44 | 1.58 | 1.29 | 0.83 | 100.7 |
| S166 | BC-21 | 0.94 | 0.50 | 0.62 | 0.23 | 1.25 | 0.26 | 1.05 | 0.60 | 0.58 | 84.0 |
| S167 | BC-21 | 1.39 | 0.50 | 0.79 | 0.49 | 1.25 | 0.34 | 1.58 | 0.81 | 0.79 | 93.3 |
| S168 | BC-21 | 1.22 | 0.50 | 0.64 | 0.29 | 1.25 | 0.29 | 1.34 | 0.65 | 0.66 | 88.7 |
| S169 | BC-21 | 1.61 | 0.50 | 0.77 | 0.39 | 1.25 | 0.33 | 1.84 | 0.98 | 0.80 | 96.4 |
| S170 | BC-21 | 1.50 | 0.50 | 0.84 | 0.38 | 1.25 | 0.34 | 1.68 | 1.47 | 0.84 | 95.1 |
| S171 | BC-21 | 1.28 | 1.75 | 0.67 | 0.29 | 1.25 | 0.31 | 1.27 | 0.81 | 0.80 | 126.8 |
| S172 | BC-21 | 3.28 | 1.75 | 0.71 | 0.33 | 1.25 | 0.43 | 1.50 | 1.28 | 1.04 | 149.2 |
| S173 | BC-21 | 2.50 | 0.50 | 0.68 | 0.22 | 1.25 | 0.37 | 1.22 | 1.41 | 0.79 | 101.8 |
| S174 | BC-22 | 2.00 | 0.50 | 0.73 | 0.35 | 1.25 | 0.49 | 1.66 | 1.19 | 0.86 | 100.1 |
| S175 | BC-22 | 3.00 | 0.50 | 0.73 | 0.20 | 1.25 | 0.39 | 2.50 | 1.19 | 0.87 | 113.1 |
| S176 | BC-22 | 1.83 | 1.63 | 0.74 | 0.34 | 1.25 | 0.44 | 1.72 | 1.30 | 0.99 | 132.3 |
| S177 | BC-22 | 2.86 | 3.00 | 0.84 | 0.35 | 1.25 | 0.53 | 2.22 | 1.53 | 1.24 | 187.3 |
| S178 | BC-22 | 3.42 | 0.50 | 0.86 | 0.31 | 1.25 | 0.52 | 2.27 | 1.62 | 1.01 | 118.0 |
| S179 | BC-22 | 2.97 | 1.25 | 0.84 | 0.30 | 1.25 | 0.51 | 2.06 | 1.39 | 1.07 | 134.6 |
| S180 | BC-22 | 1.72 | 2.50 | 0.81 | 0.41 | 1.25 | 0.49 | 2.05 | 1.27 | 1.11 | 159.9 |
| S181 | BC-22 | 1.97 | 0.50 | 0.80 | 0.36 | 1.25 | 0.42 | 2.22 | 0.94 | 0.86 | 102.2 |
| S182 | BC-22 | 1.78 | 0.50 | 0.88 | 0.44 | 1.25 | 0.45 | 2.23 | 0.82 | 0.88 | 101.0 |
| S183 | BC-22 | 1.19 | 0.50 | 0.74 | 0.38 | 1.25 | 0.43 | 1.72 | 0.84 | 0.78 | 91.9 |
| S184 | BC-22 | 3.03 | 2.88 | 0.80 | 0.46 | 1.25 | 0.64 | 2.24 | 2.24 | 1.38 | 187.1 |
| S185 | BC-22 | 1.39 | 1.25 | 0.76 | 0.40 | 1.25 | 0.39 | 1.94 | 0.64 | 0.87 | 117.2 |
| S186 | BC-22 | 1.11 | 0.50 | 0.79 | 0.36 | 1.25 | 0.45 | 1.90 | 0.70 | 0.77 | 91.9 |
| S187 | BC-22 | 4.33 | 0.50 | 0.99 | 0.59 | 1.25 | 0.54 | 1.88 | 0.83 | 1.04 | 126.2 |
| S188 | BC-22 | 1.56 | 0.50 | 0.68 | 0.33 | 1.25 | 0.36 | 1.42 | 0.96 | 0.76 | 93.4 |
| S189 | BC-22 | 1.70 | 1.00 | 0.84 | 0.33 | 1.25 | 0.44 | 1.72 | 1.04 | 0.91 | 112.2 |
| S190 | BC-23 | 4.11 | 4.50 | 0.78 | 0.23 | 1.25 | 0.45 | 2.11 | 1.30 | 1.23 | 242.9 |
| S191 | BC-23 | 2.28 | 0.50 | 0.85 | 0.29 | 1.25 | 0.35 | 1.71 | 1.34 | 0.85 | 102.5 |
| S192 | BC-23 | 3.11 | 0.50 | 0.99 | 0.43 | 1.25 | 0.57 | 2.67 | 1.78 | 1.11 | 118.2 |
| S193 | BC-23 | 2.67 | 6.00 | 0.90 | 0.37 | 1.25 | 0.42 | 2.24 | 1.59 | 1.34 | 275.2 |
| S194 | BC-23 | 4.44 | 0.50 | 0.89 | 0.46 | 1.25 | 0.58 | 2.47 | 2.01 | 1.16 | 130.8 |
| S195 | BC-23 | 2.39 | 8.00 | 0.97 | 0.32 | 1.25 | 0.48 | 2.11 | 1.53 | 1.36 | 331.9 |
| S196 | BC-23 | 1.11 | 1.38 | 0.84 | 0.43 | 1.25 | 0.41 | 1.94 | 1.03 | 0.93 | 119.0 |
| S197 | BC-23 | 1.33 | 0.50 | 0.73 | 0.37 | 1.25 | 0.44 | 1.62 | 1.11 | 0.81 | 93.0 |
| S198 | BC-23 | 1.00 | 0.50 | 0.78 | 0.37 | 1.25 | 0.36 | 1.59 | 0.72 | 0.72 | 88.9 |
| S199 | BC-23 | 3.78 | 0.50 | 0.85 | 0.36 | 1.25 | 0.44 | 1.64 | 0.88 | 0.91 | 117.5 |
| S200 | BC-24 | 1.56 | 0.50 | 0.86 | 0.34 | 1.25 | 0.42 | 1.80 | 1.30 | 0.85 | 96.4 |
| S201 | BC-24 | 1.72 | 0.50 | 0.86 | 0.38 | 1.25 | 0.48 | 1.90 | 1.56 | 0.92 | 99.3 |
| S202 | BC-24 | 1.83 | 2.00 | 0.80 | 0.28 | 1.25 | 0.44 | 1.33 | 1.46 | 0.98 | 141.6 |
| S203 | BC-24 | 1.56 | 0.50 | 0.72 | 0.41 | 1.25 | 0.36 | 1.60 | 1.06 | 0.80 | 94.9 |
| S204 | BC-24 | 2.17 | 0.50 | 0.84 | 0.41 | 1.25 | 0.48 | 1.76 | 1.41 | 0.93 | 103.0 |
| S205 | BC-24 | 2.00 | 0.50 | 0.79 | 0.41 | 1.25 | 0.43 | 1.95 | 1.53 | 0.92 | 102.0 |
| S206 | BC-24 | 1.33 | 0.50 | 0.85 | 0.32 | 1.25 | 0.41 | 1.66 | 1.08 | 0.80 | 93.1 |
| S207 | BC-24 | 2.67 | 0.50 | 0.74 | 0.45 | 1.25 | 0.38 | 1.85 | 0.78 | 0.86 | 107.3 |
| S208 | BC-24 | 1.89 | 2.00 | 0.75 | 0.29 | 1.25 | 0.34 | 1.52 | 0.97 | 0.92 | 142.1 |
| S209 | BC-25 | 1.39 | 4.00 | 0.64 | 0.14 | 1.25 | 0.31 | 1.00 | 0.54 | 0.75 | 192.9 |
| S210 | BC-25 | 2.33 | 3.50 | 0.90 | 0.28 | 1.25 | 0.46 | 2.03 | 1.33 | 1.15 | 195.3 |
| S211 | BC-25 | 1.89 | 5.00 | 0.89 | 0.24 | 1.25 | 0.41 | 2.10 | 1.21 | 1.12 | 235.6 |
| S212 | BC-25 | 2.00 | 0.50 | 0.86 | 0.32 | 1.25 | 0.36 | 2.35 | 1.31 | 0.89 | 103.2 |
| S213 | BC-25 | 1.50 | 2.00 | 0.97 | 0.35 | 1.25 | 0.43 | 2.02 | 1.18 | 1.03 | 142.1 |
| S214 | BC-25 | 2.11 | 0.50 | 0.96 | 0.54 | 1.25 | 0.47 | 2.82 | 1.18 | 1.01 | 108.4 |
| S215 | BC-25 | 2.78 | 6.00 | 0.82 | 0.36 | 1.25 | 0.43 | 2.06 | 1.28 | 1.28 | 274.9 |
| S216 | BC-25 | 0.94 | 0.50 | 0.95 | 0.37 | 1.25 | 0.41 | 2.01 | 1.40 | 0.83 | 91.7 |
| S217 | BC-25 | 1.78 | 8.00 | 0.82 | 0.41 | 1.25 | 0.40 | 2.15 | 1.04 | 1.24 | 325.3 |
| S218 | BC-25 | 10.3 | 4.50 | 0.87 | 0.41 | 1.25 | 0.69 | 2.45 | 2.29 | 1.73 | 309.6 |
| S219 | BC-25 | 3.00 | 4.50 | 0.91 | 0.43 | 1.25 | 0.48 | 2.28 | 1.46 | 1.34 | 234.3 |
| S220 | BC-25 | 2.50 | 0.50 | 1.21 | 0.39 | 1.25 | 0.48 | 2.04 | 1.08 | 0.97 | 108.1 |
| S221 | BC-25 | 1.56 | 0.50 | 0.81 | 0.34 | 1.25 | 0.29 | 1.57 | 0.98 | 0.77 | 94.1 |
| S222 | BC-25 | 4.78 | 4.50 | 1.02 | 0.40 | 1.25 | 0.75 | 3.13 | 1.51 | 1.58 | 257.7 |
| S223 | BC-26 | 1.28 | 0.50 | 0.73 | 0.16 | 1.25 | 0.46 | 1.06 | 0.67 | 0.64 | 88.3 |
| S224 | BC-26 | 1.44 | 6.00 | 0.84 | 0.23 | 1.25 | 0.52 | 1.74 | 1.20 | 1.11 | 259.8 |
| S225 | BC-26 | 3.00 | 0.50 | 1.00 | 0.37 | 1.25 | 0.62 | 2.14 | 1.59 | 1.05 | 114.3 |
| S226 | BC-26 | 3.78 | 2.00 | 1.01 | 0.41 | 1.25 | 0.72 | 2.27 | 1.87 | 1.36 | 168.7 |
| S227 | BC-26 | 2.33 | 0.50 | 0.87 | 0.21 | 1.25 | 0.60 | 1.81 | 1.88 | 0.93 | 105.0 |
| S228 | BC-26 | 1.31 | 0.50 | 0.75 | 0.36 | 1.25 | 0.44 | 1.80 | 0.88 | 0.79 | 93.4 |
| S229 | BC-26 | 0.83 | 5.00 | 0.86 | 0.32 | 1.25 | 0.52 | 1.39 | 0.79 | 0.98 | 222.0 |
| S230 | BC-26 | 1.33 | 4.50 | 0.75 | 0.32 | 1.25 | 0.50 | 1.41 | 1.02 | 1.03 | 212.0 |
| S231 | BC-26 | 2.06 | 0.50 | 0.83 | 0.24 | 1.25 | 0.56 | 1.48 | 0.91 | 0.81 | 99.5 |
| S232 | BC-26 | 1.22 | 0.50 | 0.72 | 0.29 | 1.25 | 0.48 | 1.43 | 0.95 | 0.75 | 90.6 |
| S233 | BC-27 | 2.39 | 0.50 | 0.78 | 0.23 | 1.25 | 0.38 | 1.72 | 0.86 | 0.79 | 103.0 |
| S234 | BC-27 | 2.28 | 5.50 | 0.86 | 0.29 | 1.25 | 0.40 | 1.88 | 1.20 | 1.17 | 253.6 |
| S235 | BC-27 | 2.39 | 0.50 | 0.83 | 0.34 | 1.25 | 0.42 | 2.14 | 1.37 | 0.92 | 106.4 |
| S236 | BC-27 | 2.00 | 0.50 | 0.80 | 0.31 | 1.25 | 0.36 | 1.71 | 1.09 | 0.82 | 99.6 |
| S237 | BC-27 | 1.61 | 0.50 | 0.77 | 0.28 | 1.25 | 0.26 | 1.30 | 0.57 | 0.67 | 92.4 |
| S238 | BC-27 | 2.28 | 0.50 | 0.72 | 0.46 | 1.25 | 0.38 | 1.56 | 0.82 | 0.83 | 102.0 |
| S239 | BC-27 | 2.89 | 0.50 | 0.74 | 0.31 | 1.25 | 0.30 | 1.30 | 0.70 | 0.76 | 105.6 |
| S240 | BC-27 | 1.83 | 0.50 | 0.72 | 0.30 | 1.25 | 0.35 | 1.59 | 0.73 | 0.75 | 96.7 |
| S241 | BC-27 | 2.39 | 0.50 | 0.82 | 0.39 | 1.25 | 0.34 | 1.64 | 0.62 | 0.80 | 103.0 |
| S242 | BC-27 | 1.50 | 0.50 | 1.05 | 0.44 | 1.25 | 0.31 | 2.06 | 0.38 | 0.75 | 96.5 |
| S243 | BC-27 | 1.22 | 0.50 | 0.79 | 0.37 | 1.25 | 0.28 | 0.66 | 0.35 | 0.59 | 85.7 |
| S244 | BC-27 | 1.11 | 0.50 | 0.59 | 0.30 | 1.25 | 0.17 | 0.66 | 0.35 | 0.52 | 83.3 |
| S245 | BC-27 | 0.50 | 0.50 | 0.61 | 0.20 | 1.25 | 0.19 | 1.53 | 0.30 | 0.49 | 81.1 |
| S246 | BC-27 | 0.89 | 0.50 | 0.55 | 0.25 | 1.25 | 0.19 | 1.70 | 0.32 | 0.55 | 86.0 |
| S247 | BC-27 | 6.94 | 2.00 | 0.92 | 0.59 | 1.25 | 0.51 | 2.19 | 1.17 | 1.37 | 198.9 |
| S248 | BC-27 | 11.4 | 0.50 | 0.98 | 0.48 | 1.25 | 0.69 | 2.11 | 1.58 | 1.29 | 199.4 |
| S249 | BC-27 | 12.2 | 0.50 | 1.11 | 0.67 | 1.25 | 0.78 | 1.64 | 1.76 | 1.38 | 206.7 |
| S250 | BC-27 | 9.06 | 5.50 | 0.97 | 0.60 | 1.25 | 0.64 | 1.46 | 1.26 | 1.60 | 322.3 |
References
- Veselinović, G.; Životić, D.; Penezić, K.; Kašanin-Grubin, M.; Mijatović, N.; Malbasić, J.; Sajnović, A. Geochemical characterization of sediments from the archaeological site Vinča-Belo Brdo, Serbia. Catena 2021, 196, 104914. [Google Scholar] [CrossRef]
- Zhang, S.; Nwaila, G.T.; Bourdeau, J.E.; Ashwal, L.D. Machine learning-based prediction of trace element concentrations using data from the Karoo large igneous province and its application in prospectivity mapping. Artif. Intell. Geosci. 2021, 2, 60–75. [Google Scholar] [CrossRef]
- Pavlović, P.; Kostić, N.; Karadžić, B.; Mitrović, M. The soils of Serbia. In World Soils Book Series; Hartemink, A.E., Ed.; Springer: Berlin/Heidelberg, Germany; Science + Business Media: Dordrecht, The Netherlands, 2017; ISBN 978-94-017-8659-1. [Google Scholar]
- Rashid, A.; Schutte, B.J.; Ulery, A.; Deyholos, M.K.; Sanogo, S.; Lehnhoff, E.A.; Beck, L. Heavy Metal Contamination in Agricultural Soil: Environmental Pollutants Affecting Crop Health. Agronomy 2023, 13, 1521. [Google Scholar] [CrossRef]
- Guo, Z.; Zhang, Y.; Xu, R.; Xie, H.; Xiao, X.; Peng, C. Contamination vertical distribution and key factors identification of metal (loid)s in site soil from an abandoned Pb/Zn smelter using machine learning. Sci. Total Environ. 2023, 856, 159264. [Google Scholar] [CrossRef]
- Haghighizadeh, A.; Rajabi, O.; Nezarat, A.; Hajyani, Z.; Haghmohammadi, M.; Hedayatikhah, S.; Delnabi Asl, S.; Aghababai Beni, A. Comprehensive analysis of heavy metal soil contamination in mining environments: Impacts, monitoring techniques, and remediation strategies. Arab. J. Chem. 2024, 17, 105777. [Google Scholar] [CrossRef]
- Zhu, Y.; Zhu, J.; Wang, B.; Xiao, M.; Li, L. Pollution characteristics and probabilistic health risk of potentially haz-ardous elements in soils near a typical coal mine in Panzhihua City, Southwest China. Environ. Monit. Assess. 2022, 195, 230. [Google Scholar] [CrossRef]
- Wawrzonek, K.; Wątor, K.; Topolewski, M.; Kasprzak, A.; Kmiecik, E. Groundwater Potential in Mining Regions for Drinking Water Supply: A Case Study of the Żelatowa Intake (Chrzanów, Poland). Water Resour. Ind. 2024, 32, 100272. [Google Scholar] [CrossRef]
- Chandra, G.V.; Ghosh, P.K. Groundwater quality in high-sulfur coal mining region of India: Spatial distribution, source control, and health risk assessment. J. Environ. Manag. 2024, 368, 122281. [Google Scholar] [CrossRef]
- Giri, S.; Tiwari, A.K.; Mahato, M.K.; Singh, A.K. Spatio-temporal variations of metals in groundwater from an iron mining impacted area: Assessing sources and human health risk. Total Environ. Res. Themes 2023, 8, 100070. [Google Scholar] [CrossRef]
- Angon, P.B.; Islam, M.S.; Shreejana, K.C.; Das, A.; Anjum, N.; Poudel, A.; Suchi, S.A. Sources, effects and present perspectives of heavy metals contamination: Soil, plants and human food chain. Heliyon 2024, 10, e28357. [Google Scholar] [CrossRef] [PubMed]
- Song, Y.; Yang, Z. Vertical distributions and potential contamination assessment of seldom monitored trace elements in three different land use types of Yellow River Delta. Mar. Pollut. Bull. 2024, 199, 116033. [Google Scholar] [CrossRef] [PubMed]
- Teh, T.L.; Rahman, N.N.N.A.; Shahadat, M.; Wong, Y.S.; Syakir, M.I.; Omar, A.M. A comparative study of metal contamination in soil using the borehole method. Environ. Monit. Assess. 2016, 188, 404. [Google Scholar] [CrossRef] [PubMed]
- Sterckeman, T.; Douay, F.; Proix, N.; Fourrier, H. Vertical distribution of Cd, Pb and Zn in soils near smelters in the North of France. Environ. Pollut. 2000, 107, 377–389. [Google Scholar] [CrossRef]
- Đorđević, D.; Tadić, J.M.; Grgur, B.; Ristić, R.; Sakan, S.; Brezjanović, J.; Stevanović, V.; Šolaja, B. The influence of exploration activities of a potential lithium mine to the environment in Western Serbia. Sci. Rep. 2024, 14, 17090. [Google Scholar] [CrossRef]
- Geological Survey of Serbia. 2021. Potencijalnost Republike Srbije sa Aspekta Podzemnih Voda i Geotermalnih Resursa, Republic of Serbia. Available online: https://www.google.com/url?sa=t&source=web&rct=j&opi=89978449&url=https://www.gzs.gov.rs/doc/Potenc-RS-sa-aspek-podzemnih-voda-i-geotermalnih-resursa-2021-(00000003).pdf&ved=2ahUKEwj507D7hfWIAxXV3wIHHV24FZMQFnoECBcQAQ&usg=AOvVaw1SW3QOIoz0Xejt-5MXpFT0 (accessed on 18 November 2024). (In Serbian)
- Živanović, V.; Joksimović, M.; Golić, R.; Malinić, V.; Krstić, F.; Sedlak, M.; Kovjanić, A. Depopulated and Abandoned Areas in Serbia in the 21st Century—From a Local to a National Problem. Sustainability 2022, 14, 10765. [Google Scholar] [CrossRef]
- Čakmak, D.; Perović, V.; Antić-Mladenović, S.; Kresović, M.; Saljnikov, E.; Mitrović, M.; Pavlović, P. Contamination, risk, and source apportionment of potentially toxic microelements in river sediments and soil after extreme flooding in the Kolubara River catchment in Western Serbia. J. Soils Sediments 2018, 18, 1981–1993. [Google Scholar] [CrossRef]
- Šajn, R.; Aliu, M.; Stafilov, T.; Alijagić, J. Heavy metal contamination of topsoil around a lead and zinc smelter in Kosovska Mitrovica/Mitrovicë, Kosovo/Kosovë. J. Geochem. Explor. 2013, 134, 1–16. [Google Scholar] [CrossRef]
- Antunović, V.; Blagojević, D.; Baošić, R.; Relić, D.; Lolić, A. Health risk assessment of heavy metals in soil, plant, and water samples near “Gacko” power plant, in Bosnia and Herzegovina. Environ. Monit. Assess. 2023, 195, 596. [Google Scholar] [CrossRef]
- Radomirović, M.; Ćirović, Ž.; Maksin, D.; Bakić, T.; Lukić, J.; Stanković, S.; Onjia, A. Ecological risk assessment of heavy metals in the soil at a former painting industry facility. Front. Environ. Sci. 2020, 8, 560415. [Google Scholar] [CrossRef]
- Martinović, M.; Ratkaj, I. Sustainable rural development in Serbia: Towards a quantitative typology of rural areas. Carpath. J. Earth Environ. Sci. 2015, 10, 37–48. [Google Scholar]
- Ranđelović, D.; Mutić, J.; Marjanović, P.; Đorđević, T.; Kašanin-Grubin, M. Geochemical distribution of selected elements in flotation tailings and soils/sediments from the dam spill at the abandoned antimony mine Stolice, Serbia. Environ. Sci. Pollut. Res. 2019, 27, 6253–6268. [Google Scholar] [CrossRef] [PubMed]
- Đukičin, S.; Đorđević, S.; Milanković, J. Spatial and social changes caused by the continuous exploitation of lignite in the Kolubara lignite basin, Serbia. Acta Geogr. Slov. 2014, 54, 77–88. [Google Scholar] [CrossRef]
- Wang, X.; Li, L.; Yan, X.; Meng, X.; Chen, Y. Processes of chromium (VI) migration and transformation in chromate production site: A case study from the middle of China. Chemosphere 2020, 257, 127282. [Google Scholar] [CrossRef]
- Milanović, S.; Stevanović, Z.; Đurić, D.; Petrović, T.; Milovanović, M.; Mandić, M. Karta Ugroženosti Podzemnih Voda Srbije/Map of Groundwater Threats in Serbia. 2011. Available online: https://geoliss.mre.gov.rs/prez/KartaUgrPodVodWeb/index.html (accessed on 4 October 2024). (In Serbian)
- Vasić, M.V.; Pezo, L.; Vasić, M.R.; Mijatović, N.; Mitrić, M.; Radojević, Z. What is the most relevant method for water absorption determination in ceramic tiles produced by illitic-kaolinitic clays? The mystery behind the gresification diagram. Bol. Soc. Esp. Ceram. Vidr. 2022, 61, 241–251. [Google Scholar] [CrossRef]
- The State of Soil Report in the Republic of Serbia. 2016–2017. Available online: https://sepa.gov.rs/wp-content/uploads/2024/10/Zemljiste-2016-2017.pdf (accessed on 11 December 2024).
- Mijatović, N.; Vasić, M.; Miličić, L.; Radomirović, M.; Radojević, Z. Fired pressed pellet as a sample preparation technique of choice for an energy dispersive X-ray fluorescence analysis of raw clays. Talanta 2023, 252, 123844. [Google Scholar] [CrossRef] [PubMed]
- Radomirović, M.; Mijatović, N.; Vasić, M.; Tanaskovski, B.; Mandić, M.; Pezo, L.; Onjia, A. The characterization and pollution status of the surface sediment in the Boka Kotorska Bay, Montenegro. Environ. Sci. Pollut. Res. 2021, 28, 53629–53652. [Google Scholar] [CrossRef] [PubMed]
- Karim, K.N.; Tsikouras, B.; Ifandi, E.; Lai, C.-K.; Osli, L.N.; Shalaby, M.R.; Islam, M.A. Geochemical baselines of potentially toxic elements in Brunei-Muara soils, Brunei Darussalam: Towards environmental assessment and risk management. J. Geochem. Explor. 2024, 257, 107382. [Google Scholar] [CrossRef]
- Wang, C.; Li, W.; Yang, Z.; Chen, Y.; Shao, W.; Ji, J. An invisible soil acidification: Critical role of soil carbonate and its impact on heavy metal bioavailability. Sci. Rep. 2015, 31, 12735. [Google Scholar] [CrossRef] [PubMed]
- Wang, X.-S.; Qin, Y.; Chen, Y.-K. Heavy metals in urban roadside soils. Part 1: Effect of particle size fractions on heavy metals partitioning. Environ. Geol. 2006, 50, 1061–1066. [Google Scholar] [CrossRef]
- Chen, X.; Lewis, S.; Heal, K.V.; Lin, Q.; Sohi, S.P. Biochar engineering and ageing influence the spatiotemporal dynamics of soil pH in the charosphere. Geoderma 2021, 386, 114919. [Google Scholar] [CrossRef]
- Chen, Y.; Hu, C.; Deng, D.; Li, Y.; Luo, L. Factors affecting sorption behaviors of tetracycline to soils: Importance of soil organic carbon, pH and Cd contamination. Ecotoxicol. Environ. Saf. 2020, 197, 110572. [Google Scholar] [CrossRef]
- Kicińska, A.; Pomykała, R.; Izquierdo-Diaz, M. Changes in soil pH and mobility of heavy metals in contaminated soils. Eur. J. Soil Sci. 2022, 73, e13203. [Google Scholar] [CrossRef]
- Răcușan Ghircoiaș, O.; Tănăselia, C.; Chintoanu, M.; Crișan, I.; Hoble, A.; Ștefan, R.; Dîrja, M. Relevance of Soil Heavy Metal XRF Screening for Quality and Landscaping of Public Playgrounds. Toxics 2023, 11, 530. [Google Scholar] [CrossRef]
- Håkanson, L. An ecological risk index for aquatic pollution control. A sedimentological approach. Water Res. 1980, 14, 975–1001. [Google Scholar] [CrossRef]
- Taylor, S.R. Abundance of chemical elements in the continental crust: A new table. Geochim. Cosmochim. Acta 1964, 28, 1273–1285. [Google Scholar] [CrossRef]
- Miletić, A.; Radomirović, M.; Đorđević, Đ.; Bogosavljević, J.; Lučić, M.; Onjia, A. Geospatial mapping of ecological risk from potentially toxic elements in soil in the Pannonian-Carpathian border area south of the Danube. Carpathian J. Earth Environ. Sci. 2022, 17, 351–363. [Google Scholar] [CrossRef]
- Sahoo, P.K.; Equeenuddin, S.M.; Powell, M.A. Trace Elements in Soils around Coal Mines: Current Scenario, Impact and Available Techniques for Management. Curr. Pollut. Rep. 2016, 2, 1–14. [Google Scholar] [CrossRef]
- Aytop, H.; Ateş, Ö.; Dengiz, O.; Yılmaz, C.H.; Demir, Ö.F. Environmental, ecological and health risks of boron in agricultural soils of Amik Plain under Mediterranean conditions. Stoch. Environ. Res. Risk Assess. 2023, 37, 2069–2081. [Google Scholar] [CrossRef]
- Jiang, H.H.; Cai, L.M.; Wen, H.H.; Hu, G.C.; Chen, L.G.; Luo, J. An integrated approach to quan tifying ecological and human health risks from different sources of soil heavy metals. Sci. Total Environ. 2019, 701, 134466. [Google Scholar] [CrossRef] [PubMed]
- Hoang, H.G.; Lin, C.; Chiang, C.F.; Bui, X.T.; Lukkhasorn, W.; Bui, T.P.T.; Tran, H.T.; Vo, T.D.H.; Le, V.G.; Nghiem, L.D. The individual and synergistic indexes for assessments of heavy metal contamination in global rivers and risk: A review. Curr. Poll. Rep. 2021, 7, 247–262. [Google Scholar] [CrossRef]
- Tomlinson, D.L.; Wilson, J.G.; Harris, C.R.; Jefrey, D.W. Problems in the assessment of heavy-metal levels in estuaries and the formation of a pollution index. Helgoländer Meeresunters. 1980, 33, 566–575. [Google Scholar] [CrossRef]
- Carrillo, K.C.; Rodríguez-Romero, A.; Tovar-Sánchez, A.; Ruiz-Gutiérre, G.; Viguri Fuente, J.R. Geochemical baseline establishment, contamination level and ecological risk assessment of metals and As in the Limoncocha lagoon sediments, Ecuadorian Amazon region. J. Soils Sediments 2022, 22, 293–315. [Google Scholar] [CrossRef]
- Starbuck, C. Descriptive Statistics. In The Fundamentals of People Analytics; Springer: Cham, Switzerland, 2023. [Google Scholar] [CrossRef]
- Arsenović, M.; Pezo, L.; Vasić, N.; Ćirić, R.; Stefanović, M. The main factors influencing canine demodicosis treatment outcome and determination of optimal therapy. Parasitol. Res. 2015, 114, 2415–2426. [Google Scholar] [CrossRef]
- Hammam, A.A.; Mohamed, W.S.; Sayed, S.E.-E.; Kucher, D.E.; Mohamed, E.S. Assessment of Soil Contamination Using GIS and Multi-Variate Analysis: A Case Study in El-Minia Governorate, Egypt. Agronomy 2022, 12, 1197. [Google Scholar] [CrossRef]
- Stanković, S.; Tanaskovski, B.; Zlatić, B.; Arsenović, M.; Pezo, L. Analysis of trace elements in surface sediments, mussels, seagrass and seawater along the southeastern Adriatic coast—A chemometric approach. Pure Appl. Chem. 2014, 86, 1111–1127. [Google Scholar] [CrossRef]
- Štrbac, S.; Stojić, N.; Lončar, B.; Pezo, L.; Ćurčić, L.; Prokić, D.; Pucarević, M. Heavy metal concentrations in the soil near illegal landfills in the vicinity of agricultural areas—Artificial neural network approach. J. Soils Sediments 2024, 24, 373–389. [Google Scholar] [CrossRef]
- Official Gazette of the Republic of Serbia. (Službeni glasnik Republike Srbije) The Rule Book on Permitted Quantities of Dangerous and Harmful Substances in Land and Water for Irrigation and Methods of Their Testing (Pravilnik o dozvoljenim količinama opasnih i štetnih materija u zemljištu i vodi za navodnjavanje i metodama njihovog ispitivanja), No. 88/2010. 1994. Available online: http://demo.paragraf.rs/demo/combined/Old/t/t2008_12/t12_0236.htm (accessed on 15 December 2024).
- Official Gazette of the Republic of Serbia. (Službeni glasnik Republike Srbije) Regulation on the Program of Systematic Monitoring of Land Quality, Indicators for Assessing the Risk of Land Degradation and Methodology for the Development of Remediation Programs (Uredba o programu sistemskog praćenja kvaliteta zemljišta, indikatorima za ocenu rizika od degradacije zemljišta i metodologiji za izradu remedijacionih programa), No. 88/2010, In Serbian. 2010. Available online: https://www.paragraf.rs/propisi/uredba-sistematskom-pracenju-stanja-kvaliteta-zemljista.html (accessed on 15 December 2024).
- Official Gazette of the Republic of Serbia. (Službeni glasnik Republike Srbije) Regulation on Limit Values of Pollutants, Harmful and Hazardous Substances in Soil (Uredba o graničnim vrednostima zagađujućih, štetnih i opasnih materija u zemljištu), Official Gazette of Republic of Serbia, No. 30/2018 and No. 64/2019, in Serbian. 2018–2019. Available online: https://www.paragraf.rs/propisi/uredba-granicnim-vrednostima-zagadjujucih-stetnih-opasnih-materija-zemljistu.html (accessed on 15 December 2024).
- Dutch Target and Intervention Values. Circular on Target Values and Intervention Values for Remediation. Dutch Ministry of Housing, Spatial Planning and Environment, Netherlands Government Gazette: 2000. Available online: https://support.esdat.net/Environmental%20Standards/dutch/annexs_i2000dutch%20environmental%20standards.pdf (accessed on 15 December 2024).
- Dugalic, G.; Krstic, D.; Jelic, M.; Nikezic, D.; Milenkovic, B.; Pucarevic, M.; Zeremski-Skoric, T. Heavy metals, organics and radioactivity in soil of western Serbia. J. Haz. Mat. 2010, 177, 697–702. [Google Scholar] [CrossRef] [PubMed]
- Xie, Z.M.; Lu, S.G. Trace elements and environmental quality. In Micronutrients and Biohealth; Wu, Q.L., Ed.; Guizhou Science Technology Press: Guiyang, China, 2007; pp. 208–216. [Google Scholar]
- Manojlović, M.; Ram Singh, B. Trace elements in soils and food chains of the Balkan region. Acta Agric. Scand. B 2012, 62, 8. [Google Scholar] [CrossRef]
- Report on The State of Soil in the Republic of Serbia (Izveštaj o stanju zemjišta u Republici Srbiji). 2018–2019. In Serbian. Available online: https://degradacijazemljista.sepa.gov.rs/?p=1293 (accessed on 15 December 2024).
- Jia, Y.; Yang, X.; Yan, X.; Duguer, W.; Hu, H.; Chen, J. Accumulation, potential risk and source identification of toxic metal elements in soil: A case study of a coal-fired power plant in Western China. Environ. Geochem. Health 2023, 45, 7389–7404. [Google Scholar] [CrossRef] [PubMed]
- Vaněk, A.; Chrastný, V.; Komárek, M.; Galušková, I.; Drahota, P.; Grygar, T.; Tejnecký, V.; Drábek, O. Thallium dynamics in contrasting light sandy soils—Soil vulnerability assessment to anthropogenic contamination. J. Hazard. Mater. 2010, 173, 717–723. [Google Scholar] [CrossRef] [PubMed]
- Jacobson, A.R.; McBride, M.B.; Baveye, P.; Steenhuis, T.S. Environmental factors determining the trace-level sorption of silver and thallium to soils. Sci. Total Environ. 2005, 345, 191–205. [Google Scholar] [CrossRef] [PubMed]
- Xiao, T.; Guha, J.; Boyle, D.; Liu, C.-Q.; Chen, J. Environmental concerns related to high thallium levels in soils and thallium uptake by plants in southwest Guizhou, China. Sci. Total Environ. 2004, 318, 223–244. [Google Scholar] [CrossRef]
- Wnuk, E. Mobility, bioavailability, and toxicity of vanadium regulated by physicochemical and biological properties of the soil. J. Soil Sci. Plant Nutr. 2023, 23, 1386–1396. [Google Scholar] [CrossRef]
- Cappuyns, V. Barium (Ba) leaching from soils and certified reference materials. Appl. Geochem. 2018, 88, 68–84. [Google Scholar] [CrossRef]
- Zhang, Y.; Li, L.; Song, B.; Xu, R.; Zhou, Z.; Zhu, L.; Zhou, L. Comprehensive Risk Assessment of Heavy Metals Based on Pollution Sources: A Case Study for Agricultural Soils from Southwest China. Expo. Health 2024, 1–16. [Google Scholar] [CrossRef]
- Vasić, M.V.; Velasco, P.M.; Mijatović, N.; Radormirović, M.; Radojević, Z. Sustainable approach to raw clays for ceramic and refractory applications: Insights from updated traditional ternary diagrams. Clay Min. 2024, 59, 202–212. [Google Scholar] [CrossRef]
- Stevanović, Z.; Marinović, V.; Merdan, S.; Skopljak, F.; Jolović, B. Conception of Creating Basic Documents in Hydrogeology for River Basin Management Plans. I Kongres Geologa Bosne i Hercegovine, Tuzla. 2015. Available online: https://acrobat.adobe.com/id/urn:aaid:sc:EU:0a53e4a6-a880-4205-95c3-fbb48d2c7558?viewer%21megaVerb=group-discover (accessed on 10 February 2024).

| Borehole | Purpose | Borehole | Purpose |
|---|---|---|---|
| BC-10 | Meadow, class VI | BC-19 | Agricultural field, class VI Meadow, class VI |
| BC-11 | Meadow, class VI | BC-20 | Meadow, class VI |
| BC-12 | Agricultural field, class VI | BC-21 | Meadow, class VI |
| BC-13 | Agricultural field, class VI | BC-22 | Meadow, class VI |
| BC-14 | Agricultural field, class VI | BC-23 | Agricultural field, class VI |
| BC-15 | Meadow, class VI | BC-24 | Agricultural field, class VI |
| BC-16 | Meadow, class VI | BC-25 | Meadow, class VI |
| BC-17 | Agricultural field, class VI | BC-26 | Pasture, class III |
| BC-18 | Agricultural field, class VI | BC-27 | Agricultural field, class VI |
| Indexes | Equations | Description | Pollution Risk Level | References |
|---|---|---|---|---|
| Pollution indexes | ||||
| Contamination factor (CF) | is the pre-industrial value of an element (i); Ci is the content of the element (i) | CF < 1 → Low contamination 1 < CF < 3 → Moderate 3 < CF < 6 → Considerable CF ≥ 6 → Very high | [38,41] | |
| Enrichment factor (EF) | Ci is the content of an element (i); Cref is the content of the reference element (Mn) for geochemical normalization. | EF < 2 → Minimal enrichment 2 ≤ EF < 5 → Moderate 5 ≤ EF < 20 → Significant 20 ≤ EF < 40 → Very high EF ≥ 40 → Extremely high enrichment | [40,42,43] | |
| Pollution load index (PLI) | is the contamination factor value obtained based on the ratio of the measured element concentration and its corresponding reference value [39]; n is the number of analyzed elements (n = 9) | PLI = 0 → No contamination 0 < PLI < 1 → Baseline contamination PLI > 1 → High contamination | [41,44,45] | |
| Ecological risk indexes | ||||
| Ecological risk factor (Er) | is the toxicity response coefficient of element (i) (As = 10; Cd = 30; Cr = 2; Cu = 5; Hg = 40; Ni = Pb = 5; Zn = 1); denotes the contamination factor of the individual element (i) | Er < 40 → Low potential ecological risk 40 ≤ Er < 80 → Moderate 80 ≤ Er < 160 → Considerable 160 ≤ Er < 320 → High Er ≥ 320 → Very high potential ecological risk | [38] | |
| Potential ecological risk index (RI) | ) is the potential ecological risk factor of a single element (i) (n) is the number of studied elements (n = 8 in this study); RI is the index of potential ecological risk parameters of all toxic elements | RI < 150 → Low ecological risk 150 ≤ RI < 300 → Moderate 300 ≤ RI < 600 → Considerable RI ≥ 600 → Very high ecological risk | [38,41,45] | |
| SiO2 | Al2O3 | Fe2O3 | CaO | MgO | Na2O | K2O | P2O5 | SO3 | TiO2 | RS 1 | CCC | TOC | Layer Thickness (m) | |
|---|---|---|---|---|---|---|---|---|---|---|---|---|---|---|
| Minimum | 60.93 | 15.99 | 0.86 | 0.06 | 1.02 | 0.17 | 1.87 | 0.03 | 0.01 | 0.18 | 0.96 | 0.00 | 0.00 | 0.30 |
| Maximum | 79.19 | 28.11 | 6.65 | 1.21 | 3.88 | 0.98 | 4.56 | 0.29 | 0.08 | 0.37 | 58.52 | 1.20 | 1.20 | 3.00 |
| Average | 69.58 | 23.30 | 1.77 | 0.21 | 1.53 | 0.32 | 3.24 | 0.07 | 0.02 | 0.27 | 22.97 | 0.03 | 0.03 | 1.68 |
| StDev 1 | 2.28 | 1.68 | 0.81 | 0.10 | 0.29 | 0.10 | 0.40 | 0.04 | 0.01 | 0.03 | 9.93 | 0.12 | 0.12 | 0.51 |
| Skewness | 0.10 | −0.20 | 2.90 | 5.20 | 5.50 | 2.4 | 0.10 | 2.90 | 2.3 | 0.20 | 0.20 | 5.80 | 1.0 | −0.50 |
| Median | 69.64 | 23.23 | 1.51 | 0.20 | 1.51 | 0.30 | 3.24 | 0.06 | 0.01 | 0.27 | 23.27 | 0.00 | 0.10 | 1.85 |
| As | Ba | Cd | Co | Cr | Cu | Hg | Ni | Pb | Sb | Se | Tl | V | Zn | |
|---|---|---|---|---|---|---|---|---|---|---|---|---|---|---|
| Minimum | 0.90 | 40.00 | 0.10 | 0.50 | 51.90 | 7.00 | 0.10 | 13.10 | 0.15 | 0.20 | 0.10 | 0.80 | 58.30 | 21.20 |
| Maximum | 22.00 | 995.00 | 1.60 | 44.93 | 150.30 | 37.00 | 1.20 | 155.30 | 39.40 | 4.90 | 0.75 | 2.50 | 177.50 | 224.30 |
| Average | 4.02 | 525.64 | 0.28 | 4.64 | 78.63 | 18.11 | 0.11 | 31.41 | 21.69 | 1.61 | 0.41 | 1.34 | 107.03 | 74.38 |
| StDev * | 2.83 | 113.22 | 0.33 | 7.61 | 11.90 | 5.26 | 0.08 | 11.62 | 5.11 | 1.19 | 0.16 | 0.27 | 18.66 | 31.68 |
| MAC agric [48] | 25 | / | 3 | / | 100 | 100 | 2.00 | 50 | 100 | / | / | / | / | 300 |
| MAC soil [52,54] | 29 | 160 | 0.8 | 9 | 100 | 36 | 0.30 | 35 | 85 | 3 | 0.7 | 1 | 42 | 140 |
| Remediation value [52,54] | 55 | 625 | 12 | 240 | 380 | 190 | 10.00 | 210 | 530 | 15 | 100 | 15 | 250 | 720 |
| Hammam et al., 2022 [49] | / | / | 0.88 | 28.62 | 82.63 | 51.57 | / | / | 31.54 | / | / | / | / | 93.91 |
| Skewness | 3.70 | 0.90 | 2.00 | 2.30 | 1.50 | 0.30 | 11.7 | 5.10 | 0.20 | 0.40 | −1.20 | 1.10 | 0.70 | 1.10 |
| Median | 3.40 | 502.9 | 0.10 | 0.50 | 76.55 | 18.05 | 0.10 | 30.25 | 21.30 | 1.45 | 0.50 | 1.30 | 105.65 | 69.95 |
| V | Cr | Co | Ni | Cu | As | Se | Cd | Sb | Pb | Tl | Zn | Ba | |||
|---|---|---|---|---|---|---|---|---|---|---|---|---|---|---|---|
| Sort (µg/g) | % | % | % | % | % | % | % | % | % | % | % | Sort (µg/g) | % | Sort (µg/g) | % |
| 0–20 | 0.4 | 0.4 | 93.8 | 10.2 | 64.4 | 98.0 | 99.2 | 99.2 | 99.2 | 40.2 | 100.0 | 0–50 | 21.5 | 0–200 | 1.6 |
| 20–40 | 0.0 | 0.0 | 4.7 | 75.0 | 34.8 | 1.2 | 0.0 | 0.0 | 0.0 | 59.0 | / | 50–100 | 59.8 | 200–400 | 5.9 |
| 40–60 | 0.8 | 4.3 | 0.8 | 13.3 | 0.0 | 0.0 | 0.0 | 0.0 | 0.0 | 0.0 | / | 100–150 | 15.6 | 400–600 | 71.1 |
| 60–80 | 3.9 | 55.8 | 0.0 | 0.0 | 0.0 | 0.0 | 0.0 | 0.0 | 0.0 | 0.0 | / | 150–200 | 2.0 | 600–800 | 18.0 |
| 80–100 | 31.6 | 34.0 | 0.0 | 0.0 | 0.0 | 0.0 | 0.0 | 0.0 | 0.0 | 0.0 | / | 200–250 | 0.8 | 800–1000 | 3.1 |
| 100–120 | 44.1 | 3.5 | 0.4 | 0.4 | 0.4 | 0.4 | 0.4 | 0.4 | 0.4 | 0.4 | / | / | / | / | / |
| 120–140 | 13.3 | 0.8 | 0.0 | 0.0 | 0.0 | / | / | / | / | / | / | / | / | / | / |
| 140–160 | 3.9 | 0.8 | 0.0 | 0.8 | 0.0 | / | / | / | / | / | / | / | / | / | / |
| 160–180 | 1.6 | / | / | / | / | / | / | / | / | / | / | / | / | / | / |
| EF | As | Cd | Cr | Cu | Hg | Ni | Pb | Zn |
|---|---|---|---|---|---|---|---|---|
| Minimum | 1.85 | 0.71 | 0.83 | 0.46 | 1.07 | 0.40 | 0.20 | 0.67 |
| Maximum | 212.7 | 152.1 | 39.7 | 15.3 | 247.4 | 39.7 | 111.3 | 61.4 |
| Average | 36.3 | 21.7 | 13.2 | 5.42 | 22.6 | 6.95 | 29.1 | 17.7 |
| SiO2 | V | Ba | Cr | Pb | Th | Tl | Al2O3 | |
|---|---|---|---|---|---|---|---|---|
| Loadings | 0.78 | −0.84 | −0.73 | −0.72 | −0.72 | −0.72 | −0.70 | −0.55 |
Disclaimer/Publisher’s Note: The statements, opinions and data contained in all publications are solely those of the individual author(s) and contributor(s) and not of MDPI and/or the editor(s). MDPI and/or the editor(s) disclaim responsibility for any injury to people or property resulting from any ideas, methods, instructions or products referred to in the content. |
© 2024 by the authors. Licensee MDPI, Basel, Switzerland. This article is an open access article distributed under the terms and conditions of the Creative Commons Attribution (CC BY) license (https://creativecommons.org/licenses/by/4.0/).
Share and Cite
Vasić, M.V.; Radomirović, M.; Velasco, P.M.; Mijatović, N. Geochemical Profiles of Deep Sediment Layers from the Kolubara District (Western Serbia): Contamination Status and Associated Risks of Heavy Metals. Agronomy 2024, 14, 3009. https://doi.org/10.3390/agronomy14123009
Vasić MV, Radomirović M, Velasco PM, Mijatović N. Geochemical Profiles of Deep Sediment Layers from the Kolubara District (Western Serbia): Contamination Status and Associated Risks of Heavy Metals. Agronomy. 2024; 14(12):3009. https://doi.org/10.3390/agronomy14123009
Chicago/Turabian StyleVasić, Milica Vidak, Milena Radomirović, Pedro M. Velasco, and Nevenka Mijatović. 2024. "Geochemical Profiles of Deep Sediment Layers from the Kolubara District (Western Serbia): Contamination Status and Associated Risks of Heavy Metals" Agronomy 14, no. 12: 3009. https://doi.org/10.3390/agronomy14123009
APA StyleVasić, M. V., Radomirović, M., Velasco, P. M., & Mijatović, N. (2024). Geochemical Profiles of Deep Sediment Layers from the Kolubara District (Western Serbia): Contamination Status and Associated Risks of Heavy Metals. Agronomy, 14(12), 3009. https://doi.org/10.3390/agronomy14123009