Article

Soil Greenhouse Gas Emissions and Nitrogen Dynamics: Effects of Maize Straw Incorporation Under Contrasting Nitrogen Fertilization Levels

1
College of Agronomy, Shenyang Agricultural University, Shenyang 100866, China
2
College of Agronomy and Biotechnology, China Agricultural University, Beijing 100091, China
3
Farming and Animal Husbandry Bureau of Tongliao, Tongliao 028005, China
*
Author to whom correspondence should be addressed.
These authors contributed equally to this work.
Agronomy 2024, 14(12), 2996; https://doi.org/10.3390/agronomy14122996
Submission received: 2 November 2024 / Revised: 9 December 2024 / Accepted: 12 December 2024 / Published: 16 December 2024

Abstract

:
Straw is widely incorporated into conservation agriculture around the world. However, its effects on greenhouse gas emissions (GHGs) and nitrogen dynamics under soils formed by the long-term application of different amounts of nitrogen (N) fertilizer are still unclear. An incubation experiment was conducted on soils collected from a field study after 6 years of contrasting N fertilization of 0 (low N), 187 (medium N), and 337 kg N ha−1 (high N), with and without maize straw. Straw amendment significantly stimulated both nitrous oxide (N2O) and carbon dioxide (CO2) fluxes (p < 0.05), and increased cumulative emissions by 0.8 and 19.0 times on average compared to those without straw incorporation. Medium-N soil observably weakened N2O emissions (23.8 μg kg−1) compared to high-N soil (162.7 μg kg−1), and increased CO2 emissions (1.9 g kg−1) compared to low-N soils (2.3 g kg−1) with straw amendment. Soil NH4+-N and NO3-N invariably increased with rising soil N level, whereas straw promoted the turnover of mineral N by enhancing soil N fixation capacity. From the first day until the end of incubation, NH4+-N decreased by 79.0% and 24.7%, while NO3-N showed a decrease of 58.8% or an increase of 75.2%, depending on whether straw was amended or not, respectively. Moreover, partial least squares path modeling and random forest mean predictor importance were used to find that straw affected GHGs by altering the N turnover capacity. Straw amendment increased GHGs and diminished the risk of losing mineral N by enhancing its turnover. Combining straw with medium-N soil could mitigate the greenhouse effect and improve the N and carbon (C) balance in farming systems compared to low- and high-N soils. This is recommended as a farmland management strategy in Northeast China.

1. Introduction

Approximately 3.8 billion t of crop straw resources are produced from agricultural systems each year across the world [1]. China is situated in the Golden Corn Belt, with 43.1 million ha of land dedicated to maize cultivation, accounting for 63.2% of Asia (68.2 million ha) and 21.2% of the world (203.5 million ha) [2]. Additionally, China has become a crucial contributor and has taken possession of nearly one quarter of the world’s straw wealth [3,4]. Straw incorporation is an accepted practice worldwide that could augment soil organic matter (SOM) and improve soil structure and physicochemical properties, instead of removing or burning them in the field [5,6]. Nevertheless, there is great concern that crop straw would strengthen both the biomass and activity of microorganisms related to soil C and N cycles [7], thus profoundly influencing GHG emissions from soils, especially N2O and CO2 in dryland agroecosystems [8]. This is because straw contains labile organic matter that can provide not only a lot of C, but also N for microorganisms after decomposition by entering soil [9,10]. Furthermore, exogenous N input is required to promote straw degradation after it is returned to the field due to its higher C:N ratio, and N fertilizer management might be the key to the conversion of soil C and N, which is intimately related to GHGs [3]. Hence, understanding the impact of straw amendment on GHGs and exploring appropriate management strategies to reduce GHGs in straw-amended soils would help to mitigate climate change and retain C and N in the soil.
Although previous studies have widely reported the impact of straw amendment on soil GHGs, the results are still in dispute. Specifically, while CO2 emissions have been shown to increase, emissions of N2O and CH4 have exhibited variability, acting as either sources or sinks depending on the type of land used (paddy versus upland) following straw incorporation [9,11,12]. The release of N2O from dryland soil in particular occupies nearly 60% of total contrived N2O emissions [13]. Different results have been reported from drylands with positive [14,15], mixed [11,16], and/or negative [17] effects of straw amendment on N2O emissions. These varying responses might depend on mineral N availability in these soils, and a series of microbial processes of soil N cycling devoted to N2O emissions, in which nitrification and denitrification are the dominant processes influencing N2O emission [18]. Ammonium (NH4+-N) and nitrate (NO3-N), as the primary forms of mineral N in soil, work as substrates of these microbial processes, and their available amounts determine the respective rates of nitrification and denitrification, finally affecting N2O emission in agroecosystems [19,20].
On the other hand, SOM mineralization and CO2 emissions in response to soil high-N availability tend to increase in fertile soils, but decline in poor soils [21]. Microbial N mining occurs in N-deficient soils; that is, low N availability causes microorganisms to accelerate the decomposition of SOM to produce a N source, so N availability will influence CO2 emission via microbial respiration and SOM decomposition after straw incorporation as an organic C substrate [22]. Wang et al. (2015) [23] and Ma et al. (2021) [24] reported that straw incorporation boosted microbial heterotrophic respiration and GHGs by increasing the abundance and activity of microbial and substrate effectiveness. A study on the effects of straw incorporation on reducing GHGs was carried out by Htun et al. [25]. The characteristics of mineral N dynamics in soil after straw amendment should be investigated to understand how straw amendment impacts GHGs in soils with distinctive fertility levels.
Globally, N fertilizer has been applied for agricultural production to improve crop yields [26]. It is well documented that N2O emissions increase with increasing N levels applied within limits due to the effect of mineral N contents, whether in the form of NH4+-N or NO3-N [27,28,29]. However, long-term contrasting N application could directly cause a difference in soil mineral N levels, indirectly influence soil physical and biochemical properties, and even alter microbial community composition and modify the capacity for soil N turnover [30]. These factors are essentially related to N2O and CO2 emissions, resulting in soil C and N loss [20,22,29]. Instead, long-term (≥5 years) straw return contributes to the net augmentation of soil organic N and sustains soil organic C pools [31], mitigates N2O flux, and increases CH4 sequestration in soil, which causes the farmland ecosystem to become a net sink of GHGs [4,25]. Currently, the N turnover capacity and the trade-off of soil C and N are still unclear under straw amendment; identifying them is key for elucidating how long-term N management will influence soil mineral N dynamics, soil C and N balance, and GHGs, particularly under straw incorporation conditions.
In this study, an incubation experiment was carried out with/without straw amendment using soils from a field with a 6-year application of contrasting levels of N fertilizer [32]. The main objectives were to (1) determine the effect of straw amendment on the GHGs of soils with different N levels; (2) to evaluate the influence of straw amendment and N level on soil labile N dynamics and N turnover capacity; and (3) to assess the heterogeneity of the trade-off of N and C in soils with various N levels brought by long-term divergent N level supplementation in the field with straw incorporation.

2. Materials and Methods

2.1. Material Acquisition and Implementation of Experiment

An in situ field experiment with medium-maturity maize, (Zea mays L.) Zhengdan 958, planted with and without straw incorporation and under contrasting N rates was established from 2015 at Tieling experimental station (40°29′ N, 124°16′ E), Liaoning Province, China. The annual mean temperature and precipitation during the growing period (from May to September) were 20.9 °C and 543.0 mm (20-year average, from 1994 to 2014), respectively. The soil properties (0–20 cm) before the experiment were as follows: organic matter 15.7 g kg−1, total N 1.2 g kg−1, olsen P 25.7 mg kg−1, available K 29.3 mg kg−1, and pH 5.6. A more detailed description of the experimental treatment and field management can be seen in our previous study [32].
Five soil samples (0–30 cm) were randomly collected from plots with no N (low-N soil, LN), 187 kg N ha−1 (medium-N soil, MN), and 337 kg N ha−1 (high-N soil, HN) of fertilizer applied using a soil auger (5 cm internal diameter) to obtain a compounded sample for each plot in June 2020, when the nominated nitrifiers and nitrification processes were activated [33]. The definitions of low-, medium-, and high-N soils were in accordance with the N nutrient content of the experimental soil, which is shown in Table 1. Then, the compounded samples were passed through a 2 mm sieve to remove stones and plant residues, immediately taken to the lab in a portable icebox and stored at 4 °C to prepare for the incubation experiment. Oven-dried maize straw ground with a mill was used for the incubation experiment.
The maize straw used in this study was homogeneous, with a total carbon (TC) content of 420.8 g kg−1, TN content of 11.6 g kg−1, and C:N of 36.4 (Table 1). The LN, MN, and HN soils had 9.3, 10.6, and 15.5 TC (g kg−1), 0.9, 1.0, and 1.2 TN (g kg−1), and 9.9, 10.2, and 12.7 C:N, respectively (Table 1). There was a significant difference between MN and HN compared to LN. As for the mineral N content of the experimental soils, the NH4+-N contents (mg kg−1) were 11.3, 15.1, and 28.9, the NO3-N contents (mg kg−1) were 8.3, 9.7, and 39.7, and the NH4+-N:NO3-N was 1.4, 1.6, and 0.7 in LN, MN, and HN, respectively. The contents of NH4+-N and NO3-N significantly increased with the increasing addition of N fertilizer; the highest NH4+-N:NO3-N was observed in MN (Table 1, p < 0.05).
In this incubation experiment, three contrasting soil fertility levels were treated with straw amendment (LN+S, MN+S, and HN+S) or without straw amendment (LN, MN, and HN), resulting in a total of six treatments, each with 33 replications. Two sets of 250 mL triangular flasks were filled with fresh soil (30 g on an oven-dry basis) for each treatment. The first group was subjected to gas sampling, and the other group destructive soil sampling, from day 1 to day 10 of incubation, with three replicates daily. After 24 h pre-incubation at 25 °C in darkness, 0.6 g straw (2% w/w) was added into LN+S, MN+S, and HN+S treatments and mixed thoroughly; 2 mL (NH4)2SO4-N solution containing 1.5 mg N was added into each flask (equivalent to 225 kg N ha−1 applied to the field), then adjusted to 65% water holding capacity with distilled water. All flasks were incubated in the same surroundings with a permeable plastic film to ensure an aerobic environment, and a large amount of water was supplied every day using the gravimetric method [34].

2.2. Gas Sampling and Measurements

From day 1 to day 10 of incubation, airtight rubber seals with a pipe and tee valve were used to seal the flasks of the first group to maintain airtightness. A syringe was used to collect gas samples; 20 mL of fresh air was added into each flask to maintain the pressure before gas sampling, and an equal volume of gas was released before and after an extra 6 h of incubation, then injected into a pre-prepared 20 mL gas bag immediately to measure the GHG concentration with a gas chromatograph (Agilent 7890b, Agilent Technologies, Santa Clara, USA). The fluxes of N2O-N (ng N2O-N kg−1 dry soil h−1), CO2-C (mg CO2-C kg−1 dry soil h−1), and CH4-C (μg CH4-C kg−1 dry soil h−1) were calculated from the increase in concentration in headspace during the extra incubation for each treatment following Equation (1), modified from Kelliher et al. [35]:
F = M V m × C t × V m × 273.15 273.15 + T × 28 44 o r 12 44 o r 12 16
where F is the fluxes of N2O-N or CO2-C or CH4-C; M is the molar mass of N2O and CO2 or CH4 (44 g mol−1 or 16 g mol−1); V m is the molar volume of gas under standard conditions (22.4 L mol−1 at 0 °C and 101.325 KPa); C t is the change in gas concentration with time; V is the headspace volume of the closed bottle (3 × 10⁻⁴ m3); m is the weight of oven-dry soil (30 g); T is the temperature of incubation (25 °C); 28 44 , 12 44 , and 12 16 are the conversion coefficient of N2O to N2O-N, CO2 to CO2-C, and CH4 to CH4-C, respectively. The absolute value of CH4-C flux was adopted as the CH4-C uptake flux due to the negative value throughout the incubation period.
Because the fluxes measured in our study were based on hours, the daily accumulative emissions of N2O-N (μg kg−1), CO2-C (g kg−1), and CH4-C (μg kg−1) were determined as products between the fluxes and 24 for each treatment following Equation (2):
C = i = 1 n i F × 24
where C is the accumulative N2O-N or CO2-C or CH4-C emissions; F is the flux of N2O-N or CO2-C or CH4-C; n i is the total number of sampling times during the incubation time; and 24 is the number of hours in a day.
The GWP (global warming potential, mg CO2-C eq kg−1 dry soil) after 10-day incubation was calculated for each treatment following Equation (3) [36]:
G W P = C O 2 × 1 + C H 4 × 27 + N 2 O × 273
where C O 2 ,   C H 4 , and N 2 O are the individual accumulative emissions of the 10-day incubation; 1, 27, and 273 are the conversion factors of eq CO2-C emissions [37].

2.3. Soil Sampling and Measurements

Soil organic carbon (SOC) and TN content were determined by using an Elemental Analyzer (EuroVector EA3000, EuroVector S.p.A, Milan, Italy), because SOC content is approximately equal to soil total carbon content under weakly acidic conditions [38] (Figure S1d). Soil NH4+-N and NO3-N concentrations were measured from the beginning to the end of incubation by quantifying the extract from fresh soil with 2M KCl solution on a continuous-flow injection analyzer (Smartchem200, Alliance, Paris, France). Soil microbial biomass N (SMBN) was measured by calculating the difference in nitrogen content between fumigation and non-fumigation soil extraction from a 0.5M K2SO4 solution and converted by the coefficient 0.54 of KEN [39]. Soil net ammonification rate, net nitrification rate, net N mineralization rate (conversion capacity between organic and mineral N), and nitrification potential (potential transformation from NH4+-N to NO3-N) were measured after 0 (initial), 1, 4, 7, and 10 (end) days of incubation. The former was determined by calculating the change in NH4+-N, NO3-N, and NH4+-N+NO3-N before and after incubation at 25 °C in darkness for 7 days. The latter was determined by calculating the change in NO3-N during the shaken soil-slurry method of incubation at 180 rpm for 24 h in darkness [40]. The nitrogen turnover rate, reflecting potential soil N availability, was evaluated as the ratio of N mineralization rate to soil N content according to Li et al. [41]. NH4+-N:NO3-N content was expressed by calculating the quotient of NH4+-N over NO3-N concentration.

2.4. Data Management and Analysis

All data were entered into Microsoft Excel 2019 (Microsoft, Redmond, DC, USA) and statistically analyzed by using SPSS (SPSS 24.0, SPSS Institute, Armonk, NY, USA). The differences between treatment factors and their interaction were evaluated using analysis of variance (ANOVA) and Duncan’s multiple range test at p < 0.05. The normality of residuals and the equality of variances between treatments were tested during standard statistical analysis procedures. The means of treatments were compared using the least significant difference (LSD) test at p < 0.05. The linear and quadratic effects were evaluated when significant associations between accumulative GHG emission dynamics and incubation time were detected. Partial least squares path modeling (PLS-PM) and random forest models (RFMs) were adopted to disentangle the possible pathways of the effects of soil properties on GHGs and carried out to evaluate the relative importance of soil properties on N2O-N, CO2-C, and CH4-C emissions using R 4.1.3 (R Core Team, 2022, Vienna, Austria). Redundancy analysis (RDA) was conducted to verify the relationship between soil properties (explanatory variables) and greenhouse gas emissions (response variables) using Canoco (Canoco 4.5, Microsoft, Ithaca, NY, USA). All figures were drawn using Origin (Origin 2021, Originlab, Northampton, MA, USA) and PowerPoint 2019 (Microsoft, Redmond, DC, USA) software.

3. Results

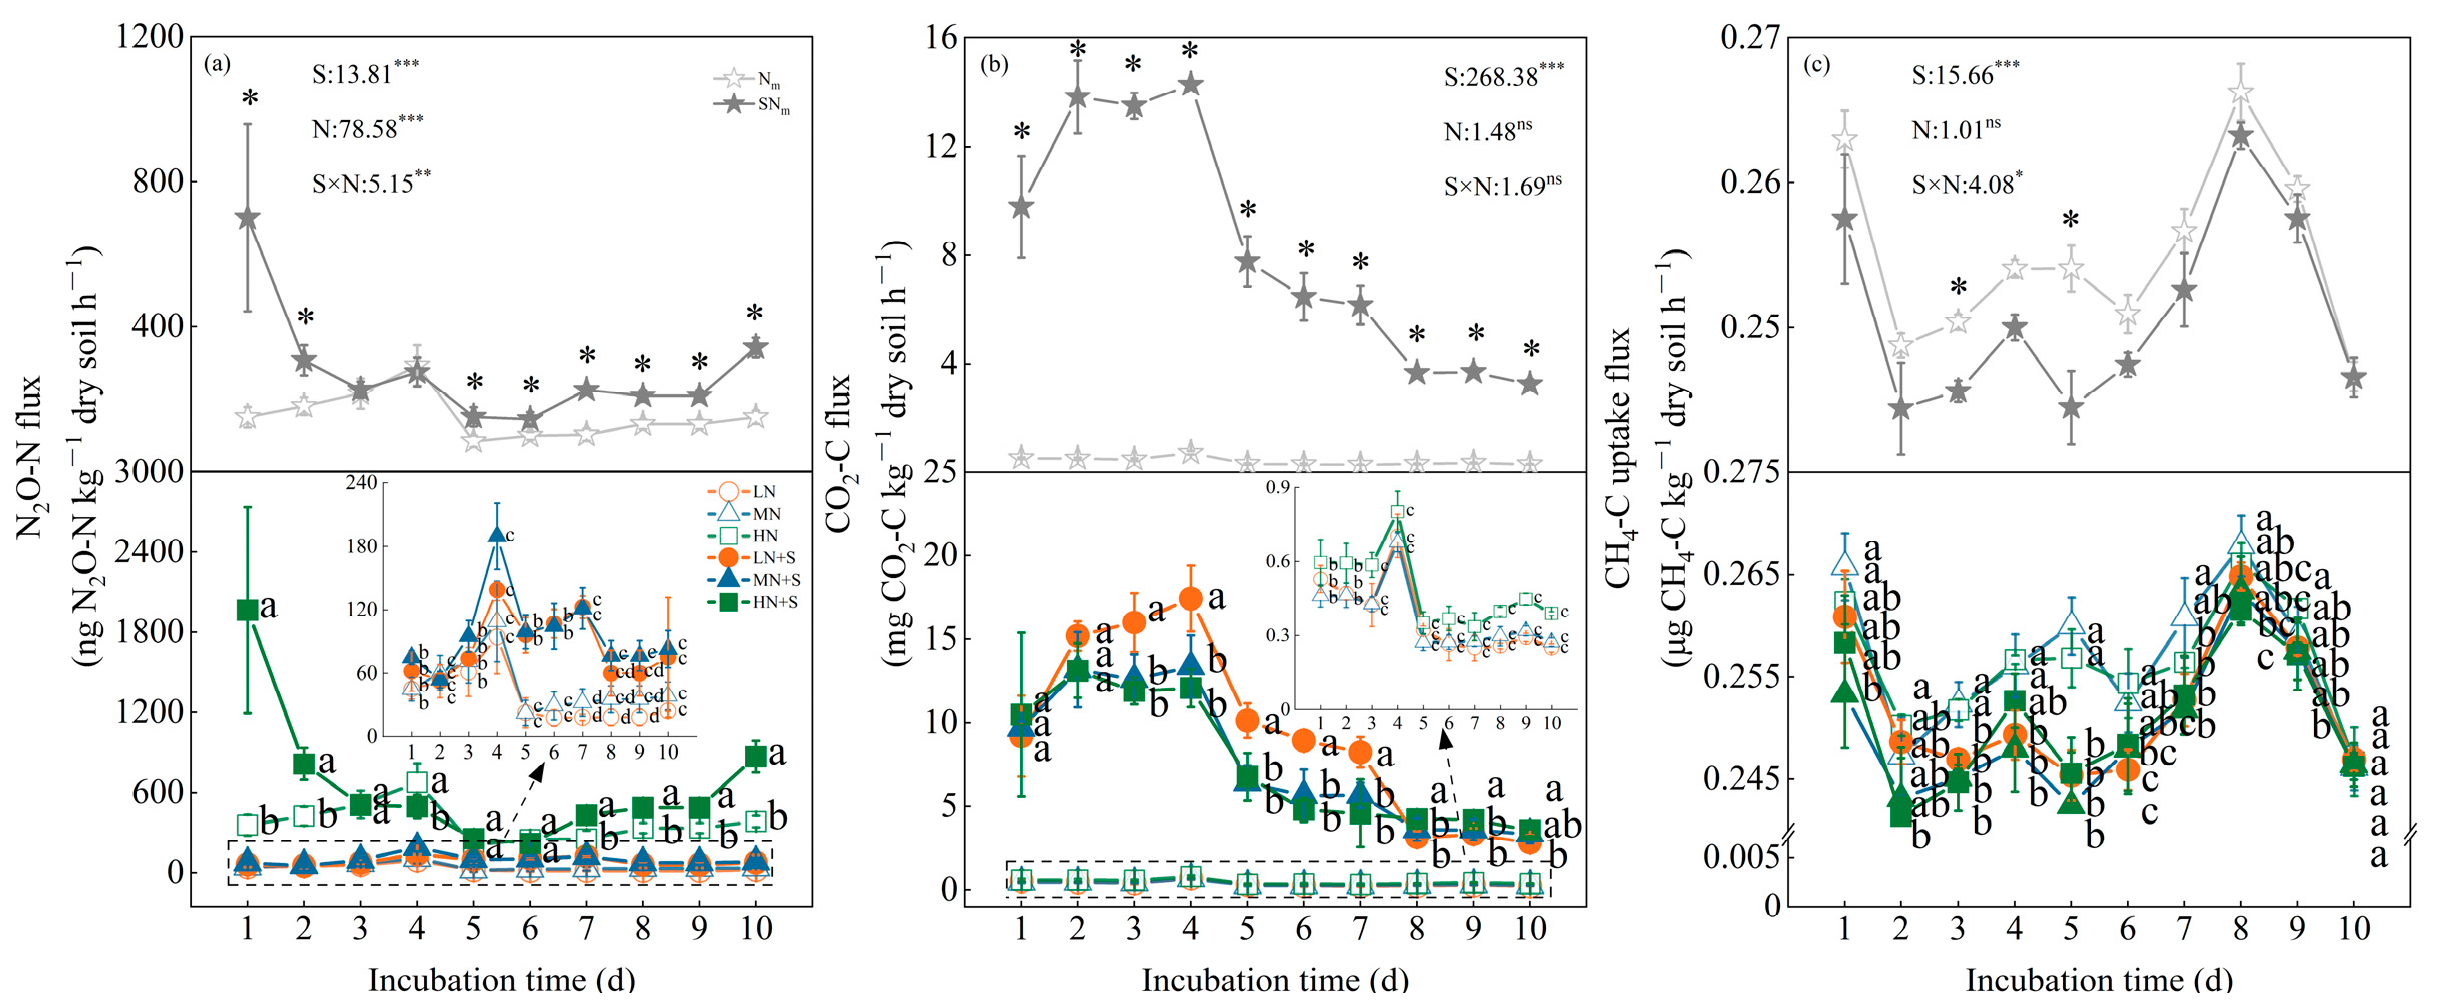
3.1. Greenhouse Gas Flux Dynamic Depends on N Fertilization and Straw Incorporation

Straw amendment significantly stimulated greenhouse gas fluxes, while soil N levels and their interaction significantly affected N2O-N fluxes (Figure 1a–c). HN+S immediately reached a peak value (1967.0 ng N2O-N kg−1 h−1) of N2O-N flux at the first day, and other treatments achieved a peak value around the fourth day of incubation, first increasing, then decreasing, and fluctuating gradually after that. There were significantly higher values under high-N conditions than other N treatments regardless of straw amendment throughout the incubation period. Straw amendment strengthened the maximum value of N2O-N flux by 47.7%, 74.1%, and 190.3% with the improvement of soil N level relative to those without, respectively (Figure 1a).
CO2-C flux was observed to increase in the first four days of incubation and decrease afterwards, as with N2O-N flux. The highest value (17.4 mg CO2-C kg−1 h−1) was observed under the LN+S treatment (Figure 1b). Notably, treatments in the presence of straw increased CO2-C flux, giving values approximately 20-fold higher than those under straw removal treatments. A nearly opposite trend of CO2-C flux appeared among low, medium, and high N circumstances in the absence and presence of straw. CH4-C flux was negative during the whole incubation period, which implies the emergence of a carbon sink. This was clearly increased by straw removal compared with straw amendment (Figure 1c).

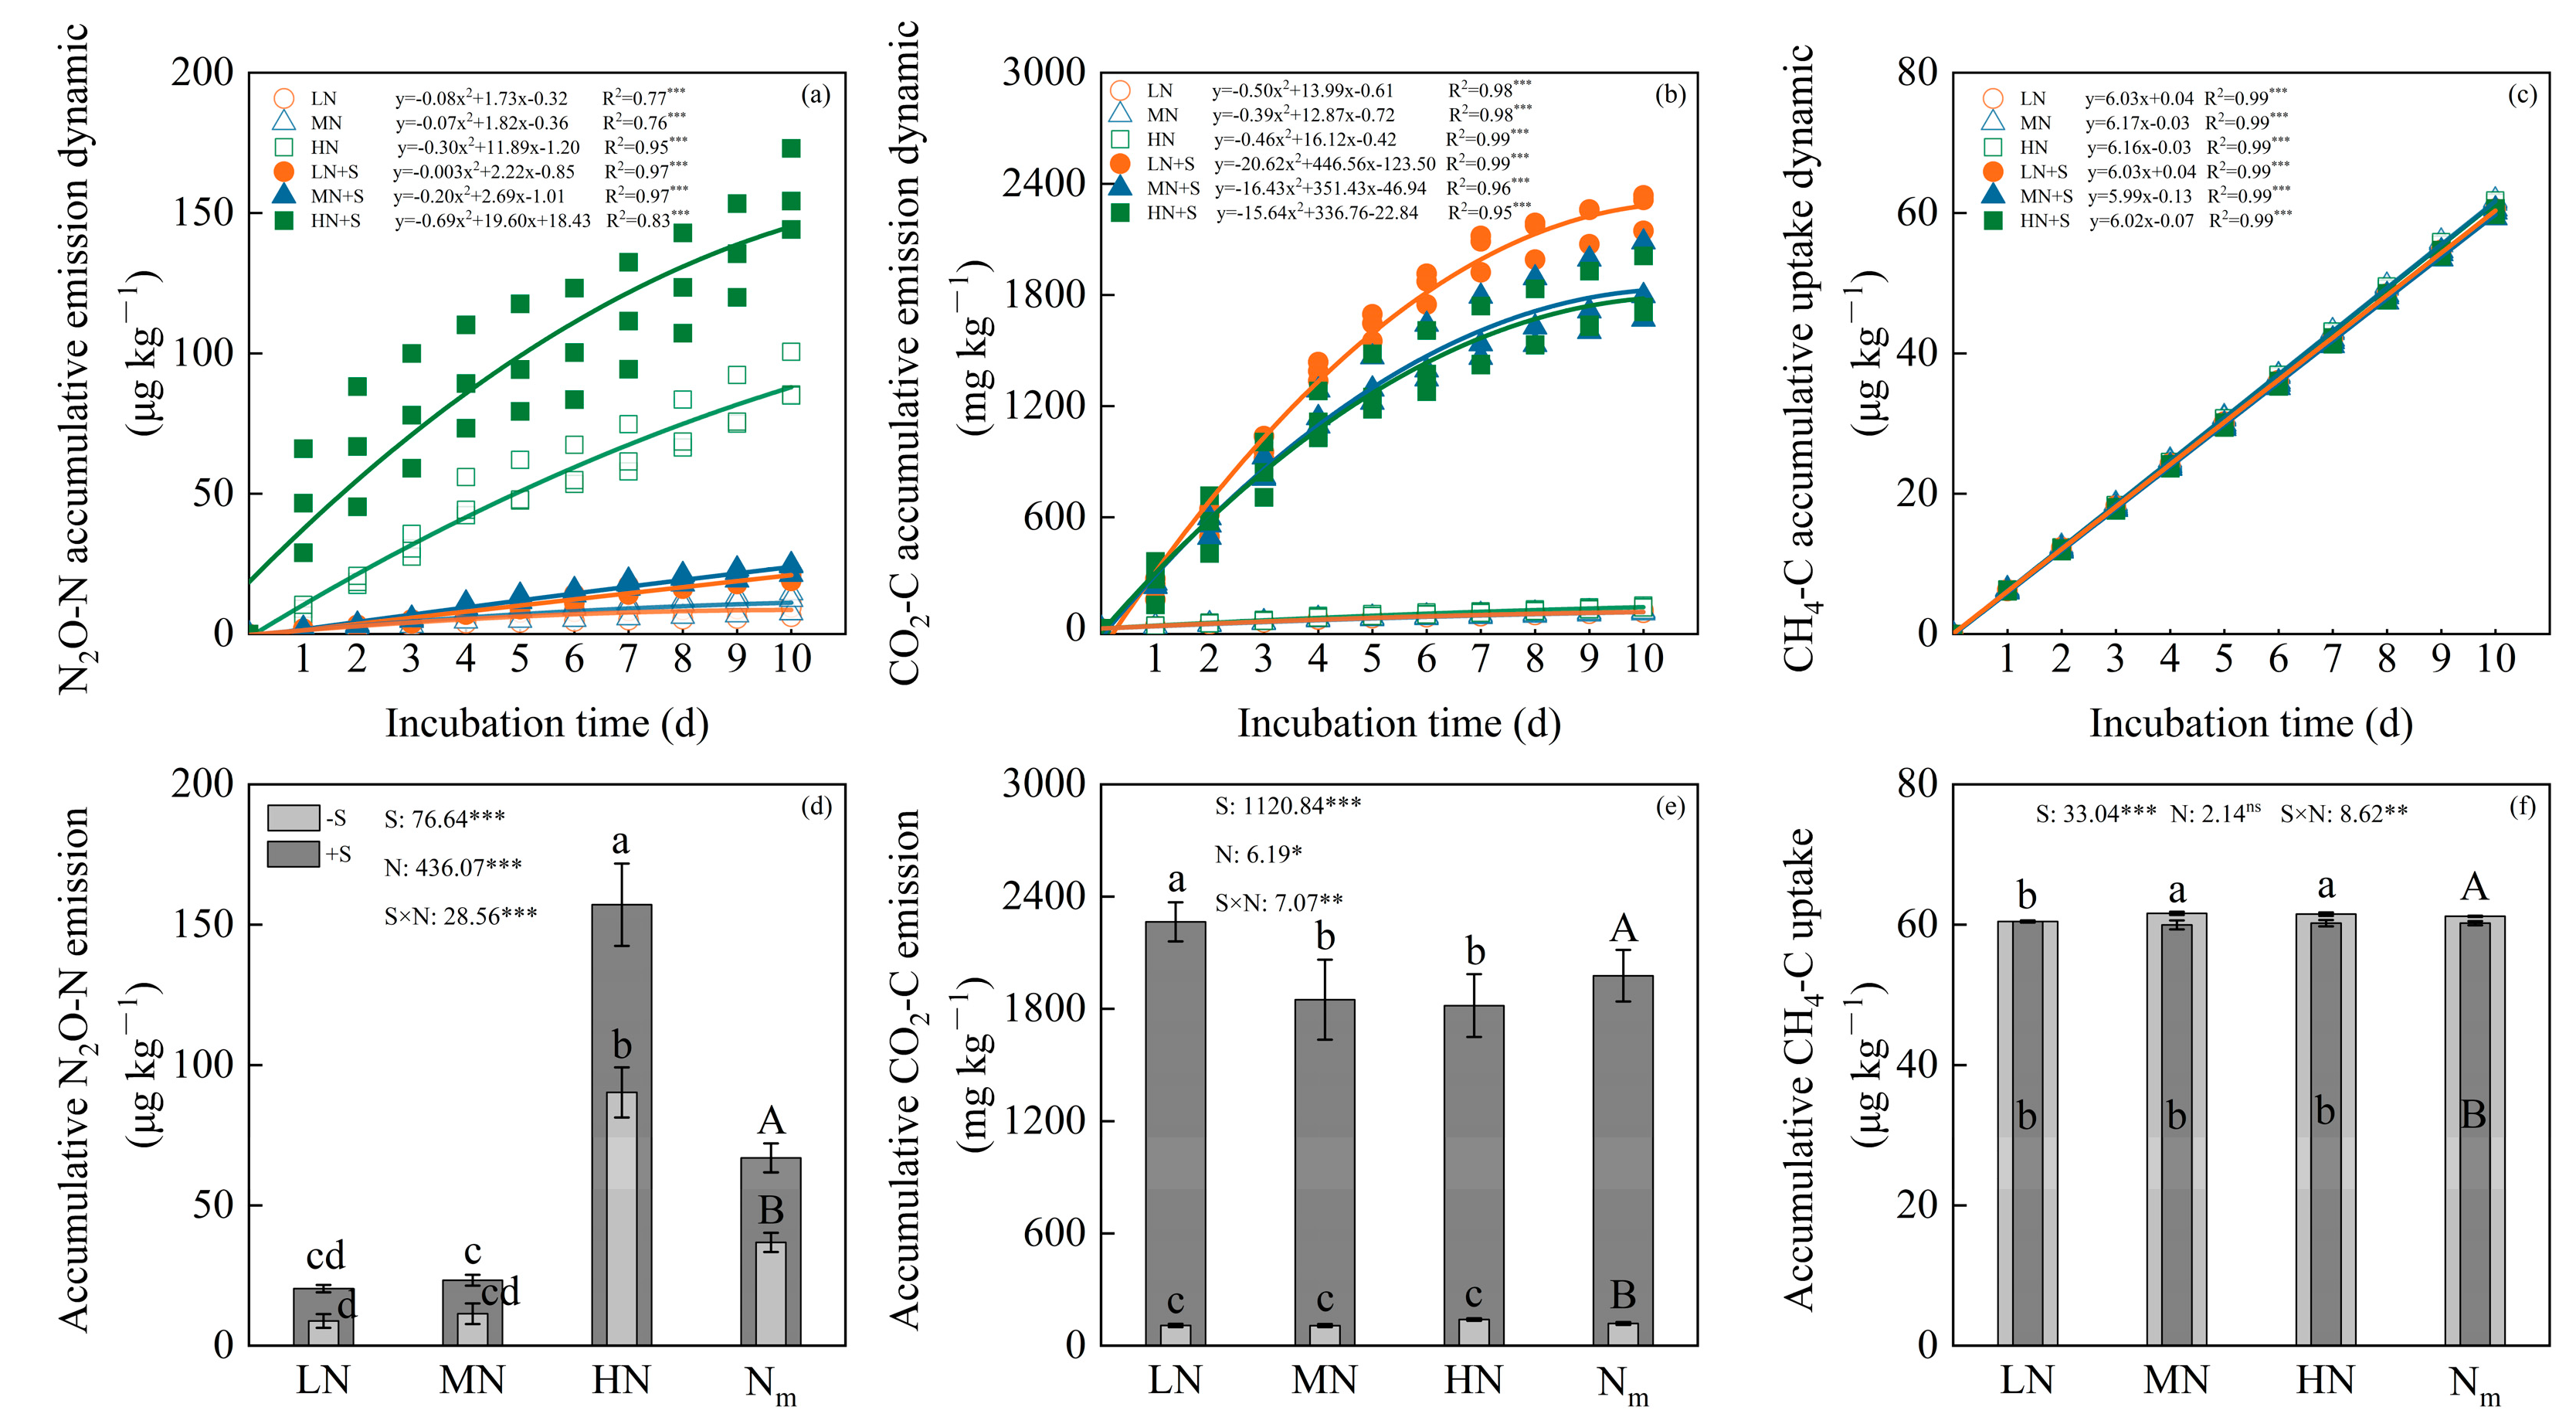
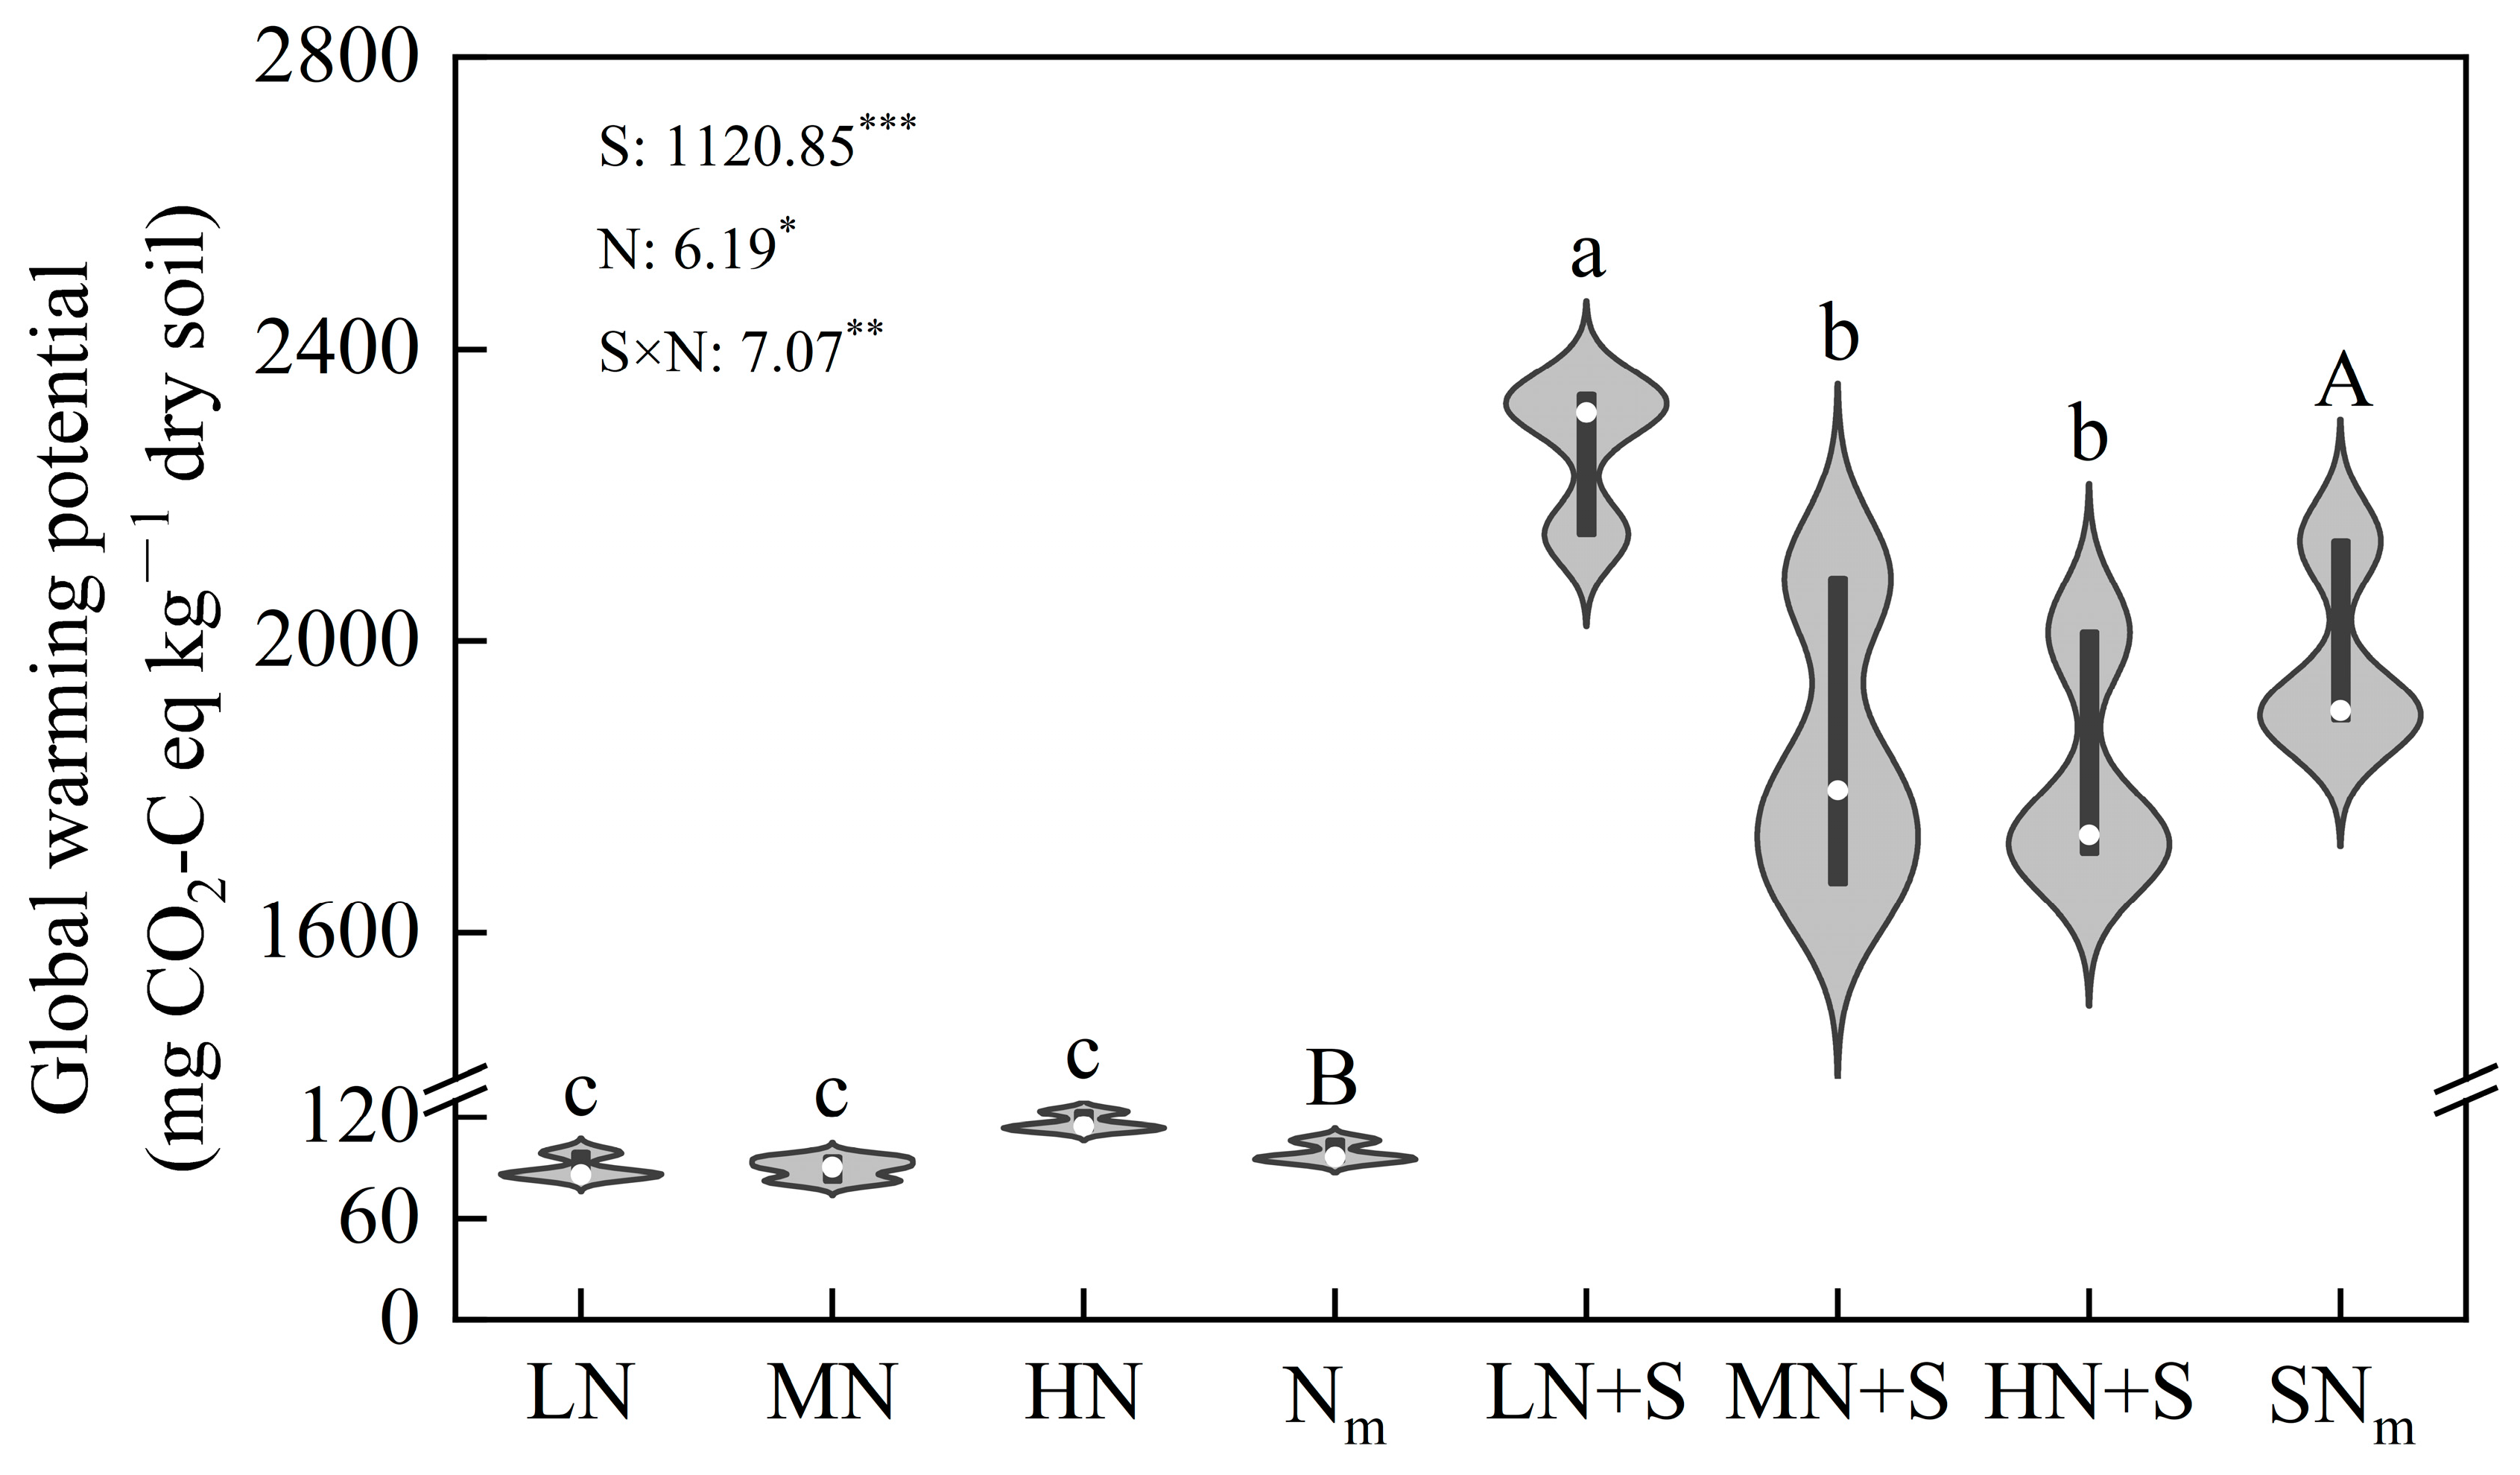
3.2. Accumulative GHGs and GWP Relied on N Fertilization and Straw Incorporation

There were significant functional relationships between accumulated GHGs dynamics and incubation time; these were quadratic for N2O-N and CO2-C and linear for CH4-C (Figure 2a–c). The accumulative GHGs were significantly affected by soil N level, straw amendment, and their interactions, in addition to the effect of soil N level on CH4-C (Figure 2d–f). Accumulative N2O-N emission was enhanced by the richness of soil N level and was dramatically heightened by 81.7% by straw amendment. High-N soil (HN and HN+S) significantly elevated emissions by 5.7–9.2-fold compared to medium- and low-N soil (LN, MN, LN+S, and MN+S), and there was a significant increase from 90.3 μg kg−1 (HN) to 157.2 μg kg−1 (HN+S) (Figure 2d, p < 0.05).
The accumulated CO2-C emission was increased on average by 20-fold by straw presence relative to no straw (1977.8 mg kg−1 vs. 99.0 mg kg−1), with 25.1-, 20.6-, and 15.6-fold increases under low, medium, and high soil N conditions, respectively (Figure 2e, p < 0.05). The maximum value (116.9 mg kg−1) in straw-free surroundings was obtained in the HN treatment, and the highest value (2265.7 mg kg−1) under straw presence was obtained under LN+S treatment; this was remarkably higher than other N soils. Moreover, CH4-C uptake was significantly increased in soils without straw amendment, especially in medium- and high-N soils (Figure 2f, p < 0.05).
As shown in Figure 3, GWP had similar trends to accumulative CO2-C emission, which was mainly associated with the predominance of CO2 in the equivalent CO2-C calculation of GHGs. A dramatic difference was noticed between treatments with and without straw amendment; the average GWPs were 1977.9 (SNm) and 99.0 mg (Nm) CO2-C eq kg−1 dry soil, respectively (p < 0.05). GWP increased with soil N content with no straw, but decreased when straw was incorporated. It was significantly higher under LF+S treatment compared to MF+S and HF+S treatments by 22.5% and 24.6%, respectively.

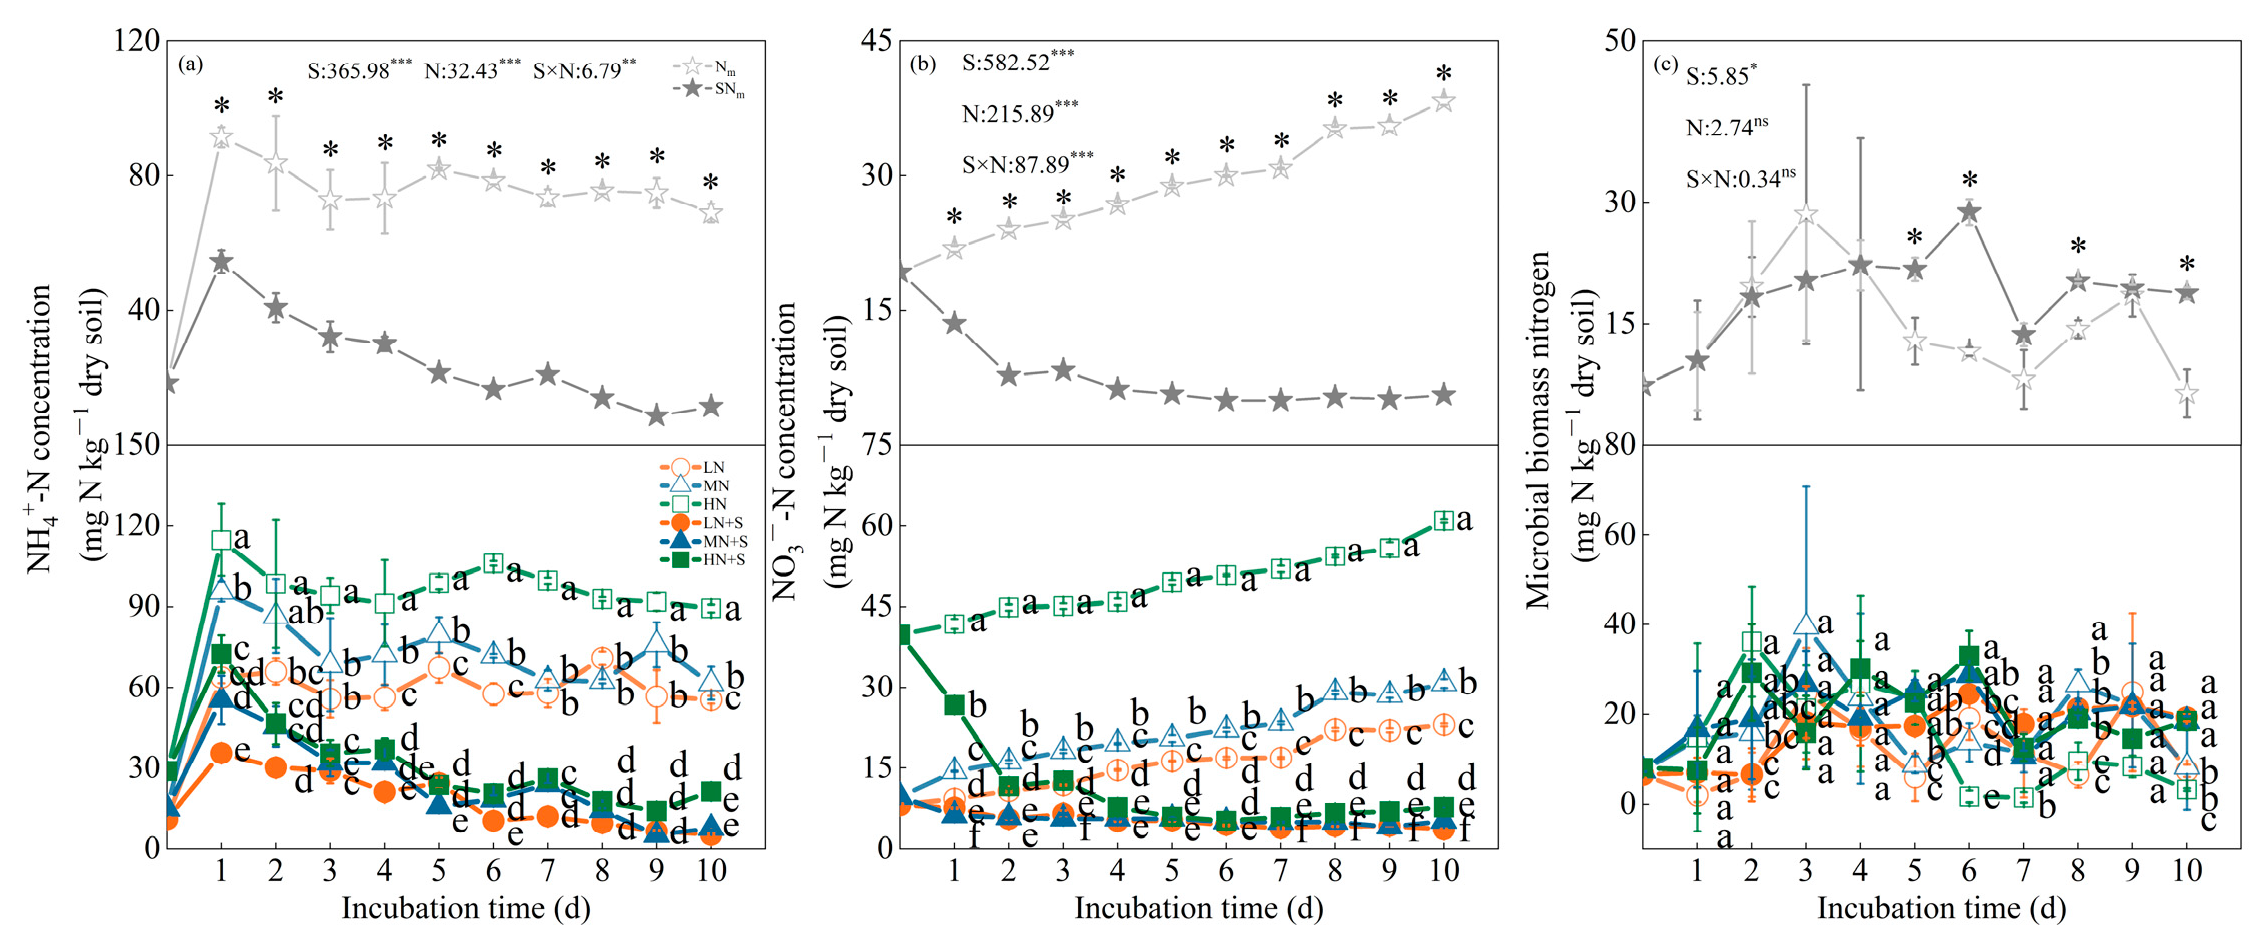
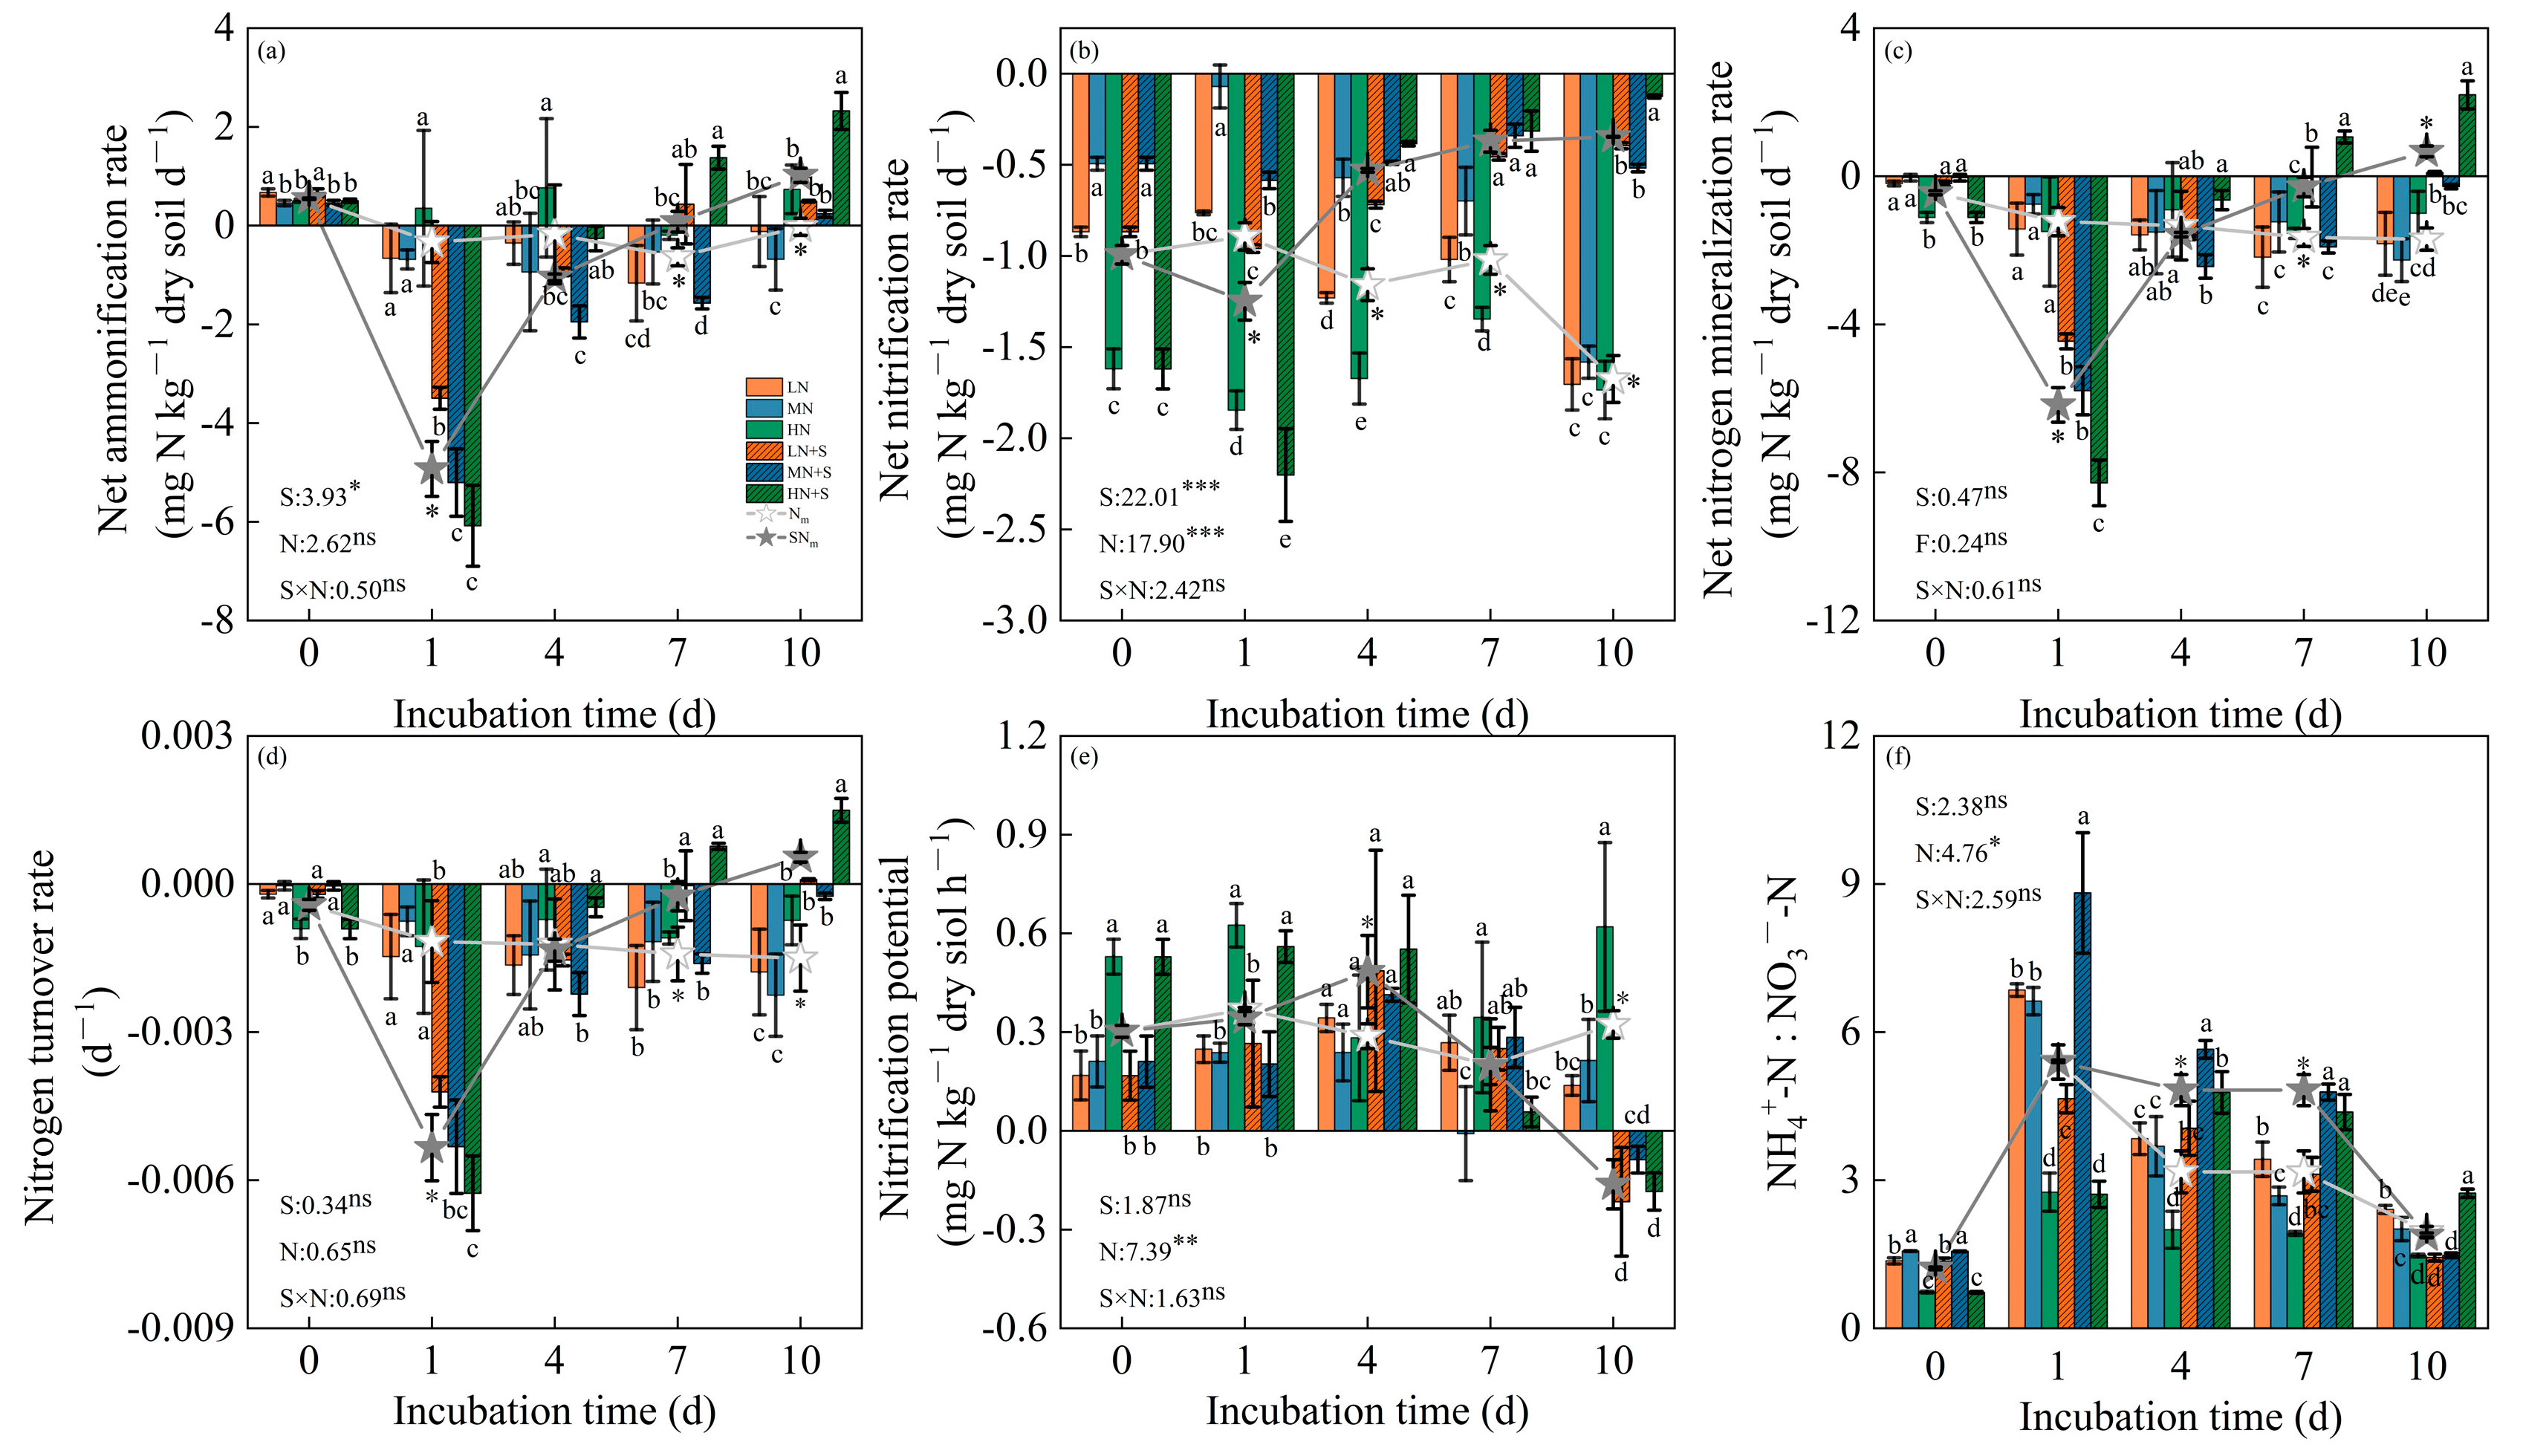
3.3. Soil Labile N Dynamic and Related N Turnover Capacity of Different N and Straw Management

The dynamics of NH4+-N, NO3-N, and SMBN concentrations were significantly affected by straw amendment, while the mineral N was also affected by soil N level and the interaction of two factors (Figure 4a–c). Soil NH4+-N content increased with soil N level and exhibited a gradually descending trend from the first day to the end of incubation (Figure 4a). This phenomenon of depletion was significantly enhanced by straw amendment regardless of soil N level. Consumption rate increased by 71.1%, 49.5%, and 47.0% in low-, medium-, and high-N soil, respectively. However, soil NO3-N dynamics varied, with a clear decreasing or increasing trend with and without straw, respectively (Figure 4b). The consumption of NO3-N was reduced by 51.4%, 16.6%, and 70.8% with the improvement of soil N on average. High-N soil kept the highest concentration of NO3-N, followed by medium- and low-N soils, irrespective of straw amendment. SMBN content steadily fluctuated and increased with straw amendment in the middle of the incubation process (Figure 4c).
With respect to soil N turnover capacity, straw amendment and soil N level could significantly affect net nitrification rate (NNR). The former affected net ammonification rate (NAR), while the latter impacted nitrification potential (NP) and the ratio of ammonia to nitrate (Figure 5a–f). NAR, net N mineralization rate (NNMR), and nitrogen turnover rate (NTR) underwent the same trend of first decreasing and then increasing. Almost all treatments presented negative values after the start of incubation, except for high-N soil, in which they became positive at the end of incubation (Figure 5a–d). NNR ranged from −2.20 to −0.07 mg N kg−1 d−1, but significantly increased with exogenous straw addition from the fourth day to the end of incubation (Figure 5b). NP increased first and then decreased with the addition of straw and turned from positive to negative at the end of incubation (Figure 5e). NH4+-N:NO3-N followed a similar trend to NP and reached peak value at the first day of incubation for all treatments excluding HN+S, which achieved the highest value on the fourth day (Figure 5f).

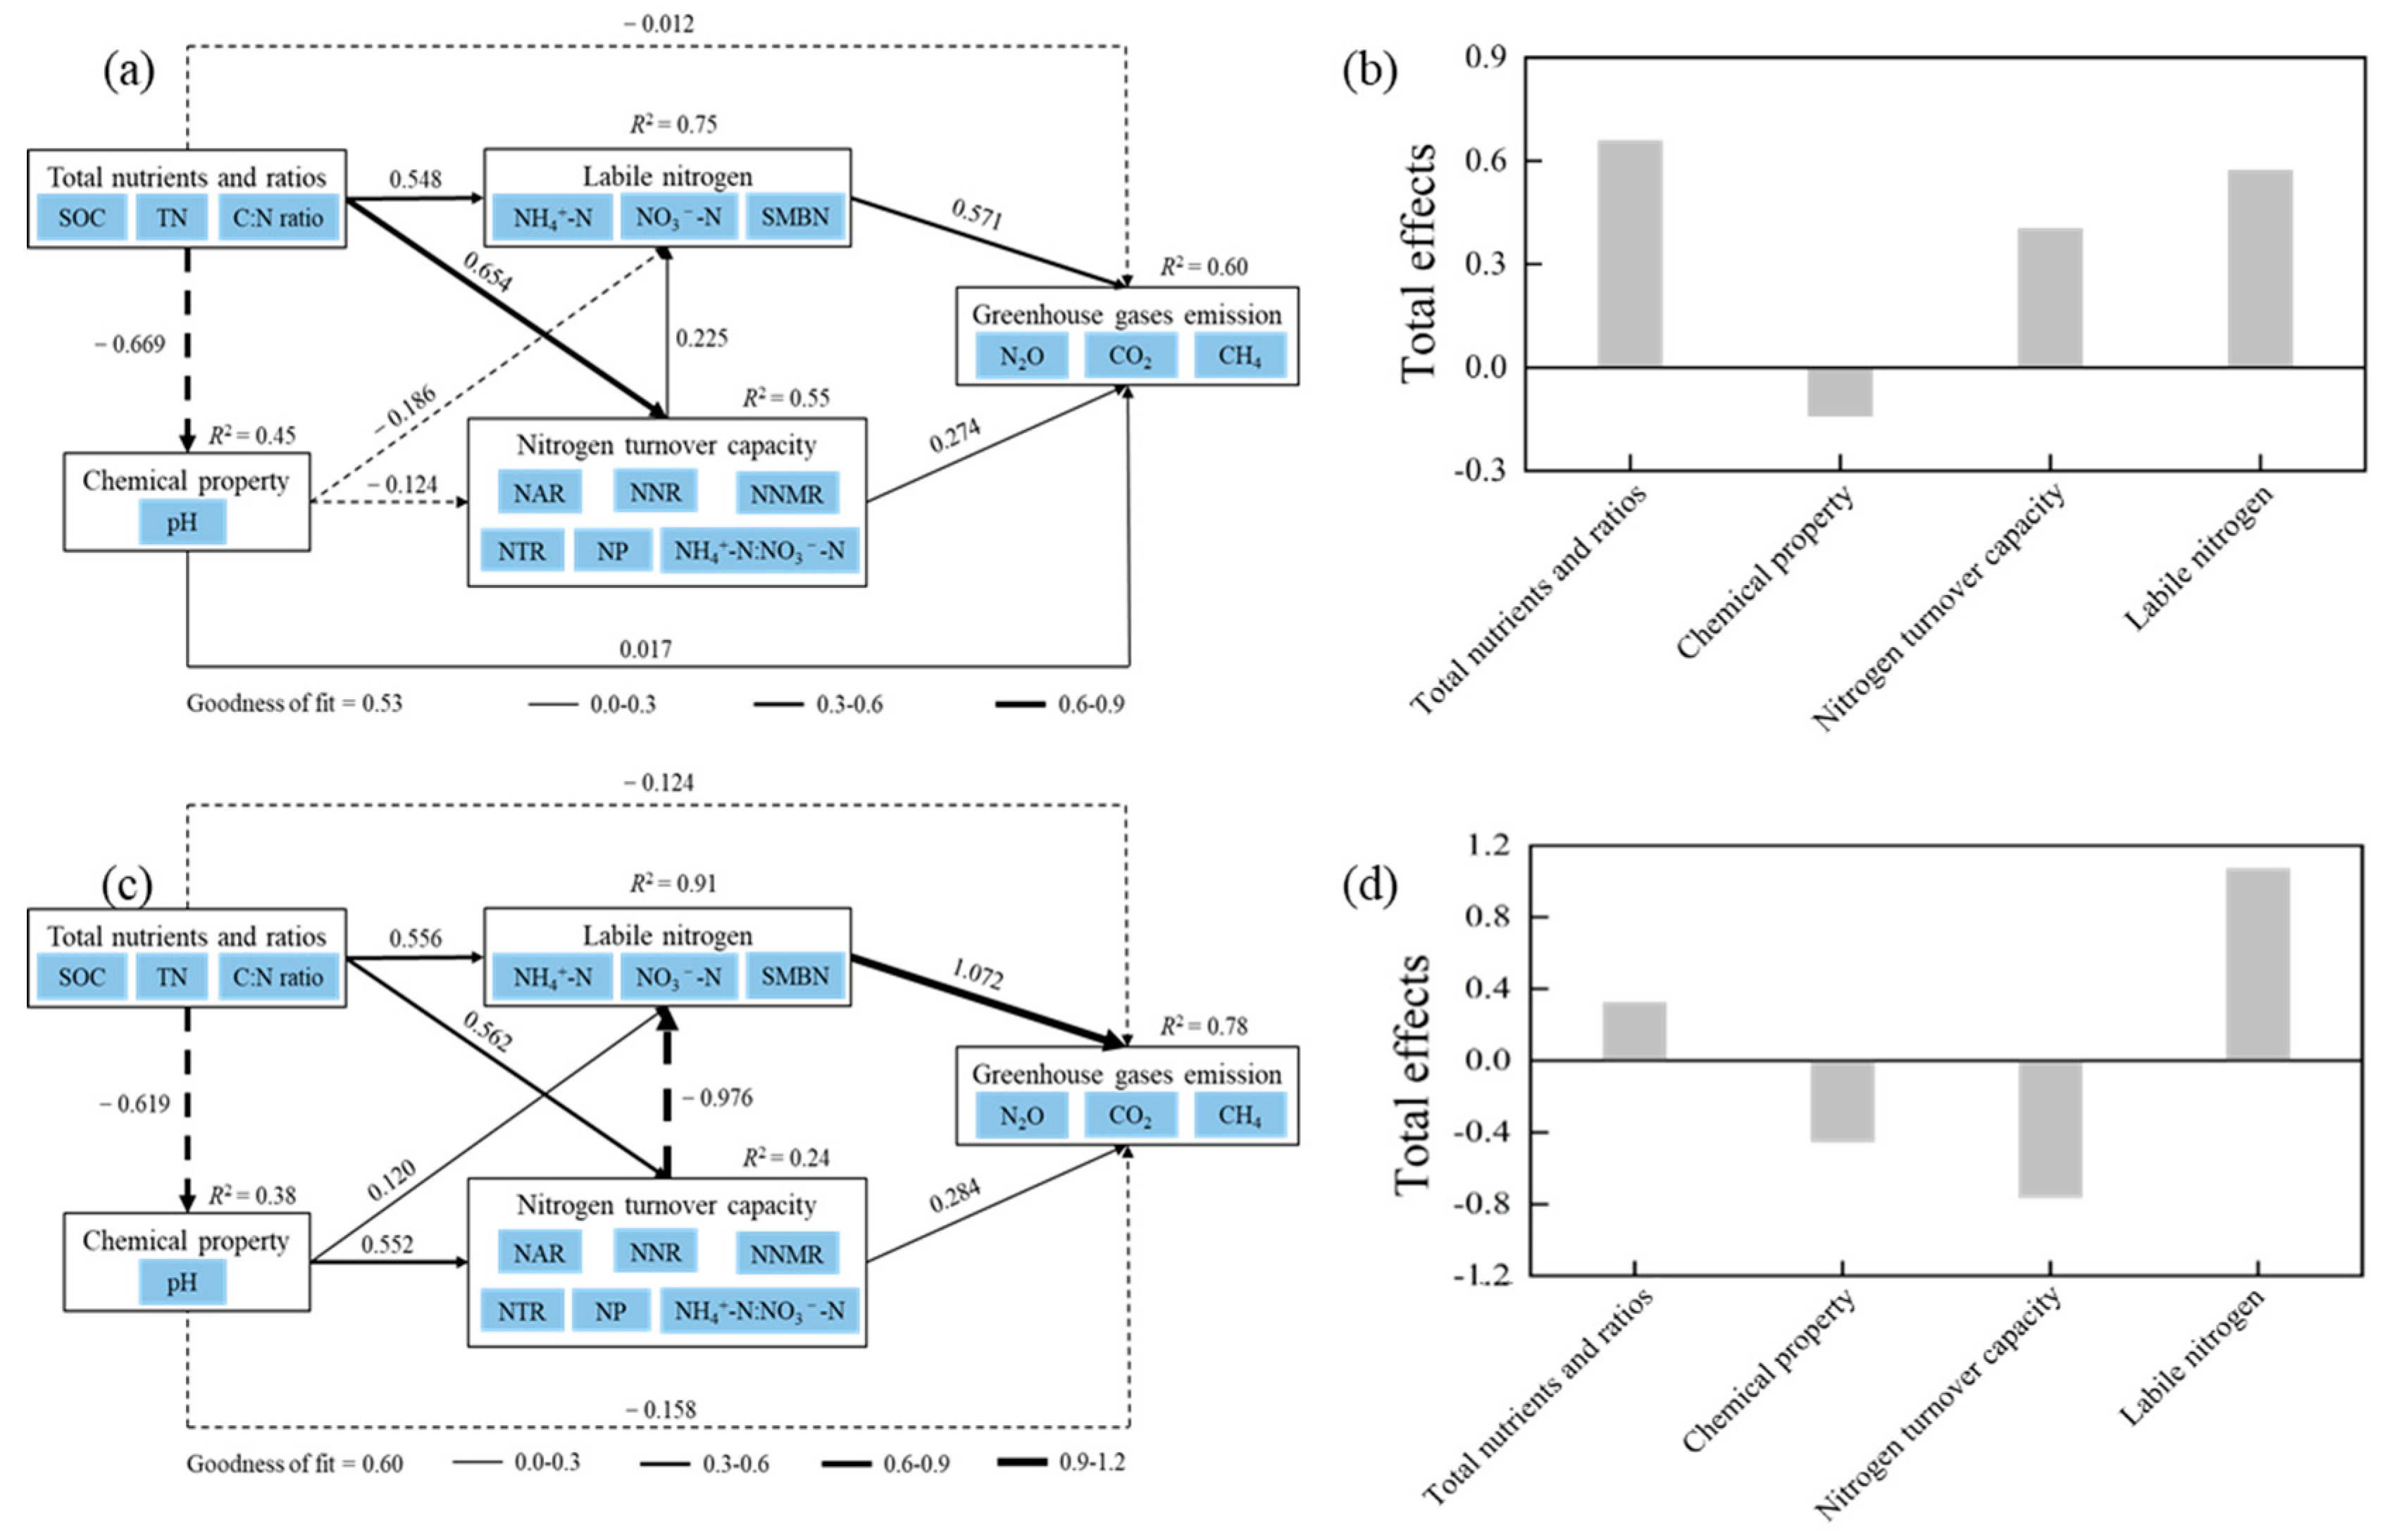
3.4. Relationships Between GHGs and Soil Properties

The PLS-PM confirmed the direct and indirect effects of total nutrients and ratios, chemical properties (pH), nitrogen turnover capacity, and labile nitrogen on GHGs, which could explain 52.9% and 59.7% of variation under straw removal and amendment conditions, respectively (Figure 6a,c). Total nutrients and ratios (0.657), nitrogen turnover capacity (0.402), and labile nitrogen (0.571) had positive total effects on GHGs, while chemical property (−0.139) had a negative total effect without straw (Figure 6b). Moreover, total nutrients and ratios (0.323) and labile nitrogen (1.072) had positive total effects on GHGs, while chemical properties (−0.451) and nitrogen turnover capacity (−0.762) induced negative total effects with straw amendment (Figure 6d). Nitrogen turnover capacity was the determinant affecting GHGs and explained 23.6% and 55.1% of all variations in GHGs with and without straw amendment, respectively.
According to the RDA results, the degree of total variance explained was 63.4%, of which the first axis explained 39.4% of the variance with straw removal (Figure 7a). Soil N2O, CO2, and CH4 emissions were positively correlated with NH4+-N and SMBN contents and NTR and NNMR, while soil C:N was negatively correlated. The first axis explained 40.4% of the variance, and the second axis explained 29.8% of the variance with straw amendment (Figure 7e). There was a positive relationship between NH4+-N and NO3-N concentrations and NP with the three greenhouse gases, while there was a negative correlation between C:N, pH, NNR, and GHGs. RFM showed that N2O was mainly managed by NO3-N, TN, and NH4+-N (Figure 7b,f), while CO2 and CH4 were primarily governed by NH4+-N:NO3-N and NO3-N with no straw (Figure 7c,d), and NP, NNMR, NTR, and NH4+-N in the presence of straw (Figure 7g,h).

3.5. Soil Nitrogen and Carbon Balance in Incubation Microcosm

The estimate of N balance in the incubation microcosm is presented in Table 2, which roughly quantifies the transformation of NH4+-N and NO3-N and the loss of N in the form of N2O. There were significant differences between Δ mineral N in the presence and absence of straw, and these effects increased with increasing soil N level. Although the emission of N in N2O-N was on average 1.8-fold higher in treatments with straw amendment than with no straw (2.0 μg vs. 1.1 μg), there was no significant difference in the ratio of N2O-N to ideal TN (R1).
C balance decreased and increased during incubation under straw removal and straw amendment treatment, respectively (Table 3). The CH4-C and CO2-C emissions, representing the gain and deficit of C in the whole incubation system, increased by 1.6% and 1898.0% in treatments with no straw and with straw returning, respectively. Low-N soil was more responsive to straw incorporation and showed greater CO2 emissions than medium- and high-N soils. The trend in the ratio of CO2-C to ideal TC (R2) for straw amendment was similar to that of CO2-C, in that it decreased with decreasing soil N level.

4. Discussion

4.1. Effects of Straw Amendment and N Level on Soil Greenhouse Gas Emissions

Our findings revealed that straw amendment significantly stimulated both N2O-N and CO2-C emissions (Figure 2d,e), and their fluxes peaked on the fourth day of incubation (Figure 1a,b). These results are in agreement with previous studies [42,43,44]. However, a rapid increase in N2O-N emission occurred in high-N soil, and strong CO2-C emissions appeared within soils with straw added, indicating that the former may be dominantly regulated by soil N level, but the latter by straw (Figure 2). The underlying mechanisms involved with soil N and C turnover might be related to the difference in soil microcosmic environment caused by long-term contrasting fertilizer N input. The increase in both flux and accumulative N2O-N emissions were mainly ascribed to the different available mineral N in soils (Figure 1a and Table 1), and these findings confirm that the mineral N availability plays an important role in regulating N2O-N emissions in soil [28,29] (Figure 6 and Figure S2). Soil N2O-N is primarily generated from the nitrification and denitrification processes [19,20,45], and high-N soil could provide more NH4+-N and NO3N as substrates for both reaction processes than medium- and low-N soils (Table 1), resulting in a striking difference, especially with straw amendment (Figure 2a). On the other hand, exogenous straw input produced a strong effect that not only increased soil porosity, causing more N2O-N diffusion from the soil aggregated structure [46], but also gradually generated anaerobic hotspots because of the promotion of microbial activities enhancing O2 consumption and releasing straw-N and -C. Straw degradation created favorable conditions for nitrification and denitrification processes, and thus stimulated N2O-N emissions [47,48]. Hence, HN+S treatment caused N2O-N emissions to peak on the first day.
Soil CO2-C emission is a strong indicator of biological activity [49], and it was verified to have similar trends in flux to N2O-N emissions in this study (Figure 1). Soil microorganisms can only employ the limited available C from SOM for metabolism without added straw [42], thus the CO2-C emissions remain at a low level generally, even with occasional fluctuations (Figure 1b). Nevertheless, intense CO2-C emissions occurred when straw was added (Figure 1b and Figure 2e), which was in agreement with previous works [42,50]. Indeed, as returning an organic substance back to soil can cause a “priming effect”, maize straw incorporation could increase CO2-C emissions [16,51,52,53]. Additionally, it was interesting that LN+S showed maximum CO2-C emissions that were significantly greater than under the MN+S and HN+S treatments due to the significant increase in CO2-C flux from the third to seventh day of incubation (Figure 1b). These observations might be explained by the descriptions from Fontaine et al. and Wang et al., who reported that the rapid increase in C source after a mass of straw enters soil with little available N would exacerbate the nutrient limitation of microorganisms, forcing them to mineralize more nutrient elements from SOM to overcome the stoichiometric imbalance and ensure their own growth and reproduction, thus contributing to soil CO2-C emissions [54,55].

4.2. Effects of Straw Incorporation and N Fertilization on Soil Labile N and N Turnover Capacity

Soil NH4+-N consistently decreased in all treatments, and became even lower than background levels under straw amendment conditions (Figure 4a), in line with other reports [42,47,56]. The significant variation in NH4+-N content and NAR was monitored after 1 day of incubation, and indicated that straw could rapidly increase NH4+-N turnover, resulting in lower values than no straw (Figure 4a and Figure 5a). On the one hand, the dispersive straw could temporarily become a nucleus in the form of particulate organic matter to adsorb NH4+-N in soil solution, causing a reduction in its availability [57]. On the other hand, the addition of straw caused microbial N immobilization (Figure 4c), because a mass of C from straw stimulates microorganisms that assimilate mineral N to maintain their C:N for carrying on their metabolic processes, as well as elevating microbial activity on soil N cycle, such as nitrification, increasing the consumption of soil NH4+-N [58].
Treatments with no straw reversed the dynamic trend of gradual soil NO3-N reduction with straw incorporation, which might lead to a sluggish turnover of NH4+-N and relatively stable nitrification potential (Figure 4a,b and Figure 5e). Generally, it has been considered that soil NO3-N content would decrease after straw addition, due to straw being degraded by microorganisms consuming mineral N in the soil [43,44,59]. Furthermore, a greater NNR and NNMR with straw presence were observed from the 4th to 10th day of incubation (Figure 5b,c), which was mainly ascribed to microbial N retention. An extremely positive correlation existed between NO3-N concentration and N2O-N flux (Figure 4c and Figure S2b), which in turn meant more N2O-N emissions and higher consumption of NO3N, especially at the early stage of incubation (Figure 1a). O2 deficiency caused by enhancive microbial activities increased energy and promotional electron acceptors after straw addition. This favors denitrification, and resulted in the depletion of NO3-N [58,59,60]. However, some opposite results demonstrated that straw amendment could increase the soil NO3-N, which might be due to soil property, straw quality, or incubation environment [47,56,61].

4.3. Effects of Straw Incorporation and N Level on Soil N and C Pools Trade-Off

We discovered opposite states of alteration in the amount of mineral N and different levels of N exchange between treatments with and without straw amendment when evaluating the N balance of the incubation system (Table 2). Soil NH4+-N and NO3-N participate in many N turnover processes, and their concentrations are chiefly regulated by nitrification and denitrification, which could be influenced by additional substrates and contribute to N mineralization and immobilization [62]. The maize straw with a C:N of 36.4 (>30) applied in the experiment (Table 1) could cause N immobilization via soil microorganisms, thus decreasing mineral N contents and setting up a negative change in mineral N [63] (Figure 4). Nonetheless, the uptake of mineral N by microorganisms also reduced the amount of N in the form of NO3-N and improved N retention in soils [64]. Although there was a significantly greater emission of N2O-N in treatments with straw amendment compared to those without straw, the variation between them and both the ratios of N2O-N to total N system were no more than 0.5 ‱ on average (Table 2). Hence, straw incorporation promoted the conversion of soil mineral N, as well as favoring soil TN content and enhancing soil N balance, especially in medium-N soil (Table 2; Figure S1b).
An extremely significant positive correlation was also discovered between N2O-N and CO2-C flux (Figure S2a), suggesting that CO2-C could be an effective predictor for N2O-N emission [65]. Thus, we further evaluated the trade-off of C in the incubation system, and there were some interesting differences between the soils with respect to CO2-C emission responses to straw amendment. The results showed that the lost C occupied 10.05% of the whole system after applying straw on average, while just 0.86% C was lost from the system of straw-free soils (Table 3). Similarly to N balance, the increase in C also occurred under the condition of straw presence, and there was no significant difference in C balance between medium- and high-N soils, which indicated that straw amendment could improve the C retention capacity of the soil [22].
A significantly greater uptake of CH4-C emissions was observed in soils without straw compared to those with straw amendment (Figure 2c and Table 3). It is assumed that straw absence led to a deficiency of soil C pools, which allowed more CH4-C to flow into dryland soils to attain carbon balance in the ecosystem [66] (Table 3 and Figure S1a). The results of this study were obtained under the ideal conditions of a laboratory environment, so that we could observe more details about N and C nutrient dynamics. Field trials are still necessary in the future. Integrating the above results, the effects of soil fertility and straw amendment on GHGs and mineral N dynamics were affirmed, whereas the origin and quantitative transformation of N and C, including the internal mechanism, are still uncertain. This requires further explorations with isotope tracer technology, enzyme kinetics, and microbial gene sequencing technologies. In addition, although an obvious effect of straw was detected in the short-term incubation period of 10 days, new findings may be made by extending the experiment period for further study.

5. Conclusions

Our study revealed that soil N level was the main driver of N2O-N emissions, while straw addition was the dominant driver of CO2-C emissions. Straw addition improved N turnover capacity, and low-N soil tended to stimulate CO2-C emissions, whereas high-N soil caused a striking change in N2O-N emissions. Moreover, straw return was effective in promoting soil mineral N turnover and microbial N fixation, thereby reducing the risk of loss due to its retention in the soil. Throughout the whole incubation system, straw amendment stimulated GHGs, enhanced the soil N and C balance, and accelerated the N cycling process. Medium N soil formed by long-term N input (187 kg N ha−1) had relatively few emissions and a higher positive balance of N and C than LN and HN soil. Coupled with straw incorporation, this is recommended as a farmland management strategy in Northeast China.

Supplementary Materials

The following supporting information can be downloaded at https://www.mdpi.com/article/10.3390/agronomy14122996/s1, Figure S1: Soil organic carbon (a, SOC), total nitrogen (b, TN), the ratio of SOC to TN (c, C:N) and pH (d) of treatments during the incubation period; Figure S2: Pearson correlation coefficients between soil properties and greenhouse gas emissions (* p < 0.05, ** p < 0.01, *** p < 0.001) under straw removal (a) and straw amendment (b) conditions.

Author Contributions

Conceptualization, Z.W., J.S., X.G. and Y.J.; methodology, Z.W., J.S., X.W., D.Z. and H.Z.; software, X.W. and R.Y.; validation, Z.W., X.L., Y.Y. and H.Z.; formal analysis, Z.W. and Y.Y.; investigation, R.Y., D.Z., X.L. and Y.Y.; resources, X.G. and H.Q.; data curation, D.Z. and H.Z.; writing—original draft preparation, Z.W. and J.S.; writing—review and editing, Z.W., Y.J. and H.Q.; visualization, X.W., R.Y. and X.L.; supervision, X.G.; project administration, Y.J.; funding acquisition, H.Q. All authors have read and agreed to the published version of the manuscript.

Funding

This research was funded by the National Natural Science Foundation of China (32071976, 31901471) and the National Key Research and Development Program of China (2022YFD1500603) and the Planning project of Science and Technology in Liaoning Province, China (2022-BS-166, LJKM20221017).

Data Availability Statement

The data are available on request due to privacy restrictions. The data presented in this study are available on request from the corresponding author.

Acknowledgments

We would like to express our gratitude to the anonymous editor and reviewers for their suggestions, which have greatly helped the improvement of this article.

Conflicts of Interest

The authors declare no conflicts of interest. The funders had no role in the design of the study; in the collection, analyses, or interpretation of the data; in the writing of the manuscript; or in the decision to publish the results.

References

  1. Lal, R. World crop residues production and implications of its use as a biofuel. Environ. Int. 2005, 31, 575–584. [Google Scholar] [CrossRef]
  2. FAO. FAOSTAT Database 2023; Production: Crops and livestock products; FAO: Rome, Italy, 2023. [Google Scholar]
  3. Jiang, D.; Zhuang, D.F.; Fu, J.Y.; Huang, Y.H.; Wen, K.G. Bioenergy potential from crop residues in China: Availability and distribution. Renew. Sust. Energ. Rev. 2012, 16, 1377–1382. [Google Scholar] [CrossRef]
  4. Qian, R.; Guo, R.; Naseer, M.A.; Zhang, P.; Chen, X.L.; Ren, X.L. Long-term straw incorporation regulates greenhouse gas emissions from biodegradable film farmland, improves ecosystem carbon budget and sustainable maize productivity. Field Crop Res. 2023, 295, 108890. [Google Scholar] [CrossRef]
  5. Yang, L.; Muhammad, I.; Chi, Y.X.; Liu, Y.X.; Wang, G.Y.; Wang, Y.; Zhou, X.B. Straw return and nitrogen fertilization regulate soil greenhouse gas emissions and global warming potential in dual maize cropping system. Sci. Total Environ. 2022, 853, 158370. [Google Scholar] [CrossRef] [PubMed]
  6. Li, Z.W.; Khan, K.; Yang, L.; Pan, Y.Q.; Zhou, X.B. Continuous Straw Returning Combined with Nitrogen Application Improve Soil Properties and Yield of Double Cropping Maize in Subtropical Regions. Sustainability 2024, 16, 5265. [Google Scholar] [CrossRef]
  7. Rousk, J.; Baath, E. Fungal and bacterial growth in soil with plant materials of different C/N ratios. FEMS Microbiol. Ecol. 2007, 62, 258–267. [Google Scholar] [CrossRef] [PubMed]
  8. Begum, N.; Guppy, C.; Herridge, D.; Schwenke, G. Influence of source and quality of plant residues on emissions of N2O and CO2 from a fertile, acidic Black Vertisol. Biol. Fertil. Soils 2014, 50, 499–506. [Google Scholar] [CrossRef]
  9. Chen, B.Q.; Liu, E.K.; Tian, Q.Z.; Yan, C.R.; Zhang, Y.Q. Soil nitrogen dynamics and crop residues. A review. Agron. Sustain. Dev. 2014, 34, 429–442. [Google Scholar] [CrossRef]
  10. Wu, Y.P.; Liu, T.; Peng, Q.A.; Shaaban, M.; Hu, R.G. Effect of straw returning in winter fallow in Chinese rice fields on greenhouse gas emissions: Evidence from an incubation study. Soil Res. 2015, 53, 298–305. [Google Scholar] [CrossRef]
  11. Liu, C.; Lu, M.; Cui, J.; Li, B.; Fang, C.M. Effects of straw carbon input on carbon dynamics in agricultural soils: A meta-analysis. Glob. Chang. Biol. 2014, 20, 1366–1381. [Google Scholar] [CrossRef] [PubMed]
  12. Hu, N.J.; Wang, B.J.; Gu, Z.H.; Tao, B.R.; Zhang, Z.W.; Hu, S.J.; Zhu, L.Q.; Meng, Y.L. Effects of different straw returning modes on greenhouse gas emissions and crop yields in a rice-wheat rotation system. Agric. Ecosyst. Environ. 2016, 223, 115–122. [Google Scholar] [CrossRef]
  13. IPCC. Climate Change 2013: The Physical Science Basis; Cambridge University Press: Cambridge, UK, 2013. [Google Scholar]
  14. Wu, D.; Wei, Z.J.; Well, R.; Shan, J.; Yan, X.Y.; Bol, R.; Senbayram, M. Straw amendment with nitrate-N decreased N2O/(N2O+N2) ratio but increased soil N2O emission: A case study of direct soil-born N2 measurements. Soil Biol. Biochem. 2018, 127, 301–304. [Google Scholar] [CrossRef]
  15. Huang, R.; Wang, Y.Y.; Liu, J.; Li, J.C.; Xu, G.X.; Luo, M.; Xu, C.; Ci, E.; Gao, M. Variation in N2O emission and N2O related microbial functional genes in straw- and biochar-amended and non-amended soils. Appl. Soil Ecol. 2019, 137, 57–68. [Google Scholar] [CrossRef]
  16. Wang, N.; Yu, J.G.; Zhao, Y.H.; Chang, Z.Z.; Shi, X.X.; Ma, L.Q.; Li, H.B. Straw enhanced CO2 and CH4 but decreased N2O emissions from flooded paddy soils: Changes in microbial community compositions. Atmos. Environ. 2018, 174, 171–179. [Google Scholar] [CrossRef]
  17. Zhang, J.; Hang, X.N.; Lamine, S.M.; Jiang, Y.; Afreh, D.; Qian, H.Y.; Feng, X.M.; Zheng, C.Y.; Deng, A.X.; Song, Z.W.; et al. Interactive effects of straw incorporation and tillage on crop yield and greenhouse gas emissions in double rice cropping system. Agric. Ecosyst. Environ. 2017, 250, 37–43. [Google Scholar] [CrossRef]
  18. Butterbach-Bahl, K.; Baggs, E.M.; Dannenmann, M.; Kiese, R.; Zechmeister-Boltenstern, S. Nitrous oxide emissions from soils: How well do we understand the processes and their controls? Philos. Trans. R. Soc. B 2013, 368, 20130122. [Google Scholar] [CrossRef] [PubMed]
  19. Kool, D.M.; Dolfing, J.; Wrage, N.; Van Groenigen, J.W. Nitrifier denitrification as a distinct and significant source of nitrous oxide from soil. Soil Biol. Biochem. 2011, 43, 174–178. [Google Scholar] [CrossRef]
  20. Nan, W.G.; Yue, S.C.; Li, S.Q.; Huang, H.Z.; Shen, Y.F. Characteristics of N2O production and transport within soil profiles subjected to different nitrogen application rates in China. Sci. Total Environ. 2016, 542, 864–875. [Google Scholar] [CrossRef] [PubMed]
  21. Janssens, I.A.; Dieleman, W.; Luyssaert, S.; Subke, J.A.; Reichstein, M.; Ceulemans, R.; Ciais, P.; Dolman, A.J.; Grace, J.; Matteucci, G.; et al. Reduction of forest soil respiration in response to nitrogen deposition. Nat. Geosci. 2010, 3, 315–322. [Google Scholar] [CrossRef]
  22. Chen, R.R.; Senbayram, M.; Blagodatsky, S.; Myachina, O.; Dittert, K.; Lin, X.G.; Blagodatskaya, E.; Kuzyakov, Y. Soil C and N availability determine the priming effect: Microbial N mining and stoichiometric decomposition theories. Glob. Chang. Biol. 2014, 20, 2356–2367. [Google Scholar] [CrossRef] [PubMed]
  23. Wang, W.Q.; Lai, D.Y.F.; Sardans, J.; Wang, C.; Datta, A.; Pan, T.; Zeng, C.S.; Bartrons, M.; Peñuelas, J. Rice straw incorporation affects global warming potential differently in early vs. late cropping seasons in Southeastern China. Field Crop Res. 2015, 181, 42–51. [Google Scholar] [CrossRef]
  24. Ma, L.J.; Kong, F.X.; Lv, X.; Wang, Z.; Zhou, Z.G.; Meng, Y.L. Responses of greenhouse gas emissions to different straw management methods with the same amount of carbon input in cotton field. Soil Tillage Res. 2021, 213, 105126. [Google Scholar] [CrossRef]
  25. Htun, Y.M.; Tong, Y.A.; Gao, P.C.; Ju, X.T. Coupled effects of straw and nitrogen management on N2O and CH4 emissions of rainfed agriculture in Northwest China. Atmos. Environ. 2017, 157, 156–166. [Google Scholar] [CrossRef]
  26. Lassaletta, L.; Billen, G.; Grizzetti, B.; Anglade, J.; Garnier, J. 50 year trends in nitrogen use efficiency of world cropping systems: The relationship between yield and nitrogen input to cropland. Environ. Res. Lett. 2014, 9, 105011. [Google Scholar] [CrossRef]
  27. Bouwman, A.F.; Boumans, L.J.M.; Batjes, N.H. Emissions of N2O and NO from fertilized fields: Summary of available measurement data. Glob. Biogeochem. Cycles 2002, 16, 1058. [Google Scholar] [CrossRef]
  28. Prather, M.J.; Hsu, J. Coupling of nitrous oxide and methane by global atmospheric chemistry. Science 2010, 330, 952–954. [Google Scholar] [CrossRef] [PubMed]
  29. Wang, L.; Meng, Y.; Chen, G.Q.; Liu, X.Y.; Wang, L.; Chen, Y.H. Impact of maize growth on N2O emission from farmland soil. Plant Soil Environ. 2019, 65, 218–224. [Google Scholar] [CrossRef]
  30. Geisseler, D.; Scow, K.M. Long-term effects of mineral fertilizers on soil microorganisms—A review. Soil Biol. Biochem. 2014, 75, 54–63. [Google Scholar] [CrossRef]
  31. Jat, S.L.; Parihar, C.M.; Dey, A.; Nayak, H.S.; Ghosh, A.; Pariha, N.; Goswami, A.K.; Singh, A.K. Dynamics and temperature sensitivity of soil organic carbon mineralization under medium-term conservation agriculture as affected by residue and nitrogen management options. Soil Tillage Res. 2019, 190, 175–185. [Google Scholar] [CrossRef]
  32. Wang, Z.Y.; Sui, P.X.; Lian, H.L.; Li, Y.N.; Liu, X.Y.; Xu, H.R.; Zhang, H.Y.; Xu, Y.Y.; Gong, X.W.; Qi, H.; et al. Tillage with straw incorporation reduces the optimal nitrogen rate for maize production by affecting crop uptake, utility efficiency, and the soil balance of nitrogen. Land. Degrad. Dev. 2023, 34, 2825–2837. [Google Scholar] [CrossRef]
  33. Li, H.; Zhang, Y.Y.; Yang, S.; Wang, Z.R.; Feng, X.; Liu, H.Y.; Jiang, Y. Variations in soil bacterial taxonomic profiles and putative functions in response to straw incorporation combined with N fertilization during the maize growing season. Agric. Ecosyst. Environ. 2019, 283, 106578. [Google Scholar] [CrossRef]
  34. Niu, Y.H.; Cai, Y.J.; Chen, Z.M.; Luo, J.F.; Di, H.J.; Yu, H.Y.; Zhu, A.N.; Ding, W.X. No-tillage did not increase organic carbon storage but stimulated N2O emissions in an intensively cultivated sandy loam soil: A negative climate effect. Soil Tillage Res. 2019, 195, 104419. [Google Scholar] [CrossRef]
  35. Kelliher, F.M.; Sherlock, R.; Clough, T.J.; Premaratne, M.; Laughlin, R.J.; McGeough, K.L.; Harvey, M.J.; McMillan, A.M.S.; Reid, A.; Saggar, S. Air sample collection, storage and analysis. In Nitrous Oxide Chamber Methodology Guidelines, 1st ed.; de Klein, C.A.M., Harvey, M.J., Eds.; Ministry for Primary Industries: Wellington, New Zealand, 2013; Volume 4, pp. 56–71. [Google Scholar]
  36. Xiao, Y.; Che, Y.Y.; Zhang, F.G.; Li, Y.; Liu, M.H. Effects of biochar, N fertilizer, and crop residues on greenhouse gas emissions from acidic soils. Clean-Soil Air Water 2018, 46, 1700346. [Google Scholar] [CrossRef]
  37. IPCC. Climate Change 2021: The Physical Science Basis; Cambridge University Press: Cambridge, UK, 2021. [Google Scholar]
  38. Zhang, B.; Liang, C.; He, H.B.; Zhang, X.D. Variations in Soil Microbial Communities and Residues Along an Altitude Gradient on the Northern Slope of Changbai Mountain, China. PLoS ONE 2013, 8, e66184. [Google Scholar] [CrossRef]
  39. Vance, E.D.; Brookes, P.C.; Jenkinson, D.S. An extraction method for measuring microbial biomass C. Soil Biol. Biochem. 1987, 19, 703–707. [Google Scholar] [CrossRef]
  40. Hart, S.C.; Stark, J.M.; Daridson, E.A.; Firestone, M.K. Nitrogen mineralization, immobilization, and nitrification. In Method of Soil Analysis, 1st ed.; Weaver, R.W., Angle, J.S., Bottomley, P.S., Eds.; Soil Science Society of America: Madison, WI, USA, 1994; Volume 2, pp. 985–1018. [Google Scholar]
  41. Li, Z.L.; Zeng, Z.Q.; Tian, D.S.; Wang, J.S.; Wang, B.X.; Chen, H.Y.H.; Quan, Q.; Chen, W.N.; Yang, J.L.; Meng, C.; et al. Global variations and controlling factors of soil nitrogen turnover rate. Earth-Sci. Rev. 2020, 207, 103250. [Google Scholar] [CrossRef]
  42. Kobke, S.; Senbayram, M.; Pfeiffer, B.; Nacke, H.; Dittert, K. Post-harvest N2O and CO2 emissions related to plant residue incorporation of oilseed rape and barley straw depend on soil NO3 content. Soil Tillage Res. 2018, 179, 105–113. [Google Scholar] [CrossRef]
  43. Zhao, S.C.; Qiu, S.J.; Xu, X.P.; Ciampitti, I.A.; Zhang, S.Q.; He, P. Change in straw decomposition rate and soil microbial community composition after straw addition in different long-term fertilization soils. Appl. Soil Ecol. 2019, 138, 123–133. [Google Scholar] [CrossRef]
  44. Li, Z.J.; Reichel, R.; Xu, Z.F.; Vereecken, H.; Bruggemann, N. Return of crop residues to arable land stimulates N2O emission but mitigates NO3 leaching: A meta–analysis. Agron. Sutain Dev. 2021, 41, 66. [Google Scholar] [CrossRef]
  45. Van Groenigen, J.W.; Huygens, D.; Boeckx, P.; Kuyper, T.W.; Lubbers, I.M.; Rutting, T.; Groffman, P.M. The soil N cycle: New insights and key challenges. Soil 2015, 1, 235–256. [Google Scholar] [CrossRef]
  46. Rousset, C.; Clough, T.J.; Grace, P.R.; Rowlings, D.W.; Scheer, C. Soil type, bulk density and drainage effects on relative gas diffusivity and N2O emissions. Soil Res. 2020, 58, 726–736. [Google Scholar] [CrossRef]
  47. Wu, D.; Senbayram, M.; Well, R.; Bruggemann, N.; Pfeiffer, B.; Loick, N.; Stempfhuber, B.; Dittert, K.; Bol, R. Nitrification inhibitors mitigate N2O emissions more effectively under straw-induced conditions favoring denitrification. Soil Biol. Biochem. 2017, 104, 197–207. [Google Scholar] [CrossRef]
  48. Reichel, R.; Wei, J.; Islam, M.S.; Schmid, C.; Wissel, H.; Schröder, P.; Schloter, M.; Brüggemann, N. Potential of wheat straw, spruce sawdust, and lignin as high organic carbon soil amendments to improve agricultural nitrogen retention capacity: An incubation study. Front. Plant Sci. 2018, 9, 900. [Google Scholar] [CrossRef]
  49. Brendecke, J.W.; Axelson, R.D.; Pepper, I.L. Soil microbial activity as an indicator of soil fertility: Long-term effects of municipal sewage sludge on an arid soil. Soil Biol. Biochem. 1993, 25, 751–758. [Google Scholar] [CrossRef]
  50. Yu, H.; Zhang, Z.; Zhang, Y.; Song, Q.D.; Fan, P.; Xi, B.D.; Tan, W.B. Effects of microplastics on soil organic carbon and greenhouse gas emissions in the context of straw incorporation: A comparison with different types of soil. Environ. Pollut. 2021, 288, 117733. [Google Scholar] [CrossRef]
  51. Kuzyakov, Y.; Friedel, J.K.; Stahr, K. Review of mechanisms and quantification of priming effects. Soil Biol. Biochem. 2000, 32, 485–1498. [Google Scholar] [CrossRef]
  52. Blagodatsky, S.; Blagodatskaya, E.; Yuyukina, T.; Kuzyakov, Y. Model of apparent and real priming effects: Linking microbial activity with soil organic matter decomposition. Soil Biol. Biochem. 2010, 42, 1275–1283. [Google Scholar] [CrossRef]
  53. Chen, Z.M.; Wang, H.Y.; Liu, X.W.; Zhao, X.L.; Lu, D.J.; Zhou, J.M.; Li, C.Z. Changes in soil microbial community and organic carbon fractions under short-term straw return in a rice-wheat cropping system. Soil Tillage Res. 2017, 165, 121–127. [Google Scholar] [CrossRef]
  54. Fontaine, S.; Barot, S. Size and functional diversity of microbe populations control plant persistence and long-term soil carbon accumulation. Ecol. Lett. 2005, 8, 1075–1087. [Google Scholar] [CrossRef]
  55. Wang, H.; Hu, G.Q.; Xu, W.H.; Boutton, T.W.; Zhuge, Y.P.; Bai, E. Effects of nitrogen addition on soil organic carbon mineralization after maize stalk addition. Eur. J. Soil Biol. 2018, 89, 33–38. [Google Scholar] [CrossRef]
  56. Shaaban, M.; Wu, Y.; Peng, Q.; Wu, L.; Van Zwieten, L.; Khalid, M.S.; Younas, A.; Lin, S.; Zhao, J.; Bashir, S.; et al. The interactive effects of dolomite application and straw incorporation on soil N2O emissions. Eur. J. Soil Sci. 2018, 69, 502–511. [Google Scholar] [CrossRef]
  57. Yang, S.Q.; Wang, Y.S.; Liu, R.L.; Li, Q.X.; Yang, Z.L. Effects of straw application on nitrate leaching in fields in the Yellow River irrigation zone of Ningxia, China. Sci. Rep. 2018, 8, 954. [Google Scholar] [CrossRef] [PubMed]
  58. Bollmann, A.; Conrad, R. Influence of O2 availability on NO and N2O release by nitrification and denitrification in soils. Glob. Chang. Biol. 1998, 4, 387–396. [Google Scholar] [CrossRef]
  59. Yang, L.Q.; Liu, R.; Ju, X.T. Effect of carbon rate and type amended with ammonium or nitrate on nitrous oxide emissions in a strong ammonia oxidation soil. J. Soil Sediment. 2020, 20, 1253–1263. [Google Scholar] [CrossRef]
  60. Zhu, T.B.; Meng, T.Z.; Zhang, J.B.; Zhong, W.H.; Mueller, C.; Cai, Z.C. Fungi-dominant heterotrophic nitrification in a subtropical forest soil of China. J. Soil Sediments 2015, 15, 705–709. [Google Scholar] [CrossRef]
  61. Cheng, Y.; Cai, Z.C.; Chang, S.; Wang, J.; Zhang, J.B. Wheat straw and its biochar have contrasting effects on inorganic N retention and N2O production in a cultivated Black Chernozem. Biol. Fertil. Soils 2012, 48, 941–946. [Google Scholar] [CrossRef]
  62. Larsen, K.L.; McCartney, D.M. Effect of C:N ratio on microbial activity and N retention: Bench-scale study using pulp and paper biosolids. Compost. Sci. Util. 2000, 8, 147–159. [Google Scholar] [CrossRef]
  63. Lou, Y.S.; Ren, L.X.; Li, Z.P.; Zhang, T.L.; Inubushi, K. Effect of rice residues on carbon dioxide and nitrous oxide emissions from a paddy soil of subtropical China. Water Air Soil Poll. 2006, 178, 157–168. [Google Scholar] [CrossRef]
  64. Yang, H.S.; Yang, B.; Dai, Y.J.; Xu, M.M.; Koide, R.T.; Wang, X.H.; Liu, J.; Bian, X.M. Soil nitrogen retention is increased by ditch-buried straw return in a rice-wheat rotation system. Eur. J. Agron. 2015, 69, 52–58. [Google Scholar] [CrossRef]
  65. Xu, X.F.; Tian, H.Q.; Hui, D.F. Convergence in the relationship of CO2 and N2O exchanges between soil and atmosphere within terrestrial ecosystems. Glob. Chang. Biol. 2008, 14, 1651–1660. [Google Scholar] [CrossRef]
  66. Zhang, A.F.; Cheng, G.; Hussain, Q.; Zhang, M.; Feng, H.; Dyck, M.; Sun, B.H.; Zhao, Y.; Chen, H.X.; Chen, J.; et al. Contrasting effects of straw and straw-derived biochar application on net global warming potential in the Loess Plateau of China. Field Crop Res. 2017, 205, 45–54. [Google Scholar] [CrossRef]
Figure 1. N2O-N flux (a), CO2-C flux (b), and CH4-C uptake flux (c) of treatments during the incubation period. LN, MN, HN, and Nm—low, medium, high, and the mean of soil; LN+S, MN+S, HN+S, and SNm—low, medium, high, and the mean of soil with straw amendment. S, straw amendment; N, soil N level; S × N, the interaction of straw amendment and soil N level. *, ** and *** on numbers indicate significant difference at levels of p < 0.05, p < 0.01 and p < 0.001, respectively. ns, no significant difference (ANOVA). * over symbols indicate significant difference between Nm and SNm in the same incubation point at a p < 0.05 level. Different letters indicate significant differences between treatments at the same incubation point at a p < 0.05 level.
Agronomy 14 02996 g001
Figure 2. Accumulative dynamic and emission of N2O-N (a,d), CO2-C (b,e), and CH4-C (c,f) of treatments during the whole incubation. LN, MN, HN and Nm—low, medium, high, and the mean of soil; LN+S, MN+S, HN+S, and SNm—low, medium, high, and the mean of soil with straw amendment. S, straw amendment; N, soil N level; S × N, the interaction of straw amendment and soil N level. *, ** and *** on numbers indicate significant difference at levels of p < 0.05, p < 0.01, and p < 0.001, respectively. ns, no significant difference (ANOVA). Different lowercase and capital letters indicate significant differences between treatments without/with straw amendment at a p < 0.05 level, respectively.
Agronomy 14 02996 g002
Figure 3. Global warming potential (GWP) of treatments during the whole incubation. LN, MN, HN, and Nm—low, medium, high, and the mean of soil; LN+S, MN+S, HN+S, and SNm—low, medium, high, and the mean of soil with straw amendment. S, straw amendment; N, soil N level; S×N, the interaction of straw amendment and soil N level. *, ** and *** on numbers indicate significant differences at levels of p < 0.05, p < 0.01, and p < 0.001, respectively (ANOVA). Different lowercase and capital letters indicate significant difference between treatments without/with straw amendment at a p < 0.05 level, respectively.
Agronomy 14 02996 g003
Figure 4. Ammonium ((a), NH4+-N), nitrate ((b), NO3-N), and microbial biomass nitrogen ((c), SMBN) concentration dynamics of treatments during the whole incubation period. LN, MN, HN, and Nm—low, medium, high, and the mean of soil; LN+S, MN+S, HN+S, and SNm—low, medium, high, and the mean of soil with straw amendment. S, straw amendment; N, soil N level; S × N, the interaction of straw amendment and soil N level. *, ** and *** on numbers indicate significant differences at levels of p < 0.05, p < 0.01, and p < 0.001, respectively. ns, no significant difference (ANOVA). * over symbols indicate significant difference between Nm and SNm in the same incubation point at a p < 0.05 level. Different letters indicate significant differences between treatments at the same incubation point at a p < 0.05 level.
Agronomy 14 02996 g004
Figure 5. Net ammonification rate ((a) NAR), net nitrification rate ((b) NNR), net nitrogen mineralization rate ((c) NNMR), nitrogen turnover rate ((d) NTR), nitrification potential ((e) NP), and the ratio of ammonium to nitrate (f) of treatments during the incubation period. LN, MN, HN, and Nm—low, medium, high, and the mean of soil; LN+S, MN+S, HN+S, and SNm—low, moderate, high, and the mean of soil with straw amendment. S, straw amendment; N, soil N level; S × N, the interaction of straw amendment and soil N level. *, ** and *** on numbers indicate significant differences at levels of p < 0.05, p < 0.01, and p < 0.001, respectively. ns, no significant difference (ANOVA). * over symbols indicate significant difference between Nm and SNm in the same incubation point at p < 0.05 level. Different letters indicate significant differences between treatments at the same incubation point at a p < 0.05 level.
Agronomy 14 02996 g005
Figure 6. Partial least squares path modeling (PLS-PM) disentangling major pathways of the effects of soil properties on greenhouse gas emissions (GHGs: N2O, CO2 and CH4) and the total effects of these variables on GHGs without straw amendment (a,b) and with straw amendment (c,d). SOC, soil organic C; TN, total nitrogen; C:N ratios, the ratio of SOC to TN; NH4+-N, ammonium concentration; NO3-N, nitrate concentration; SMBN, microbial biomass nitrogen concentration; NAR, net ammonification rate; NNR, net nitrification rate; NNMR, net nitrogen mineralization rate; NTR, nitrogen turnover rate; NP, nitrification potential and NH4+-N: NO3-N, the ratio of ammonium to nitrate. The model’s reliability was assessed using the goodness of fit (GoF). Solid and dotted arrows denote positive and negative causality, respectively. Numbers above the arrow lines are indicative of the correlation and significance standardized path coefficients. R2 indicates the variance of the dependent variable explained by the model.
Agronomy 14 02996 g006
Figure 7. Redundancy analysis (RDA) and random forest mean predictor importance (% increase in MSE) showing the relationship and the relative importance of soil properties on greenhouse gas emissions under the circumstance of straw removal ((a,b): N2O, (c): CO2, (d): CH4) and straw amendment ((e,f): N2O, (g): CO2, (h): CH4). Blue lines represent environmental variables; red lines represent response variables (N2O, CO2 and CH4). Percentage increases in the MSE (mean squared error) of variables were used to estimate the importance of these predictors, and higher MSE% values imply more important predictors. Significance levels of each predictor are as follows: * p < 0.05 and ** p < 0.01. SOC, soil organic C; TN, total nitrogen; C:N ratios, the ratio of SOC to TN; NH4+-N, ammonium concentration; NO3-N, nitrate concentration; SMBN, microbial biomass nitrogen concentration; NAR, net ammonification rate; NNR, net nitrification rate; NNMR, net nitrogen mineralization rate; NTR, nitrogen turnover rate; NP, nitrification potential; and NH4+-N: NO3-N, the ratio of ammonium to nitrate. MSE, mean squared error.
Agronomy 14 02996 g007
Table 1. Characteristics of the experimental straw and soil.
Applied SubstanceSOC
(g kg−1)
TN
(g kg−1)
C:NNH4+-N
(mg kg−1)
NO3-N
(mg kg−1)
NH4+-N: NO3-NpH
Straw420.811.636.4264.0692.00.4-
SoilLN9.3 b0.9b9.9 a11.3 c8.3 c1.4 b5.8 a
MN10.6 b1.0b10.2 a15.1 b9.7 b1.6 a5.4 a
HN15.5 a1.2a12.7 a28.9 a39.7 a0.7c5.0 a
LN, low-N soil; MN, medium-N soil; HN, high-N soil. TC, total carbon; TN, total nitrogen; C:N, the ratio of carbon to nitrogen contents; NH4+-N, ammonium content; NO3-N, nitrate content. Different letters indicate significant differences between experimental soils at p < 0.05 level.
Table 2. The N trade-off in the incubation system.
TreatmentInitialInputIdeal
TN
(mg)
Δ
NH4+-N (mg)
Δ
NO3-N
(mg)
Δ
Mineral-N
(mg)
N2O-N
(μg)
Balance
(μg)
R1
(‱)
TN
(mg)
NH4+-N (mg)NO3-N
(mg)
NH4+-N (mg)Straw-N
(mg)
−SLN28.30 b0.34 c0.25 c1.5029.80 d1.32 b0.44 b1.77 c0.27 d1499.73 b0.09 c
MN31.20 b0.45 b0.29 b1.5032.70 cd1.40 b0.63 a2.03 b0.34 cd1499.66 b0.10 c
HN37.30 a0.87 a1.19 a1.5038.80 b1.82 a0.64 a2.45 a2.71 b1497.29 b0.70 b
Nm32.27 A0.55 A0.58 A1.5033.77 B1.51 A0.57 A2.08 A1.11 B1498.89 B0.30 A
+SLN28.30 b0.34 c0.25 c1.506.9536.75 bc−0.18 c−0.14 c−0.31 d0.61 cd8453.39 a0.17 c
MN31.20 b0.45 b0.29 b1.506.9539.65 b−0.22 c−0.13 c−0.35 d0.70 c8453.30 a0.18 c
HN37.30 a0.87 a1.19 a1.506.9545.75 a−0.23 c−0.96 d−1.19 e4.71 a8449.29 a1.04 a
Nm32.27 A0.55 A0.58 A1.506.9540.72 A−0.21 B−0.41 B−0.62 B2.01 A8451.99 A0.46 A
LN, low-N soil; MN, medium-N soil; HN, high-N soil; Nm, the average of soil. TN, total nitrogen; NH4+-N, ammonium; NO3-N, nitrate; straw-N, the nitrogen from straw; ideal TN, the amount of TN of the whole system with applied exogenous nitrogen under ideal circumstances; Δ, the difference between final and initial incubation; balance, the variation in N from initial to finial incubation; R1, the ratio of N2O-N to ideal TN. Different lowercase letters indicate significant difference between treatments and different capital letters indicate significant difference between treatments without/with straw amendment in the incubation system at a p < 0.05 level. Positive and negative values mean accumulation and consumption, respectively. The nitrogen from straw was supposed to enter the total N pool of the whole incubation system, and the parts of mineral form were ignored here.
Table 3. The C trade-off in the incubation system.
TreatmentInitial
TC
(g)
Input
Straw-C
(g)
Ideal
TC
(g)
CO2-C
(mg)
CH4-C
(μg)
Balance
(mg)
R2
(%)
−SLN0.28 b-0.28 c2.71 c1.814 b−2.707 c0.97 d
MN0.32 b-0.32 c2.69 c1.849 a−2.691 c0.85 d
HN0.46 a-0.46 b3.51 c1.846 a−3.506 c0.77 d
Nm0.35 A-0.35 B2.97 B1.836 A−2.968 B0.86 B
+SLN0.28 b0.250.53 b67.97 a1.814 b184.51 b12.79 a
MN0.32 b0.250.57 b55.49 b1.799 b196.99 a9.74 b
HN0.46 a0.250.71 a54.55 b1.807 b197.93 a7.63 c
Nm0.35 A0.250.60 A59.34 A1.807 B193.14 A10.05 A
LN, low-N soil; MN, medium-N soil; HN, high-N soil; Nm, the average of soil. TC, the total carbon; straw-C, the carbon from straw; ideal TC, the amount of TC of the whole system when applied with exogenous carbon under ideal circumstances; balance, the variation in C from initial to finial incubation; R2, the ratio of CO2-C to ideal TC. Different lowercase letters indicate significant differences between treatments, and different capital letters indicate significant differences between treatments without/with straw amendment in the incubation system at a p < 0.05 level, respectively. Positive and negative values mean accumulation and consumption, respectively. The C from straw was supposed to enter the total carbon pool of the whole incubation system.
Disclaimer/Publisher’s Note: The statements, opinions and data contained in all publications are solely those of the individual author(s) and contributor(s) and not of MDPI and/or the editor(s). MDPI and/or the editor(s) disclaim responsibility for any injury to people or property resulting from any ideas, methods, instructions or products referred to in the content.

