Article

Optimizing Genomic Selection Methods to Improve Prediction Accuracy of Sugarcane Single-Stalk Weight

1
School of Breeding and Multiplication (Sanya Institute of Breeding and Multiplication)/National Key Laboratory for Tropical Crop Breeding, Hainan University, Sanya 572025, China
2
School of Tropical Agriculture and Forestry, Hainan University, Danzhou 571737, China
3
National Key Laboratory for Biological Breeding of Tropical Crops, Kunming 650205, China
4
Yunnan Key Laboratory of Sugarcane Genetic Improvement/Sugarcane Research Institute, Yunnan Academy of Agricultural Sciences, Kaiyuan 661699, China
*
Authors to whom correspondence should be addressed.
These authors contributed equally to this work.
Agronomy 2024, 14(12), 2842; https://doi.org/10.3390/agronomy14122842
Submission received: 29 October 2024 / Revised: 18 November 2024 / Accepted: 22 November 2024 / Published: 28 November 2024
(This article belongs to the Section Crop Breeding and Genetics)

Abstract

:
Sugarcane (Saccharum spp. Hybrids), serving as a vital sugar and energy crop, holds immense development potential on a global scale. In the process of sugarcane breeding and variety improvement, single-stalk weight stands as a crucial selection criterion. By cultivating sugarcane varieties with heavier single stalks, robust growth, high yields, and superior quality, the planting efficiency and market competitiveness of sugarcane can be further enhanced. Single-stalk weight was determined by measuring individual stalks three times in the field, calculating the average value as the phenotypic expression. The distribution of single-stalk weights in the orthogonal and reciprocal populations revealed coefficients of variation of 19.3% and 17.7%, respectively, with the reciprocal population showing greater genetic stability. After rigorous filtering of Hyper_seq_FD sequencing data from 409 sugarcane samples, we identified 31,204 high-quality single-nucleotide polymorphisms (SNPs) evenly distributed across all 32 chromosomes, providing a comprehensive representation of the sugarcane genome. In this study, we evaluated the predictive performance of various genomic selection (GS) methods for single-stalk weight in the 299 orthogonal population, with the male parent being GZ_73-204 and the female parent being GZ_P72-1210, and in the 108 reciprocal population, with the male parent being GZ_P72-1210 and the female parent being GZ_73-204. Initially, we compared the performance of five prediction approaches, including genomic best linear unbiased prediction (GBLUP), single-step genomic best linear unbiased prediction (SSBLUP), Bayes A, machine learning (ML), and deep learning (DL) approaches. The results showed that the GBLUP model had the highest prediction accuracy, at 0.35, while the deep learning model had the lowest accuracy, at 0.20. To improve prediction accuracy, we assigned different scores to various regions of the sugarcane genome based on gene annotation information, thereby giving different weights to SNPs located in these regions. Additionally, we incorporated inbred and outbred populations as fixed effects into the model. The optimized SSBLUP model achieved a prediction accuracy of 0.44, which was a 17% improvement over the original SSBLUP model and a 9% increase compared to the originally optimal GBLUP model. The research results indicate that it is crucial to fully consider genomic structural regions, population structure characteristics, and fixed effects in GS predictions.

1. Introduction

Sugarcane (Saccharum spp. Hybrids) is a significant sugar and energy crop and is one of the most widely cultivated crops globally, surpassing staple crops like rice, maize, and wheat in production volume [1,2]. As the leading source of sugar and a key contributor to bioethanol production, sugarcane generates over 80% of the world’s sugar and 40% of bioethanol, with an estimated annual economic impact of up to USD 90 billion [2]. Thanks to continuous advancements in breeding technologies and methodologies, sugarcane breeding has significantly improved, leading to substantial increases in sugarcane yields, which has provided a vast amount of necessary sugar and fuel ethanol essential for human development [3]. Breeding has entered the 4.0 era, characterized by smart breeding that combines genotype- and phenotype-based technologies, yet sugarcane breeding remains in a transitional phase, lagging behind major crops like corn and rice [4,5,6]. China’s sugarcane breeding methods are conservative, with a lengthy cycle from parent selection to variety release, resulting in large investments and low efficiency, indicating a significant gap in the adoption of modern breeding techniques [6]. The relatively slow genetic gain rate in sugarcane can be attributed to two main reasons: the long breeding cycle and the low heritability of major commercial traits [7]. Additionally, sugarcane is a highly polyploid plant with a complex genetic background [8]. Unlike other allopolyploid plants (such as rapeseed, wheat, and cotton), modern cultivated sugarcane originated from the hybridization of two primitive sugarcane species (Saccharum spontaneum L. and Saccharum officinarum L.), followed by multiple rounds of backcrossing. This complex hybridization process significantly increases the complexity of its genome compared to its ancestors, resulting in a hybrid genome that includes a mixture of aneuploidy and allopolyploid chromosomes, with chromosomes unevenly inherited from the two polyploid ancestor species. The extremely high ploidy and extensive recombination between the two sub-genomes pose great challenges for whole-genome assembly and analysis in cultivated sugarcane [8]. In facing the multiple challenges posed by the rapid growth of the world’s population, the reduction of arable land, biotic and abiotic stresses in the future, the limitations of genetic diversity in major sugarcane cultivars, cultivar degeneration, the lack of innovative varieties, and issues of excessively long breeding cycles and difficulties in combining favorable genes cannot be ignored [9].
The complex polyploid characteristics and aneuploidy have long hindered progress in gene typing and genetic mapping in sugarcane breeding. Recently, high-quality sugarcane genomes have been successfully sequenced, revealing significant genomic variation. The genome size of S. officinarum ranges from 7.50 to 8.55 Gb, while that of S. spontaneum varies from 3.36 to 12.64 Gb [10]. Modern cultivated sugarcane varieties comprise approximately 75% to 85% of their genome from S. officinarum and 15% to 25% from S. spontaneum [11]. These high-quality reference genomes lay a solid foundation for the development of molecular markers for polyploid crops. For 167 sugarcane materials, researchers employed four genomic prediction models, including bayesianLASSO, to predict ten key traits such as plant morphology and disease resistance, with prediction accuracies ranging from 0.11 to 0.62 [12]. Subsequently, another study utilized 2351 sugarcane materials and adopted five models, including Bayes A and Bayes B, to predict sugarcane yield and sugar content, achieving prediction accuracies between 0.25 and 0.45 [13]. Furthermore, a separate study conducted genome-wide selection predictions for complex traits in sugarcane using three models, resulting in prediction accuracies of 0.3 to 0.44 [14]. In terms of sugarcane disease resistance, resistance assessments were conducted on 432 sugarcane materials, yielding 8825 SNP loci, and multiple prediction models were constructed. These models achieved prediction accuracies of 0.28 to 0.4 for brown rust (Puccinia melanocephala H. Sydow and P. Sydow) and 0.13 to 0.29 for yellow rust (Puccinia kuehnii Butler). Further research revealed that incorporating known resistance genes as fixed effects in the prediction models can significantly reduce the number of markers and the size of the training dataset required, thereby improving prediction accuracy [15].
In this study, our objective is to experimentally evaluate the performance of different genomic selection (GS) methods in predicting the key trait of single-stalk weight in sugarcane. During the process of optimizing the prediction model, we assigned different weights to single-nucleotide polymorphism (SNP) loci based on the characteristics of the genome structure and innovatively incorporated both orthogonal and reciprocal cross populations as fixed effect variables into the model. We anticipate that these refined adjustments will enable more precise prediction outcomes in sugarcane, a crop with an extremely complex genetic background and high heterozygosity.

2. Materials and Methods

2.1. DNA Extraction and Genotyping

We collected 409 sugarcane samples, including 299 from the orthogonal population and 108 from the reciprocal population with parent plants GZ_P72-1210 and GZ_73-204. Young leaves were collected from each sugarcane sample and freeze-dried. The freeze-dried leaves were then sampled using a punch and ground into fine powder using tungsten beads and a reciprocating shaker. The improved cetyltrimethylammonium bromide (CTAB) method [16] was used to extract genomic DNA from sugarcane leaves. After detecting and quantifying the concentration by 1% agarose gel electrophoresis, the working DNA solution was diluted to 100 ng/µL and stored at −20 °C. The Hyper-seq FD approach [17] was then used to construct a library of 409 sugarcane DNA samples. The library underwent high-throughput sequencing in an Illumina HiSeq2000 apparatus (Illumina Inc., San Diego, CA, USA) for 400 Gb of sequence data from 409 sugarcane germplasms.
Clean reads were then aligned to the Saccharum spontaneum AP85-441 reference genome [11] using BWA [18], and SNP and INDEL discovery and genotyping were performed across all 409 samples simultaneously using standard hard filtering parameters or variant quality score recalibration according to GATK Best Practices recommendations [19].

2.2. Determination of Stem Heaviness

A total of 409 germplasm materials, comprising 299 from the orthogonal population with the male parent GZ_73-204 and the female parent GZ_P72-1210 and 108 from the reciprocal population with the male parent GZ_P72-1210 and the female parent GZ_73-204, were planted in the Sugarcane Research Institute, Yunnan Academy of Agricultural Sciences, at coordinates (103°15′45″ E, 23°42′36″ N) with an elevation of 1050 m, in Kaiyuan, Yunnan Province, China. All germplasms are F1 progeny from crosses between GZ_P72-1210 and GZ_73-204. The planting was conducted in March 2022 using a random block design and two repeated experiment designs. Each repeated planting consisted of two rows, surrounded by protection rows, with a length of 4.0 m and row spacing of 1.0 m, and the seed quantity was 90,000 shoots/ha. During the two growing seasons from 2022 to 2023, the single-stalk weight of the 409 materials was determined by measuring the weight of individual stalks three times in the field and calculating the average value as the phenotypic expression for single-stalk weight.

2.3. Broad-Sense Heritability and the Coefficient of Variation

To calculate the broad-sense heritability (H2) [20] and the coefficient of variation (CV) for the given populations, we can use the following formulas:
H 2 = σ G 2 σ P 2 ,   σ P 2 = σ G 2 + ( σ G 2 / y ) + ( σ e 2 / r y ) ,   C V = σ μ × 100 % ,
where σ G 2 is the genetic variance; σ P 2 is the phenotypic variance; σ G y 2 and σ e 2 are interaction variance for genotype by year and error, respectively; y and r are the number of year and replication, respectively; σ is the standard deviation of phenotypic values; and μ is the mean of phenotypic values.

2.4. Genomic Relationship Matrices

Unweighted genomic relationship matrices (GRM) for the 409 training sugarcane were obtained following Van Raden’s method [21]:
G = Z Z i = 1 m 2 p i q i .
where Z is a matrix of SNP genotypes Z i j , p i is the allele frequency of the i-th SNP, and q i = ( 1 p i ) . Allele frequencies were calculated using all genotypes in G.
Assume a priori unequal SNP variances:
var ( s ) = σ s , 1 2 0 0 0 σ s , 2 2 0 0 0 0 σ s , m 2
where σ s , i 2 is the variance of the i-th SNP effect and m is the number of SNPs. Then, it is possible to use a SNP-BLUP with these variances, and GRM can include a diagonal matrix D of “weights”, w i = m σ s , i 2 i = 1 m σ s , i 2 such that: G = Z D Z i = 1 m 2 p i q i .

2.5. Scoring of Genomic Regions

Based on the gene structure annotation file of the AP85-441 reference genome, a custom script named “longest_transcript_structure.py” was used to first extract the longest transcript. Then, based on the cds and utr, the intervals of introns and upstream regions (set at 1000 bp in this case, but customizable according to actual needs) of the longest transcript were calculated. Ultimately, annotation information for the upstream, utr, cds, and intron intervals of each longest transcript was obtained. Another custom script, “score_genome_regions.py”, was used to assign different scores to each site across the entire genome based on the interval annotation information of the longest transcripts, categorizing them into different regions (non-genic regions, upstream regions of transcripts, utr regions, cds, and intron regions). The “calculate_weights.py” script was then used to assign scores and weights to each SNP site based on the score information of the entire genome. All scripts and parameter files can be found in the Supplementary Materials.

2.6. Estimation of GEBVs

The genomic estimated breeding values (GEBVs) of all genotyped individuals were estimated using five methods. Predictions using Bayes A, machine learning (ML), and deep learning (DP) methods were conducted using the Smart Breeding Platform (https://sbp.ibreed.cn, accessed on 18 Ocotober 2024) [22]. The calculation of GRM and predictions using GBLUP and SSBLUP methods were completed using the BLUPF90 [23] series of tools. The prediction accuracy (r) is the average of five repetitions of N-fold cross-validation. In each repetition, the samples were randomly arranged and divided into N parts, with N-1 parts used as training data and the remaining part as test data in rotation, and the correlation between the true and predicted values was calculated: GBLUP_W: GBLUP with weights assigned to SNPs based on their genomic regions. GBLUP_F: GBLUP incorporating fixed effects for crosses (orthogonal and reciprocal populations). GBLUP_F_W: GBLUP with both weighted SNPs and fixed effects for crosses. SSBLUP_W: SSBLUP with weights assigned to SNPs based on their genomic regions. SSBLUP_F: SSBLUP incorporating fixed effects for crosses (orthogonal and reciprocal populations). SSBLUP_W: SSBLUP with weights assigned to SNPs based on their genomic regions.

3. Result

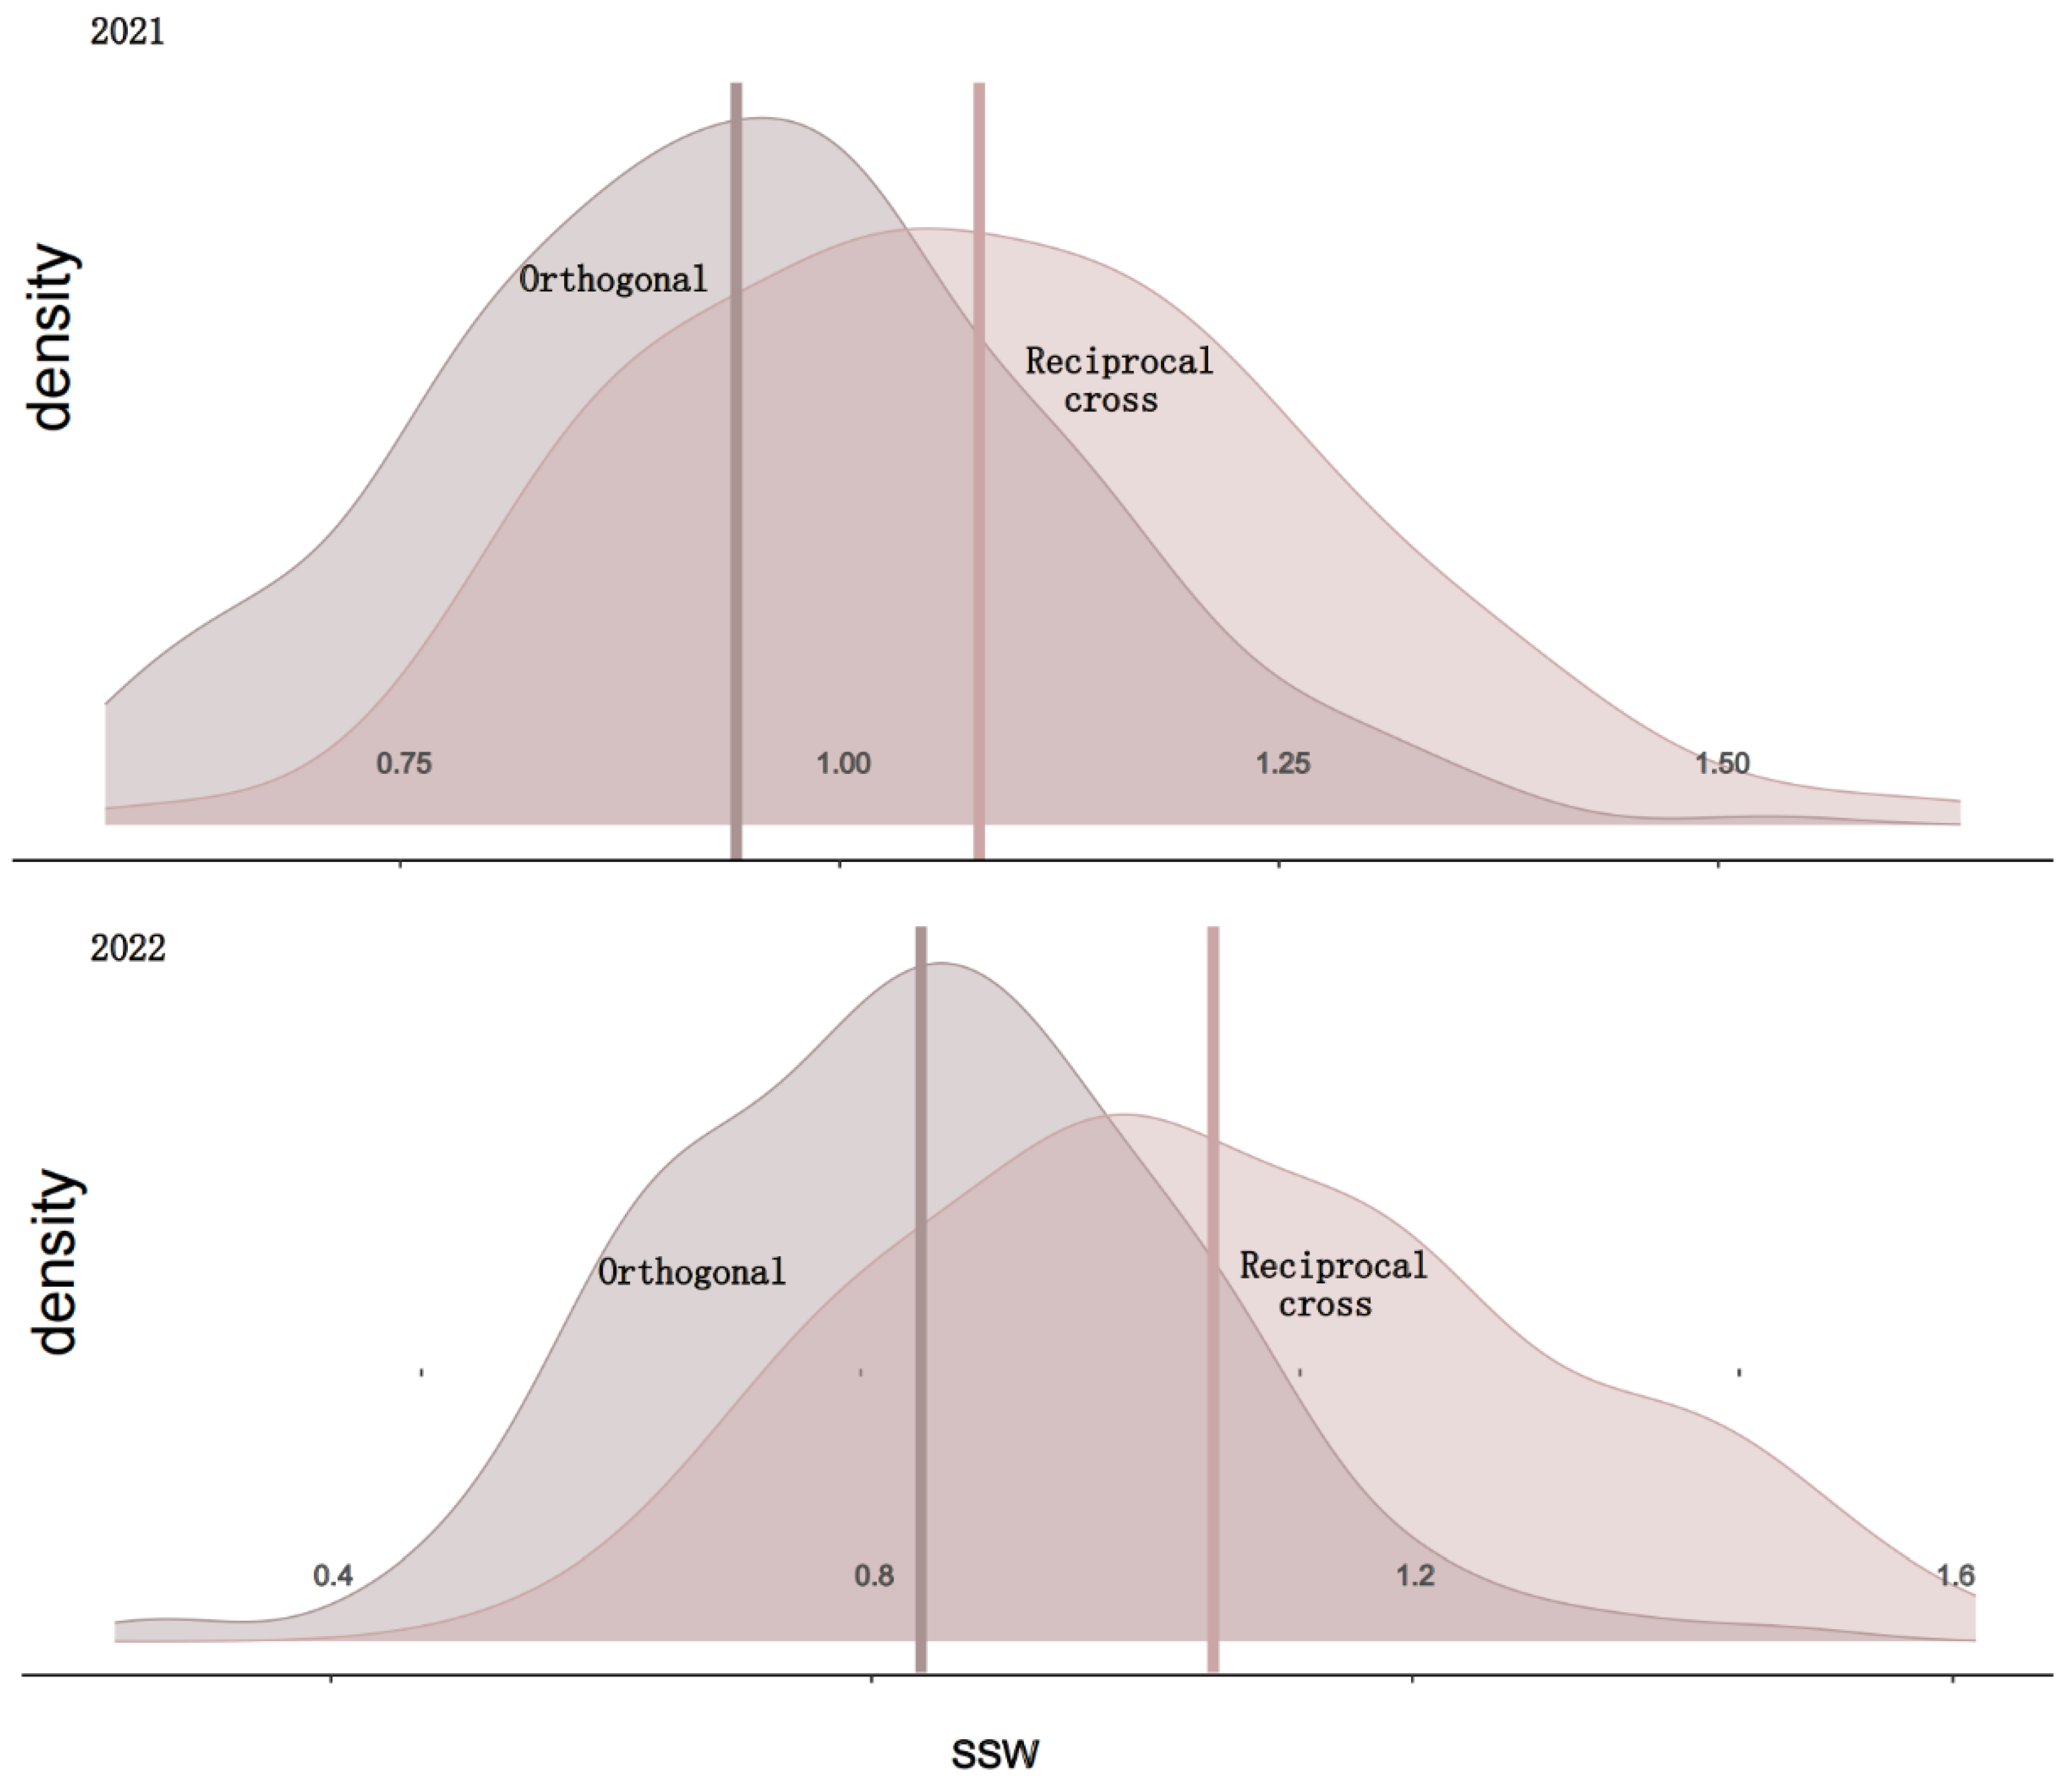
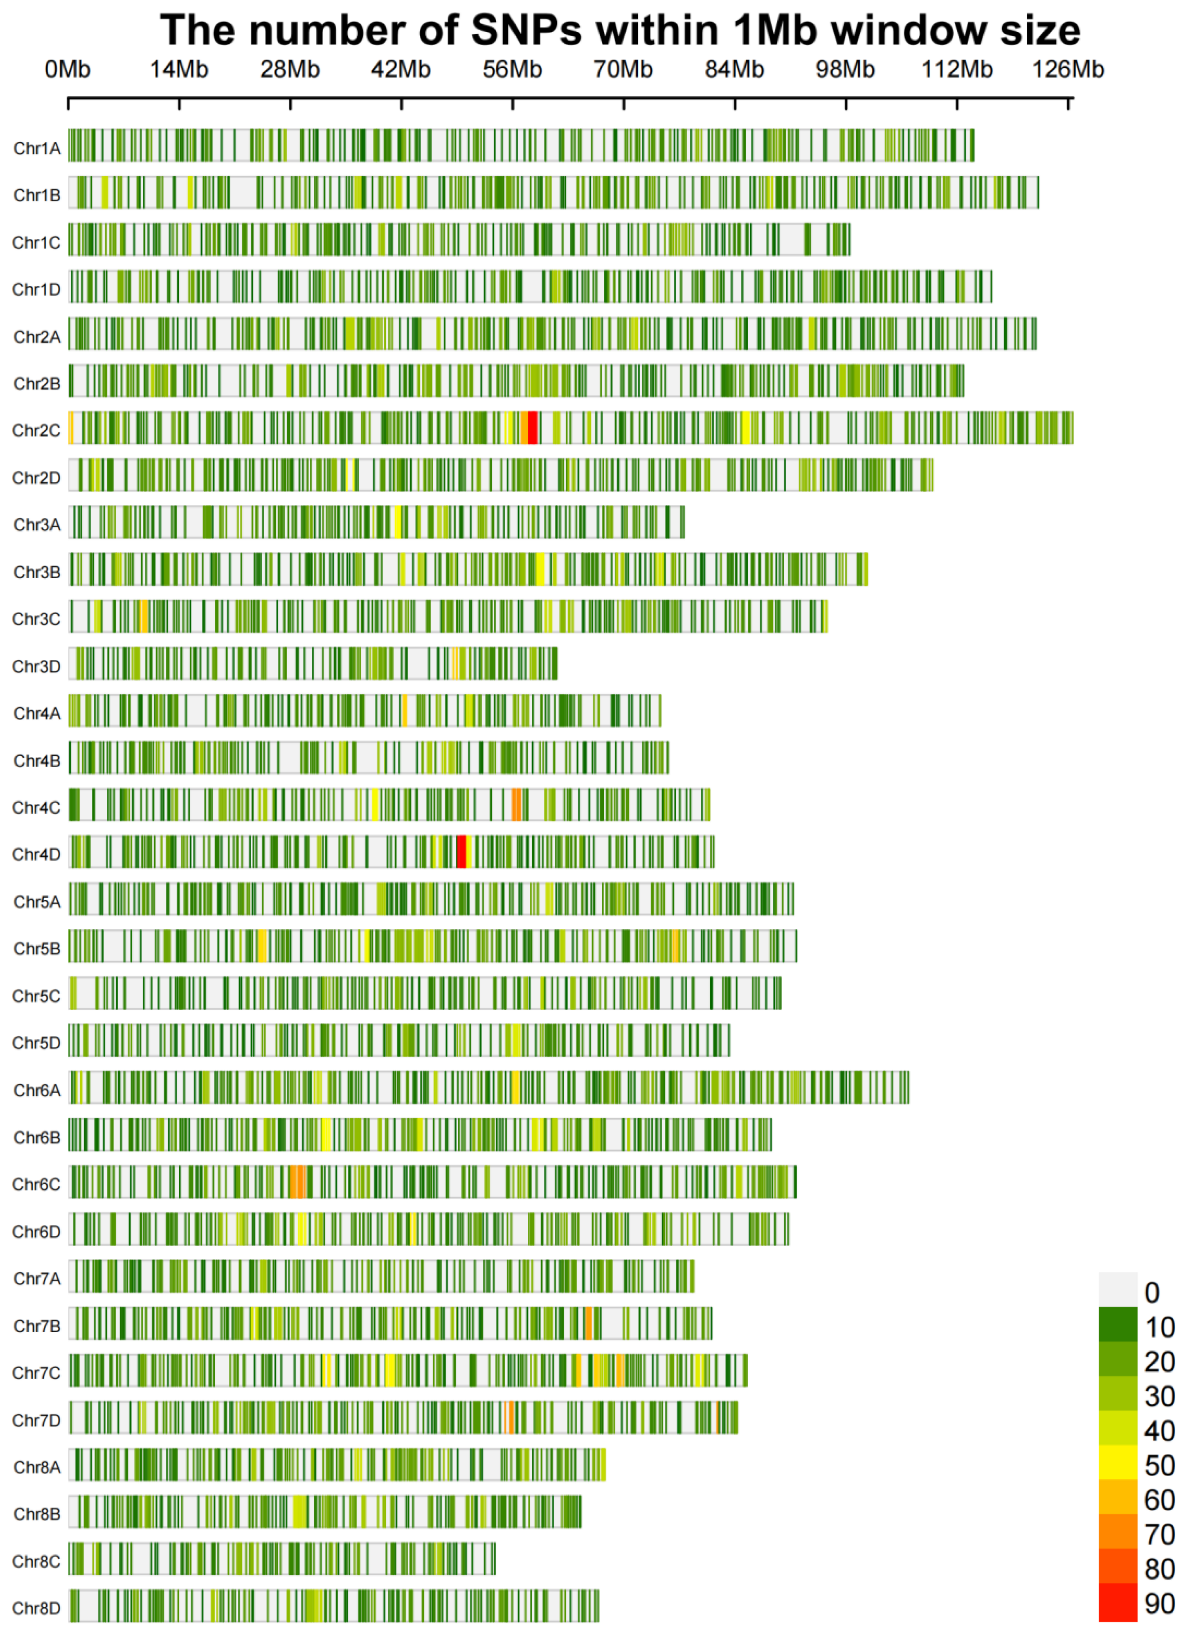
3.1. Phenotyping and Genotyping

Single-stalk weight (SSW) is one of the important indicators for assessing sugarcane yield and quality. By measuring SSW, we can evaluate the growth status, nutrient accumulation, and ultimate yield potential of sugarcane. To determine the genetic basis of the SSW trait in sugarcane, we collected SSW phenotypic data from 299 samples of an orthogonal population and 108 samples of a reciprocal population over the years 2021 and 2022 for evaluation. The results showed that the coefficients of variation for the orthogonal and reciprocal populations were 19.3% and 17.7%, respectively (Table 1), with the orthogonal population exhibiting slightly higher variability than the reciprocal population. Additionally, the combined heritability for the reciprocal population over the two years was calculated to be 0.88, slightly higher than that of the orthogonal population, indicating greater genetic stability in the reciprocal population. The distribution of SSW in the orthogonal and reciprocal populations for the years 2021 and 2022 is shown in Figure 1. The distribution charts for both populations across the two years reveal that the SSW of the reciprocal population is generally higher than that of the orthogonal population. The distribution of SSW in both populations for both years follows a normal distribution, which meets the requirements for subsequent GS analysis.
After conducting variant detection and rigorous filtering on the Hyper_seq_FD sequencing data of 409 sugarcane samples, a total of 31,204 high-quality SNPs were obtained. These SNPs were evenly distributed across all 32 chromosomes (Figure 2). This indicates that our Hyper_seq_FD dataset can effectively represent the variation distribution in sugarcane and the overall genomic variation of sugarcane, enabling accurate genotyping of the 409 sugarcane samples.

3.2. Performance Comparison Between Genomic Selection Models

Using a total of 409 genotyped samples from both the orthogonal and reciprocal populations of sugarcane, we conducted GS predictions for single-stalk weight. The prediction accuracy of each model was calculated based on the average value obtained from five-fold cross-validation. The results indicated that among the five models, the GBLUP model had the highest prediction accuracy, reaching 0.35, while the deep learning model had the lowest accuracy, at only 0.20. Additionally, the accuracy of the machine learning model (0.29) was not significantly better than that of the traditional statistical models (Figure 3A). Therefore, in subsequent research, we chose to optimize and enhance the GBLUP and SSBLUP models, which are mature and widely used in breeding practice.
To improve the prediction accuracy of single-stalk weight, we scored the entire genomic region based on structural annotations and assigned different weights to SNPs located within these regions according to their scores (Figure 4). Using these SNPs with different weights, we constructed a weighted genomic relationship matrix and then used the GBLUP and SSBLUP models to predict the single-stalk weight of sugarcane. The results showed that, compared to the unweighted models, the accuracy of the weighted GBLUP model improved by 2%, and the accuracy of the weighted SSBLUP model also improved by 2% (Figure 3B).
To further enhance prediction accuracy, based on an in-depth analysis of the phenotypes, we observed certain differences in the distribution of single-stalk weight between the orthogonal and reciprocal populations of sugarcane. In light of this, we treated orthogonal and reciprocal crosses as classification variables and incorporated them as fixed effects into the prediction models. The prediction results showed that after introducing fixed effects into the GBLUP model, the prediction accuracy increased to 0.42, representing a 7% improvement, whereas in the SSBLUP model, the prediction accuracy rose to 0.43, marking a 16% increase. Furthermore, in the optimal SSBLUP model with weighted processing and the inclusion of fixed effects, the prediction accuracy reached 0.44, which was a 9% improvement compared to the original optimal GBLUP model without weighting (Figure 3C).

4. Discussion

4.1. Advancements in Genomic Selection Markers for Sugarcane

Modern commercial sugarcane varieties originate from interspecific hybridization between two polyploid species—domesticated sugarcane (Saccharum officinarum L.) and wild sugarcane (Saccharum spontaneum L., with a chromosome number of 2n = 40–120)—followed by multiple generations of backcrossing with S. officinarum [24]. As a result, the genomes of the resulting hybrids are extremely complex and large, approximately 10 Gb in size, with a ploidy level of about 12× and a chromosome number ranging from 100 to 130 [25,26]. This enormous and highly complex genome of sugarcane makes it difficult for breeders to fully exploit the rapid development of whole-genome sequencing technology to significantly improve breeding efficiency, as they have done in other crops. Due to the characteristics of polyploidy, aneuploidy, and high levels of heterozygosity in sugarcane, obtaining reliable molecular markers for genomic regions closely linked to desired traits becomes exceptionally challenging, which greatly limits the application of marker-assisted selection (MAS) in sugarcane and restricts its routine use to a few major resistance genes, such as the two primary resistance loci against brown rust, one of the most important and widely spread diseases in sugarcane: Bru1 [27] and Bru2 [28], along with the associated molecular markers R12H16 and 9O20-F4 [29].
When breeders aim to further advance GS breeding in sugarcane, the first challenge they must confront is obtaining molecular markers covering the entire genome to enable accurate and reliable genotyping of each individual. Given the enormous genome size of sugarcane, whole-genome sequencing for each individual is impractical. Considering both cost and efficiency, previous GS breeding researchers in sugarcane have typically used gene chips for genotyping. Gouy et al. [12] conducted the first GS study in sugarcane, utilizing 1499 Diversity array technology (DArT) markers, which were insufficient to cover the 10 Gb sugarcane genome. Deomano et al. [14], Hayes et al. [13], and Yadav et al. [30] used Affymetrix Axiom SNP array genotyping data. However, the upfront design of SNP chips is time-consuming and can only detect known variation types at known SNP sites. The high ploidy and heterozygosity of sugarcane significantly increase the likelihood of unknown variation types being introduced into subsequent breeding populations within the GS breeding cycle. This results in the specificity of SNP chips for sugarcane varieties, rather than their universal applicability across varieties. In our study, we used 31,204 high-quality SNPs generated by sequencing-based Hyper-seq FD genotyping technology, which are evenly distributed across the 32 chromosomes of the sugarcane genome. Compared to SNP chip markers, these SNPs are more representative of the entire genome and can continuously detect new variation types in subsequent breeding populations, providing accurate and dynamically updated genotyping results for GS breeding. This is of great significance for the optimization of GS predictions and the application of subsequent breeding selection.

4.2. Model Comparisons and Prediction Accuracy in Genomic Selection

The factors influencing the prediction accuracy of GS breeding values are diverse, including model assumptions, marker density, number of quantitative trait loci (QTL), known genes or loci, sample size, heritability, genetic structure of traits, and correlations between individuals [31]. Previous studies have shown that the optimal prediction model often varies for different crop species and tested traits [32]. Therefore, in our study, we compared the prediction accuracy of five models and found that the GBLUP model had the highest prediction accuracy, reaching 0.35, while the deep learning model had the lowest prediction accuracy, at only 0.20. This result is consistent with previous research, indicating that in some scenarios, traditional statistical models still demonstrate high predictive power, whereas deep learning models may not achieve ideal fitting effects when the sample size is limited [33].

4.3. Enhancing Genomic Selection Through Weighted SNPs and Fixed Effects

Unlike MAS, which is limited to using markers associated with specific traits, GS utilizes markers across the entire genome to define the genetic relatedness between individuals. In breeding practice, due to various constraints, there are often a large number of individuals for which genotypic data is lacking, but pedigree and phenotypic information are available. The SSGBLUP method cleverly integrates the pedigree-based relationship matrix with the genome-based relationship matrix to construct a new relationship matrix, enabling the simultaneous estimation of breeding values for both genotyped and non-genotyped individuals. Traditional GBLUP and SSGBLUP models are based on the assumption that all markers have the same genetic variance. When using SNPs as molecular markers, these models assume that all SNPs contribute equally to the total genetic variation. However, in reality, SNPs closer to major causal variants explain more of the variation than other SNPs. To address this, many studies have adopted Bayes series methods, which can identify SNPs with significant effects and accordingly increase the proportion of variance they explain [34]. However, in practice, Bayes models based on Monte Carlo Markov chain (MCMC) sampling methods often have more parameters to estimate. If the parameters are not properly adjusted, these Bayes models may not outperform traditional BLUP models in accuracy but instead increase the computational burden, compromising the timeliness of breeding efforts. In this study, we assigned different weights to SNPs located in different structural regions of the sugarcane genome. The kinship matrix constructed using the weighted SNPs can more accurately capture the genetic structure of the genome. When we applied this weighting method to the GBLUP and SSBLUP models, we found that the prediction accuracy for sugarcane SSW improved by 2%. This result demonstrates the potential of our weighting method for the entire genome structure to enhance the predictive performance of the models.
In some crops, such as corn and wheat, integrating SNPs, QTLs, and gene loci with significant effects as fixed effects into GS models can significantly improve prediction accuracy compared to GS models that only include random effects [35,36,37]. In GS breeding of sugarcane, Islam et al. [32] incorporated genotypic data from the known Bru1 locus as a fixed effect into the model, significantly enhancing the prediction accuracy for BR. During the phenotypic analysis of sugarcane’s reciprocal populations, we observed differences in variability and genetic stability between the two populations and added these as fixed effects into the model. The results showed that after incorporating the fixed effects, the prediction accuracy of the GBLUP and SSBLUP models increased by 7% and 16%, respectively. This finding underscores the importance of fully considering population structure and incorporating fixed effects in GS predictions.
In summary, this study focused on the key trait of sugarcane SSW (single-stalk weight) and compared the prediction accuracy of various GS models. We further optimized the GS prediction model for sugarcane single-stem weight. Ultimately, the SSBLUP_F_W model, which incorporates weighted SNP sites and fixed effects from both reciprocal populations, achieved a 9% improvement in prediction accuracy compared to the GBLUP model. Specifically, we successfully enhanced the predictive performance of both GBLUP and SSBLUP models by implementing strategies such as weighting SNP sites located in different genomic structural regions and considering population structure and fixed effects. Future research can further explore other factors that may affect prediction accuracy, such as environmental effects and gene–environment interactions. Additionally, integrating multi-omics data (e.g., transcriptome, metabolome data) and introducing advanced machine learning algorithms are promising approaches to further improve the accuracy and robustness of prediction models in sugarcane GS breeding. We anticipate achieving more efficient selection and improvement in sugarcane breeding, thereby promoting sustainable development and productivity enhancement in the sugarcane industry.

5. Conclusions

This study demonstrates the potential of genomic selection (GS) in predicting single-stalk weight in sugarcane, with the GBLUP model showing the highest accuracy. By weighting SNPs based on genomic regions and incorporating fixed effects for crosses, we achieved a 9% improvement in prediction accuracy over the original GBLUP model. These findings emphasize the importance of considering sugarcane’s complex genome in GS models.
While our findings show a positive trend, it is important to recognize the limitations of this research. The genetic models we have developed are tailored to the specific populations and environmental conditions of our study sites, which may limit their universal applicability. Furthermore, the complex nature of the sugarcane genome and the current limitations in genetic marker coverage suggest that our models may not fully capture all genetic variations associated with single-stalk weight, indicating a need for continuous research and model refinement.
Future research can further explore other factors that may affect prediction accuracy, such as environmental effects and gene-environment interactions. Additionally, integrating multi-omics data (e.g., transcriptome, metabolome data) and introducing advanced machine learning algorithms are promising approaches to further improve the accuracy and robustness of prediction models in sugarcane GS breeding. We anticipate achieving more efficient selection and improvement in sugarcane breeding, thereby promoting sustainable development and productivity enhancement in the sugarcane industry.

Supplementary Materials

The following supporting information can be downloaded at: https://www.mdpi.com/article/10.3390/agronomy14122842/s1, Sugarcane_phenotypes.txt; pedigree.txt; phenotypes and pedigree.xlsx; variants_with_weights.txt; longest_transcript_structure.py; score_genome_regions.py; calculate_weights.py.

Author Contributions

Conceptualization, Z.X., F.Z. and M.Z.; methodology, Z.W. and C.X.; software, Y.L. and Z.W.; formal analysis, Q.L.; investigation, Q.L.; resources, F.Z., data curation, C.X.; writing—original draft preparation, Z.W.; writing—review, Z.X., C.X. and Z.W., writing—editing, C.X. and Z.W.; visualization, Y.L.; supervision, Z.X., F.Z. and M.Z.; project administration, Z.X., F.Z. and M.Z.; funding acquisition, Z.X., F.Z. and M.Z. All authors have read and agreed to the published version of the manuscript.

Funding

This research was supported by the Project of National Key Laboratory for Tropical Crop Breeding (No. NKLTCB202318), National Natural Science Foundation of China (32060505, 31660418). Supported by High-performance Computing Platform of YZBSTCACC.

Data Availability Statement

Data will be made available on request.

Acknowledgments

We thank the critical comments and suggestions from the anonymous reviewers for improving the manuscript.

Conflicts of Interest

The authors declare that they have no competing interests.

References

  1. Wu, Q.; Li, A.; Liu, J.; Zhao, Y.; Zhao, P.; Zhang, Y.; Que, Y. Sugarcane variety YZ05-51 with high yield and strong resistance: Breeding and cultivation perspectives. Trop. Plants 2024, 3. [Google Scholar] [CrossRef]
  2. Bao, Y.; Zhang, Q.; Huang, J.; Zhang, S.; Yao, W.; Yu, Z.; Deng, Z.; Yu, J.; Kong, W.; Yu, X.; et al. A chromosomal-scale genome assembly of modern cultivated hybrid sugarcane provides insights into origination and evolution. Nat. Commun. 2024, 15, 3041. [Google Scholar] [CrossRef]
  3. Zhao, Y.; Zan, F.; Deng, J.; Zhao, P.; Zhao, J.; Wu, C.; Liu, J.; Zhang, Y. Improvements in Sugarcane (Saccharum spp.) Varieties and Parent Traceability Analysis in Yunnan, China. Agronomy 2022, 12, 1211. [Google Scholar] [CrossRef]
  4. Wallace, J.G.; Rodgers-Melnick, E.; Buckler, E.S. On the Road to Breeding 4.0: Unraveling the Good, the Bad, and the Boring of Crop Quantitative Genomics. Annu. Rev. Genet. 2018, 52, 421–444. [Google Scholar] [CrossRef] [PubMed]
  5. Zhang, C.; Jiang, S.; Tian, Y.; Dong, X.; Xiao, J.; Lu, Y.; Liang, T.; Zhou, H.; Xu, D.; Zhang, H.; et al. Smart breeding driven by advances in sequencing technology. Mod. Agric. 2023, 1, 43–56. [Google Scholar] [CrossRef]
  6. Luo, H.; Xiong, F.; Qiu, L.; Liu, J.; Duan, W.; Gao, Y.; Qin, X.; Wu, J.; Li, Y.; Liu, J. Application Study of Molecular Markers Associated with Traits in Sugarcane Molecular Breeding. Crops 2022, 35–43. [Google Scholar] [CrossRef]
  7. Yadav, S.; Jackson, P.; Wei, X.; Ross, E.M.; Aitken, K.; Deomano, E.; Atkin, F.; Hayes, B.J.; Voss-Fels, K.P. Accelerating genetic gain in sugarcane breeding using genomic selection. Agronomy 2020, 10, 585. [Google Scholar] [CrossRef]
  8. Cursi, D.E.; Castillo, R.O.; Tarumoto, Y.; Umeda, M.; Tippayawat, A.; Ponragdee, W.; Racedo, J.; Perera, M.F.; Hoffmann, H.P.; Carneiro, M.S. Origin, genetic diversity, conservation, and traditional and molecular breeding approaches in sugarcane. Cash Crops Genet. Divers. Eros. Conserv. Util. 2022, 83–116. [Google Scholar] [CrossRef]
  9. Batista, L.G.; Mello, V.H.; Souza, A.P.; Margarido, G.R. Genomic prediction with allele dosage information in highly polyploid species. Theor. Appl. Genet. 2022, 135, 723–739. [Google Scholar] [CrossRef]
  10. Zhang, J.; Nagai, C.; Yu, Q.; Pan, Y.; Ayala-Silva, T.; Schnell, R.J.; Comstock, J.C.; Arumuganathan, A.K.; Ming, R. Genome size variation in three Saccharum species. Euphytica 2012, 185, 511–519. [Google Scholar] [CrossRef]
  11. Zhang, J.; Zhang, X.; Tang, H.; Zhang, Q.; Hua, X.; Ma, X.; Zhu, F.; Jones, T.; Zhu, X.; Bowers, J.; et al. Allele-defined genome of the autopolyploid sugarcane Saccharum spontaneum L. Nat. Genet. 2018, 50, 1565–1573. [Google Scholar] [CrossRef] [PubMed]
  12. Gouy, M.; Rousselle, Y.; Bastianelli, D.; Lecomte, P.; Bonnal, L.; Roques, D.; Efile, J.; Rocher, S.; Daugrois, J.; Toubi, L. Experimental assessment of the accuracy of genomic selection in sugarcane. Theor. Appl. Genet. 2013, 126, 2575–2586. [Google Scholar] [CrossRef] [PubMed]
  13. Hayes, B.J.; Wei, X.; Joyce, P.; Atkin, F.; Deomano, E.; Yue, J.; Nguyen, L.; Ross, E.M.; Cavallaro, T.; Aitken, K.S. Accuracy of genomic prediction of complex traits in sugarcane. Theor. Appl. Genet. 2021, 134, 1455–1462. [Google Scholar] [CrossRef] [PubMed]
  14. Deomano, E.; Jackson, P.; Wei, X.; Aitken, K.; Kota, R.; Pérez-Rodríguez, P. Genomic prediction of sugar content and cane yield in sugar cane clones in different stages of selection in a breeding program, with and without pedigree information. Mol. Breed. 2020, 40, 38. [Google Scholar] [CrossRef]
  15. Islam, M.S.; Mccord, P.H.; Olatoye, M.O.; Qin, L.; Sood, S.; Lipka, A.E.; Todd, J.R. Experimental evaluation of genomic selection prediction for rust resistance in sugarcane. Plant Genome 2021, 14, e20148. [Google Scholar] [CrossRef]
  16. Murray, M.G.; Thompson, W.F. Rapid isolation of high molecular weight plant DNA. Nucleic. Acids. Res. 1980, 8, 4321–4326. [Google Scholar] [CrossRef] [PubMed]
  17. Zou, M.; Xia, Z. Hyper-seq: A novel, effective, and flexible marker-assisted selection and genotyping approach. Innov. Amst. 2022, 3, 100254. [Google Scholar] [CrossRef] [PubMed]
  18. Vasimuddin, M.; Misra, S.; Li, H.; Aluru, S. Efficient Architecture-Aware Acceleration of BWA-MEM for Multicore Systems. In Proceedings of the 2019 IEEE International Parallel and Distributed Processing Symposium (IPDPS), Rio de Janeiro, Brazil, 20–24 May 2019; pp. 314–324. [Google Scholar] [CrossRef]
  19. Depristo, M.A.; Banks, E.; Poplin, R.; Garimella, K.V.; Maguire, J.R.; Hartl, C.; Philippakis, A.A.; Del Angel, G.; Rivas, M.A.; Hanna, M.; et al. A framework for variation discovery and genotyping using next-generation DNA sequencing data. Nat. Genet. 2011, 43, 491–498. [Google Scholar] [CrossRef] [PubMed]
  20. Chrigui, N.; Sari, D.; Sari, H.; Eker, T.; Cengiz, M.F.; Ikten, C.; Toker, C. Introgression of Resistance to Leafminer (Liriomyza cicerina Rondani) from Cicer reticulatum Ladiz. to C. arietinum L. and Relationships between Potential Biochemical Selection Criteria. Agronomy 2021, 11, 57. [Google Scholar] [CrossRef]
  21. Vanraden, P.M. Efficient Methods to Compute Genomic Predictions. J. Dairy. Sci. 2008, 91, 4414–4423. [Google Scholar] [CrossRef]
  22. Li, H.; Li, X.; Zhang, P.; Feng, Y.; Mi, J.; Gao, S.; Sheng, L.; Ali, M.; Yang, Z.; Li, L.; et al. Smart Breeding Platform: A web-based tool for high-throughput population genetics, phenomics, and genomic selection. Mol. Plant. 2024, 17, 677–681. [Google Scholar] [CrossRef] [PubMed]
  23. Misztal, I.; Tsuruta, S.; Strabel, T.; Auvray, B.; Druet, T.; Lee, D. BLUPF90 and Related Programs. In Proceedings of the 7th World Congress on Genetics Applied to Livestock Production, Montpellier, France, 19–23 August 2002; p. 743. Available online: https://hdl.handle.net/2268/84980 (accessed on 18 October 2024).
  24. Irvine, J.E. Saccharum species as horticultural classes. Theor. Appl. Genet. 1999, 98, 186–194. [Google Scholar] [CrossRef]
  25. Palhares, A.C.; Rodrigues-Morais, T.B.; Van Sluys, M.A.; Domingues, D.S.; Maccheroni, W.J.; Jordao, H.J.; Souza, A.P.; Marconi, T.G.; Mollinari, M.; Gazaffi, R.; et al. A novel linkage map of sugarcane with evidence for clustering of retrotransposon-based markers. BMC Genet. 2012, 13, 51. [Google Scholar] [CrossRef] [PubMed]
  26. Healey, A.L.; Garsmeur, O.; Lovell, J.T.; Shengquiang, S.; Sreedasyam, A.; Jenkins, J.; Plott, C.B.; Piperidis, N.; Pompidor, N.; Llaca, V.; et al. The complex polyploid genome architecture of sugarcane. Nature 2024, 628, 804–810. [Google Scholar] [CrossRef] [PubMed]
  27. Daugrois, J.H.; Grivet, L.; Roques, D.; Hoarau, J.Y.; Lombard, H.; Glaszmann, J.C.; D’Hont, A. A putative major gene for rust resistance linked with a RFLP marker in sugarcane cultivar ‘R570’. Theor. Appl. Genet. 1996, 92, 1059–1064. [Google Scholar] [CrossRef] [PubMed]
  28. Raboin, L.M.; Oliveira, K.M.; Lecunff, L.; Telismart, H.; Roques, D.; Butterfield, M.; Hoarau, J.Y.; D Hont, A. Genetic mapping in sugarcane, a high polyploid, using bi-parental progeny: Identification of a gene controlling stalk colour and a new rust resistance gene. Theor. Appl. Genet. 2006, 112, 1382–1391. [Google Scholar] [CrossRef] [PubMed]
  29. Costet, L.; Raboin, L.; Payet, M.; D Hont, A.; Nibouche, S. A major quantitative trait allele for resistance to the Sugarcane yellow leaf virus (Luteoviridae). Plant Breed. 2012, 131, 637–640. [Google Scholar] [CrossRef]
  30. Yadav, S.; Wei, X.; Joyce, P.; Atkin, F.; Deomano, E.; Sun, Y.; Nguyen, L.T.; Ross, E.M.; Cavallaro, T.; Aitken, K.S.; et al. Improved genomic prediction of clonal performance in sugarcane by exploiting non-additive genetic effects. Theor. Appl. Genet. 2021, 134, 2235–2252. [Google Scholar] [CrossRef]
  31. Bernardo, R. Genomewide Selection when Major Genes Are Known. Crop Sci. 2014, 54, 68–75. [Google Scholar] [CrossRef]
  32. Islam, M.S.; Fang, D.D.; Jenkins, J.N.; Guo, J.; Mccarty, J.C.; Jones, D.C. Evaluation of genomic selection methods for predicting fiber quality traits in Upland cotton. Mol. Genet. Genom. 2020, 295, 67–79. [Google Scholar] [CrossRef]
  33. Talaei Khoei, T.; Ould Slimane, H.; Kaabouch, N. Deep learning: Systematic review, models, challenges, and research directions. Neural Comput. Appl. 2023, 35, 23103–23124. [Google Scholar] [CrossRef]
  34. Meuwissen, T.H.E.; Hayes, B.J.; Goddard, M.E. Prediction of Total Genetic Value Using Genome-Wide Dense Marker Maps. Genetics 2001, 157, 1819–1829. [Google Scholar] [CrossRef]
  35. Arruda, M.P.; Lipka, A.E.; Brown, P.J.; Krill, A.M.; Thurber, C.; Brown-Guedira, G.; Dong, Y.; Foresman, B.J.; Kolb, F.L. Comparing genomic selection and marker-assisted selection for Fusarium head blight resistance in wheat (Triticum aestivum L.). Mol. Breed 2016, 36, 84. [Google Scholar] [CrossRef]
  36. Li, D.; Xu, Z.; Gu, R.; Wang, P.; Lyle, D.; Xu, J.; Zhang, H.; Wang, G. Enhancing genomic selection by fitting large-effect SNPs as fixed effects and a genotype-by-environment effect using a maize BC1F3:4 population. PLoS ONE 2019, 14, e223898. [Google Scholar] [CrossRef] [PubMed]
  37. Merrick, L.F.; Burke, A.B.; Chen, X.; Carter, A.H. Breeding with Major and Minor Genes: Genomic Selection for Quantitative Disease Resistance. Front. Plant Sci. 2021, 12, 713667. [Google Scholar] [CrossRef] [PubMed]
Figure 1. Distribution of SSW in orthogonal and reciprocal populations from 2021 to 2022.
Agronomy 14 02842 g001
Figure 2. SNP density distribution map.
Agronomy 14 02842 g002
Figure 3. GS prediction for single-stalk weight. (A) Performance comparison of five original GS models. (B) Performance comparison between weighted and unweighted relationship matrices. (C) Performance comparison of fixed-effect models for orthogonal and reciprocal crosses. GBLUP_W: GBLUP with weights assigned to SNPs based on their genomic regions. GBLUP_F: GBLUP incorporating fixed effects for crosses (orthogonal and reciprocal populations). GBLUP_F_W: GBLUP with both weighted SNPs and fixed effects for crosses. SSBLUP_W: SSBLUP with weights assigned to SNPs based on their genomic regions. SSBLUP_F: SSBLUP incorporating fixed effects for crosses (orthogonal and reciprocal populations). SSBLUP_W: SSBLUP with weights assigned to SNPs based on their genomic regions.
Agronomy 14 02842 g003
Figure 4. Schematic diagram of sugarcane genome scoring and weighting. (A) Schematic representation of sugarcane gene structure scoring. (B) Schematic diagram of SNP weights in the traditional GBLUP model. (C) Schematic diagram of SNP weight after scoring.
Agronomy 14 02842 g004
Table 1. Sugarcane SSW statistical analysis table.
Mean
(kg)
Standard
Deviation
MinMaxCV (%)H2
Orthogonal0.8910.1720.4651.48519.3%0.86
Reciprocal cross1.0670.1890.6831.59217.7%0.88
Disclaimer/Publisher’s Note: The statements, opinions and data contained in all publications are solely those of the individual author(s) and contributor(s) and not of MDPI and/or the editor(s). MDPI and/or the editor(s) disclaim responsibility for any injury to people or property resulting from any ideas, methods, instructions or products referred to in the content.

