Article

An Online Method for Detecting Seeding Performance Based on Improved YOLOv5s Model

1
School of Mechanical Engineering, Yangzhou University, Yangzhou 225127, China
2
Jiangsu Engineering Center for Modern Agricultural Machinery and Agronomy Technology, Yangzhou 225127, China
*
Author to whom correspondence should be addressed.
Agronomy 2023, 13(9), 2391; https://doi.org/10.3390/agronomy13092391
Submission received: 21 August 2023 / Revised: 10 September 2023 / Accepted: 13 September 2023 / Published: 15 September 2023
(This article belongs to the Section Precision and Digital Agriculture)

Abstract

:
Prior to dispatch from manufacturing facilities, seeders require rigorous performance evaluations for their seeding capabilities. Conventional manual inspection methods are notably less efficient. This study introduces a wheat seeding detection approach anchored in an enhanced YOLOv5s image-processing technique. Building upon the YOLOv5s framework, we integrated four CBAM attention mechanism modules into its model. Furthermore, the traditional upsampling technique in the neck layer was superseded by the CARAFE upsampling method. The augmented model achieved an mAP of 97.14%, illustrating its ability to elevate both the recognition precision and processing speed for wheat seeds while ensuring that the model remains lightweight. Leveraging this advanced model, we can effectively count and locate seed images, enabling the precise calculation and assessment of sowing uniformity, accuracy, and dispersion. We established a sowing test bench and conducted experiments to validate our model. The results showed that after the model was improved, the average accuracy of wheat recognition was above 97.55% under different sowing rates and travel speeds. This indicates that this method has high precision for the total number of seed particles. The sowing rate and sowing travel speed were consistent with manual measurements and did not significantly affect uniformity, accuracy, or dispersion.

1. Introduction

Computer vision has been extensively integrated into crop sowing. More recently, the marriage of computer vision and deep learning techniques has found innovative applications, especially in seeding detection [1]. The quality of sowing profoundly influences crop growth; optimal sowing allows crops to access water, sunlight, and nutrients more efficiently during their growth phase [2]. This is particularly true for wheat, where the yield and quality are directly contingent upon the sowing quality. Detecting aspects like the sowing quantity, uniformity, dispersion, and accuracy are critical during the wheat-sowing process. Real-time, accurate monitoring can drastically reduce seed wastage and mitigate the occurrence of poor seedlings [3]. Before seeders enter mass production, they must undergo performance testing. Conducting these tests in a controlled indoor environment can expedite the product’s test and production cycle [4]. Thus, evaluating a seeder’s sowing performance is crucial to refining its structural design and optimizing its sowing quality.
Traditional sowing test benches are heavily dependent upon manual labor, with sowing performance assessments often requiring manual calculations in the subsequent stages. However, this detection approach is deemed inefficient, failing to meet the performance detection demands of large-scale seeding equipment. Consequently, advanced sowing detection mechanisms, tailored to assess seeder performance more efficiently, have been continuously developed. Chen [5] optimized a seed-flow-sensing device using the refraction of a double-convex lens and designed a precision sowing monitoring system that is compatible with the sensing device. This system can detect seed re-sowing and missed sowing. Lu et al. [6] incorporated an intermittent automatic sampling mechanism to devise a test bench for assessing the sowing performance of strip-sowing seeders, achieving timely and evenly spaced automatic sampling along with sowing uniformity detection. Tang [7] designed a maize precision seeding machine seed monitoring system with a STM32 microcontroller as the core that can detect the maize seeding situation. Chen [8] introduced a monitoring method for the sowing rate of a rapeseed planter utilizing a linear CCD sensor, achieving the precise measurement of the seeding rate. However, most of the detection equipment mentioned primarily address issues like repeated and missed sowing, and do not offer the real-time and accurate analysis of parameters such as the sowing quantity, uniformity, dispersion, and accuracy.
Currently, the predominant methods for seed quality detection are photoelectric, capacitive, and image-based. Photoelectric sowing detection operates on the principle that the movement of a seed between a transmitter and receiver leads to a change in the light source, subsequently altering the electrical signal. This method, however, encounters limitations in detection accuracy when seeds overlap. Furthermore, suboptimal seeding environments can also degrade its performance [9,10,11,12,13,14]. Capacitive seeding detection is grounded on the concept that the equivalent dielectric constant of the capacitive sensor alters when seeds pass through. Yet, this method is less responsive to single seeds, making it unsuitable for the precise counting of minor seed quantities, and it displays a high output impedance with a subpar load capacity [15,16,17,18,19]. Machine vision sensor detection revolves around capturing real-time seed data using an industrial camera, which then forwards this information to an image-processing center. This center subsequently analyzes individual seed data to evaluate the seeding performance. It is worth noting that the machine vision approach necessitates a conducive detection environment, which is typically found in laboratory settings [20,21,22,23,24,25,26]. The aforementioned methods cannot achieve the online detection of the uniformity, accuracy, and dispersion of the seeder. This study seeks to address this gap, targeting swift indoor wheat seeder detection. The proposed solution encompasses image capture, wheat seed identification, and performance detection workflows. By using an improved YOLOv5s model, adding an attention mechanism and replacing the original upsampling method, wheat seed recognition can be achieved with high speed and high accuracy. The position of the seeds is then located to achieve the online detection of the uniformity, accuracy, and dispersion of the seeder.
In this study, we selected the YOLOv5s model and enhanced it by adding four CBAM (Convolutional Block Attention Module) attention mechanism modules to its backbone. The CBAM attention mechanism module allows the network to adapt through weight allocation and information filtering, extracting more relevant information from feature information during training. Additionally, we replaced the upsampling method of the neck layer in the original YOLOv5s with CARAFE (Content-Aware ReAssembly of FEatures) upsampling. This method has a large receptive field, enabling the enhanced utilization of surrounding information and the improved recognition of important features in wheat seed images. Furthermore, CARAFE upsampling is lightweight. We deployed the improved YOLOv5s model on a device for the online detection of the seeding performance, successfully meeting detection requirements.

2. Materials and Methods

2.1. Experimental Apparatus

The experimental sowing bench (Intelligent Agricultural Equipment Laboratory of Yangzhou University, Yangzhou, China) is depicted in Figure 1. It primarily comprises an external groove wheel seeder, a seed box, a seed-dropping conveyor belt, a conveyor-belt-speed-regulating motor, a camera, and a bracket. The seeder is fixed on the bracket, and the seeds fall on the conveyor belt. The travel speed of the implement is simulated by adjusting the conveyor belt speed, while the sowing rate can be modified by altering the seeder speed. The specific parameters of the experimental bench are presented in Table 1, and the camera parameters are detailed in Table 2.

2.2. Dataset Preparation

According to the running speed of the seed-dropping conveyor belt, the shooting interval time is set to 2 s, which ensures that under the set speed of the conveyor belt, there is no repetition and overlap in the photos obtained by the camera. When performing sowing performance detection, the conveyor belt is first started, and the seeder is started after the conveyor has begun to rotate stably. The seeder arranges the seeds from the seed box onto the rotating and stable conveyor belt.
The seed images were collected at the Intelligent Agricultural Equipment Laboratory of Yangzhou University. The shooting equipment parameters are shown in 
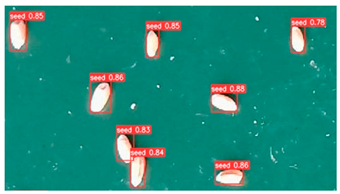
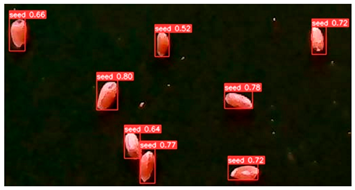
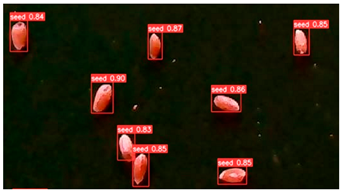
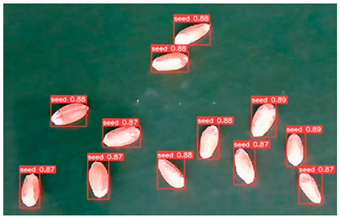
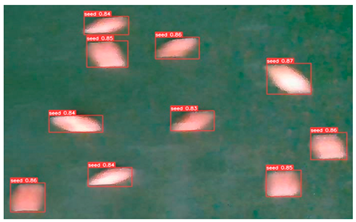
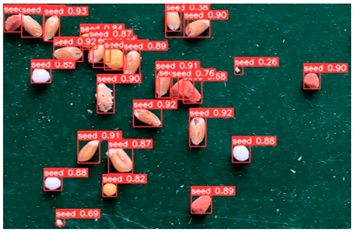
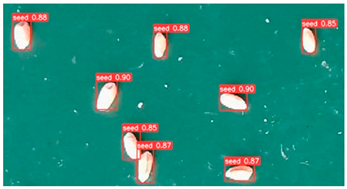
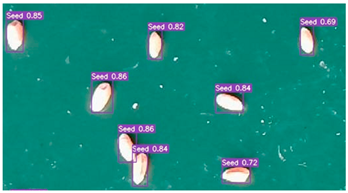
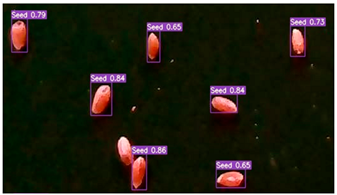
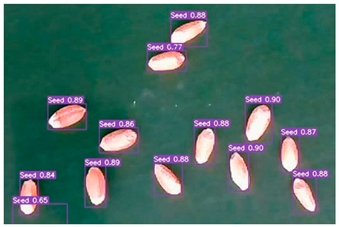
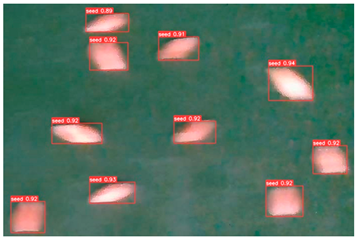
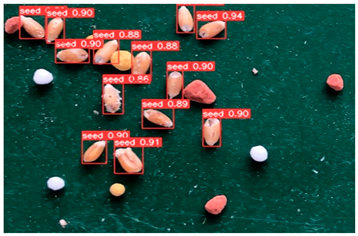
Table 2. Images were collected under various conditions, including strong light, weak light, normal, blurred, and mixed conditions. This was able to improve the ability of the equipment to detect the sowing quality under different environments. After screening the seed images, 1520 images were selected.
The Labelme (MIT’s Computer Science and Artificial Intelligence Laboratory, Boston, MA, USA) annotation tool was used to annotate 1520 images. The seeds in the images were framed with horizontal rectangles. The annotated seeds were labeled with the tag “seed”. The annotated image format was then converted to a txt file. The training and validation sets were divided in a 4:1 ratio, with 1216 images in the training set and 304 images in the validation set. To verify that the division of the dataset would have no impact on the experimental results, and to reduce overfitting to a certain extent, 5-fold cross-validation was used. The augmented data were divided into five parts, with four parts used for the training set and one part used for the validation set.

2.3. Sowing Performance Evaluation Indicator

This paper uses sowing uniformity, accuracy and dispersion as the sowing performance evaluation indicators of the seeder. The sowing uniformity U refers to the uniformity of the seeds that fall on the conveyor belt. Five images of the seed belt were continuously taken on the conveyor belt, with pixels of 1920 × 1080. U can be expressed as follows:
X - = 1 z X S = 1 z ( X X - ) 2 U = 1 s X - × 100 %
where X is the number of wheat seeds in the image;  X -  is the mean value of X; S is the standard deviation of X; and z represents the number of images.
The sowing accuracy μ is the ratio of the number of seeds falling into the seed groove to the total number of seeds discharged. The general seeder opens a seed groove width of 50 mm [27], and the width of the conveyor belt of the sowing experimental bench is 200 mm. Through the accurate calibration of the camera position, the relationship between the sowing drill width and the image pixels is shown in Figure 2. The sowing accuracy in this paper refers to the ratio of the number of seeds falling within the pixels of 405~675 in the y direction to the total number of seeds in the image. μ can be expressed as follows:
μ = m 1 m 2
where m1 is the number of seeds in the specified pixel range in the image; and m2 is the total number of seeds in the image. The larger the μ value, the higher the accuracy of the seeds falling into the seed groove, which is more conducive to precise sowing.
The sowing dispersion V refers to the degree of dispersion between the seeds that fall into the seed groove. The sowing dispersion affects the later growth of the crop. The higher the dispersion, the better the development of the crop root system. The sowing dispersion in this paper refers to the degree to which the seeds are dispersed within the width of the seed groove. The seeds that fall within the pixel range of 405~675 in the y direction are located by the algorithm and recorded. The distance yi between each seed and the straight line formed by the pixel value is 405 in the y direction. V can be expressed as follows:
y - = i = 1 n y i n S = i = 1 n y i y - 2 n V = s y -
where  y -  is the mean of yi S  is the standard deviation of yi; and n is the number of seeds that fall within the pixel range of 405~675 in the y direction. The larger the V value, the higher the degree of sowing dispersion.

2.4. Seed Counting and Coordinate Positioning

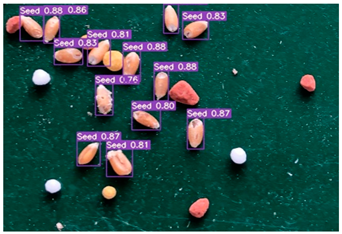
The detected target boxes labeled as “seed” are counted to accurately count the seeds. By calculating the center coordinates of the target boxes, the coordinate positions of the seeds can be obtained.

2.5. Improved YOLOv5s Model

For instance, consider the R-CNN model. Its primary feature is the generation of a target region, ensuring accuracy and recall, before classifying samples. This sequence characterizes it as a two-stage model. While such models possess high accuracy, they lack in terms of speed, leading to their exclusion from this study. In contrast, one-stage models, without the need to pre-generate target regions, can directly determine the final object category probability and its associated position coordinates in the image. This direct approach renders them faster, making them apt for lightweight deployment. The YOLO series stands as a representative example of such networks.
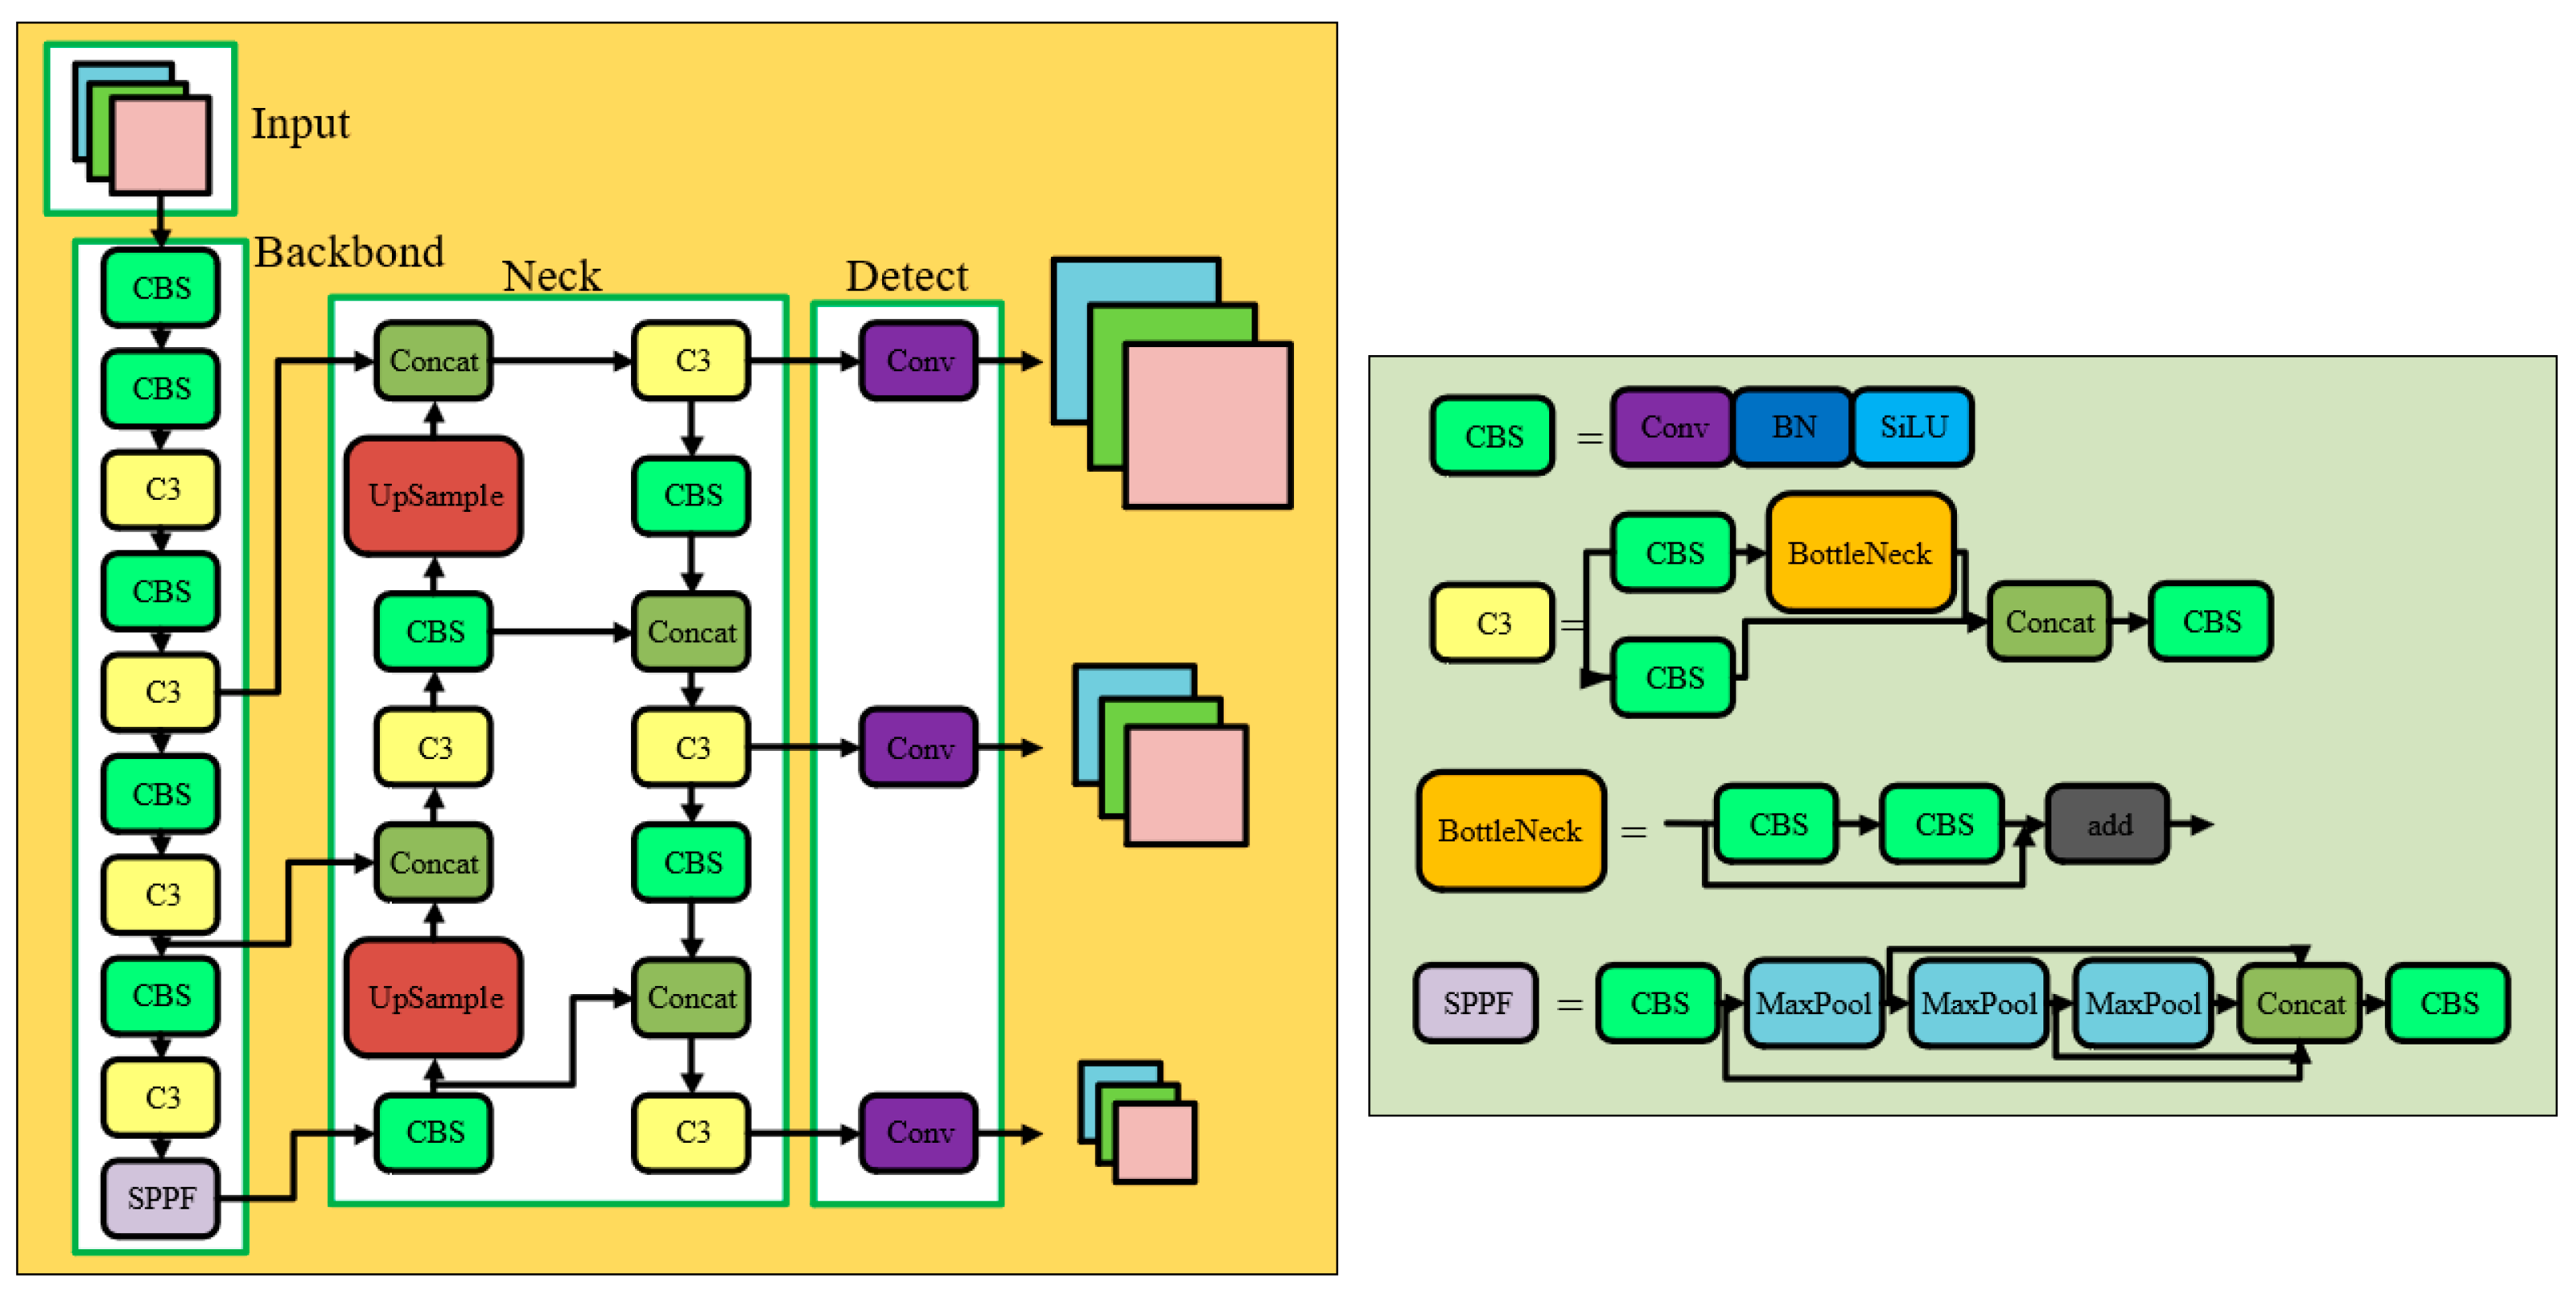
At present, the mainstream target detection tasks mainly revolve around the YOLOv5 series. This series, in comparison to its predecessors, exhibits significant alterations. There is an enhanced focus on small-target detection, coupled with noteworthy improvements in speed and accuracy. YOLOv5 has different models to choose from. In this paper, since there is only one detection category for wheat seeds, and considering the need for real-time detection and easy deployment, the YOLOv5s model with fewer parameters and computations is used as the base model. The YOLOv5s target detection model is divided into four parts, as shown in Figure 3. The input layer is responsible for passing the image into the model. The backbone network of YOLOv5s uses the CSPDarkNet53 structure, which can extract features from the image. The neck layer is responsible for fusing the features extracted by the backbone network. The detect layer predicts 3 different dimensions of features to obtain the predicted class and position information from the network [28,29,30,31,32,33,34].

2.5.1. Adding CBAM Attention Mechanisms to Backbone

The attention mechanism strengthens the adaptability of the network by assigning weights and filtering information. During the model-training process, more useful information is extracted from the feature information. The CBAM attention mechanism is composed of a channel attention module and a spatial attention module, which jointly process the input feature layer, as shown in Figure 4. In this paper, a CBAM attention mechanism module is added after each C3 module in the backbone, as shown in Figure 5. The CBAM attention mechanism modules all make the YOLOv5s model better at extracting features. After the seed image features are processed by the channel attention module, the input feature layer is subjected to global average pooling and global maximum pooling, respectively. The results of the two pooling operations are processed by a shared fully connected layer. Finally, the results processed by the fully connected layer are added and sent to the Sigmoid activation function. The reason that the aforementioned channel attention module is more capable of extracting representations than a single pooling method is that it employs a method that compresses the spatial dimensions of the input feature map. The spatial attention module for the input end is formed by merging the feature map output by the channel attention module with the initial input feature map, and the spatial attention module focuses on which part of the image information is more important. Therefore, after passing through the CBAM module, the generated feature map can highlight key target wheat information.

2.5.2. Replacing the Upsampling Method with CARAFE Upsampling

The YOLOv5s employs the nearest neighbor interpolation upsampling algorithm to augment the feature map’s resolution. While this method is computationally efficient and straightforward, it might compromise the detection accuracy to an extent. The CARAFE upsampling technique consists of two primary components: upsampling kernel prediction and feature reassembly, as illustrated in Figure 6. In the upsampling kernel prediction part, feature map channel compression is used to compress the input H × W × C feature map into H × W × Cm by using a 1 × 1 convolution, which can effectively reduce the amount of computation. Content encoding and upsampling the kernel prediction can be achieved by using convolution operations to change the number of channels from Cm to σ2 × kup2 for content encoding, where the upsampling rate is σ and the upsampling size is kup × kup. Then, the channels are unfolded in the spatial dimension. The prediction results are processed with SoftMax normalization, and the feature map is passed into the feature reorganization part. The features on each layer of the feature map are multiplied by the predicted upsampling kernel to obtain the upsampling result. CARAFE upsampling has a large receptive field and can make good use of surrounding information. At the same time, the upsampling kernel and feature map are semantically related, and upsampling is performed based on the input content. In addition, CARAFE upsampling has the characteristics of being lightweight and does not introduce a large number of parameters and computations. This study improves the upsampling method in the YOLOv5s model by using CARAFE upsampling instead of the original upsampling method, as shown in Figure 7; thus, the ability of the equipment to recognize important features during upsampling is improved.

3. Results

3.1. Ablation Experiment

3.1.1. Training Environment and Methods

The training environment and training parameters for this study are shown in Table 3.

3.1.2. Evaluation Indicators

The training accuracy used in this experiment is mainly reflected by precision P, recall R, and mean average precision (mAP), and the real-time monitoring performance of the model is measured according to frames per second (FPS).
Precision P represents the proportion of correctly predicted samples among all samples, as shown in the following formula:
p = T P T P + F P × 100 %
Recall R represents the proportion of correctly predicted samples among all positive samples, as shown in the following formula:
R = T P T P + F N × 100 %
The mean average precision (mAP) is the mean of the average precision (AP), as shown in the following formula:
m A P = 0 1 P R d R × 100 %
In the formula, TP represents the number of samples correctly predicted as positive, FP represents the number of samples incorrectly predicted as positive, and FN represents the number of samples incorrectly predicted as negative.

3.1.3. Ablation Experiment

This experiment mainly aims to improve the precision of YOLOv5s, and analyzes and verifies the improved YOLOv5s network models in Section 2.5.1 and Section 2.5.2. This study mainly introduces the CBAM module into the backbone network of the model, and replaces the upsampling method in the neck layer with CARAFE upsampling. Within the confines of maintaining parameters and computational requirements comparable to the original model, we have successfully improved the model’s accuracy, making it more suitable for wheat seed recognition and subsequent model deployment. The ablation experiment based on the improved YOLOv5s is shown in Table 4.
Based on the ablation experiment results presented in Table 4, it is evident that integrating the CBAM model into the backbone network of the YOLOv5s model enhances the precision, recall, and mAP values. This improvement can be attributed to CBAM’s ability to bolster the network’s adaptability through weight allocation and information filtering. During model training, more data are extracted from the feature information. However, this is offset by a slight increase in the associated parameters, computational requirements, and model size. Ablation experiments reveal that, after employing CARAFE upsampling in place of the conventional method, the YOLOv5s model demonstrates an enhancement in the precision and mAP by 0.84 and 0.23 percentage points, respectively. The recall rates remain comparable to the original model. This enhancement can be attributed to CARAFE upsampling’s deployment of distinct upsampling kernels for diverse feature layers. This method accentuates global information, elevating the precision and mAP metrics. Nevertheless, employing varied upsampling kernels slightly augments the parameter count.
The ablation experiment endorses the adoption of CC-YOLOv5s, registering precision, recall, and mAP scores of 97.38%, 94.88%, and 97.14%. These figures surpass the original YOLOv5s model by 2.25%, 3.2%, and 1.66%, respectively. As shown in Figure 8, the 25% to 75%, median line, and mean value of the mAP of CC-YOLOv5s are all significantly higher than the original YOLOv5s model, indicating that the improvement in the recognition accuracy is relatively obvious. In terms of the amount of parameters, computation, and model size, the CC-YOLOv5s model is 78.60%, 92.40%, and 97.70% of the YOLOv5s model, respectively. This can improve the recognition accuracy of wheat seeds while enhancing the lightweight nature of the model.

3.2. Comparative Experiments between Different Models

To determine whether the CC-YOLOv5s outperforms other models, we selected current mainstream object detection models for comparison. These included the YOLO series and the CC-YOLOv5s, an object detection model based on the improved YOLOv5s. The comparative experiment results are presented in Table 5.
From Table 5, the CC-YOLOv5s model outperforms other models in terms of precision and recall, showcasing its superior accuracy. Following closely behind are the YOLOv5s and YOLOv7 models, while the YOLOv4 network trails with a noticeably diminished accuracy, suggesting its unsuitability for this task. This conclusion is reinforced by both Table 5 and Figure 9. In the radar chart, models closer to the center denote better performance. YOLOv4’s deficiencies are further highlighted by not just a lower mAP, but also its excessive parameters, larger number of computations, and greater model size. Although the mAP difference between YOLOv5s and YOLOv7 is marginal, YOLOv7’s greater number of parameters, computations, and model dimensions render it less optimal for lightweight deployment. Coupled with a lower frame rate than YOLOv5s, YOLOv7 seems a suboptimal choice for this recognition task. In contrast, CC-YOLOv5s improves upon YOLOv5s by elevating the accuracy and diminishing the network complexity. It also boasts a commendable frame rate, meeting the real-time demands of the task at hand. In sum, factoring in the accuracy, parameter count, network structure complexity, and detection frame rate, CC-YOLOv5s emerges as the superior choice for this recognition task.
Table 6 shows that the YOLOv4 network model has a low confidence in differentiating wheat seed images in various states. It often misidentifies impurities as wheat seeds and over-detects other areas. Furthermore, its detection of adherent seeds is subpar, making it unsuitable for wheat seed recognition. Although YOLOv7 demonstrates higher confidence, there are missed seeds in weak light, affecting the precise positioning of wheat seeds. The underlying reason might be that the YOLOv7 network primarily focuses on detecting multiple target objects, while our dataset contains only one category: wheat seeds. Conversely, YOLOv5s outperforms both YOLOv4 and YOLOv7 in confidence and recognition accuracy, making it the optimal base model. The CC-YOLOv5s model excels in recognizing wheat seeds in varying states compared to other target detection models. This model accurately pinpoints wheat seed positions with high confidence. It can distinguish between adherent seeds in an image and efficiently separate them without missing any detection. Moreover, in wheat seed images containing impurities, it can discern wheat seeds from impurities effectively. In summary, the CC-YOLOv5s model offers multiple advantages: it has the fewest parameters, requires the least computation, and yields the smallest model size. Most importantly, it achieves the highest mAP accuracy in recognizing wheat seeds. The model can precisely identify adherent wheat seeds without errors, fulfilling the real-time detection needs for wheat seeds on a conveyor belt. Thus, the improved model strikes a balance between being lightweight and meeting the detection task requirements.

3.3. Sowing Performance Test Experiment

3.3.1. Experimental Design

This experiment takes into account two factors: the conventional sowing rate and sowing travel speed. The wheat variety used in this paper is Ningmai 26. The sowing rate of this variety is 150~225 kg·hm−2. The measured thousand-grain weight of this wheat is 40 g. After converting the planting row spacing to 0.25 m, the wheat sowing rate is about 15~36 g·m−2. The experimental sowing rates were determined to be 15 g·m−2, 18 g·m−2, 21 g·m−2, 24 g·m−2, 27 g·m−2, 30 g·m−2, 33 g·m−2, and 36 g·m−2. The speed of the seed delivery belt was set at 0.15 m·s−1, 0.30 m·s−1, 0.45 m·s−1, 0.60 m·s−1, 0.75 m·s−1, 0.90 m·s−1, 1.05 m·s−1, and 1.20 m·s−1. The CC-YOLOv5s model was used for the experiment, and its precision under different sowing rates and sowing travel speeds was analyzed. During the image acquisition process, five sowing images were taken for each condition, and precision P, sowing accuracy μ, and sowing dispersion V were averaged from five sets of data.

3.3.2. Experimental Results and Analysis

When testing the system detection effect under different sowing rate conditions, a moderate sowing travel speed of 0.75 m·s−1 was selected. As can be seen from the system detection results in Table 7, the precision of wheat seed detection using the CC-YOLOv5s model under different sowing rates is above 96.43%, and the average precision of the CC-YOLOv5s model is 97.56%. This indicates that the detection system has a high precision for wheat seeds. Using Origin software, a regression equation was derived with “precision” as the dependent variable (y) and “sowing rate” as the independent variable (x). The equation takes the following form:
y = a + bx
where the coefficient values were determined as follows: a = 1.009 ± 0.004 and b = −0.001.
As the sowing rate increases, the precision decreases. The reason for this is that, as the sowing rate increases, the number of adherent seeds gradually increases, gradually forming a stacking phenomenon between seeds. The occlusion part causes the seed features to be incompletely displayed, resulting in the missed detection of seeds. As the sowing amount increases, this phenomenon becomes more and more obvious.
When testing the system detection effect under different sowing travel speeds, a moderate sowing rate of 24 g·m−2 was selected, and the system detection results are shown in Table 8. As can be seen from Table 8, the precision of the CC-YOLOv5s model under different sowing travel speeds is above 96.33%, and the overall average precision of the CC-YOLOv5s model is 97.55%, which is comparable to the results obtained when under different sowing rates. Utilizing the Origin software, a regression analysis was performed using “precision” as the dependent variable (y) and “sowing travel speed” as the independent variable (x). The resultant regression equation takes the following form, see Equation (7), with the coefficients estimated as follows: a = 0.993 ± 0.002 and b = −0.025 ± 0.002.
As the sowing travel speed increases, the probability of seed deformation and distortion in the image increases, causing the features of the seed image to change. At this time, the segmentation of adherent seeds is affected, and this phenomenon becomes more obvious as the sowing speed increases.
From the analysis of the above two sets of experimental results, the sowing uniformity fluctuates between 93.23% and 96.72%, the sowing accuracy fluctuates between 89.57% and 93.14%, and the sowing dispersion fluctuates between 41.83% and 46.73%. Within certain ranges of the sowing rate and sowing travel speed, the impact on the sowing uniformity, accuracy, and dispersion is not significant. This is consistent with the results of the author’s previous research using manual calculation and measurement [4,27], and further demonstrates the feasibility of this sowing performance detection method.

4. Discussion

In this study, we introduce an enhanced model derived from YOLOv5s, specifically designed to detect the sowing performance of seed planters. Our proposed model presents a viable alternative to traditional and less efficient manual inspection methods. Using a wheat planter as our primary test subject, we established a specialized sowing inspection platform. By emulating real-world production conditions, we sought to bolster the robustness of our approach. We curated a dataset comprising images of wheat seeds captured under diverse environmental conditions. After refining and training our model on this dataset, it demonstrated an ability to precisely identify wheat seeds across varying environmental conditions in images, fulfilling the requirements of comprehensive sowing performance evaluation.
In this study, the CBAM attention mechanism module was integrated into the original YOLOv5s model. The incorporation of the CBAM module enhanced the network’s ability to extract and identify object features. By embedding the CBAM attention mechanism into the backbone network, we observed a noticeable improvement in the overall object recognition performance.
Furthermore, within the neck layer of the original YOLOv5s model, the upsampling method was replaced with CARAFE upsampling. CARAFE upsampling offers a more expansive receptive field compared to conventional upsampling techniques and introduces fewer parameters, aligning well with our pursuit of model lightweighting. With the introduction of the CARAFE upsampling method in our study, we anticipate an enhanced recognition performance for wheat seed identification.
While the proposed model demonstrates promising results regarding its ability to detect wheat seeds and showcase improvements in both the model size and detection speed—successfully being implemented on the sowing test platform—there still exists room for enhancements in the finer details of the model’s network structure. Such refinements could further elevate the network’s recognition capabilities.
In future research, the effectiveness of sowing should be considered from multiple perspectives. For instance, seed overlapping and occlusion can impact the degree of overlap between the predicted bounding boxes and the actual ground truth, subsequently influencing the recognition performance. Introducing other evaluation metrics, such as the Intersection over Union (IoU) value, would be beneficial. The scope should not be limited solely to wheat seeds; expanding the dataset to include other crops will facilitate research on different seeds and help to apply the methodology to sowing detection for a broader range of crops.

5. Conclusions

This study introduces a wheat seeder detection method based on an improved YOLOv5s model, which enables the accurate and real-time assessment of the seeder’s operational quality. The main conclusions drawn are as follows:
(1)
Performance evaluations of the enhanced model reveal superior precision, recall, and average accuracies compared to the original YOLOv5s. Moreover, in terms of the parameter count, computational demands, and model size, the CC-YOLOv5s exhibits reductions across the board compared to YOLOv5s. This suggests that the improved model achieves a higher recognition accuracy while being more lightweight. As such, the CC-YOLOv5s model adeptly meets the requirements for detecting wheat seeds.
(2)
Under varying sowing rates and sowing travel speeds, the system diagnostics revealed that the detection system based on the CC-YOLOv5s model maintained an average accuracy of over 97.55%. This accuracy aligns closely with the data obtained from manual inspections, indicating high recognition precision and stable operational efficiency. Our research demonstrates a distinct advantage in this model’s overall performance, offering valuable insights for future studies on seeding performance assessment methodologies.
Image-based quality assessments of seed dispensers cater to the practical requirements of rapid detection and the handling of large data volumes, making it apt for real-time quality monitoring during seeding. Such methodologies are pivotal to advancing research in seeding performance evaluation.

Author Contributions

Conceptualization, J.Z., X.X., Y.S., B.Z., J.Q., Y.Z., Z.Z. and R.Z.; methodology, J.Z. and X.X.; software, Y.S. and B.Z., validation, J.Z. and X.X.; investigation, X.X.; writing—original draft preparation, J.Z. and X.X.; writing—review and editing, J.Z., Y.Z., Z.Z. and R.Z.; visualization, J.Q.; supervision, X.X.; project administration, X.X.; funding acquisition, X.X. All authors have read and agreed to the published version of the manuscript.

Funding

This research was funded by the National Key Research and Development Program of China (2022YFD1500404), the Science and Technology Project of Jiangsu Province (BE2022338), the Jiangsu Modern Agricultural Machinery Equipment and Technology Demonstration and Promotion Project (NJ2022-10), and the High-end Talent Support Program of Yangzhou University.

Data Availability Statement

If scholars need more specific data, they can email the corresponding author or the first author.

Acknowledgments

We would like to express our gratitude to our supervisor for their project funding support and guidance on this paper, as well as to our fellow researchers for their help and support.

Conflicts of Interest

The authors declare no conflict of interest.

References

  1. Huang, C.; Ke, Y.; Hua, X.; Yang, J.; Sun, M.; Yang, W. Application status and prospect of edge computing in smart agriculture. Trans. Chin. Soc. Agric. Eng. 2022, 38, 224–234. [Google Scholar] [CrossRef]
  2. Jiang, M.; Liu, C.; Du, X.; Dai, L.; Huang, R.; Yuan, H. Development of seeding rate detection system for precision and small amount sowing of wheat. Trans. Chin. Soc. Agric. Eng. 2021, 37, 50–58. [Google Scholar] [CrossRef]
  3. Lu, C.; Fu, W.; Zhao, C.; Mei, H.; Meng, Z.; Dong, J.; Gao, N.; Wang, X.; Li, L. Design and experiment on real-time monitoring system of wheat seeding. Trans. Chin. Soc. Agric. Eng. 2017, 33, 32–40. [Google Scholar] [CrossRef]
  4. Xi, X.; Gu, C.; Shi, Y.; Zhao, Y.; Zhang, Y.; Zhang, Q.; Jin, Y.; Zhang, R. Design and experiment of no-tube seeder for wheat sowing. Soil Till. Res. 2020, 204, 104724. [Google Scholar] [CrossRef]
  5. Chen, L. Design and Experiment of Seeding Monitoring System Suitable for Precision Seeding. Master’s Thesis, Huazhong Agricultural University, Wuhan, China, 2022. (In Chinese with English abstract). [Google Scholar] [CrossRef]
  6. Lu, C.; Li, H.; He, J.; Wang, Q.; Zhang, Y.; Huang, S. Development of testbed for seeding performance test of drill metering device based on intermittent automatic sampling. Trans. Chin. Soc. Agric. Eng. 2019, 35, 10–19. [Google Scholar] [CrossRef]
  7. Tang, Y.; Ji, C.; Fu, W.; Chen, J. Design of Seeding Monitoring System for Corn Precision Seeder. J. Agric. Mech. Res. 2020, 42, 77–80+85. [Google Scholar] [CrossRef]
  8. Chen, Y. Research on On-line Monitoring Technology of Rapeseed Strip Seeding Device Based on Linear Array CCD. Master’s Thesis, Hunan Agricultural University, Changsha, China, 2019. (In Chinese with English abstract). [Google Scholar] [CrossRef]
  9. Karimi, H.; Navid, H.; Besharati, B.; Eskandari, I. Assessing an infrared-based seed drill monitoring system under field operating conditions. Compu. Electron. Agric. 2019, 162, 543–551. [Google Scholar] [CrossRef]
  10. Xie, C.; Yang, L.; Zhang, D.; Cui, T.; Zhang, K.; He, X.; Du, Z. Design of smart seed sensor based on microwave detection method and signal calculation model. Compu. Electron. Agric. 2022, 199, 107178. [Google Scholar] [CrossRef]
  11. Besharati, B.; Navid, H.; Karimi, H.; Behfar, H.; Eskandari, I. Development of an infrared seed-sensing system to estimate flow rates based on physical properties of seeds. Compu. Electron. Agric. 2019, 162, 874–881. [Google Scholar] [CrossRef]
  12. Zagainov, N.; Kostyuchenkov, N.; Huang, Y.X.; Sugirbay, A.; Xian, J. Line laser based sensor for real-time seed counting and seed miss detection for precision planter. Opt. Laser Technol. 2023, 167, 109742. [Google Scholar] [CrossRef]
  13. Liu, W.; Hu, J.; Zhao, X.; Pan, H.; Lakhiar, I.A.; Wang, W.; Zhao, J. Development and Experimental Analysis of a Seeding Quantity Sensor for the Precision Seeding of Small Seeds. Sensors 2019, 19, 5191. [Google Scholar] [CrossRef]
  14. Xia, H.; Zhen, W.; Liu, Y.; Zhao, K. Optoelectronic measurement system for a pneumatic roller-type seeder used to sow vegetable plug-trays. Measurement 2021, 170, 108741. [Google Scholar] [CrossRef]
  15. Zhou, L.; Wang, S.; Zhang, X.; Yuan, Y.; Zhang, J. Seed monitoring system for corn planter based on capacitance signal. Trans. Chin. Soc. Agric. Eng. 2012, 28, 16–21. [Google Scholar] [CrossRef]
  16. Chen, J.; Li, Y.; Qin, C.; Liu, C. Design and Experiment of Precision Detecting System for Wheat-planter Seeding Quantity. Trans. Chin. Soc. Agric. Mach. 2019, 50, 66–74. [Google Scholar] [CrossRef]
  17. Kumhála, F.; Prošek, V.; Blahovec, J. Capacitive throughput sensor for sugar beets and potatoes. Biosyst. Eng. 2009, 102, 36–43. [Google Scholar] [CrossRef]
  18. Kumhála, F.; Kvíz, Z.; Kmoch, J.; Prošek, V. Dynamic laboratory measurement with dielectric sensor for forage mass flow determination. Soil Till. Res. 2007, 53, 149–154. [Google Scholar] [CrossRef]
  19. Tian, L.; Yi, S.; Yao, L.; Li, Y.; Li, A.; Liu, K.; Liu, Y.; Xu, C. Kind of Monitoring System Based on Capacitance Signal Research. J. Agric. Mech. Res. 2018, 40, 189–194. [Google Scholar] [CrossRef]
  20. Bai, J.; Hao, F.; Cheng, G.; Li, C. Machine vision-based supplemental seeding device for plug seedling of sweet corn. Compu. Electron. Agric. 2021, 188, 106345. [Google Scholar] [CrossRef]
  21. Yan, Z.; Zhao, Y.; Luo, W.; Ding, X.; Li, K.; He, Z.; Shi, Y.; Cui, Y. Machine vision-based tomato plug tray missed seeding detection and empty cell replanting. Compu. Electron. Agric. 2023, 208, 107800. [Google Scholar] [CrossRef]
  22. Sun, W.; Wang, G.; Wu, J. Design and experiment on loss sowing testing and compensation system of spoon-chain potato metering device. Trans. Chin. Soc. Agric. Eng. 2016, 32, 8–15. [Google Scholar] [CrossRef]
  23. Wang, G.; Liu, W.; Wang, A.; Bai, K.; Zhou, H. Design and experiment on intelligent reseeding devices for rice tray nursing seedling based on machine vision. Trans. Chin. Soc. Agric. Eng. 2018, 34, 35–42. [Google Scholar] [CrossRef]
  24. Zhao, Z.; Liu, Y.; Liu, Z.; Gao, B. Performance Detection System of Tray Precision Seeder Based on Machine Vision. Trans. Chin. Soc. Agric. Mach. 2014, 45, 24–28. [Google Scholar] [CrossRef]
  25. Chen, S.; Jiao, L.; Xu, H.; Xu, J. Research on the precision seeding system for tiny particle seed based on machine vision. Chem. Eng. Trans. 2015, 46, 1027–1032. [Google Scholar] [CrossRef]
  26. Ji, J.; Sang, Y.; He, Z.; Jin, X.; Wang, S. Designing an intelligent monitoring system for corn seeding by machine vision and Genetic Algorithm-optimized Back Propagation algorithm under precision positioning. PLoS ONE 2021, 16, e0254544. [Google Scholar] [CrossRef]
  27. Xi, X.; Gao, W.; Gu, C.; Shi, Y.; Han, L.; Zhang, Y.; Zhang, B.; Zhang, R. Optimisation of no-tube seeding and its application in rice planting. Biosyst. Eng. 2021, 210, 115–128. [Google Scholar] [CrossRef]
  28. Shuai, L.; Mu, J.; Jiang, X.; Chen, P.; Zhang, B.; Li, H.; Wang, Y.; Li, Z. An improved YOLOv5-based method for multi-species tea shoot detection and picking point location in complex backgrounds. Biosyst. Eng. 2023, 231, 117–132. [Google Scholar] [CrossRef]
  29. Li, S.; Zhang, S.; Xue, J.; Sun, H. Lightweight target detection for the field flat jujube based on improved YOLOv5. Compu. Electron. Agric. 2022, 202, 107391. [Google Scholar] [CrossRef]
  30. Zhang, Y.; Guo, Z.; Wu, J.; Tian, Y.; Tang, H.; Guo, X. Real-time vehicle detection based on improved yolo v5. Sustainability 2022, 14, 12274. [Google Scholar] [CrossRef]
  31. Li, T.; Sun, M.; He, Q.; Zhang, G.; Shi, G.; Ding, X.; Lin, S. Tomato recognition and location algorithm based on improved YOLOv5. Compu. Electron. Agric. 2023, 208, 107759. [Google Scholar] [CrossRef]
  32. Chen, Z.; Wu, R.; Lin, Y.; Li, C.; Chen, S.; Yuan, Z.; Chen, S.; Zou, X. Plant disease recognition model based on improved YOLOv5. Agronomy 2022, 12, 365. [Google Scholar] [CrossRef]
  33. Wu, Y.; Sun, Y.; Zhang, S.; Liu, X.; Zhou, K.; Hou, J. A size-grading method of antler mushrooms using yolov5 and pspnet. Agronomy 2022, 12, 2601. [Google Scholar] [CrossRef]
  34. Li, Y.; Xue, J.; Zhang, M.; Yin, J.; Liu, Y.; Qiao, X.; Zheng, D.; Li, Z. YOLOv5-ASFF: A Multistage Strawberry Detection Algorithm Based on Improved YOLOv5. Agronomy 2023, 13, 1901. [Google Scholar] [CrossRef]
Figure 1. Sowing experiment platform.
Agronomy 13 02391 g001
Figure 2. Correspondence between sowing belt width and image pixels.
Agronomy 13 02391 g002
Figure 3. Schematic diagram of YOLOv5s model structure. Note: Conv represents convolution; BN (Batch Normalization) is a reference to batch normalization; SiLU is an activation function that represents a non-linear activation mechanism; CBS represents a convolution module composed of convolution, BN and SiLU activation functions; C3 represents the feature extraction module of the network; SPPF represents the spatial pyramid pooling module; MaxPool represents maximum pooling; Concat represents feature fusion; UpSample represents up sampling; BottleNeck denotes a common module in convolutional neural networks and is also referred to as a residual block; and Add typically pertains to the residual connections.
Agronomy 13 02391 g003
Figure 4. CBAM attention mechanism structure.
Agronomy 13 02391 g004
Figure 5. The location of the CBAM attention mechanism added to the backbone. Note: CBAM represents the CBAM attention mechanism modules.
Agronomy 13 02391 g005
Figure 6. CARAFE upsampling module.
Agronomy 13 02391 g006
Figure 7. The upsampling method in the neck layer is replaced with the CARAFE upsampling module. Note: CARAFE Upsampling represents the CARAFE upsampling module.
Agronomy 13 02391 g007
Figure 8. Boxplot of mAP for different models in ablation experiment. Note: 25%~75% represents the mAP values from 25% to 75%.
Agronomy 13 02391 g008
Figure 9. Radar chart comparing the metrics of different models.
Agronomy 13 02391 g009
Table 1. Functional parameters of the sowing experimental bench.
ParameterSize
Conveyor size (length × width, mm)3000 × 200
The speed of the transmission belt (m·s−1)0–1.5
Type of seederExternal groove wheel type, electric drive
Inner diameter of seed export (mm)40
Rotational speed of the seed wheel (r·min−1)0–25
Seeder weight per revolution (g·r−1)11.2
Table 2. Camera parameter table.
ParameterSize
ModelAF16V20
Pixel16 megapixels
Resolution1920 × 1080
Focusing methodAuto
Power loss500 mA 2.5 W
Interface modeUSB2.0
ZoomsFar and near autofocus auto clear
AngleWide angle 95°, angle of view 65°
Support systemWindows/Android/Linux/MAC
Format picturejpg
Photosensitive componentsSony CMOS
Lens4 K Ultra HD lens/650 m filter
Table 3. Training environment and training parameters.
ParameterSize
Operating systemWindows 11
CPUIntel i5-12400F
RAM16G
GPUNVIDIA GTX3060(12G)
Development environmentsPython3.7, Pytorch1.7.1, CUDA11.0
Training parametersBatch size = 8, total number of Iterations = 150, initial learning rate = 0.01
Table 4. Ablation experiment of improved model.
ModelCBAMCARAFEPrecision%Recall%mAP%Parameters (106 M)Computation (GFLOPs)Model Size (MB)
YOLOv5s××95.13 ± 0.0491.68 ± 0.1095.48 ± 0.037.0115.814.3
CBAM-YOLOv5s×96.97 ± 0.0391.29 ± 0.0595.64 ± 0.067.3716.514.6
CARAFE-YOLOv5s×95.97 ± 0.0291.68 ± 0.0495.71 ± 0.037.1814.112.4
CC-YOLOv5s97.38 ± 0.0494.88 ± 0.0197.14 ± 0.045.5114.613.4
Note: YOLOv5s represents the original network; CBAM-YOLOv5s represents the modification of the backbone network in the YOLOv5s network; CARAFE-YOLOv5s represents the modification of the upsampling module in the YOLOv5s network; CC-YOLOv5s represents the simultaneous modification of the upsampling module and backbone network in the YOLOv5s network; ‘×’ indicates that this module is not used; ‘√’ indicates that this module is used; ±: standard deviation of the uncertainty of the accuracy indicators; parameters: this refers to the actual size of the saved model; computation: this indicates the number of trainable parameters in a neural network model; model size: this refers to the amount of computation required to train or infer with the model.
Table 5. Results of comparative experiments between different models.
ModelPrecision%Recall%mAP%Parameters
(106 M)
Computation (GFLOPs)Model Size (MB)Frames per Second (FPS)
YOLOv488.65 ± 0.1389.32 ± 0.0188.41 ± 0.0364.36143.26244.132
YOLOv5s95.13 ± 0.0491.68 ± 0.1095.48 ± 0.037.0115.814.3170
CC-YOLOv5s97.38 ± 0.0494.88 ± 0.0197.14 ± 0.045.51 14.613.4185
YOLOv795.93 ± 0.0292.32 ± 0.0695.41 ± 0.0735.47 105.1174.866
Table 6. The effect of different models on wheat image recognition.
YOLOv4YOLOv5s
Strong lightAgronomy 13 02391 i001Agronomy 13 02391 i002
Weak lightAgronomy 13 02391 i003Agronomy 13 02391 i004
NormalAgronomy 13 02391 i005Agronomy 13 02391 i006
BlurredAgronomy 13 02391 i007Agronomy 13 02391 i008
MixedAgronomy 13 02391 i009Agronomy 13 02391 i010
CC-YOLOv5sYOLOv7s
Strong lightAgronomy 13 02391 i011Agronomy 13 02391 i012
Weak lightAgronomy 13 02391 i013Agronomy 13 02391 i014
NormalAgronomy 13 02391 i015Agronomy 13 02391 i016
BlurredAgronomy 13 02391 i017Agronomy 13 02391 i018
MixedAgronomy 13 02391 i019Agronomy 13 02391 i020
Note: The label and border colors in the figure are determined by the code within the model, solely representing the display of training results. The term “seed” on the label denotes wheat seeds, while the numbers on the label signify the model’s confidence in its prediction for wheat seed detection. An ideal scenario is when the model correctly detects a wheat seed with high confidence. Conversely, it is not favorable when the model mistakenly identifies an object as a wheat seed with high confidence.
Table 7. System detection results under different sowing rate conditions.
Sowing Rate (g·m−2)Precision PSowing Uniformity USowing Accuracy μSowing Dispersion V
1599.23%95.94%92.65%43.14%
1898.82%96.57%91.58%43.46%
2197.87%95.36%92.61%43.73%
2497.31%95.33%89.57%42.34%
2797.14%94.25% 93.14%41.96%
3097.04%96.72%90.68%44.72%
3396.71%93.23%92.19%41.83%
3696.43%95.64%92.29%43.49%
Table 8. System detection results under different sowing travel speed conditions.
Sowing Travel Speed (m·s−1)Precision PSowing Uniformity USowing Accuracy μSowing Dispersion V
0.1599.13%95.16%90.21%46.01%
0.398.59%94.72%90.12%44.65%
0.4597.73%95.19%89.71%43.52%
0.697.71%96.55%92.14%43.25%
0.7597.33%94.93%90.45%41.96%
0.996.85%93.91%91.45%46.73%
1.0596.76%95.46%93.02%45.21%
1.296.33%93.41%92.36%43.65%
Disclaimer/Publisher’s Note: The statements, opinions and data contained in all publications are solely those of the individual author(s) and contributor(s) and not of MDPI and/or the editor(s). MDPI and/or the editor(s) disclaim responsibility for any injury to people or property resulting from any ideas, methods, instructions or products referred to in the content.

