Abstract
Chinese cabbage (Brassica rapa L. ssp. Pekinensis) in the genus Brassica of the family Brassicaceae (Cruciferae) originates from China and is one of the most consumed leafy vegetables in East Asian countries. The leaf color is tightly linked with its growth, development, and yield. By screening an EMS mutagenized population of Chinese cabbage inbred line A03, we identified a yellowgreen leaf mutant ygl. This mutant developed abnormal ultrastructure in chloroplasts. Transcriptome and Gene Ontology (GO) analyses unveiled that abiotic stress response and glucan metabolism pathways were enriched in ygl compared to A03. A Kyoto Encyclopedia of Genes and Genomes (KEGG) analysis reveals that differentially expressed genes were mainly associated with plant hormone signal transduction, photosynthesis, and starch and sucrose metabolism. In ygl, the expression of some photosynthetic pathway genes was significantly up-regulated, while the transcription of key genes related to carbon fixation, starch syntheses, and sugar metabolism pathways, such as RBCS1A, APS1, APL3, and SUS1, was markedly down-regulated. We also found a similar reduction trend in mRNA levels of IAA19, IAA29, and ARR4 associated with auxin and cytokinin pathways. Taken together, we uncovered transcriptional profiles for some important genes that may be responsible for leaf color development, and such gene expression repertoire may be useful for further investigation into the phenotype-to-genotype link in the ygl mutant Chinese cabbage.
1. Introduction
Leaf color is tightly linked with the growth, development, and yield of leafy vegetable crops. Leaf color mutants can be obtained by EMS mutagenesis. The molecular and genetic dissection of such mutants may lead to revealing specific genes and their regulatory networks that underlie how leaf color develops. Key genes that are involved in the chlorophyll metabolism pathway, including HEMA [1], DVR [2], PORB, and PORC [3], and chloroplast development, such as RNE [4] and Sigma factor [5], or variations in the GUN (genomes uncoupled) family proteins of plastid-to-nucleus retrograde signaling pathway [6] are crucial for leaf color development.
Photosynthesis plays a primary role in producing organic substances for plant growth and development. Sucrose is the major photosynthetic product and multiple sugar signaling affects growth and metabolism. Previous studies have demonstrated photosynthesis, carbon metabolism, and allocation are themselves subject to intricate feedback control and an essential target of sugar signaling. Extensive interactions between sugar and plant hormone signaling have been recognized [7]. Sugar sensing and signaling is an extremely complex process resulting in many changes in the developmental stage and is integrated with other signaling pathways involved in inorganic nutrients and hormones in plants [8]. In addition, both sugar and hormone signals can also influence the expression of the genes that encode sucrose synthase and invertase. The effect of sugar-sensing systems is involved in auxin, cytokinins, and gibberellins [9,10].
The hormonal control of chloroplast development in plants has been reported extensively during the transition from skotomorphogenesis to photomorphogenesis [11]. Among phytohormones, cytokinin accelerates chlorophyll production by contributing to chlorophyll biosynthesis involved in the formation of 5-aminolevulinic acid and the conversion of protochlorophyllide into chlorophyllide [12,13]. Gibberellin plays an essential role in balancing the development of cells and chloroplasts during skotomorphogenesis and photomorphogenesis, and GA-modulated responses are closely related to the light signal pathway [14]. The auxin might not only control the chloroplast compartment of cells by regulating cell division and expansion but also act more directly on photosynthesis-associated nuclear genes (PhANGs) [11]. PhANGs are able to respond to multiple environmental and developmental signals, including light, sugars, and abscisic acid (ABA) [15]. Additionally, the golden-yellow leaf mutant of Lagerstroemia indica GL1 is closely associated with photosynthesis and jasmonic acid signaling pathways [16].
It has been previously noted that some key genes and molecular mechanisms of etiolation phenotype in plants. The mutant Slym1 controlled the tomato etiolation leaves by promoting the decomposition of chlorophyll [17]. Brassica napus chlorophyll-deficient mutants showed differentially expressed genes enriched in sugar metabolism and phenylpropane pathways [18]. Moreover, the yellow leaf mutant pem of Chinese cabbage existed 30 bp deletion on the promoter of DEFECTIVE 1923 (EMB1923) [19]. In this study, we exploited a yellow-green leaf mutant ygl with abnormal chloroplast structure and uncovered some vital genes associated with yellow-green leaf color at the transcriptional level. Most importantly, a novel regulatory mechanism was found in terms of photosynthesis, sugar metabolism, and phytohormone pathways in Chinese cabbage.
2. Materials and Methods
2.1. Plants Materials and Growth Conditions
The yellow–green leaf mutant ygl was obtained by screening EMS mutagenesis of Chinese cabbage inbred line A03. Mutant and A03 Chinese cabbage plants were grown in the experimental field at Hebei Agricultural University, Baoding, Hebei, from 6 August to 2 December 2022.
2.2. Measurement of Pigment Contents
To identify the chlorophyll content of plant materials, the ethanol-acetone extraction method was utilized. Briefly, 0.3 g of fresh leaf tissue was collected by a puncher (leaf veins were avoided) and soaked into 10 mL 1:1 (v/v) ethanol-acetone in the condition of light avoidance for about 24 h. The 663 nm and 645 nm absorbance were measured, and chlorophyll a, chlorophyll b, and chlorophyll content were calculated as described [20,21].
2.3. Transmission Electron Microscopy
True leaves (veins avoided) of A03 and ygl were cut into 1 mm2 pieces and fixed in 2.5% (v/v) glutaraldehyde (Solarbio, Beijing, China) in a phosphate buffer under a vacuum. The samples were washed three times with PBS (Solarbio, Beijing, China) for 10 min each time, and then they were fixed in 1% osmium tetroxide in a 0.1 M PBS buffer for 2 h. After washing with a 0.2 M PBS buffer, the samples were dehydrated with a graded acetone series of 30%, 50%, 70%, 90%, and 100% for 30 min at each concentration and then embedded in Epon 812 epoxy resin (EMS, Hatfield, PA, USA). The embedded samples were cut, and sections were stained with 2% (w/v) uranyl acetate and 2.6% (w/v) lead citrate for 10 and 5 min, respectively. Finally, the dried ultrathin sections were observed by a transmission electron microscope (JEOL, JEM-1200EX, Akishima, Japan).
2.4. Transcriptome Analysis
The first true leaves were collected from A03 and ygl, respectively. Three plants were pooled together as a biological replicate. High–quality reads were submitted for mapping compared to reference Chinese cabbage genome ‘A03’ [22]. To compare clean reads with the reference genome quickly and accurately, HISAT2 software (version 2.2.1) was used to obtain the information on reads on the reference genome. Transcripts screening conditions of differentially expressed genes (DEGs) were minimal and had a 2–fold difference in expression (|log2FC (fold change)| ≥ 1) and an adjusted false discovery rate (FDR) ≤ 0.05. Then, annotating functions were compared to Gene Ontology (GO) and the Kyoto Encyclopedia of Genes and Genomes (KEGG) for DEGs.
2.5. RNA Extraction and Quantitative Real-Time PCR (qRT-PCR)
A03 and ygl total RNA were extracted using an RNA extraction kit (Aidlab, Beijing, China), and cDNA was synthesized using HiScript® II Reverse Transcriptase (Vazyme, Nanjing, China), according to the manufacturer’s instructions. The qRT-PCR experiment was performed on a LightCycler 96 real-time PCR detection system (Roche, Basel, Switzerland) using SYBR dye. The (Ct) 2−ΔΔCt method was used to measure the expression levels of key genes [23].
3. Results
3.1. Phenotypic Characterization and Morphology of ygl
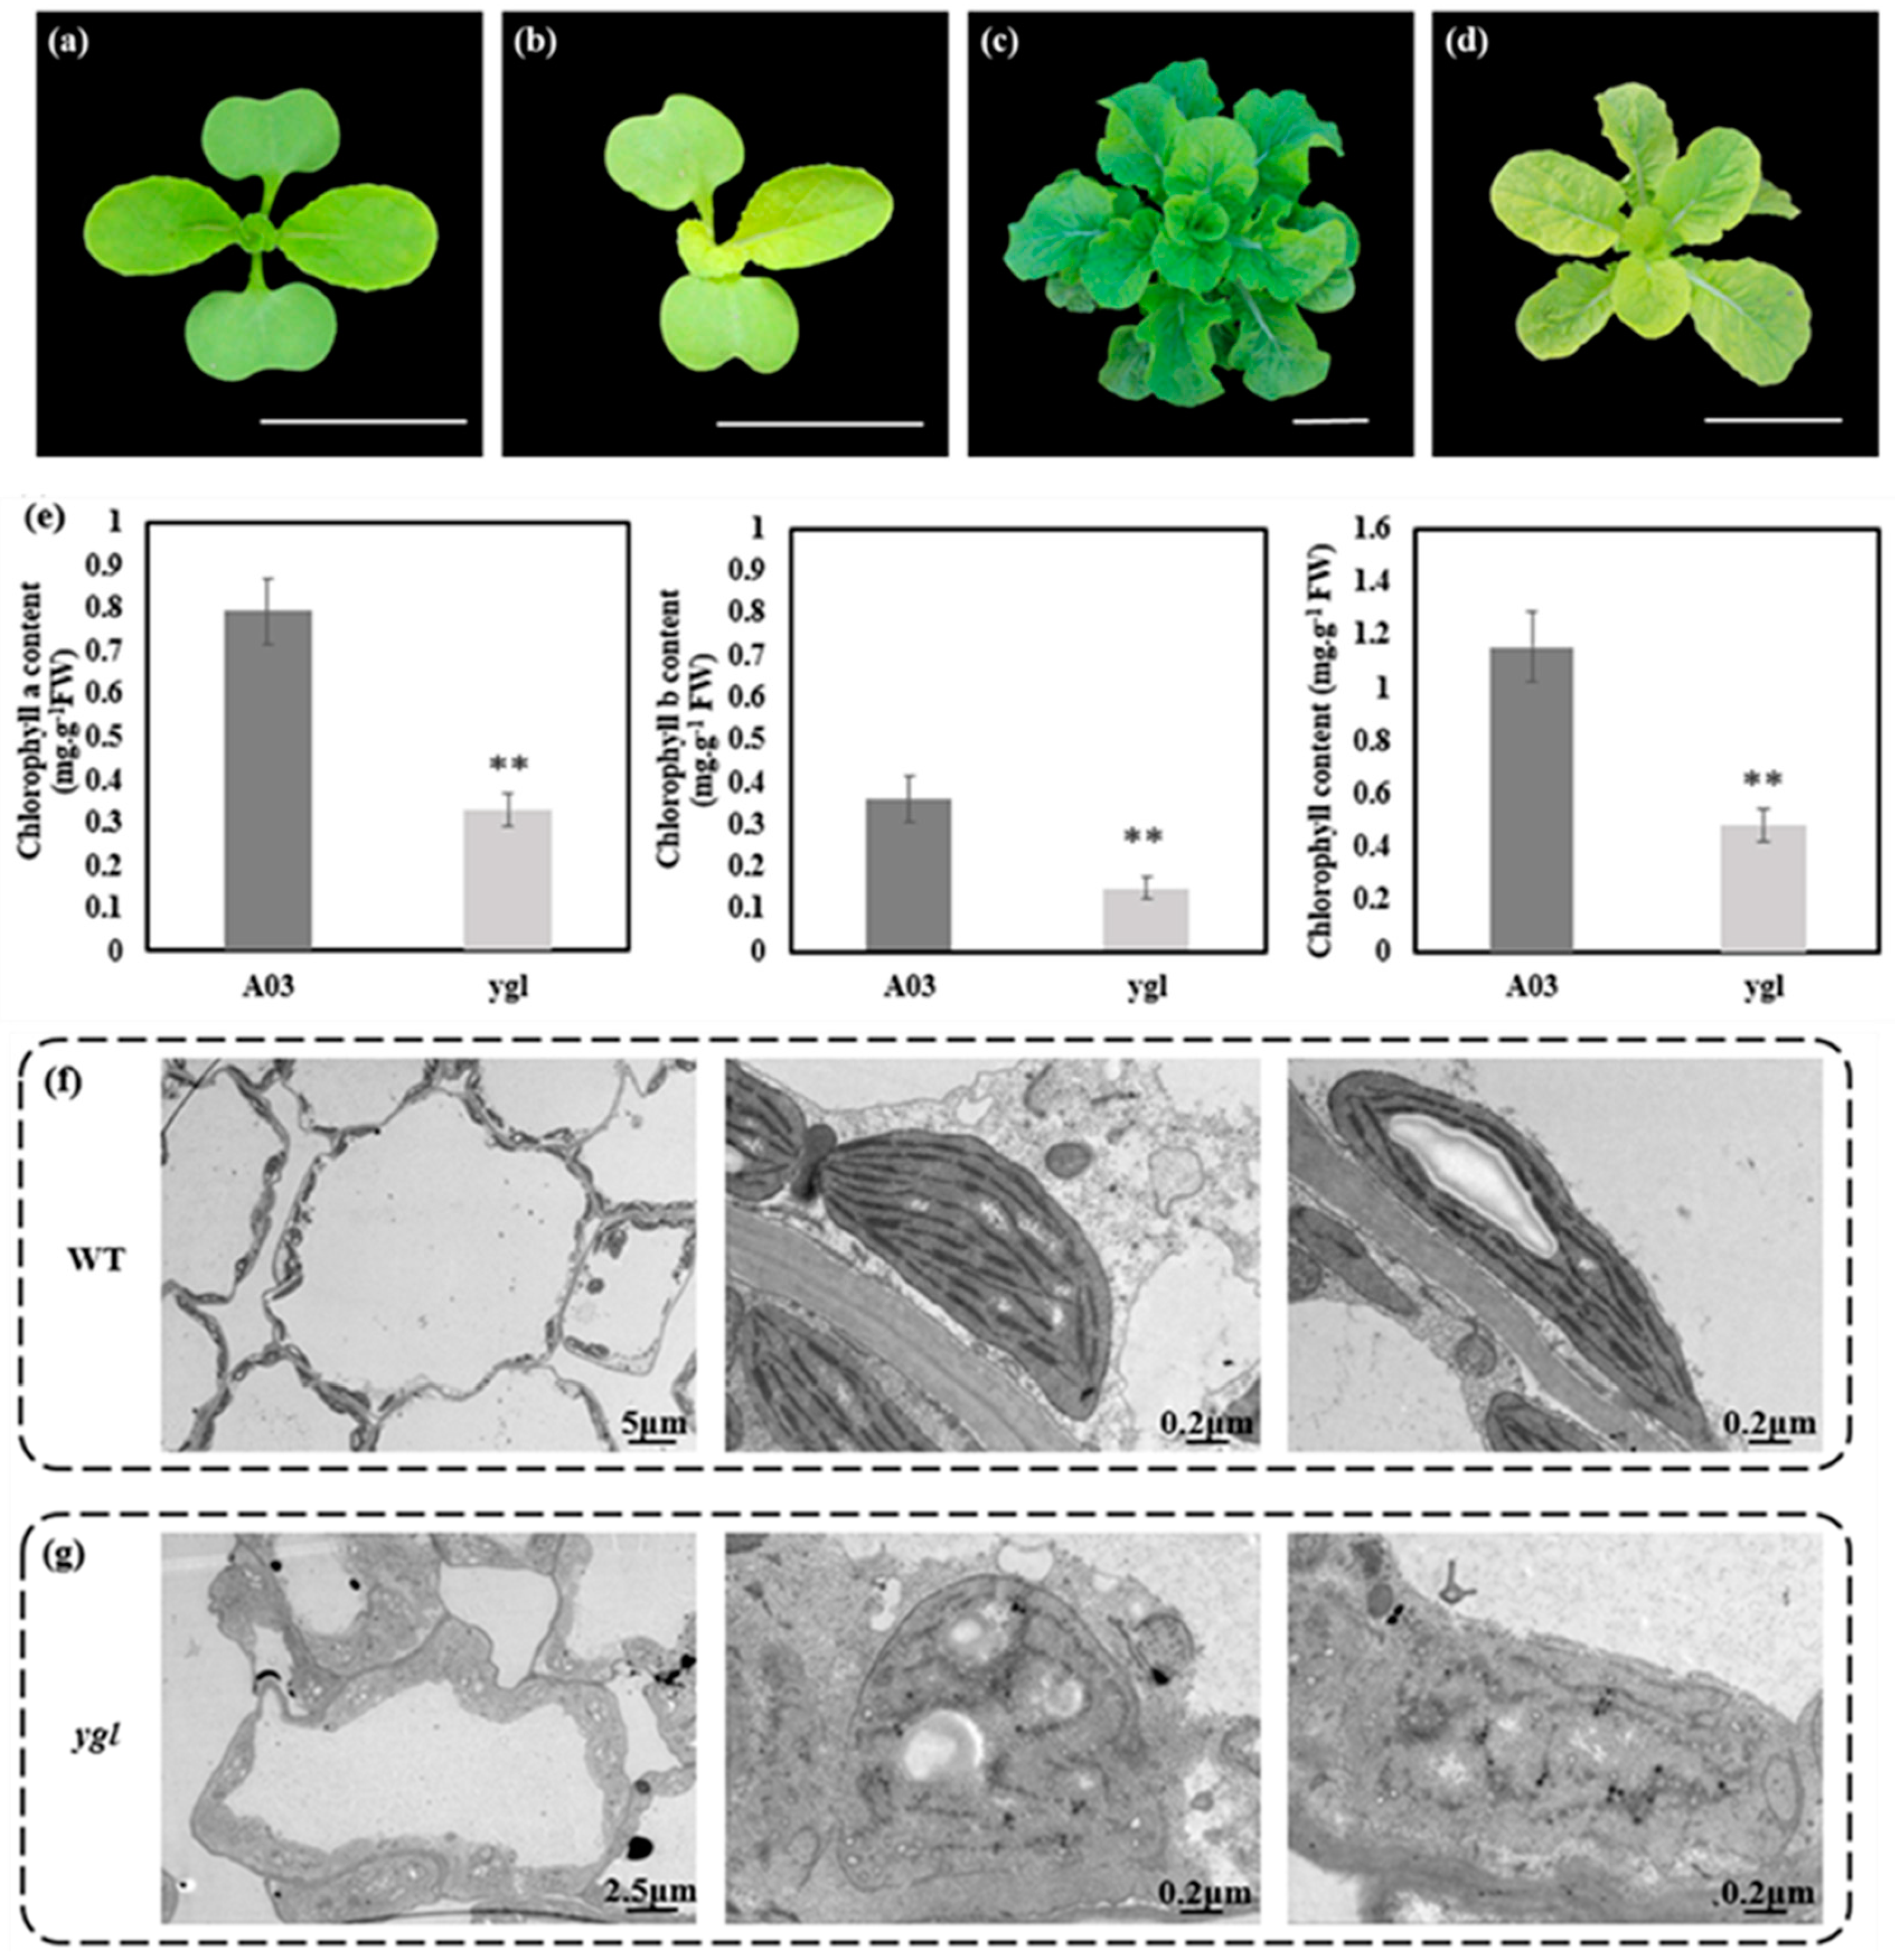
The ygl showed the stable yellow–green leaves from seedling to the rosette stage (Figure 1b,d). The A03 leaf was green in the period of growth and development (Figure 1a,c). Compared to A03, chlorophyll contents were strikingly lower in ygl (Figure 1e). Given the relevant relationship between the chlorophyll contents and the chloroplast development, we observed the ultrastructure of chloroplasts in A03 and ygl using transmission electron microscopy. The chloroplast shape of A03 was regular, possessing well-organized thylakoid membranes and a stacked grana structure (Figure 1f). By contrast, ygl chloroplast shape was extremely irregular with impaired thylakoid membranes and broken stromal lamella (Figure 1g).
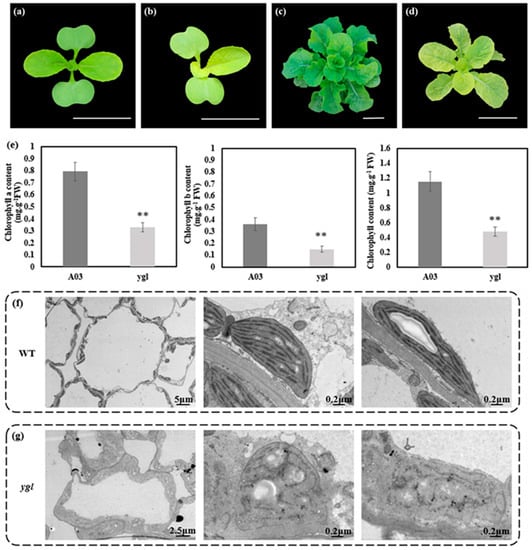
Figure 1.
Phenotypes and physiological indices between A03 and ygl. (a) Seedling stage of A03. Cotyledons and true leaves were green in the seeding stage of A03. Bar = 5 cm. (b) Seedling stage of ygl. Cotyledons and true leaves were yellow-green in the seeding stage of ygl. Bar = 5 cm. (c) The rosette stage of A03. All the leaves were green in the rosette stage of A03. Bar = 5 cm. (d) The rosette stage of ygl. All the leaves were yellow–green in the rosette stage of ygl. Bar = 5 cm. (e) Chlorophyll contents of A03 and ygl. Compared to A03, chlorophyll contents were reduced strikingly in ygl. Asterisks (**) indicate significant differences (p < 0.01). (f) Ultrastructure of A03 chloroplasts. Its shape was regular, possessing well–organized thylakoid membranes and a stacked grana structure. (g) Ultrastructure of ygl chloroplasts. Its shape was irregular and lacked well–organized lamellar structures and thylakoid membranes.
3.2. RNA-Seq Data Quality Analysis
To ensure the quality and reliability of RNA-seq data, the original sequencing data must be processed. After removing adaptor sequences and low–quality reads, high–quaity and reliable sequencing data were obtained. These data included 38 million to 46 million clean reads and 5.7 GB to 7.0 GB of clean bases for each sample. All the Q20 and Q30 values were >89% (Table 1), indicating that the data were effective and reliable for further analysis.

Table 1.
RNA-seq data statistics.
Clean reads were then mapped to the Chinese cabbage ‘A03’ reference genome. The total mapping percentages were >96%, the unique mapping percentages were more than 93% and, at the same time, the multi-mapping percentages were less than 2.8% (Table 2), demonstrating that this reference genome was extremely suitable for transcriptional analysis.
Table 2.
The comparison between RNA-seq data to the reference genome.
3.3. The DEGs of GO and KEGG Enrichment Analysis
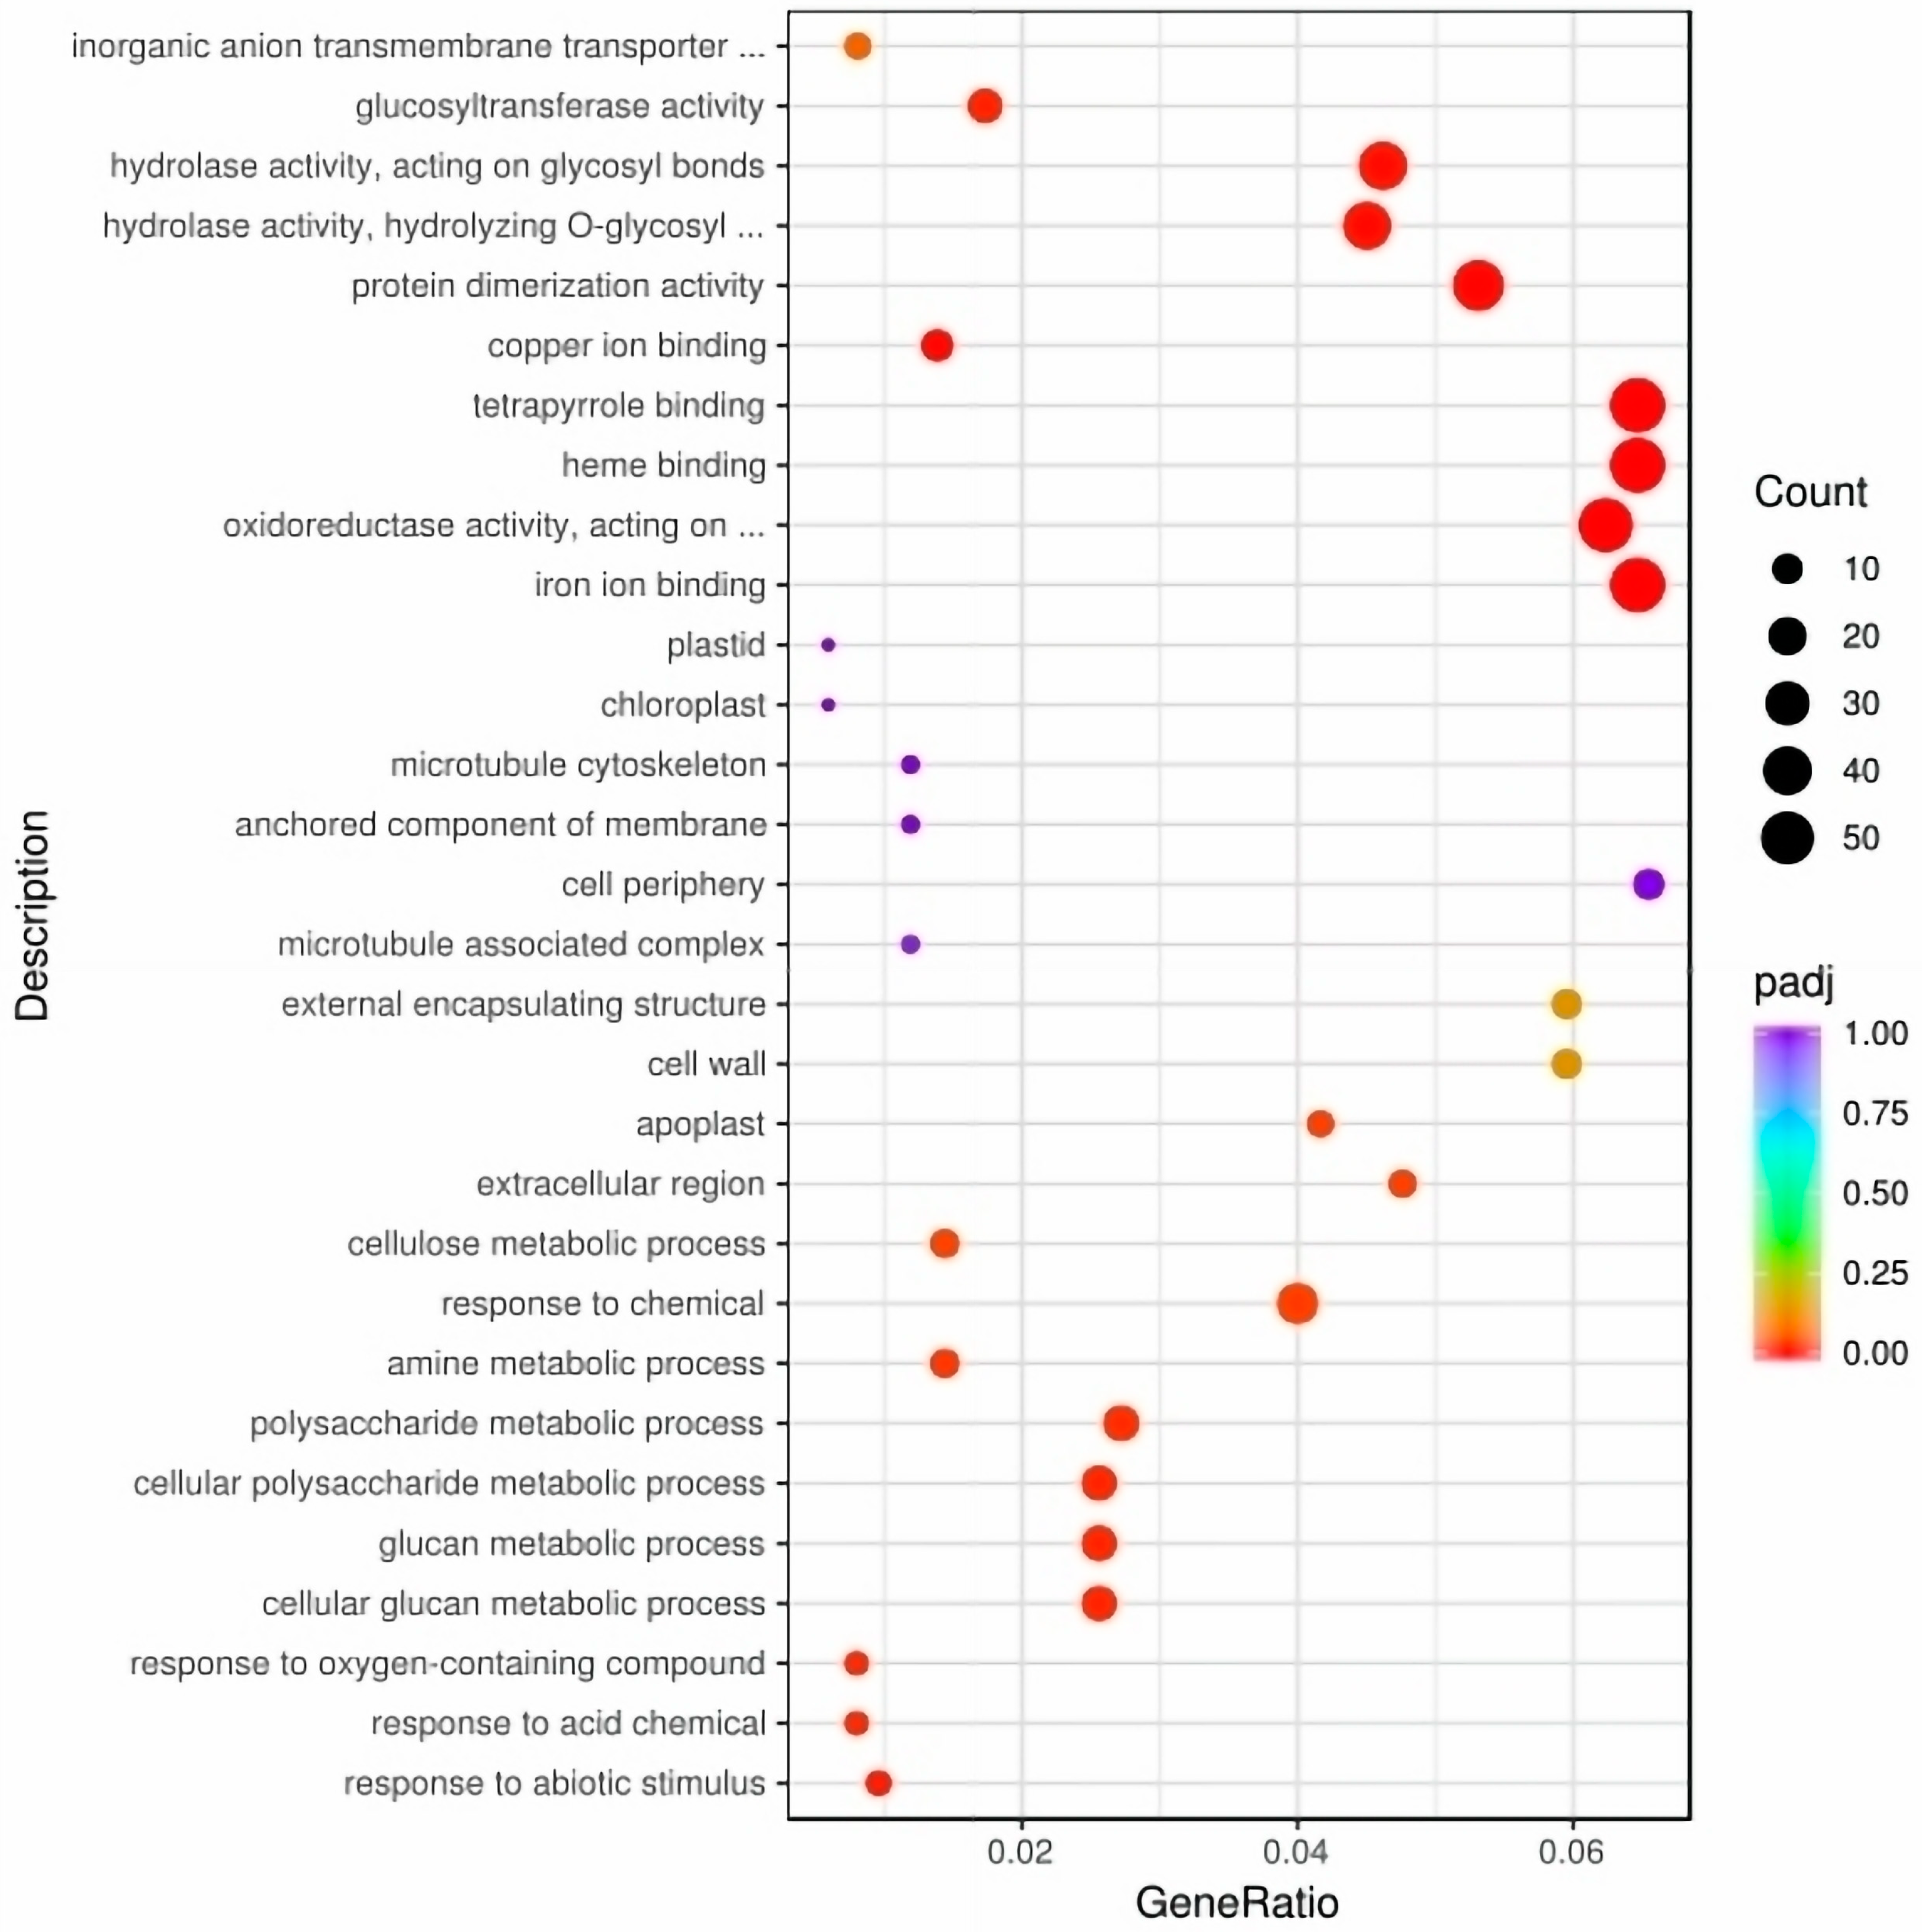
To illustrate the molecular mechanisms of leaf color development, we analyzed the gene expression patterns in A03 and ygl leaf tissues. We found that 742 differentially expressed genes (DEGs) were up-regulated and 997 DEGs were down–regulated (Figure S1). Gene Ontology (GO) analysis demonstrated that DEGs were enriched in response to abiotic stimulus, acid chemicals, oxygen–containing compounds, and glucan metabolic processes in biological processes. Cell components are mainly enriched in the plastid, chloroplast, apoplast, and cell wall. At the same time, heme binding and tetrapyrrole binding pathways were enriched in molecular functional categories (Figure 2).
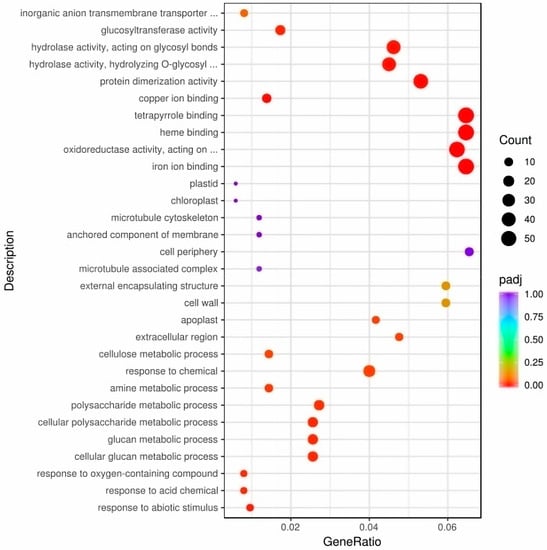
Figure 2.
The DEGs of GO enrichment between A03 and ygl. GO analysis demonstrated that DEGs were enriched in response to abiotic stimulus, response to acid chemicals, oxygen–containing compounds, and glucan metabolic processes in biological processes. Cell components are mainly enriched in the plastid, chloroplast, apoplast, and cell wall. Heme binding and tetrapyrrole binding pathways were enriched in molecular functional categories.
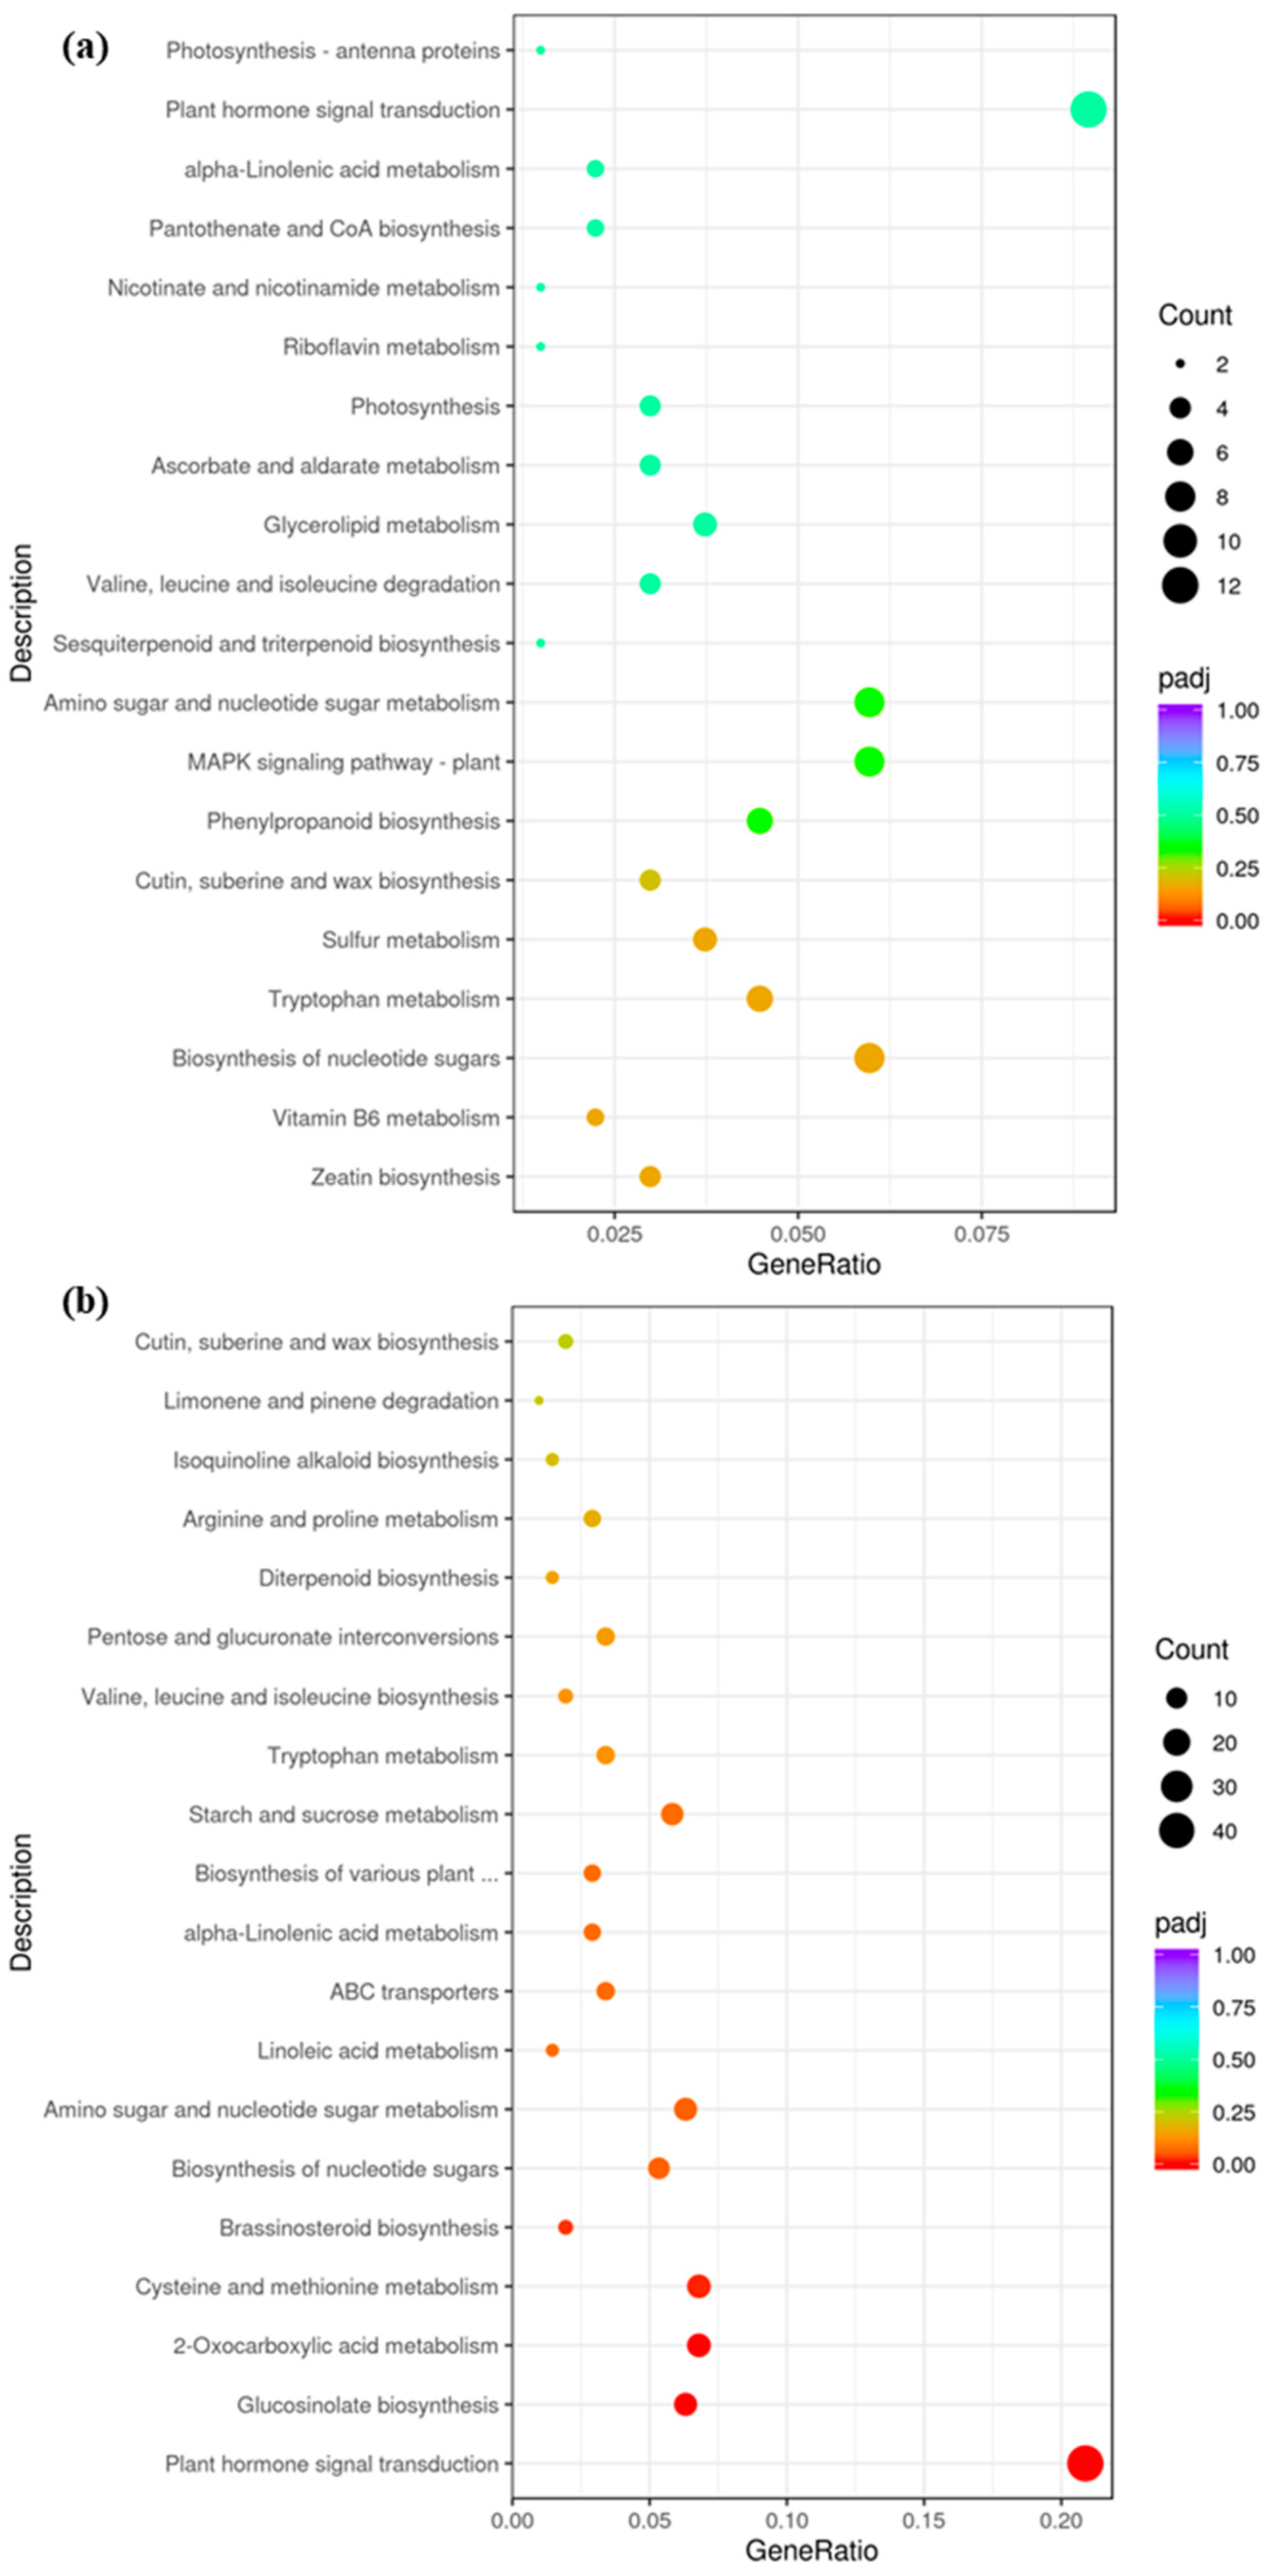
According to the KEGG analysis, photosynthesis antenna proteins, photosynthesis, plant hormone signal transduction, zeatin biosynthesis, amino sugar, and nucleotide sugar metabolism pathways were up-regulated in ygl (Figure 3a). By contrast, the pathways of plant hormone signal transduction, starch, sucrose metabolism, and glucosinolate biosynthesis were down–regulated (Figure 3b). Combining GO and KEGG results indicated that glucan metabolic process, photosynthesis, plant hormone signal transduction, starch, and sucrose metabolism were key pathways related to leaf color variation.
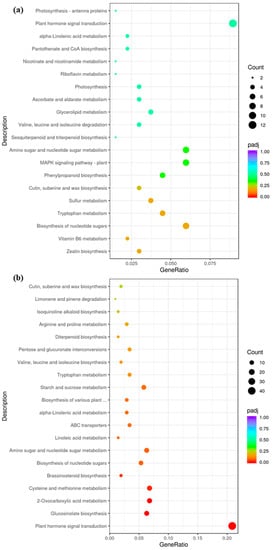
Figure 3.
The DEGs of KEGG enrichment between A03 and ygl. (a) Up-regulated DEGs of KEGG enrichment between A03 and ygl. The photosynthesis antenna proteins, photosynthesis, plant hormone signal transduction, zeatin biosynthesis, amino sugar, and nucleotide sugar metabolism pathways were up–regulated in ygl. (b) Down-regulated DEGs of KEGG enrichment between A03 and ygl. The pathways of plant hormone signal transduction, starch, sucrose metabolism, and glucosinolate biosynthesis were down-regulated in ygl.
3.4. Analysis of Differential Expression Patterns of Photosynthetic and Carbon Metabolism
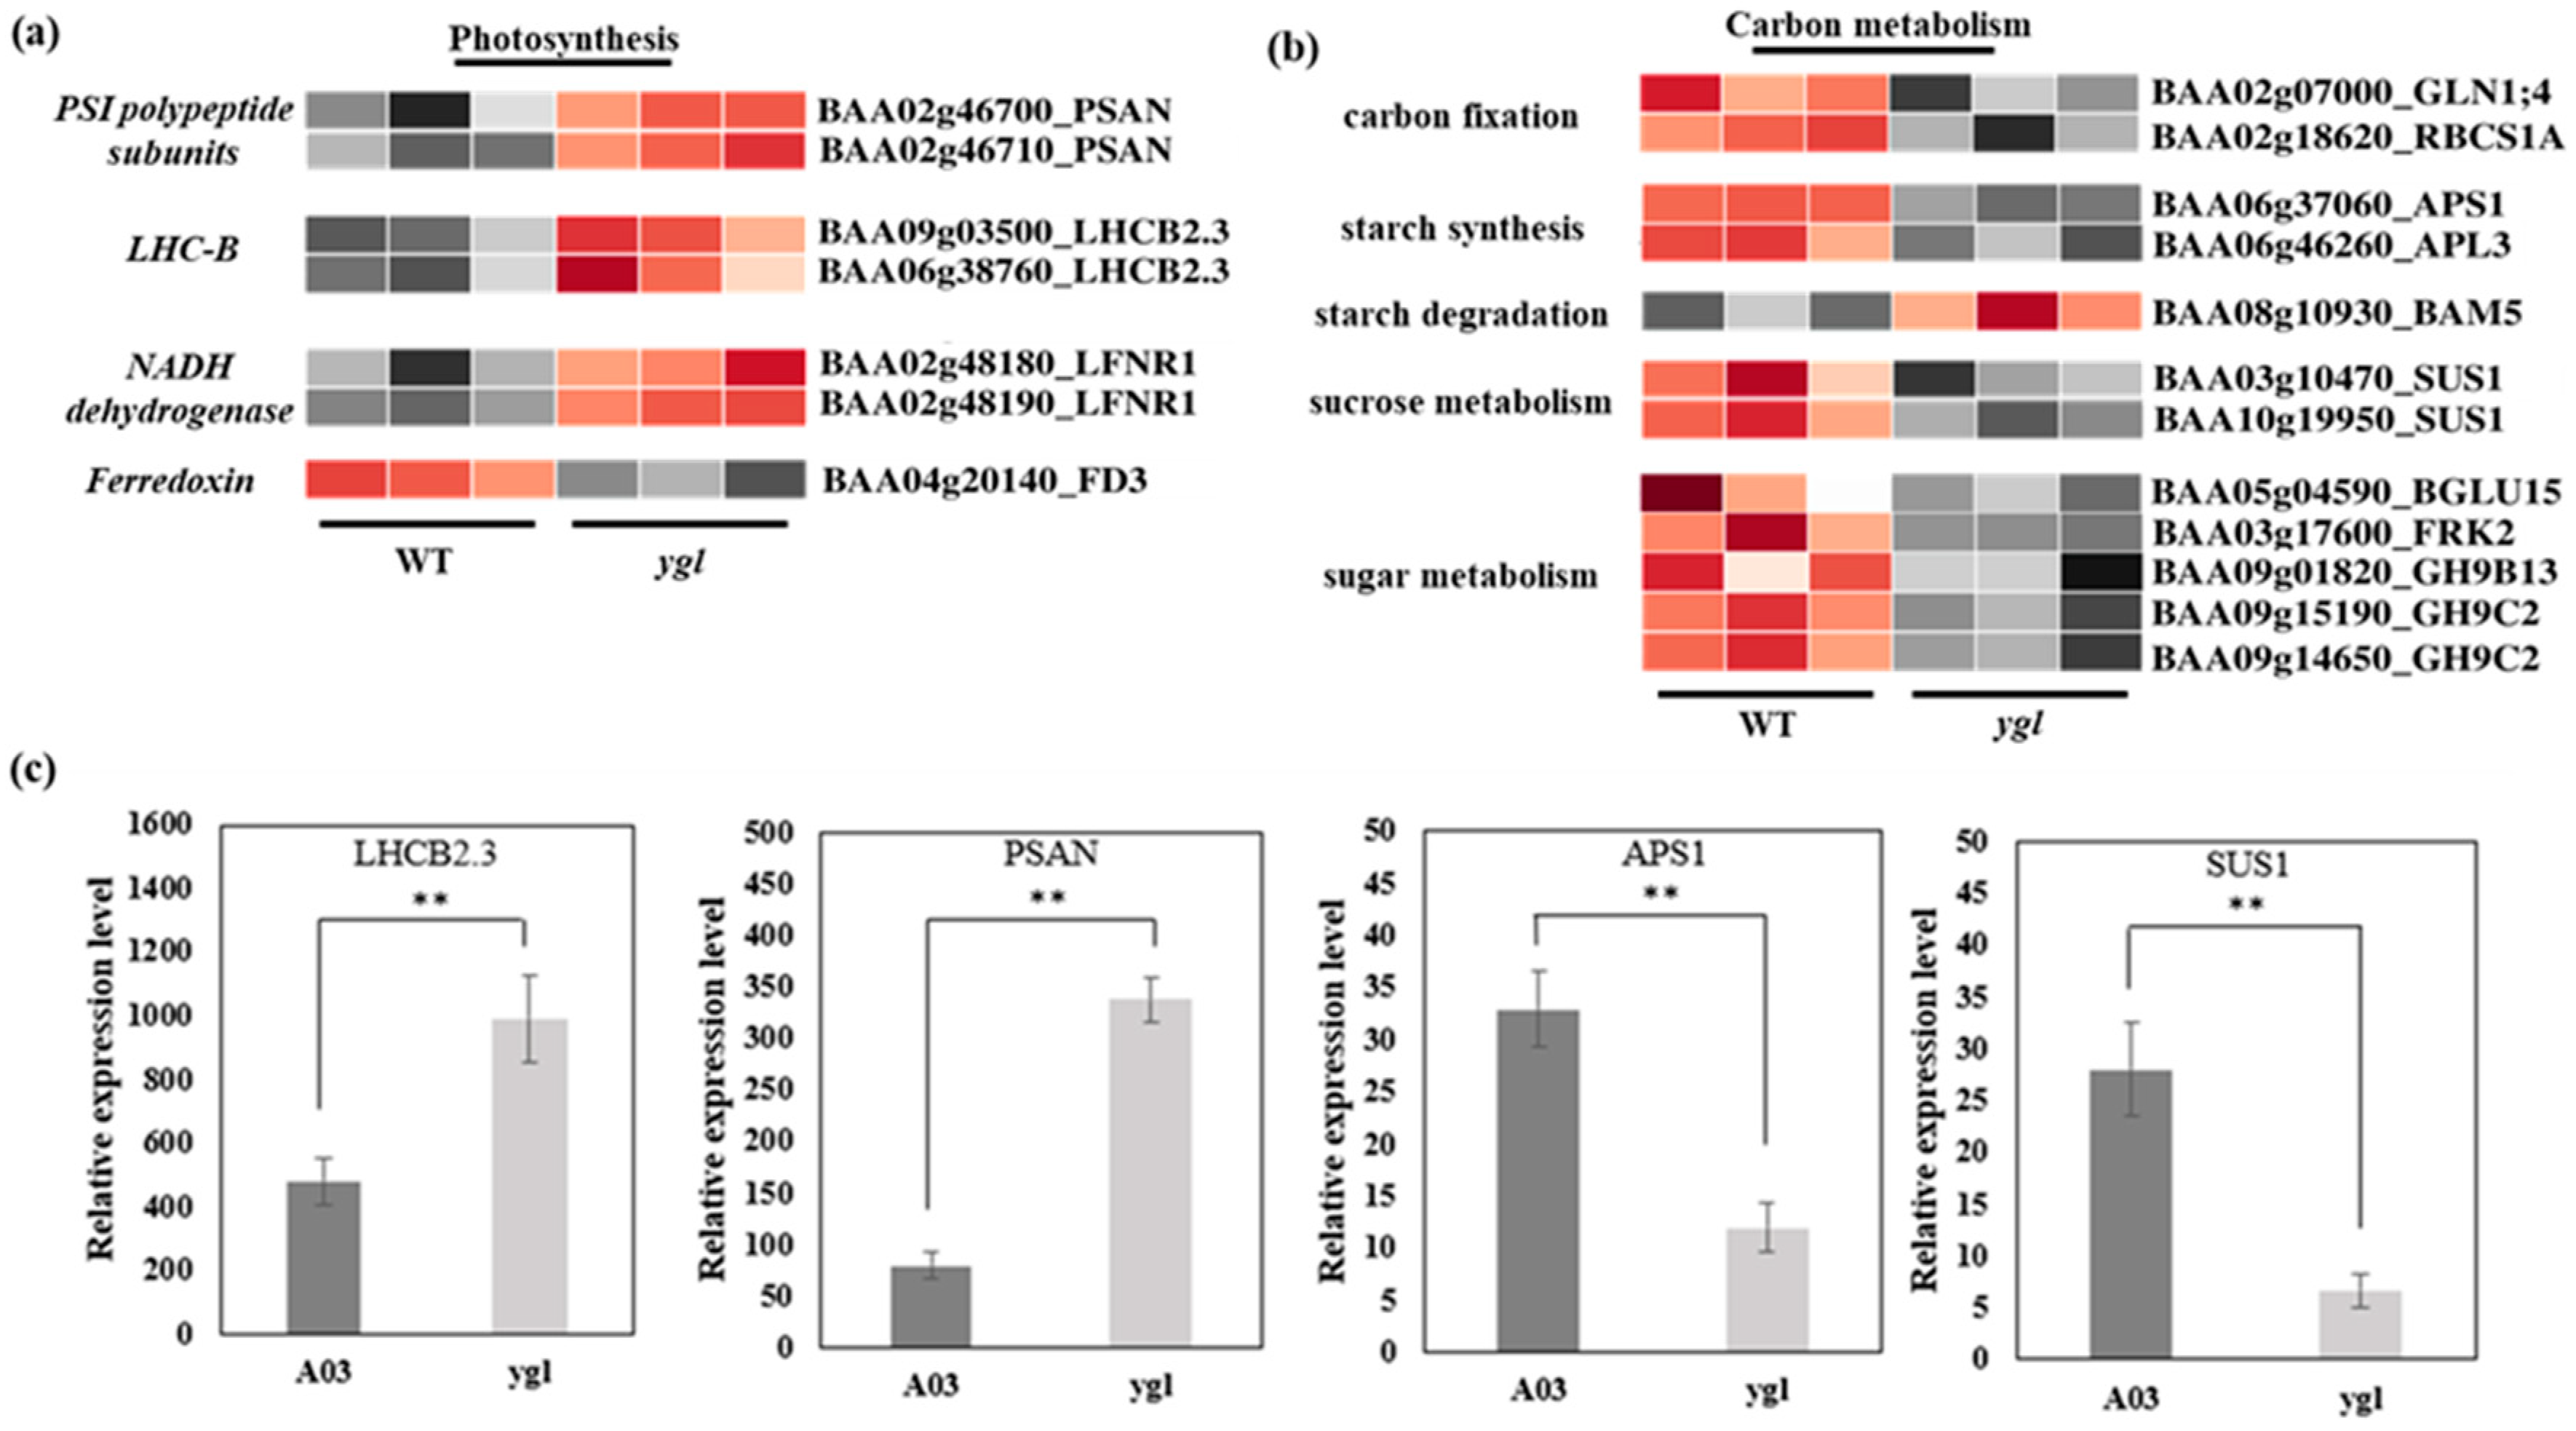
Transcriptome data displayed that seven DEGs were enriched in the photosynthetic pathway between A03 and ygl. Furthermore, we found that the transcriptional levels of PSAN in PSI subunits and LHCB2.3 in photosynthetic antenna protein increased dramatically in ygl by a heat map visualizing DEGs (Figure 4a). At the same time, the level of LFNR1 in NADH dehydrogenase also rose. However, the FD3 level was suppressed, which encoded the ferredoxin. In the carbon metabolism, 12 DEGs were key regulatory genes involved in carbon fixation, starch synthesis, starch degradation, sucrose metabolism, and sugar metabolism (Figure 4b). Among them, the transcriptional levels of Ribulose bisphosphate carboxylase small chain 1A (RBCS1A), starch synthesis ADP-glucose pyrophosphorylase small subunit 1 (APS1), and sucrose metabolism Sucrose synthase 1 (SUS1) were inhibited markedly in ygl. Using qRT-PCR verification, the expression level of DEGs including LHCB2.3, PSAN, APS1, and SUS1 were consistent with the transcriptional level of transcriptome. Compared to A03, LHCB2.3 and PSAN showed remarkable up-regulation in ygl. However, we found a reduction trend in the mRNA levels of APS1 and SUS1 in ygl (Figure 4c).
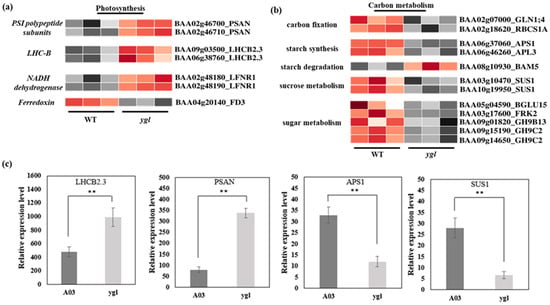
Figure 4.
Heat map visualization of DEGs in photosynthesis and carbon metabolism pathways. The light and dark red lattices represented the up-regulation of gene expression levels, while the light and dark gray lattices represented the down-regulation of gene expression levels. (a) Heat map visualization of DEGs in the photosynthesis pathway. The transcriptional levels of PSAN, LHCB2.3, and LFNR1 were all up–regulated in ygl. However, the FD3 expression level was suppressed in ygl. (b) Heat map visualization of DEGs in carbon fixation, starch metabolism, sucrose metabolism, and sugar metabolism pathways. All the DEGs in carbon fixation, starch synthesis, sucrose metabolism, and sugar metabolism showed a significant down–regulation. However, BAM5 in starch degradation was up–regulated in ygl. (c) The expression levels of four DEGs by RT-qPCR analysis. Compared to A03, LHCB2.3 and PSAN were remarkably up–regulated in ygl. However, APS1 and SUS1 were markedly down-regulated. Asterisks (**) indicate significant differences (p < 0.01).
The differential expression pattern between photosynthetic and carbon metabolism pathways suggests that Chinese cabbage may seek to survive by enhancing photosynthesis–related genes while inhibiting a large number of genes involved in the carbon metabolism cycle when chloroplast development is blocked.
3.5. Analysis of Differential Expression Patterns in Phytohormone Pathways
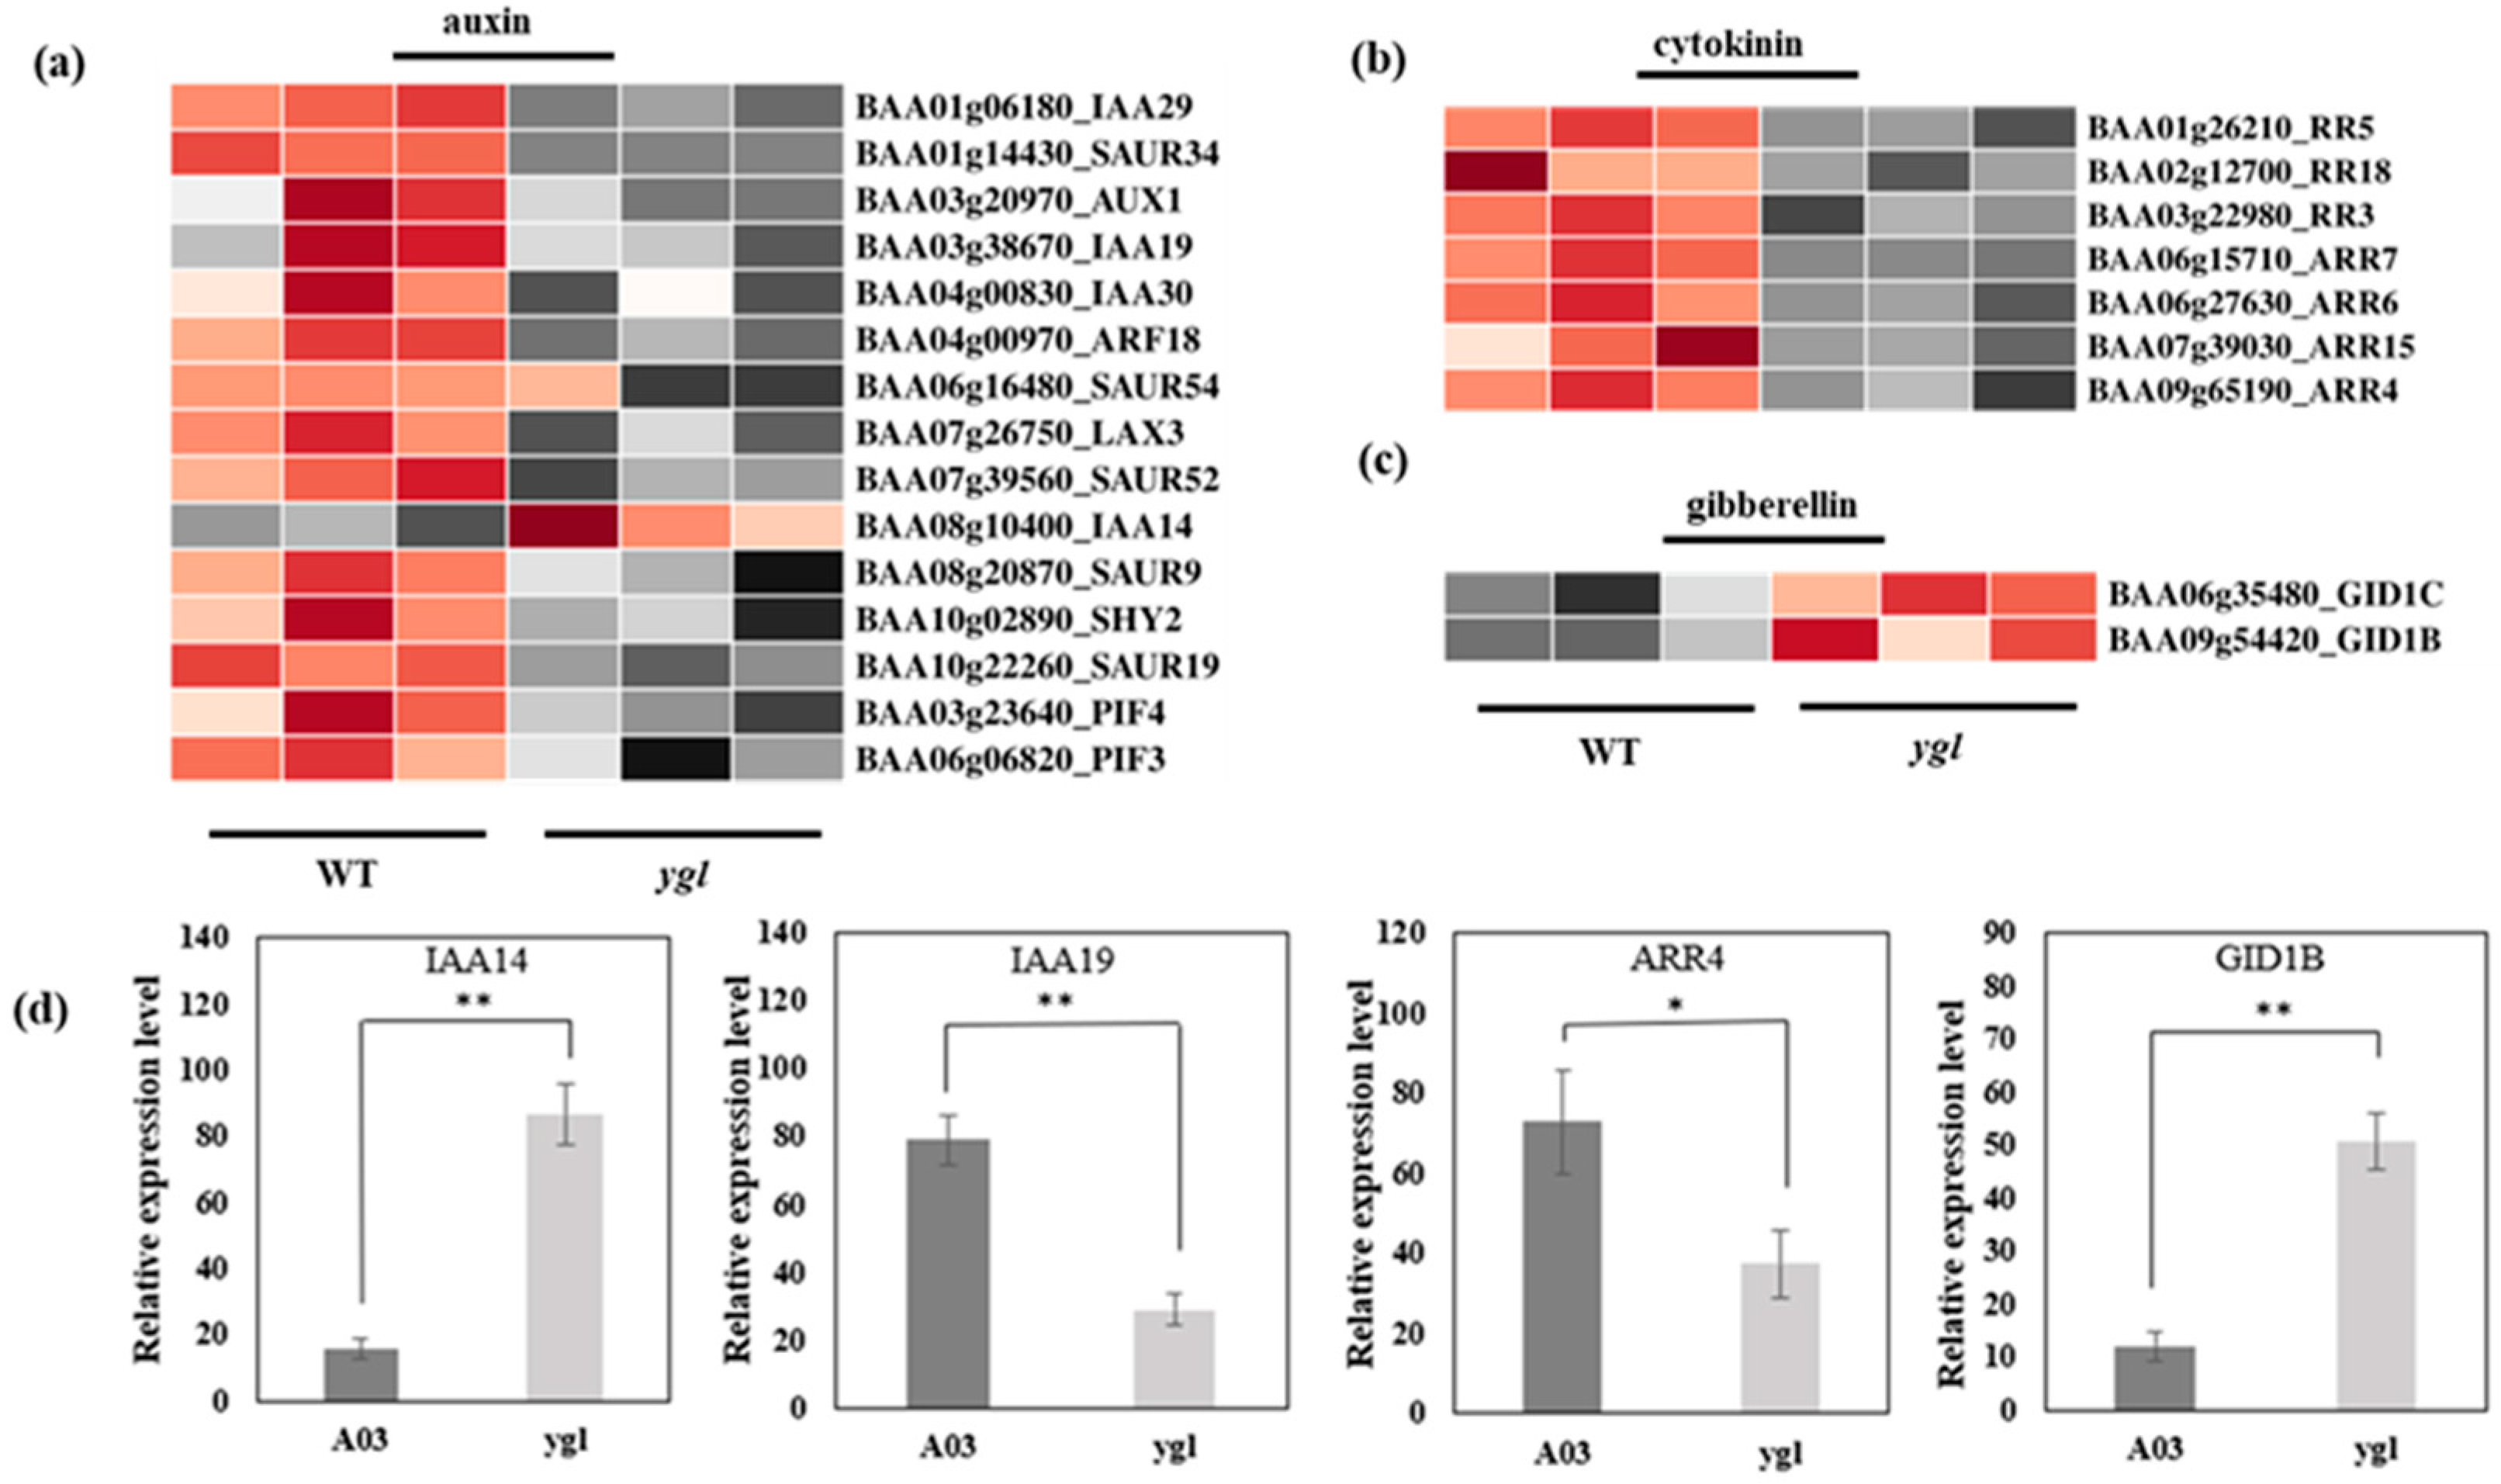
In ygl, all the differentially expressed genes in the auxin pathway were down-regulated, except IAA14 (Figure 5a). In the cytokinin (CK) pathway, the differentially expressed seven genes in the ygl declined markedly (Figure 5b). By contrast, GID1B and GID1C transcriptional levels were obviously up–regulated in the gibberellin (GA) pathway (Figure 5c). The expression level of four DEGs was consistent with the transcriptional level of transcriptome by qRT–PCR. Compared to A03, IAA14 and GID1B were conspicuously up–regulated in ygl. However, the mRNA levels of IAA19 and ARR4 were noticeably down–regulated in ygl (Figure 5d). The hormonal control of chloroplast development in plants has been reported extensively during the transition from skotomorphogenesis to photomorphogenesis [11]. Here, there were serious defects in the chloroplast structure of mutant ygl. Therefore, differentially expressed genes in the phytohormone pathway may affect the chloroplast development, resulting in the yellow-green leaf of ygl.

Figure 5.
Heat map visualization of DEGs in the phytohormone pathway. The light and dark red lattices represented the up-regulation of gene expression levels, while the light and dark gray lattices represented the down-regulation of gene expression levels. (a) Heat map visualization of DEGs in the auxin pathway. All the DEGs in the auxin pathway were down-regulated, except IAA14 in ygl. (b) Heat map visualization of DEGs in the cytokinin pathway. All the DEGs in the cytokinin pathway displayed identical down–regulated trends. (c) Heat map visualization of DEGs in the gibberellin pathway. Both GID1B and GID1C transcriptional levels increased markedly in ygl. (d) The expression levels of four DEGs by qRT–PCR analysis. Compared to A03, IAA14 and GID1B were conspicuously up–regulated in ygl. However, the mRNA levels of IAA19 and ARR4 were noticeably down–regulated in ygl. Asterisks (* or **) indicate significant differences (p < 0.05 or p < 0.01, respectively).
4. Discussion
4.1. Regulated Patterns Involved in the Photosynthetic Pathway, Starch Synthesis, and Sucrose Metabolism
A positive correlation between chlorophyll content and LhcB mRNA level has been previously reported [24,25,26]. For instance, a cucumis melo spontaneous mutant (MT) exhibited yellow–green leaf phenotype and transcriptomic and metabolomic analyses, suggesting that both differential expression genes and differentially accumulated metabolites in MT were markedly enriched in photosynthesis and carbon metabolism pathways. Among them, the expression levels of the light–harvesting antenna protein component (LhcB) declined remarkably [24]. In a yellow-green leaf wucai (Brassica campestris L.) mutant ‘WY16–13’, the most enriched pathway was carbohydrate metabolism, including 127 DEGs and 111 signal transduction DEGs. In particular, the DEGs in photosystem II (PSII), photosystem I (PSI), and the light–harvesting chlorophyll protein complex (LHC) were down-regulated and involved in the photosynthesis pathway [25]. Compared to the green leaf of common wheat, most of the DEGs that mapped to the photosynthesis, carbon metabolism, and carbon fixation pathways displayed the same reduced expression levels in the yellow leaf mutant [26]. These studies indicated that changes in the transcriptional levels of light–harvesting antenna protein and carbon metabolism may block the photosynthesis process, thereby affecting the leaf color. However, in this paper, the gene expression patterns in Section 3.4 were different from the previous studies of leaf color mutants in terms of photosynthesis and carbon metabolism, and it is necessary to explore new transcriptional mechanisms.
The rate of starch biosynthesis is finely controlled to balance the utilization of photoassimilates with their storage in Arabidopsis leaves. ADP glucose pyrophosphorylase (AGPase) catalyzes the first committed step in starch biosynthesis [27], and its transcriptional level contributes to starch production [28]. AGPase determines the flux of carbon into starch and is composed of two small and two large subunits [29,30]. In Arabidopsis thaliana, AGPase consists of two small subunits (APS1 and APS2) and four large subunits (APL1–APL4) [31]. Notably, APS1 is a major catalytic subunit, and its mutant has a low starch phenotype [32]. APS1 and APL1 have highly expressed levels in photosynthetic tissues and, therefore, they play a significant role in leaves [32,33]. Here, the transcriptional level of APS1 and APL3 decreased strikingly, reflecting the inhibition of starch synthesis in the mutant ygl. Little or no data are available for the functions of BAM5 [34]. Previous reports illustrated that BAM5 was likely to be located in cytosolic and mainly localized in sieve elements [35]. Therefore, it is impossible to be directly involved in starch breakdown, which is consistent with the observation that bam5 mutants have normal starch levels [36]. BAM5 protein accounts for 20–90% of the total β–amylase activity in the crude extracts of leaves [37]. Interestingly, the expression of BAM5 is highly variable, depending on sugar levels and the environment. [38]. In this study, the up–regulated transcription level of BAM5 may be an unknown way of regulation after sugar metabolism disorders in Chinese cabbage. In the sucrose synthesis pathway, the expression level of sucrose synthase 1 (SUS1) was down-regulated remarkably. Sucrose synthase is a key enzyme involved in sucrose metabolism in plant tissues, and it is generally believed that the SUS enzyme mainly decomposes sucrose and participates in many important metabolic processes of plants, regulating the distribution of sucrose between source and sink tissues [39] and starch biosynthesis [40].
The stoichiometry of the Calvin–Benson cycle needs more than 5/6ths of the triose phosphates that are used to regenerate RuBP (if photorespiration is happening). The remainder can be utilized to synthesize starch, sucrose, and other final products. It is vital to balance the competing fluxes. Excessive final products can inhibit photosynthesis since little RuBP is regenerated; however, low final product synthesis will result in the accumulation of phosphorylated intermediates, the suppression of ATP, the depletion of free Pi, and CO2 fixation [41]. Taken together, in the ygl mutants, the transcripts of key genes in starch synthesis and the sucrose metabolism pathway were inhibited, while the genes related to the photosynthetic pathway were up–regulated. The plants may maintain RuBP regeneration by enhancing photosynthesis and reducing the metabolism of triose phosphate in other pathways, thus seeking to survive when the development of chloroplasts is blocked.
4.2. Auxin Can Impact Chlorophyll Synthesis and Chloroplast Development
The relationship between auxin and chloroplast development is known. For example, chlorophyll content increases in tomato and camphor leaves treated with auxin [42,43]. The higher expression level of auxin in tea was detected in a cool environment, which was closely related to growing expression levels of genes involved in chlorophyll synthesis and chloroplast development [44]. Therefore, here, we speculate the correlation between down-regulated auxin genes and the etiolation phenotype in ygl. In A. thaliana, auxin repressed chlorophyll accumulation by inhibiting chlorophyll synthesis genes mediated by ARF7–IAA14 [45]. In this study, we observed yellowing leaves and developmental defects of thylakoids in chloroplasts. Meanwhile, IAA14 was up–regulated in ygl, which may play an inhibitory role in chlorophyll synthesis in Chinese cabbage. In addition, PIF is a key regulator of chloroplast development and photosynthesis and inhibits the transcription of some PhANG genes in the dark. When sensing red light, Pfr inhibits PIF by triggering the phosphorylation and degradation of proteasomes [46]. In the phototropism study, PIF4 directly activated the expression of IAA19 and IAA29 by binding to the G–box (CACGTG) motif of the promoter in the auxin/indole-3-acetic acid (IAA) [47]. However, the expression levels of PIF3, PIF4, IAA19, and IAA29 were markedly reduced in ygl. In this study, the down–regulation of PIF4 may result in a decline in the transcriptional levels of IAA19 and IAA29, affecting the phototropic growth of Chinese cabbage.
4.3. Cytokinin Positively Regulates Chloroplast Biogenesis
Previous studies have displayed that cytokinins (CKs) positively controlled chloroplast biosynthesis and development [11,48]. In addition, CK has an effect on the process of de–etiolation. Although A. thaliana seedlings did not accumulate chlorophyll in the dark treated with exogenous CK, they exhibited light-grown phenotypes with larger etioplasts containing thylakoid membranes [49]. Judging from the yellow leaf and damages of chloroplasts in ygl, we speculate that the down-regulated genes of the cytokinin pathway may impact the chloroplast biogenesis and de–etiolation. It has been reported that ARR4 mediated the communication between light and cytokinin signals by regulating the activity of phytochrome B [50]. Therefore, the expression level of ARR4 declined remarkably, which may have an influence on the cross-talk between light conduction and cytokinin signals in ygl.
4.4. Gibberellin Balances Chloroplast Development during Skotomorphogenesis and Photomorphogenesis
Gibberellin promoted hypocotyl elongation and inhibited PhANG expression in the dark. Seedlings with decreased GA levels appeared as partial de–etiolated phenotypes, such as GA biosynthesis mutants, in the dark [11]. It was proved that CRY1 coordinated blue light and GA signal transduction to achieve photomorphogenesis, specifically by stabilizing DELLAs through binding and inactivating GID1s [51]. Here, the up–regulated expression of GID1B and GID1C would lead to de-etiolation suppression in photomorphogenesis in ygl.
4.5. Interactions between Photosynthesis and Phytohormones in Plants
To understand the influence of phytohormones on photosynthesis in plants, it is essential to consider them on a whole physiological level since communications between the root and shoot mainly depends on their interconnection. When plants grow, the crucial process of photosynthesis is to constantly remove triose phosphates from the Calvin cycle through starch formation and instantaneous storage in the chloroplasts or export them to the cytosol to fuel sucrose synthesis [52]. Thus, it has a complicated network for carbohydrate partitioning that correlates to sugar and phytohormone signaling. Auxins negatively control the photosynthesis process by the inhibition of stoma formation but promote photosynthesis by leaf venation [53]. CKs and GAs are considered to be vital regulators in the translocation of photosynthate from the source to the sink organ, and they mediate the translocation by promoting the activities of extracellular invertase, which increases the sink strength [54]. Moreover, auxins have been linked to sucrose synthase recently, which decomposes sucrose into fructose, and UDP glucose and may play a key role in sink strength [55]. It is also found that there is an interaction among glucose, GAs, and ABA by the transcription factor ABA STRESS RIPENING 1 (ASR1) in plants. In tobacco, transgenic lines of reducing ASR1 protein levels reveal increased ABA, GA concentrations, and impaired glucose metabolism [56]. These findings uncover that the interactions between sugar, ABA, and GAs have an effect on photosynthesis in terms of carbon partitioning in plants. In this study, DEGs found mainly in photosynthesis and phytohormone pathways demonstrate the correlations between leaf color, and its profound molecular mechanisms remain a complex challenge. Recent works have elucidated that interactions between light and phytohormones play a crucial role in chloroplast development. Furthermore, it is noteworthy that an integrated hormonal response enables plants to regulate photosynthetic responses to different environmental conditions. Thus, it is important to have a better understanding of plant development, which has significant economic implications in the agricultural sectors.
5. Conclusions
In this study, we characterized an EMS mutant (ygl) with a yellow-green leaf in Chinese cabbage. Its ultrastructure of chloroplasts was obviously destroyed. Transcriptome analyses showed that 742 differentially expressed genes (DEGs) were up-regulated and 997 DEGs were down-regulated compared to WT. The combined GO and KEGG analysis indicated that photosynthesis, starch and sucrose metabolism, and plant hormone signal transduction were key pathways related to the yellow-green leaf color. We validated the expression levels of key genes such as PSAN LHCB2.3, APS1, and SUS1 by qRT-PCR and found a potential regulatory mechanism. Our findings offer a germplasm resource to study photosynthesis and chloroplast development, which would help facilitate Chinese cabbage breeding with leaf color.
Supplementary Materials
The following supporting information can be downloaded at https://www.mdpi.com/article/10.3390/agronomy13092273/s1, Figure S1: Transcriptome differentially expressed genes (DEGs) between A03 and ygl. 742 DEGs were up-regulated and 997 DEGs were down-regulated.
Author Contributions
Conceptualization, G.L.; methodology, G.L.; investigation, G.L., H.L., X.R., Z.Z., Z.W. and T.Z.; resources, Y.L.; data curation, G.L.; writing—original draft preparation, G.L. and H.L.; writing—review and editing, J.Z.; project administration, X.R., Z.Z., Z.W. and T.Z.; funding acquisition, W.M. and J.Z. All authors have read and agreed to the published version of the manuscript.
Funding
This research was funded by the Science Fund for Distinguished Young Scholars of Hebei Province (grant No. C2021204049) and the National Natural Science Foundation of China (32272712).
Data Availability Statement
The data presented in this study are available on request from the corresponding author.
Conflicts of Interest
The authors declare no conflict of interest.
References
- Kumar, A.M.; Söll, D. Antisense HEMA1 RNA expression inhibits heme and chlorophyll biosynthesis in Arabidopsis. Plant Physiol. 2000, 122, 49–56. [Google Scholar] [CrossRef] [PubMed]
- Nagata, N.; Tanaka, R.; Satoh, S.; Tanaka, A. Identification of a vinyl reductase gene for chlorophyll synthesis in Arabidopsis thaliana and implications for the evolution of Prochlorococcus species. Plant Cell 2005, 17, 233–240. [Google Scholar] [CrossRef] [PubMed]
- Frick, G.; Su, Q.; Apel, K.; Armstrong, G.A. An Arabidopsis porB porC double mutant lacking light-dependent NADPH: Protochlorophyllide oxidoreductases B and C is highly chlorophyll-deficient and developmentally arrested. Plant J. 2003, 35, 141–153. [Google Scholar] [CrossRef]
- Walter, M.; Piepenburg, K.; Schöttler, M.A.; Petersen, K.; Kahlau, S.; Tiller, N.; Drechsel, O.; Weingartner, M.; Kudla, J.; Bock, R. Knockout of the plastid RNase E leads to defective RNA processing and chloroplast ribosome deficiency. Plant J. 2010, 64, 851–863. [Google Scholar] [CrossRef]
- Alameldin, H.F.; Oh, S.; Hernandez, A.P.; Montgomery, B.L. Nuclear-encoded sigma factor 6 (SIG6) is involved in the block of greening response in Arabidopsis thaliana. Am. J. Bot. 2020, 107, 329–338. [Google Scholar] [CrossRef] [PubMed]
- Wu, G.Z.; Bock, R. GUN control in retrograde signaling: How GENOMES UNCOUPLED proteins adjust nuclear gene expression to plastid biogenesis. Plant Cell 2021, 33, 457–474. [Google Scholar] [CrossRef] [PubMed]
- Rolland, F.; Baena-Gonzalez, E.; Sheen, J. Sugar sensing and signaling in plants: Conserved and novel mechanisms. Annu. Rev. Plant Biol. 2006, 57, 675–709. [Google Scholar] [CrossRef] [PubMed]
- Hanson, J.; Smeekens, S. Sugar perception and signaling—An update. Curr. Opin. Plant Biol. 2009, 12, 562–567. [Google Scholar] [CrossRef]
- Rolland, F.; Moore, B.; Sheen, J. Sugar sensing and signaling in plants. Plant Cell 2002, 14, S185–S205. [Google Scholar] [CrossRef]
- Gibson, S.I. Sugar and phytohormone response pathways: Navigating a signaling network. J. Exp. Bot. 2004, 55, 253–264. [Google Scholar] [CrossRef]
- Cackett, L.; Luginbuehl, L.H.; Schreier, T.B.; Lopez-Juez, E.; Hibberd, J.M. Chloroplast development in green plant tissues: The interplay between light, hormone, and transcriptional regulation. New Phytol. 2022, 233, 2000–2016. [Google Scholar] [CrossRef]
- Yaronskaya, E.; Vershilovskaya, I.; Poers, Y.; Alawady, A.E.; Averina, N.; Grimm, B. Cytokinin effects on tetrapyrrole biosynthesis and photosynthetic activity in barley seedlings. Planta 2006, 224, 700–709. [Google Scholar] [CrossRef] [PubMed]
- Cortleven, A.; Marg, I.; Yamburenko, M.V.; Schlicke, H.; Hill, K.; Grimm, B.; Schaller, G.E.; Schmeulling, T. Cytokinin regulates the etioplast-chloroplast transition through the two-component signalling system and activation of chloroplast-related genes. Plant Physiol. 2016, 172, 464–478. [Google Scholar] [CrossRef]
- Achard, P.; Genschik, P. Releasing the brakes of plant growth: How GAs shutdown DELLA proteins. J. Exp. Bot. 2009, 60, 1085–1092. [Google Scholar] [CrossRef] [PubMed]
- Acevedo-Hernández, G.J.; León, P.; Herrera-Estrella, L.R. Sugar and ABA responsiveness of a minimal RBCS light-responsive unit is mediated by direct binding of ABI4. Plant J. 2005, 43, 506–519. [Google Scholar] [CrossRef] [PubMed]
- Li, S.; Wang, S.; Wang, P.; Gao, L.; Yang, R.; Li, Y. Label-free comparative proteomic and physiological analysis provides insight into leaf color variation of the golden-yellow leaf mutant of Lagerstroemia indica. J. Proteom. 2020, 228, 103942. [Google Scholar] [CrossRef] [PubMed]
- Cheng, M.; Meng, F.; Mo, F.; Qi, H.; Wang, P.; Chen, X.; Liu, J.; Ghanizadeh, H.; Zhang, H.; Wang, A. Slym1 control the color etiolation of leaves by facilitating the decomposition of chlorophyll in tomato. Plant Sci. 2022, 324, 111457. [Google Scholar] [CrossRef]
- Lin, N.; Gao, Y.; Zhou, Q.; Ping, X.; Li, J.; Liu, L.; Yin, J. Genetic mapping and physiological analysis of chlorophyll-deficient mutant in Brassica napus L. BMC Plant Biol. 2022, 22, 244. [Google Scholar] [CrossRef]
- Li, X.; Huang, S.; Liu, Z.; Hou, L.; Feng, H. Mutation in EMB1923 gene promoter is associated with chlorophyll deficiency in Chinese cabbage (Brassica campestris ssp. pekinensis). Physiol. Plant. 2019, 166, 909–920. [Google Scholar] [CrossRef]
- Kalariya Kuldeepsingh, A.; Arnon, D.I.; Bilger, W.; Bjorkman, O.; Bogale, A.; Tesfaye, K.; Geleto, T.; Dwyer, J.F. Transcriptomic insights of photosynthetic efficiency in Gymnema sylvestre (Retz.) R. Br. Med. Plants Int. J. Phytomed. Relat. Ind. 2021, 13, 601–615. [Google Scholar] [CrossRef]
- Li, W.; Yang, S.; Lu, Z.; He, Z.; Ye, Y.; Zhao, B.; Wang, L.; Jin, B. Cytological, physiological, and transcriptomic analyses of golden leaf coloration in Ginkgo biloba L. Hortic. Res. 2018, 5, 12. [Google Scholar] [CrossRef] [PubMed]
- Sun, X.; Li, X.; Lu, Y.; Wang, S.; Zhang, X.; Zhang, K.; Su, X.; Liu, M.; Feng, D.; Luo, S.; et al. Construction of a high-density mutant population of Chinese cabbage facilitates the genetic dissection of agronomic traits. Mol. Plant 2022, 15, 913–924. [Google Scholar] [CrossRef] [PubMed]
- Su, X.; Yue, X.; Kong, M.; Xie, Z.; Yan, J.; Ma, W.; Wang, Y.; Zhao, J.; Zhang, X.; Liu, M. Leaf Color Classification and Expression Analysis of Photosynthesis-Related Genes in Inbred Lines of Chinese Cabbage Displaying Minor Variations in Dark-Green Leaves. Plants 2023, 12, 2124. [Google Scholar] [CrossRef] [PubMed]
- Han, H.; Zhou, Y.; Liu, H.; Chen, X.; Wang, Q.; Zhuang, H.; Sun, X.; Ling, Q.; Zhang, H.; Wang, B.; et al. Transcriptomics and Metabolomics Analysis Provides Insight into Leaf Color and Photosynthesis Variation of the Yellow-Green Leaf Mutant of Hami Melon (Cucumis melo L.). Plants 2023, 12, 1623. [Google Scholar] [CrossRef] [PubMed]
- Nie, L.; Zheng, Y.; Zhang, L.; Wu, Y.; Zhu, S.; Hou, J.; Chen, G.; Tang, X.; Wang, C.; Yuan, L. Characterization and transcriptomic analysis of a novel yellow-green leaf wucai (Brassica campestris L.) germplasm. BMC Genom. 2021, 22, 258. [Google Scholar] [CrossRef]
- Wu, H.; Shi, N.; An, X.; Liu, C.; Fu, H.; Cao, L.; Feng, Y.; Sun, D.; Zhang, L. Candidate Genes for Yellow Leaf Color in Common Wheat (Triticum aestivum L.) and Major. Related Metabolic Pathways according to Transcriptome Profiling. Int. J. Mol. Sci. 2018, 19, 1594. [Google Scholar] [CrossRef]
- Crevillén, P.; Ballicora, M.A.; Mérida, A.; Preiss, J.; Romero, J.M. The different large subunit isoforms of Arabidopsis thaliana ADP-glucose pyrophosphorylase confer distinct kinetic and regulatory properties to the heterotetrameric enzyme. J. Biol. Chem. 2003, 278, 28508–28515. [Google Scholar] [CrossRef]
- Sweetlove, L.J.; Muller-Rober, B.; Willmitzer, L.; Hill, S.A. The contribution of adenosine 5′-diphosphoglucose pyrophosphorylase to the control of starch synthesis in potato tubers. Planta 1999, 209, 330–337. [Google Scholar] [CrossRef]
- Smith-White, B.J.; Preiss, J. Comparison of proteins of ADP-glucose pyrophosphorylase from diverse sources. J. Mol. Evol. 1992, 34, 449–464. [Google Scholar] [CrossRef]
- Rook, F.; Corke, F.; Card, R.; Munz, G.; Smith, C.; Bevan, M.W. Impaired sucrose-induction mutants reveal the modulation of sugar-induced starch biosynthetic gene expression by abscisic acid signalling. Plant J. 2001, 26, 421–433. [Google Scholar] [CrossRef]
- Ventriglia, T.; Kuhn, M.L.; Ruiz, M.T.; Ribeiro-Pedro, M.; Valverde, F.; Ballicora, M.A.; Preiss, J.; Romero, J.M. Two Arabidopsis ADP-glucose pyrophosphorylase large subunits (APL1 and APL2) are catalytic. Plant Physiol. 2008, 148, 65–76. [Google Scholar] [CrossRef] [PubMed]
- Lin, T.P.; Caspar, T.; Somerville, C.; Preiss, J. Isolation and characterization of a starchless mutant of Arabidopsis thaliana (L.) Heynh lacking ADP glucose pyrophosphorylase activity. Plant Physiol. 1988, 86, 1131–1135. [Google Scholar] [CrossRef] [PubMed]
- Lin, T.P.; Caspar, T.; Somerville, C.R.; Preiss, J. A starch deficient mutant of Arabidopsis thaliana with low ADP glucose pyrophosphorylase activity lacks one of the two subunits of the enzyme. Plant Physiol. 1988, 88, 1175–1181. [Google Scholar] [CrossRef] [PubMed]
- Chandler, J.W.; Apel, K.; Melzer, S. A novel putative β-amylase gene and ATβ-Amy from Arabidopsis thaliana are circadian regulated. Plant Sci. 2001, 161, 1019–1024. [Google Scholar] [CrossRef]
- Wang, Q.; Monroe, J.; Sjolund, R.D. Identification and characterization of a phloem-specific β-amylase. Plant Physiol. 1995, 109, 743–750. [Google Scholar] [CrossRef] [PubMed]
- Laby, R.J.; Kim, D.; Gibson, S.I. The ram1 mutant of Arabidopsis exhibits severely decreased β-amylase activity. Plant Physiol. 2001, 127, 1798–1807. [Google Scholar] [CrossRef] [PubMed]
- Fulton, D.C.; Stettler, M.; Mettler, T.; Vaughan, C.K.; Li, J.; Francisco, P.; Gil, M.; Reinhold, H.; Eicke, S.; Messerli, G.; et al. β-AMYLASE4, a noncatalytic protein required for starch breakdown, acts upstream of three active β-amylases in Arabidopsis chloroplasts. Plant Cell 2008, 20, 1040–1058. [Google Scholar] [CrossRef]
- Mita, S.; Murano, N.; Akaike, M.; Nakamura, K. Mutants of Arabidopsis thaliana with pleiotropic effects on the expression of the gene for beta-amylase and on the accumulation of anthocyanin that are inducible by sugars. Plant J. 1997, 11, 841–851. [Google Scholar] [CrossRef]
- Haigler, C.H.; Ivanova-Datcheva, M.; Hogan, P.S.; Salnikov, V.V.; Hwang, S.; Martin, K.; Delmer, D.P. Carbon partitioning to cellulose synthesis. Plant Mol. Biol. 2001, 47, 29–51. [Google Scholar] [CrossRef]
- Barratt, D.H.; Barber, L.; Kruger, N.J.; Smith, A.M.; Wang, T.L.; Martin, C. Multiple, distinct isoforms of sucrose synthase in pea. Plant Physiol. 2001, 127, 655–664. [Google Scholar] [CrossRef]
- Stitt, M.; Lunn, J.; Usadel, B. Arabidopsis and primary photosynthetic metabolism—More than the icing on the cake. Plant J. 2010, 61, 1067–1091. [Google Scholar] [CrossRef] [PubMed]
- Zhou, J.; Cheng, K.; Huang, G.; Chen, G.; Zhou, S.; Huang, Y.; Zhang, J.; Duan, H.; Fan, H. Effects of exogenous 3-indoleacetic acid and cadmium stress on the physiological and biochemical characteristics of Cinnamomum camphora. Ecotoxicol. Environ. Saf. 2020, 191, 109998. [Google Scholar] [CrossRef] [PubMed]
- Khan, M.Y.; Prakash, V.; Yadav, V.; Chauhan, D.K.; Prasad, S.M.; Ramawat, N.; Singh, V.P.; Tripathi, D.K.; Sharma, S. Regulation of cadmium toxicity in roots of tomato by indole acetic acid with special emphasis on reactive oxygen species production and their scavenging. Plant Physiol. Biochem. 2019, 142, 193–201. [Google Scholar] [CrossRef] [PubMed]
- Liu, L.; Lin, N.; Liu, X.; Yang, S.; Wang, W.; Wan, X. From Chloroplast Biogenesis to Chlorophyll Accumulation: The Interplay of Light and Hormones on Gene Expression in Camellia sinensis cv. Shuchazao Leaves. Front. Plant Sci. 2020, 11, 256. [Google Scholar] [CrossRef]
- Luo, W.G.; Liang, Q.W.; Su, Y.; Huang, C.; Mo, B.X.; Yu, Y.; Xiao, L.T. Auxin inhibits chlorophyll accumulation through ARF7-IAA14-mediated repression of chlorophyll biosynthesis genes in Arabidopsis. Front. Plant Sci. 2023, 14, 1172059. [Google Scholar] [CrossRef]
- Bauer, D.; Viczián, A.; Kircher, S.; Nobis, T.; Nitschke, R.; Kunkel, T.; Panigrahi, K.C.; Adám, E.; Fejes, E.; Schäfer, E.; et al. Constitutive photomorphogenesis 1 and multiple photoreceptors control degradation of phytochrome interacting factor 3, a transcription factor required for light signaling in Arabidopsis. Plant Cell 2004, 16, 1433–1445. [Google Scholar] [CrossRef]
- Sun, J.; Qi, L.; Li, Y.; Zhai, Q.; Li, C. PIF4 and PIF5 transcription factors link blue light and auxin to regulate the phototropic response in Arabidopsis. Plant Cell 2013, 25, 2102–2114. [Google Scholar] [CrossRef]
- Cortleven, A.; Schmülling, T. Regulation of chloroplast development and function by cytokinin. J. Exp. Bot. 2015, 66, 4999–5013. [Google Scholar] [CrossRef]
- Chory, J.; Reinecke, D.; Sim, S.; Washburn, T.; Brenner, M. A role for cytokinins in de-etiolation in Arabidopsis (det mutants have an altered response to cytokinins). Plant Physiol. 1994, 104, 339–347. [Google Scholar] [CrossRef]
- Chi, W.; Li, J.; He, B.; Chai, X.; Xu, X.; Sun, X.; Jiang, J.; Feng, P.; Zuo, J.; Lin, R.; et al. DEG9, a serine protease, modulates cytokinin and light signaling by regulating the level of ARABIDOPSIS RESPONSE REGULATOR 4. Proc. Natl. Acad. Sci. USA 2016, 113, E3568–E3576. [Google Scholar] [CrossRef]
- Zhong, M.; Zeng, B.; Tang, D.; Yang, J.; Qu, L.; Yan, J.; Wang, X.; Li, X.; Liu, X.; Zhao, X. The blue light receptor CRY1 interacts with GID1 and DELLA proteins to repress GA signaling during photomorphogenesis in Arabidopsis. Mol. Plant. 2021, 14, 1328–1342. [Google Scholar] [CrossRef] [PubMed]
- Müller, M.; Munné-Bosch, S. Hormonal impact on photosynthesis and photoprotection in plants. Plant Physiol. 2021, 185, 1500–1522. [Google Scholar] [CrossRef]
- Qi, X.; Torii, K.U. Hormonal and environmental signals guiding stomatal development. BMC Biol. 2018, 16, 21. [Google Scholar] [CrossRef] [PubMed]
- Wu, L.; Mitchell, J.P.; Cohn, N.S.; Kaufman, P.B. Gibberellin (GA3) enhances cell wall invertase activity and mRNA levels in elongating dwarf pea (Pisum sativum) shoots. Int. J. Plant Sci. 1993, 154, 280–289. [Google Scholar] [CrossRef] [PubMed]
- Stein, O.; Granot, D. An overview of sucrose synthases in plants. Front. Plant Sci. 2019, 10, 95. [Google Scholar] [CrossRef] [PubMed]
- Dominguez, P.G.; Frankel, N.; Mazuch, J.; Balbo, I.; Iusem, N.; Fernie, A.R.; Carrari, F. ASR1 mediates glucose-hormone cross talk by affecting sugar trafficking in tobacco plants. Plant Physiol. 2013, 161, 1486–1500. [Google Scholar] [CrossRef] [PubMed]
Disclaimer/Publisher’s Note: The statements, opinions and data contained in all publications are solely those of the individual author(s) and contributor(s) and not of MDPI and/or the editor(s). MDPI and/or the editor(s) disclaim responsibility for any injury to people or property resulting from any ideas, methods, instructions or products referred to in the content. |
© 2023 by the authors. Licensee MDPI, Basel, Switzerland. This article is an open access article distributed under the terms and conditions of the Creative Commons Attribution (CC BY) license (https://creativecommons.org/licenses/by/4.0/).