Article

Effect of Nitrogen Fertilization and Inoculation of Durum Wheat with Fusarium pseudograminearum on Yield, Technological Quality and Gluten Protein Composition

NSW Department of Primary Industries, Tamworth Agricultural Institute, Tamworth 2340, Australia
*
Author to whom correspondence should be addressed.
Agronomy 2023, 13(6), 1658; https://doi.org/10.3390/agronomy13061658
Submission received: 25 May 2023 / Revised: 14 June 2023 / Accepted: 16 June 2023 / Published: 20 June 2023
(This article belongs to the Section Crop Breeding and Genetics)

Abstract

:
In Australia, adoption of reduced tillage and stubble retention cropping systems by growers to conserve soil moisture has seen an increase in the prevalence of the disease Fusarium crown rot (FCR) caused by the stubble-borne fungal pathogen Fusarium pseudograminearum. Durum wheat is particularly susceptible to FCR, exhibiting significant yield and quality losses in the presence of infection. Increasing rates of nitrogen (N) application at sowing exacerbates FCR. However, to achieve the desired grain protein and quality suited to pasta manufacturing, N application is necessary, and this creates a dilemma for growers. The purpose of this study was to investigate the effects of FCR infection in the presence of different N fertiliser application rates in durum wheat varieties on the yield and technological quality. Two durum varieties were evaluated at the same location over two seasons (2020 and 2021). These seasons were characterised by being wetter than normal and showed different responses to FCR and N application. Three rates of FCR inoculation and five rates of N fertilizer were applied (varying according to season) at sowing. In general, the 2021 season showed better responses to applied N regarding the yield and technological properties, with no impact from FCR. The FCR inoculation, while resulting in significant infections in 2020 (15–36-fold increase) and in 2021 (~45-fold increase), had no impacts on the yield or grain quality in 2021, while in 2020, the yield was reduced (24.9%), with variable effects on the technological properties. The 2021 season showed much more responses to applied N (grain protein increased by ~24%). Jandaroi was found to maintain its kernel vitreosity at all protein levels (mean of 88.5%), obtaining the premium grade, while DBA Lillaroi did not (mean vitreosity of 76.6%) and could be downgraded if N application was insufficient. However, higher N application rates needed to achieve more than 12% protein lead to a reduction in dough strength, with Jandaroi maintaining its dough strength much better (2.7% reduction in the gluten index) than DBA Lillaroi (18.2% reduction in the gluten index). This was related to the lower glutenin/gliadin (Gli/Glu) ratio in response to applied N at sowing in Jandaroi, which helped retain kernels with a high vitreousness. This suggests genetics plays an important role in a genotype’s response to N fertilisation and should be considered when selecting a genotype where higher premium grades are desirable.

1. Introduction

Durum wheat (Triticum durum L. ssp. Durum Desf.) is an important crop for the human diet grown in many parts of the world predominantly for semolina and resulting pasta production. Durum is a high yielding wheat typically grown under rainfed conditions in semiarid regions that are characterised by unpredictable and highly variable seasonal rainfall, affecting the yield and quality [1]. In the Australian environment, most durum wheat is grown in Northern New South Wales (NNSW) and South Australia. In NNSW, durum wheat is grown as a dryland crop on fertile cracking clay soils that can store water from the typical summer rains in the profile, and this enables the crop to better tolerate heat and moisture stress during ear emergence, anthesis and grain filling. Durum attracts a premium price in the market, but this depends on meeting grading standards in some countries [2]. In Australia, the key quality attributes to ensure the highest grade (ADR1) are grain protein ≥13% (11% mb) (GP), test weight ≥76 kg/hl (TW), screenings < 5%, hard vitreous kernels ≥80% (HVK) and other factors related to seed contamination and staining [3]. To achieve high grain protein usually requires high levels of nitrogen (N) input, reliant on the application of artificial N, commonly urea, which represents around 30–40% of input costs when targeting these higher quality cereal options [4]. Decisions on how much N to apply and when and the choice of genotype together with climatic and soil factors can all affect the yield and market grading achieved for durum wheat in the NNSW environment. Understanding these interactions is important to achieve the most profitable outcome for the grower.
In Australia, adoption of reduced tillage and stubble retention cropping systems to conserve soil moisture by growers has revolutionised crop production in this region but has led to an increase in the prevalence of the disease Fusarium crown rot (FCR) caused by the stubble-borne fungal pathogen Fusarium pseudograminearum [5,6]. F. pseudograminearum infects a wide range of winter cereals, including bread wheat (Triticum aestivum), durum wheat and barley (Hordeum vulgare), along with grass weed hosts [7]. FCR is a basal infection in winter cereal plants that restricts water flow from the roots to the heads under moisture and/or temperature stress during grain fill. This results in the formation of distinctive ‘whiteheads’, which are associated with a yield loss along with reduced grain sizes that increases the levels of screenings at harvest that have the potential to downgrade the grain [7]. FCR has been estimated to cost the Australian wheat industry an average of AUD 88 million annually [8] but is also a significant disease of wheat in other countries including China and the USA [9]. The main management options for FCR are rotation with non-host break crops such as canola and pulse crops [10,11], adoption of inter-row sowing practices [12] and sowing of wheat varieties with improved resistance or tolerance to FCR [13]. Increasing rates of N application at sowing exacerbates the incidence and increases the yield and grain quality (screenings) losses associated with FCR [14,15]. Consequently, producing ADR1 durum wheat in NNSW under dryland conditions has an inherently elevated risk of FCR given the level of climatic variability within and between seasons, which may possibly become worse with more extreme and frequent droughts and high temperature stresses during grain fill [16]. This balance between risk vs. reward is particularly frustrating for growers when harvested grains fail to meet quality specifications in terms of protein achievement, screenings and HVK. Although quantitative data on the proportion of grain receivals meeting ADR in NNSW are not freely available, an analysis of National Genotype Trials from 2014 to 2018 indicates that only 49% of the durum crop achieves the top ADR1 grade, which is supported by estimates from GrainCorp Pty. Ltd. (Sydney, Australia; personal communication). This indicates that the majority of growers are not getting this balance right, where maximum yield may not necessarily equal optimum nitrogen use efficiency, water use efficiency or profitability.
Despite the large number of studies that have examined the effect of N fertiliser applications on grain protein and quality in bread wheat (for a review, see [17]), there have been fewer studies on durum wheat and indeed no studies to the authors’ knowledge on the effect of N fertilisation in the presence of FCR on durum quality. The objectives of this study were to investigate the effects of FCR infection in the presence of different N fertiliser application rates in two commercial durum wheat varieties on grain yield and grain and semolina quality and relate the changes obtained to the mature grain gluten composition. Understanding these interrelationships will help determine the optimal management strategy for durum wheat production in the NNSW environment where FCR is an endemic constraint on production.

2. Materials and Methods

2.1. Location and Soil Characteristics

Field experiments were conducted at the Tamworth Agricultural Institute (S 31.1468; E 150.9823) in northern NSW, Australia. The experiments were repeated in sequential years across the 2020 and 2021 winter growing seasons. Soil nitrogen (N) levels were determined from segmented soil cores (0–30 cm, 30–60 cm, 60–90 cm and 90–120 cm) collected from each site at sowing. In 2020, the field experiment was conducted on a red chromosol soil, whilst in 2021, the experiment was located on a grey vertosol. There was around 250 kg/ha of nitrate N in 2020 and 64 kg/ha in 2021 within the soil profile (0–120 cm) at sowing.

2.2. Experimental Treatments and Growing Conditions

Two durum wheat varieties, DBA Lillaroi and Jandaroi, were grown in each of the two experimental years across each site at a target plant population of 120 plants/m2 based on seed germination levels and 1000 grain weights. Each year, the seeds of the two durum varieties were sourced from the same seed increase site and grown under irrigation in the preceding season to ensure high levels of germination and the vigour of the planting seed. In both seasons, the trial sites had full soil moisture profiles (~220 mm plant available water content 0–120 cm) due to high rainfall (471.2 mm in 2020 and 466.0 mm in 2021) in the 5–6 months prior to sowing (Table 1). The sowing dates were 9 June 2020 and 6 July 2021.
Three levels of FCR infection were created using an inoculum of Fusarium pseudograminearum prepared as outlined in work by Forknall et al. [13]. Inoculum was an equal mixture of five separate isolates of F. pseudograminearum collected post-harvest from commercially infected wheat crops around Moree and Narrabri in NNSW in December 2019. Single spore isolates were established to ensure the purity, and identification of F. pseudograminearum was confirmed through quantitative PCR [18]. The same five isolates were used to prepare inocula for the field experiments in 2020 and 2021. The inoculation rates in 2020 were nil, 0.5 g/m row (low infection level) or 2.0 g/m row (high infection level) of FCR inoculum applied at sowing. The inoculum rates were adjusted in 2021 to provide more intermediate levels of FCR infection of nil, 0.75 g/m row (low–medium) or 1.5 g/m row (medium–high). Five rates of N application of 0, 50, 100, 150 or 200 kg N/ha were applied as urea at sowing in 2020. Sorghum was grown across the site in the summer of 2020/21 prior to establishing the durum experiment in 2021 to lower the residual soil nitrogen levels. Consequently, N application rates were varied to 0, 20, 40, 80 and 160 kg N/ha applied as urea at sowing in 2021 to provide increased ability to determine responses and interactions at lower levels of N nutrition. In both years, the field experiments were sown using a small plot seeder using tynes with a split boot arrangement that physically separated the urea from the seed at sowing by offsetting the fertilizer to the side (~2 cm) and below (~2 cm) the seed within the planting furrow. This avoided the experiments being compromised by any potential damage to emerging seedlings from fertiliser burn, especially at the higher rates of N application. Plots in both seasons consisted of five plant rows with 33 cm spacings (1.65 m wide) and a 5.0 m plot length. There were four replicate plots of each treatment in a fully randomised complete block design. The grain yield was determined at physiological maturity using a small plot header and grain was retained for a quality assessment. The incidence of FCR infection was determined at harvest from 25 random primary tillers collected from each plot. Crown segments from each tiller (2 cm length) were trimmed, surface sterilised and cultured on 1/4 strength Potato Dextrose Agar (PDA) + novobiocin (10 g PDA and 15 g technical agar plus 0.1 g novobiocin/L water) and incubated under alternating white and near ultraviolet lights for a 12 h photoperiod of 66.6% alternating fluorescent (FL36W/865, Sylvania, East Sussex, UK) and 33.3% blacklight blue (F36T8 BLB, Crompton lighting, Bradford, UK) light for 7 days at 25 °C. Following incubation, distinctive colonies of F. pseudograminaerum arising from surface sterilised crowns were counted to determine the incidence of FCR infection within each plot. Climatic conditions of rainfall and temperature were recorded from the nearest Bureau of Meteorology site in each season (Table 1).

2.3. Grain and Semolina Analyses

Harvested grain was assessed for screenings (SCR) defined as the percentage by weight of the total sample passing through a 2 mm slotted screen after 40 shakes of a sieve. Following harvest, grain samples were cleaned with a Carter Day dockage tester and individual field replicates were analysed for grain protein (GP%, 11%mb), moisture and hardness (SKHI) by near infrared reflectance spectroscopy. The test weight (TW), thousand grain weight (TGW) and falling number were determined on clean grain, which was then milled (3 kg) into semolina using a Buhler laboratory mill as described elsewhere [19]. The milling performance was assessed as milling yield (MY = total flour weight/total product weight × 100), semolina yield (SY = semolina weight (three break fractions + semolina)/(total products weight-bran, pollard, break, reduction and semolina fractions) × 100) and semolina only yield (Semo Only = semolina weight/total products weight × 100). The percentage of hard vitreous kernels (HVK%) was determined using a Pohl Farinator device (https://en.ventisec.com/products/pohl-farinator; accessed on 23 May 2023). HVK% = ((300 − number of mottled kernels)/300) × 100. The semolina colour was evaluated by measuring L* (brightness, 100 = white, 0 = black), a* (+ve is redness. −ve is greenness), b* (+ve is yellow, −ve is blue) by means of a Minolta Chroma Meter CR-410 (Biolab Australia, Sydney, Australia) in triplicate. The dough properties were assessed using a mixograph and a Glutomatic, with the mean of duplicate analyses presented for each field replicate [19]. The key measures captured were mixograph dough development time (MPT), resistance breakdown (RBD) (100 × ((width of the curve at peak mixing time—width of the curve after 8 min mixing)/width of the curve at peak mixing time)), wet gluten (WG) and gluten index (GI).

2.4. Gluten Protein Composition Analysis of Harvested Grain from 2021 Trial

Mature, harvested grain was milled into wholemeal using a Perten falling number mill and the glutenin and gliadin proteins were extracted and separated on a BioSep size-exclusion column using a high-performance liquid chromatography (HPLC) apparatus described elsewhere [20]. Briefly, the extraction produced two protein fractions: one soluble in a phosphate buffer containing a detergent (SDS) and the other fraction protein that can only be dissolved using a sonication device to disrupt the polymer. Each flour sample was extracted in duplicate and each protein fraction (designated soluble and insoluble) was injected onto the HPLC column and the protein constituents were separated. The soluble fraction was separated into three fractions: glutenin polymers, gliadins and albumin/globulins, while the insoluble fraction was separated into three polymeric glutenin fractions. The key measures from the chromatograms were the area under a peak as a percentage of the total area (soluble A%, soluble B%, soluble C%, insoluble A%, insoluble B% and insoluble C%) and derived terms such as the polymeric/monomeric ratio (P/M = (SolA area + InsolA area)/(SolB area + SolC area + InsolB area + InsolC area)), the Gliadin/Glutenin ratio (Gli/Glu = (SolB area + InsolB area)/(SolA area + InsolA area)) and the percentage of unextractable polymeric protein (UPP = InsolA area/(InsolA area + SolA area) × 100).

2.5. Statistical Analysis
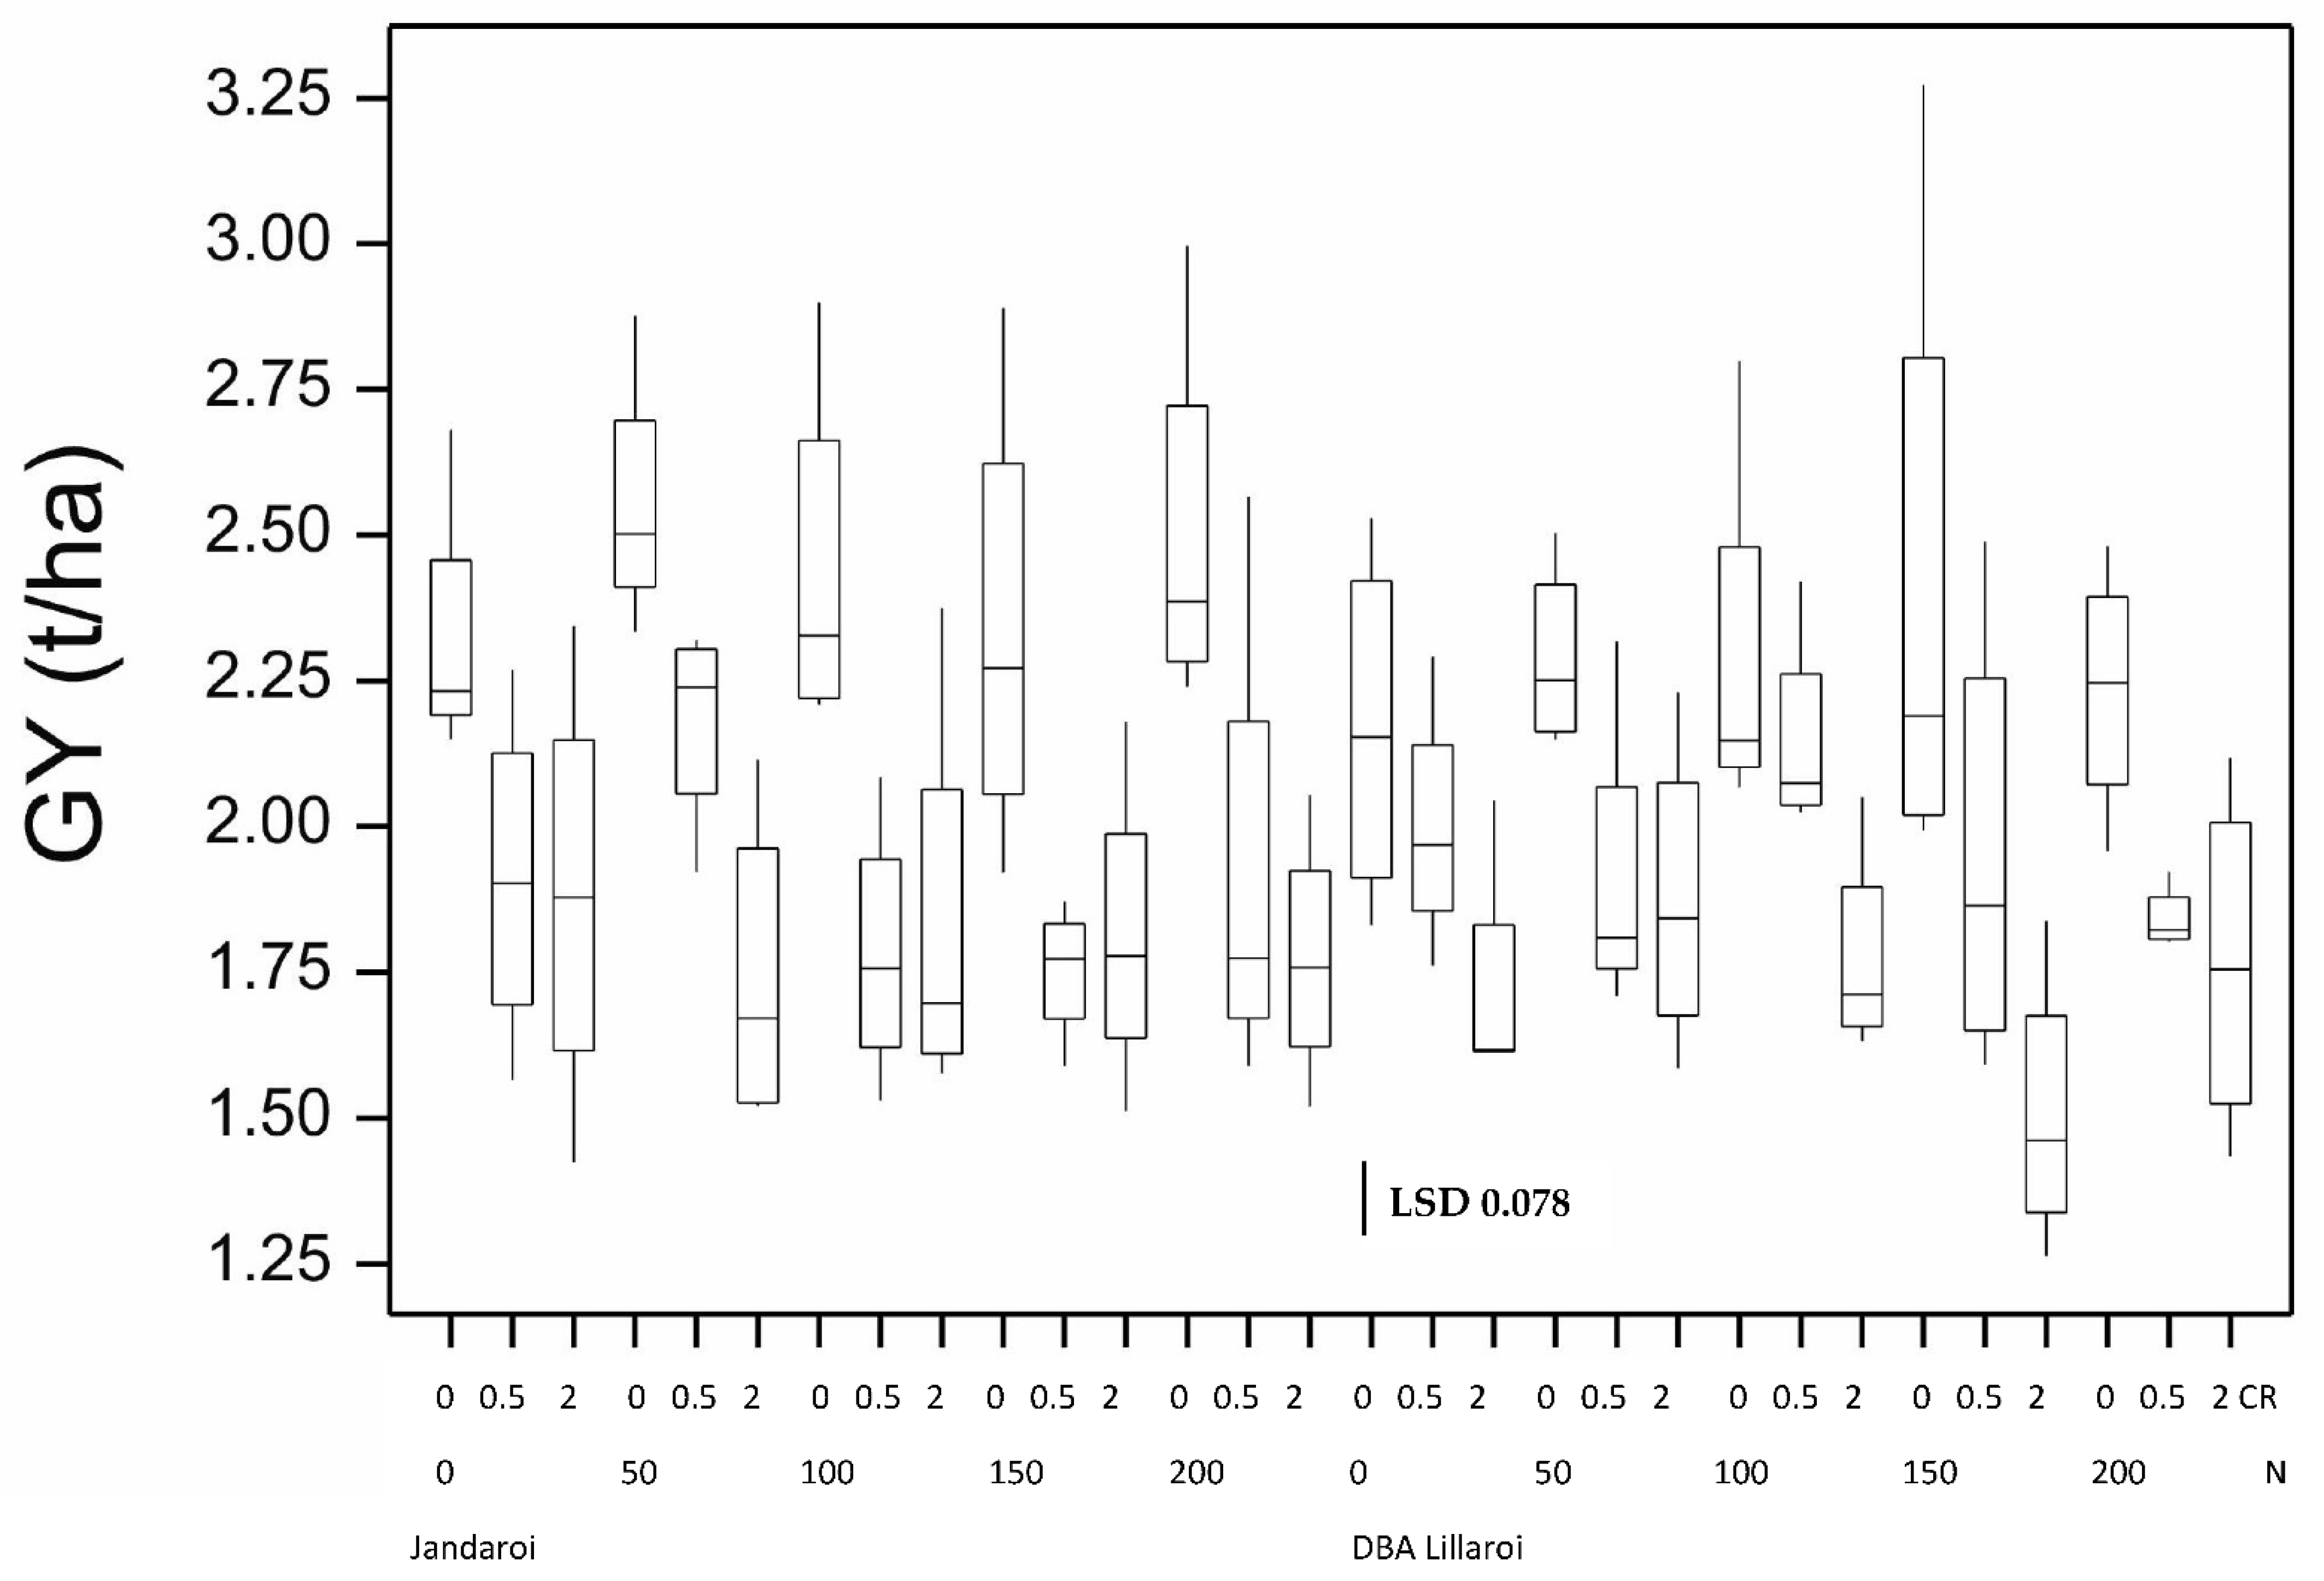
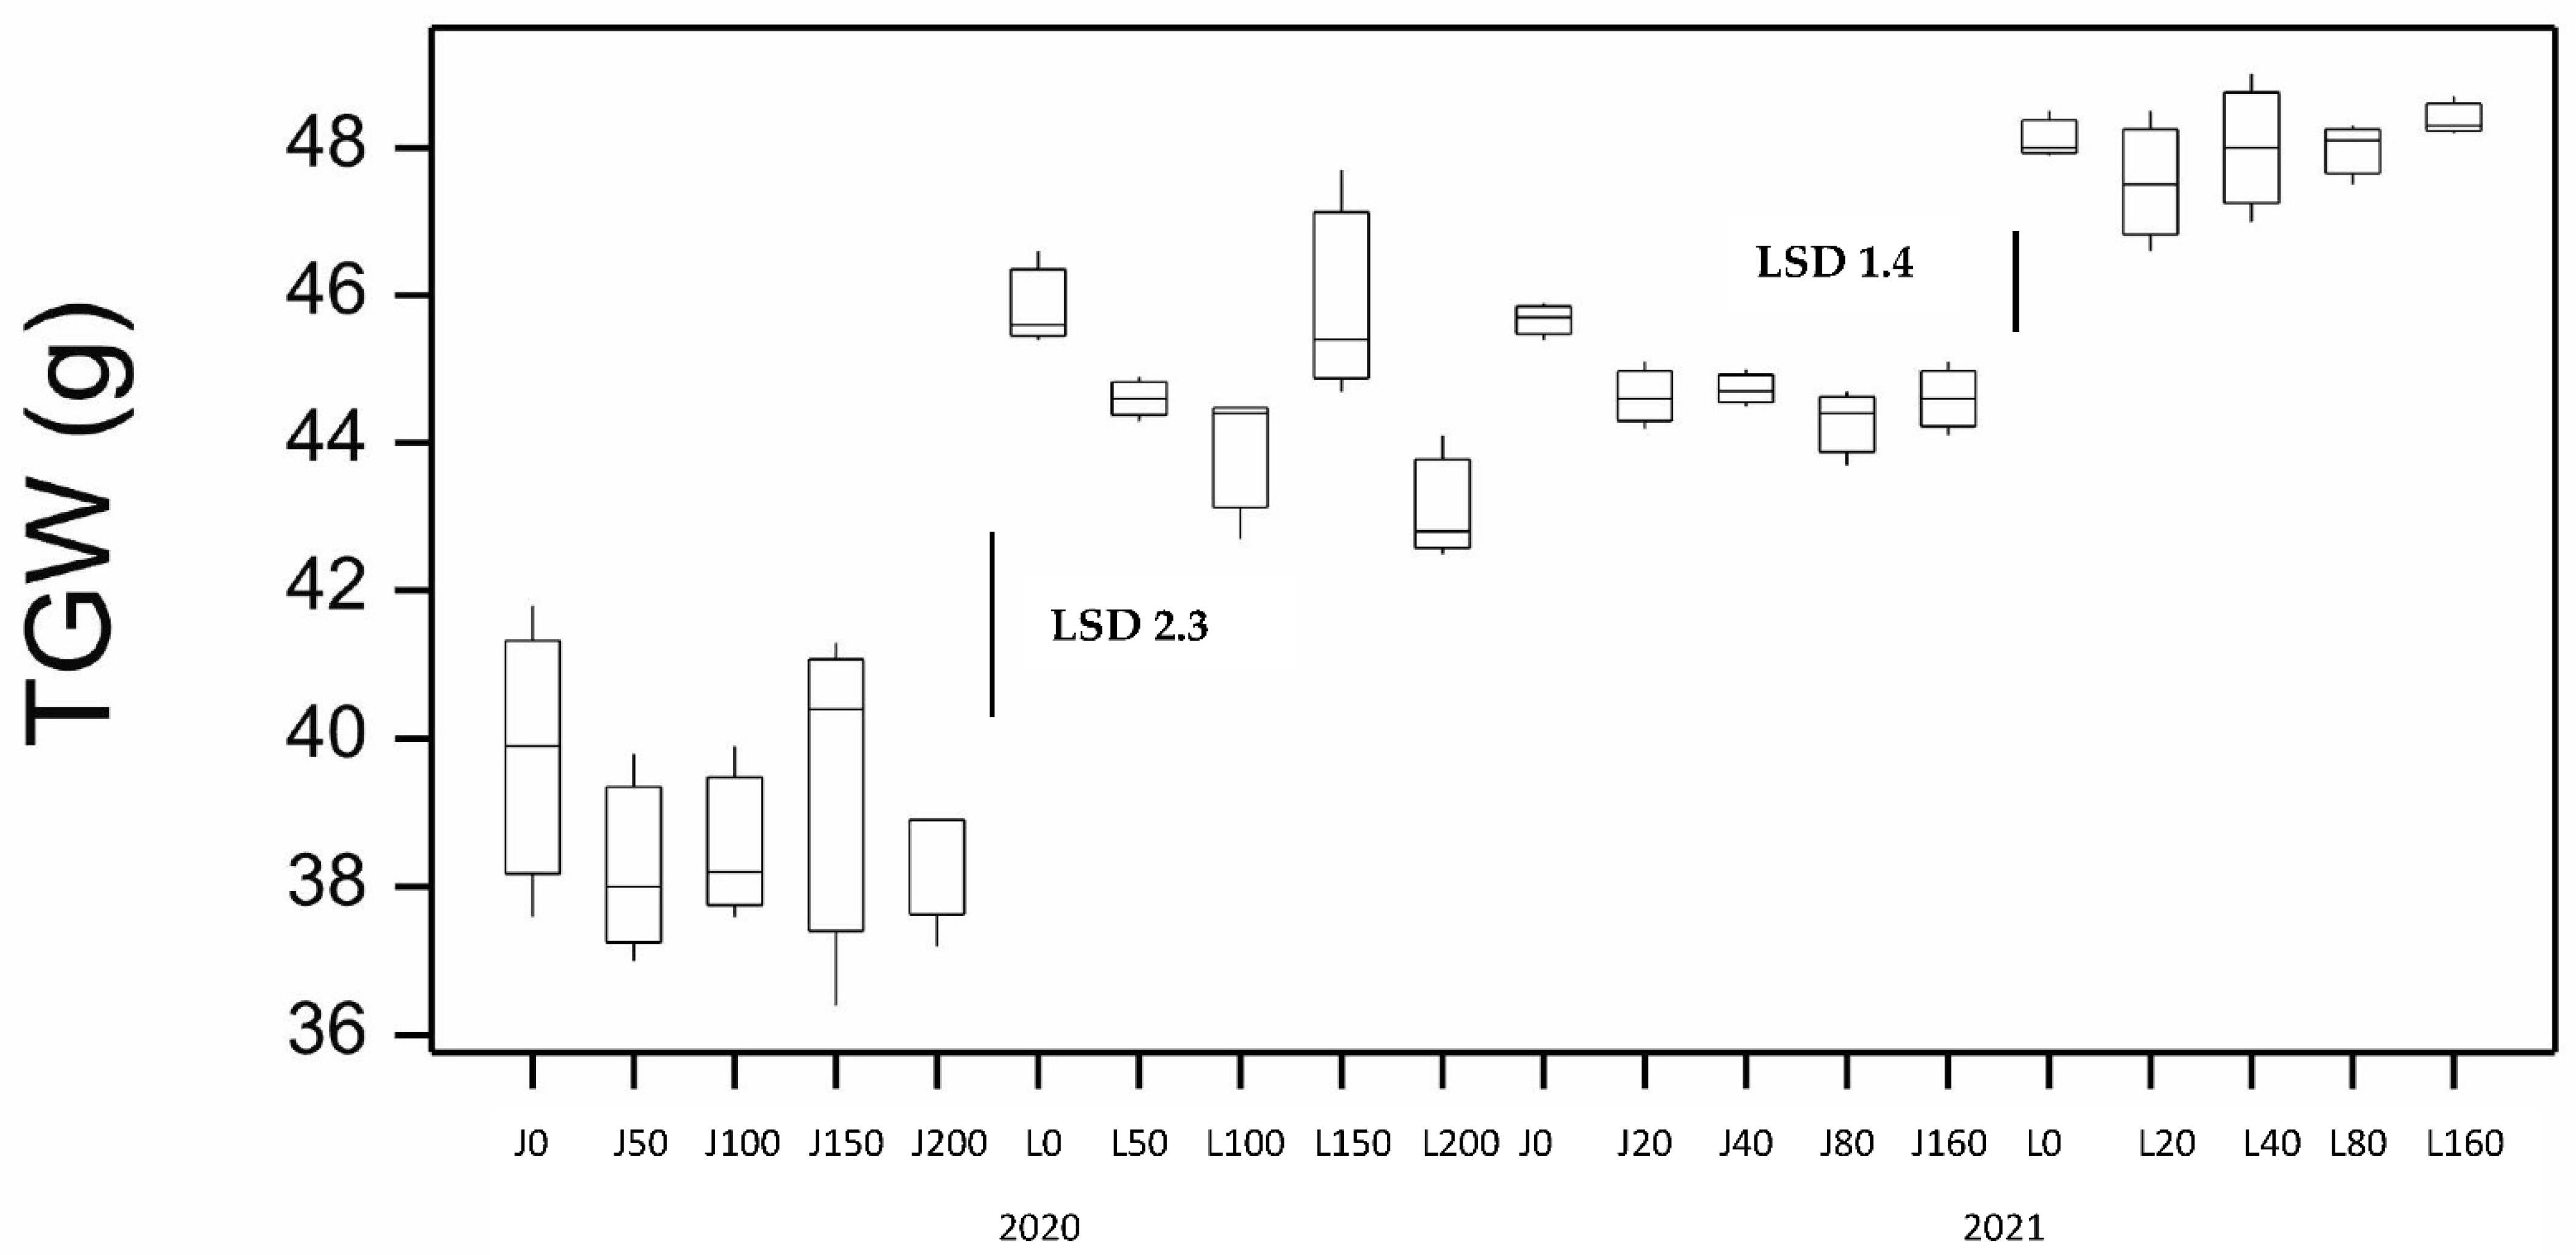
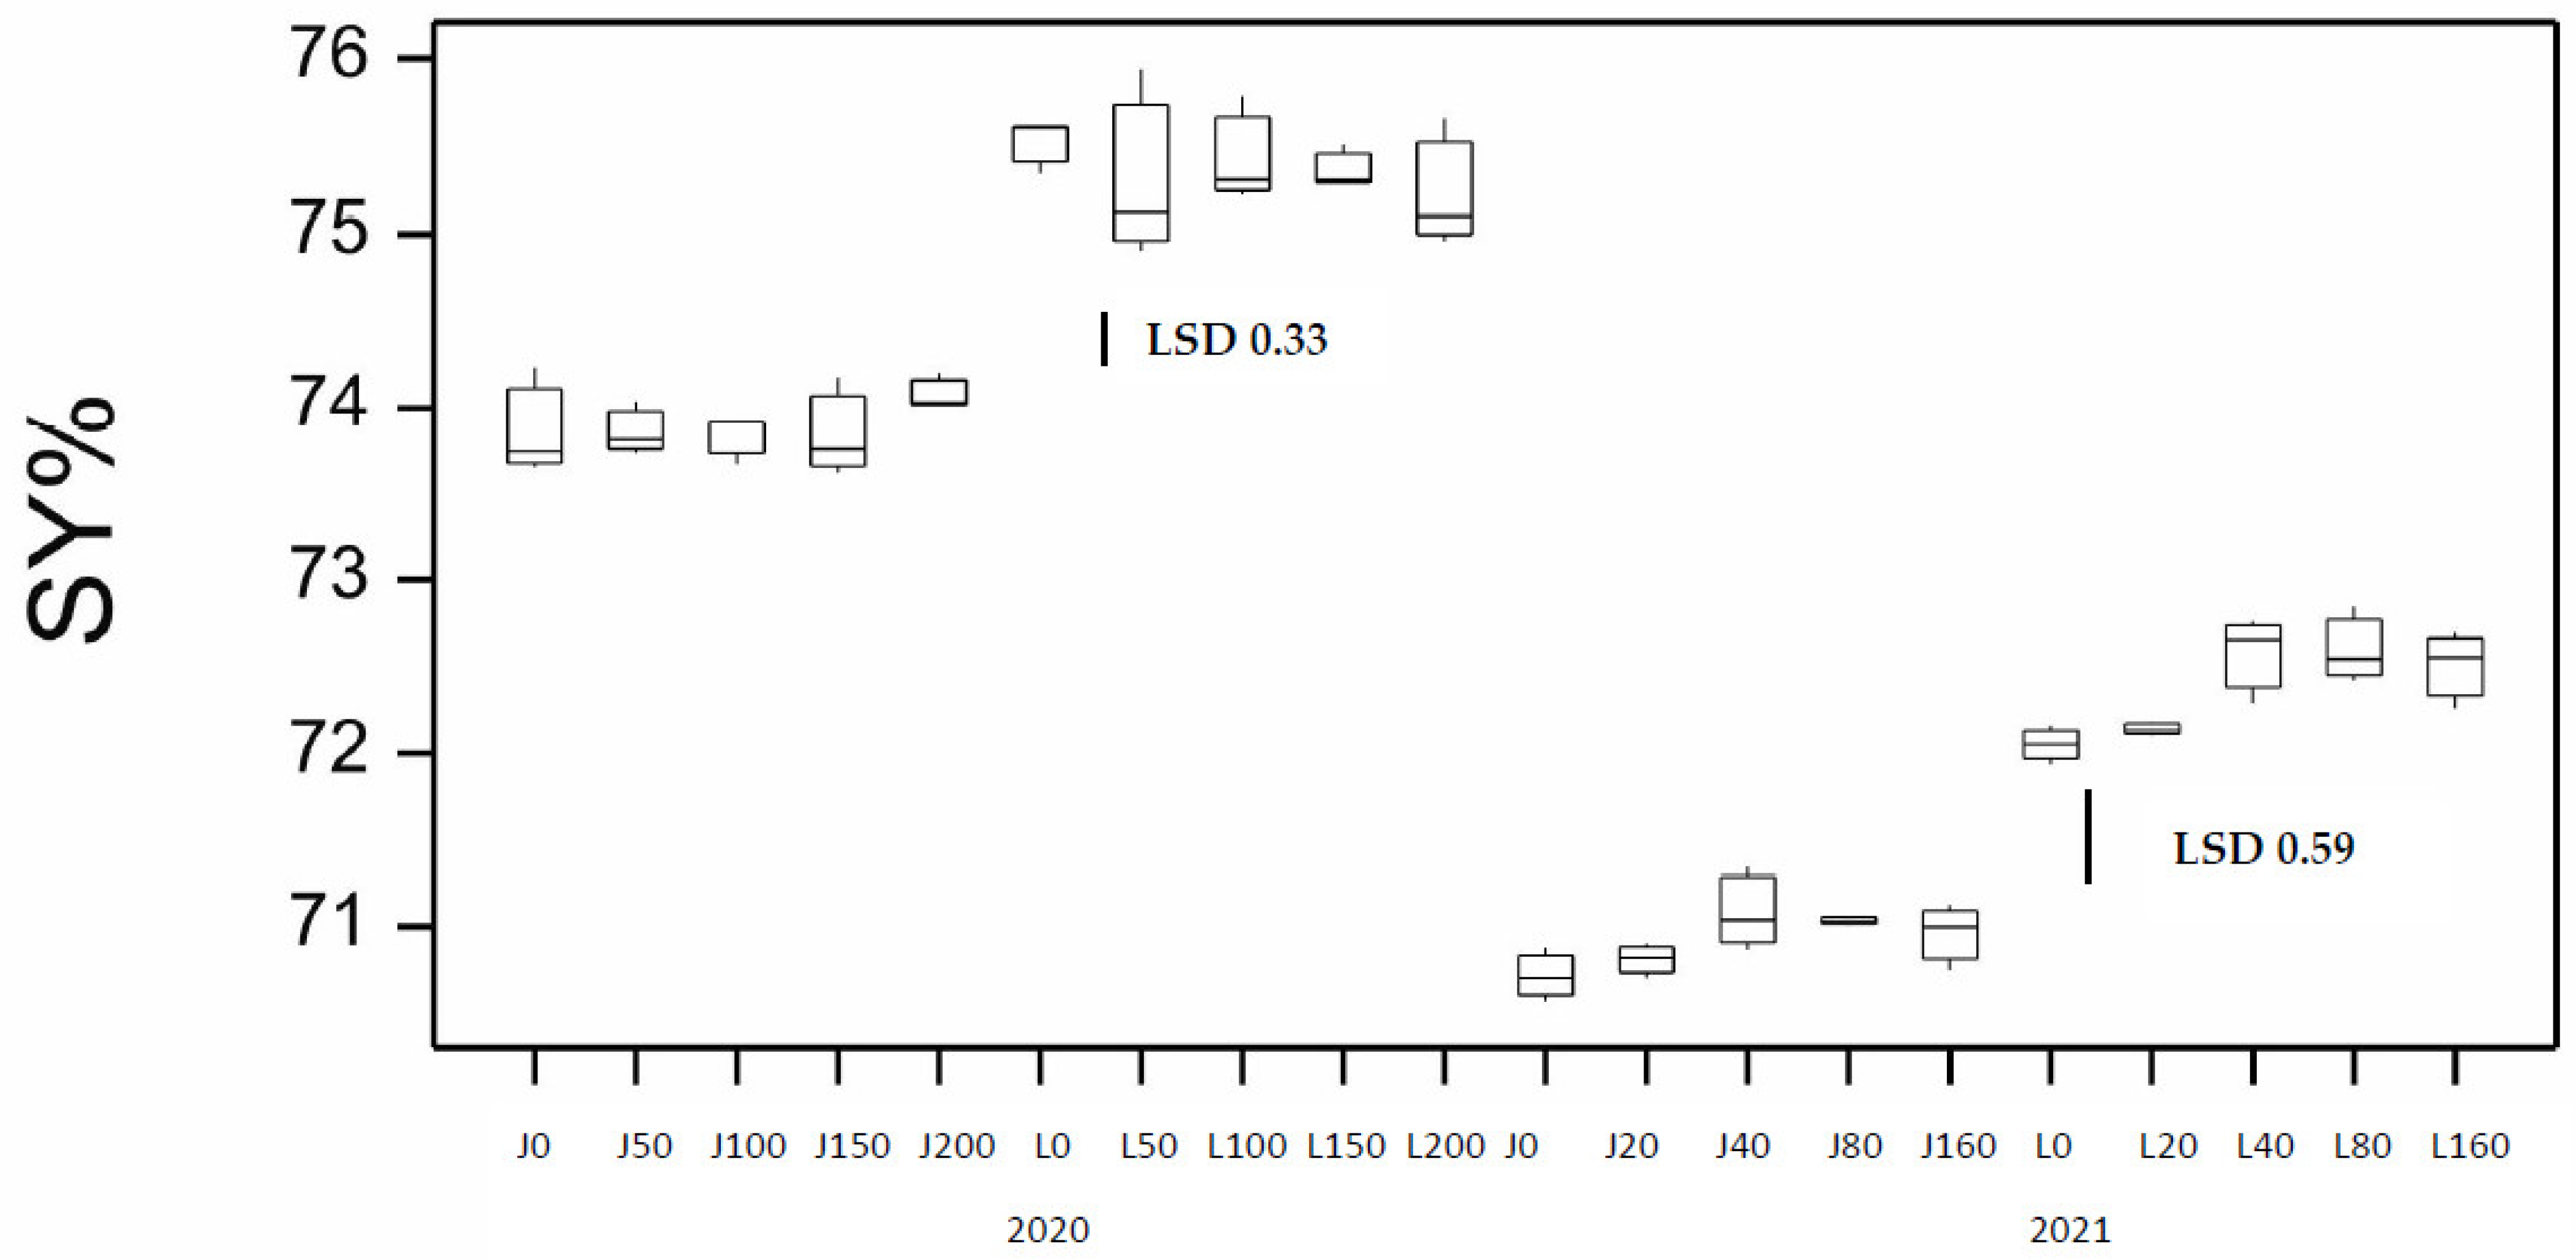
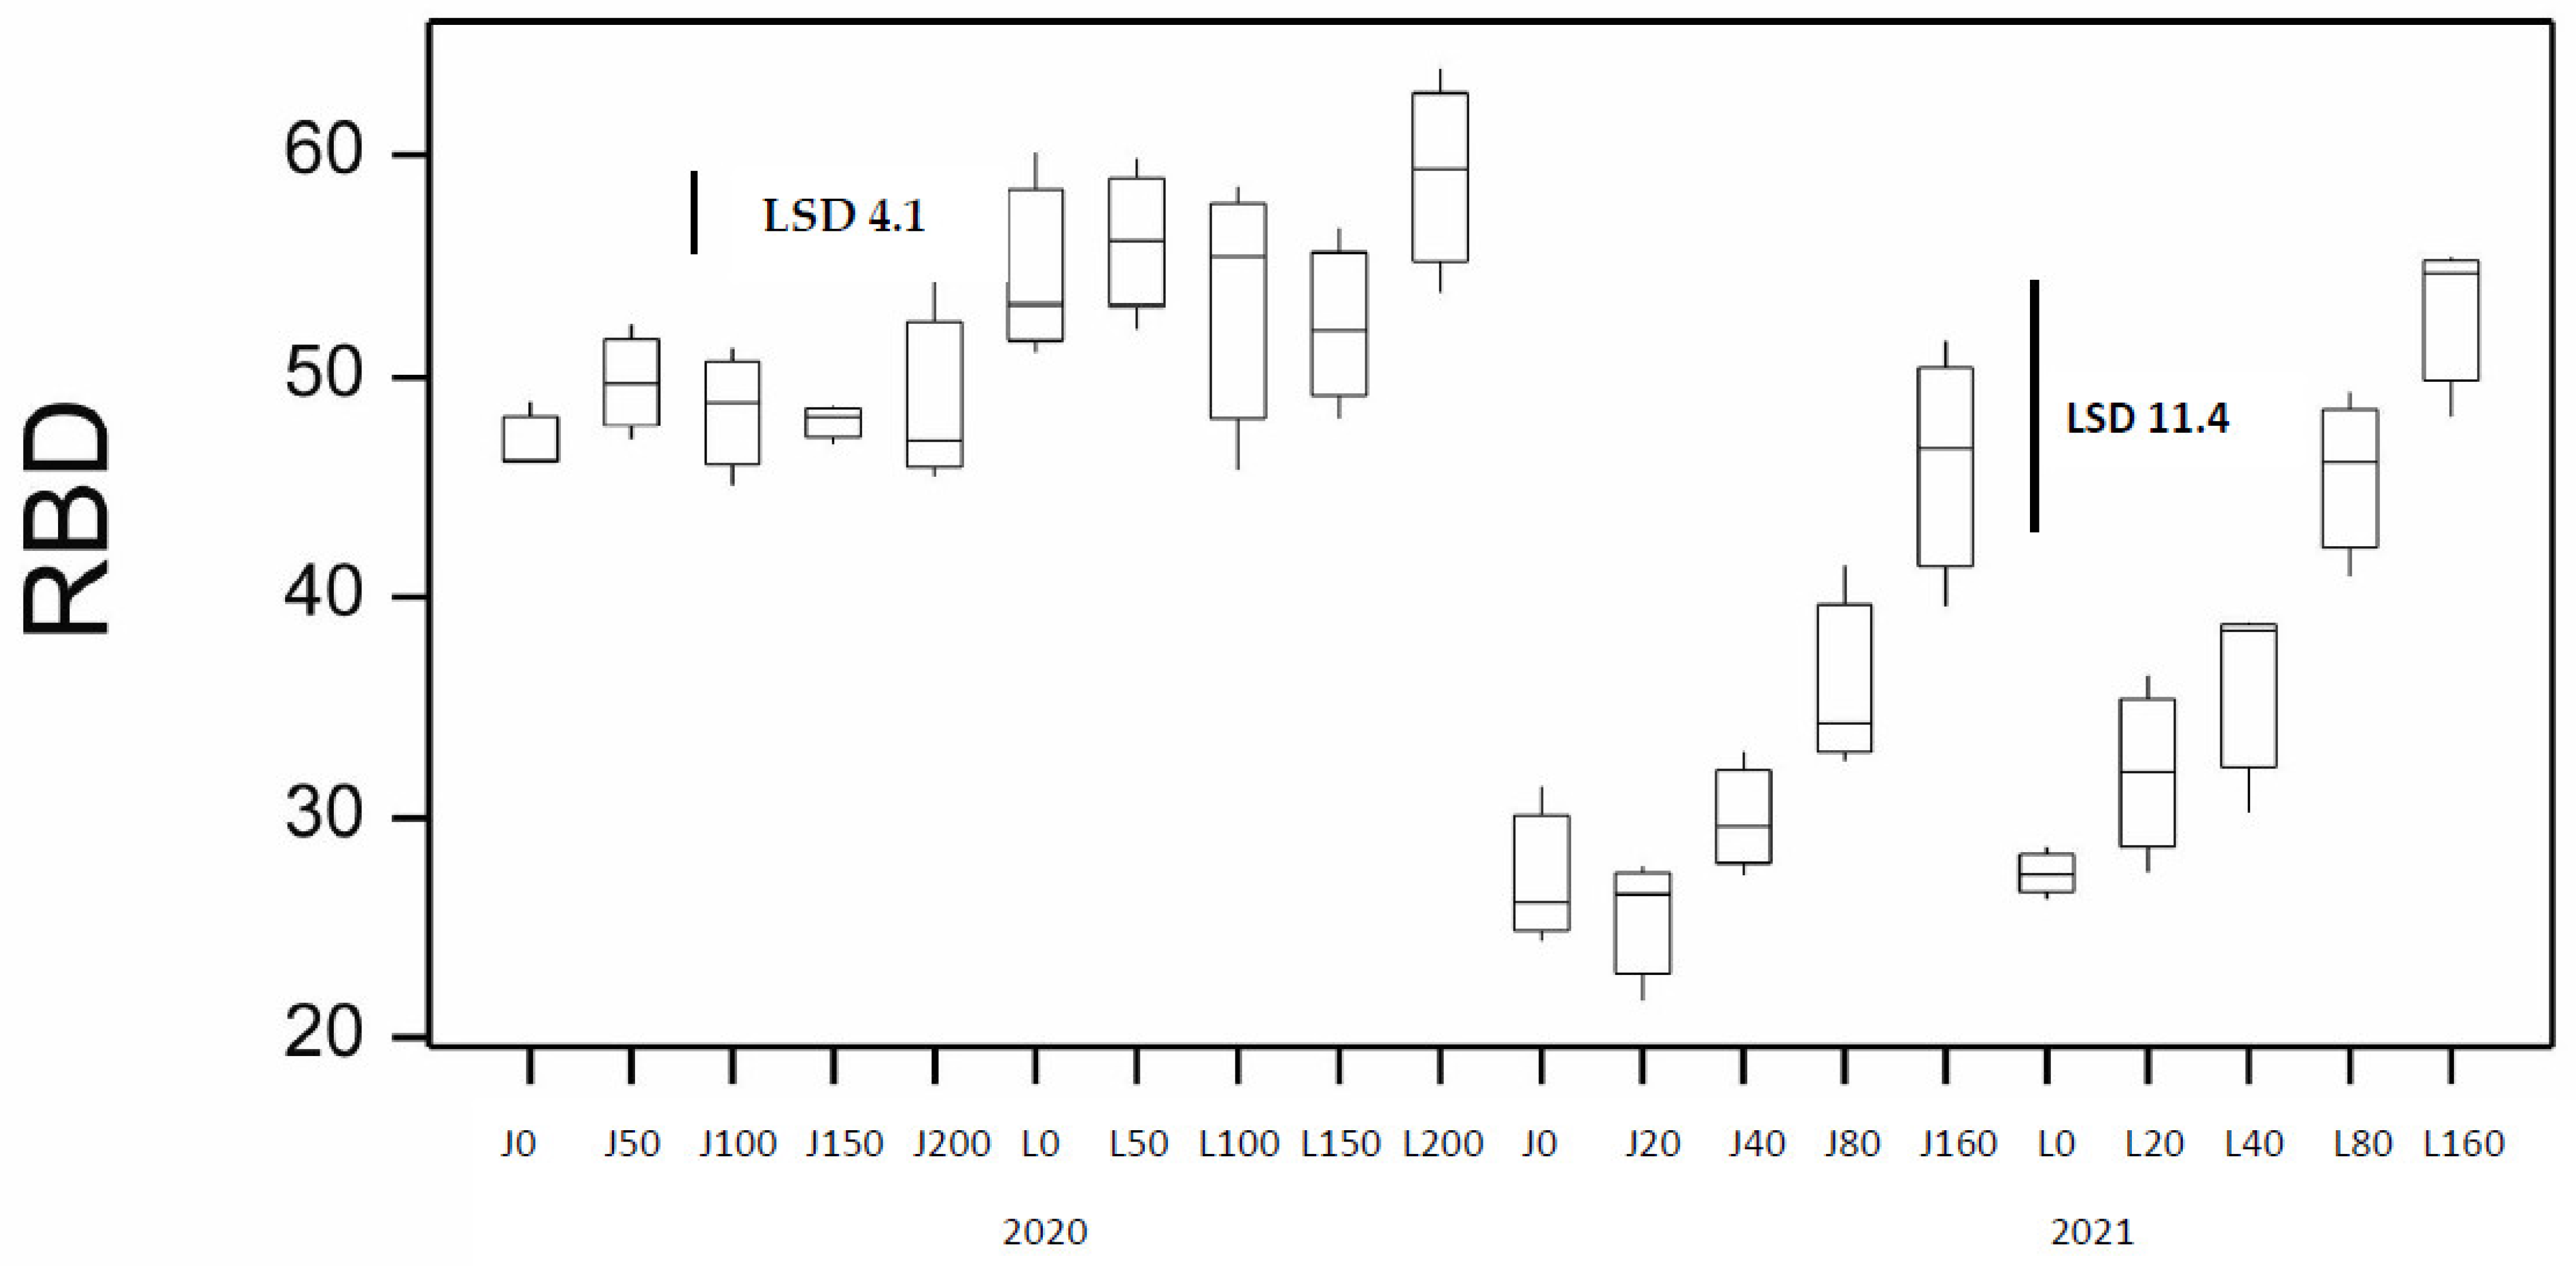
Data were analysed using the statistical programme GenStat version 17.1.0.14713 with a generalised linear model, and the means were tested for significant differences by the least significant difference statistic (LSD), p < 0.05. Data were checked for normality.

3. Results

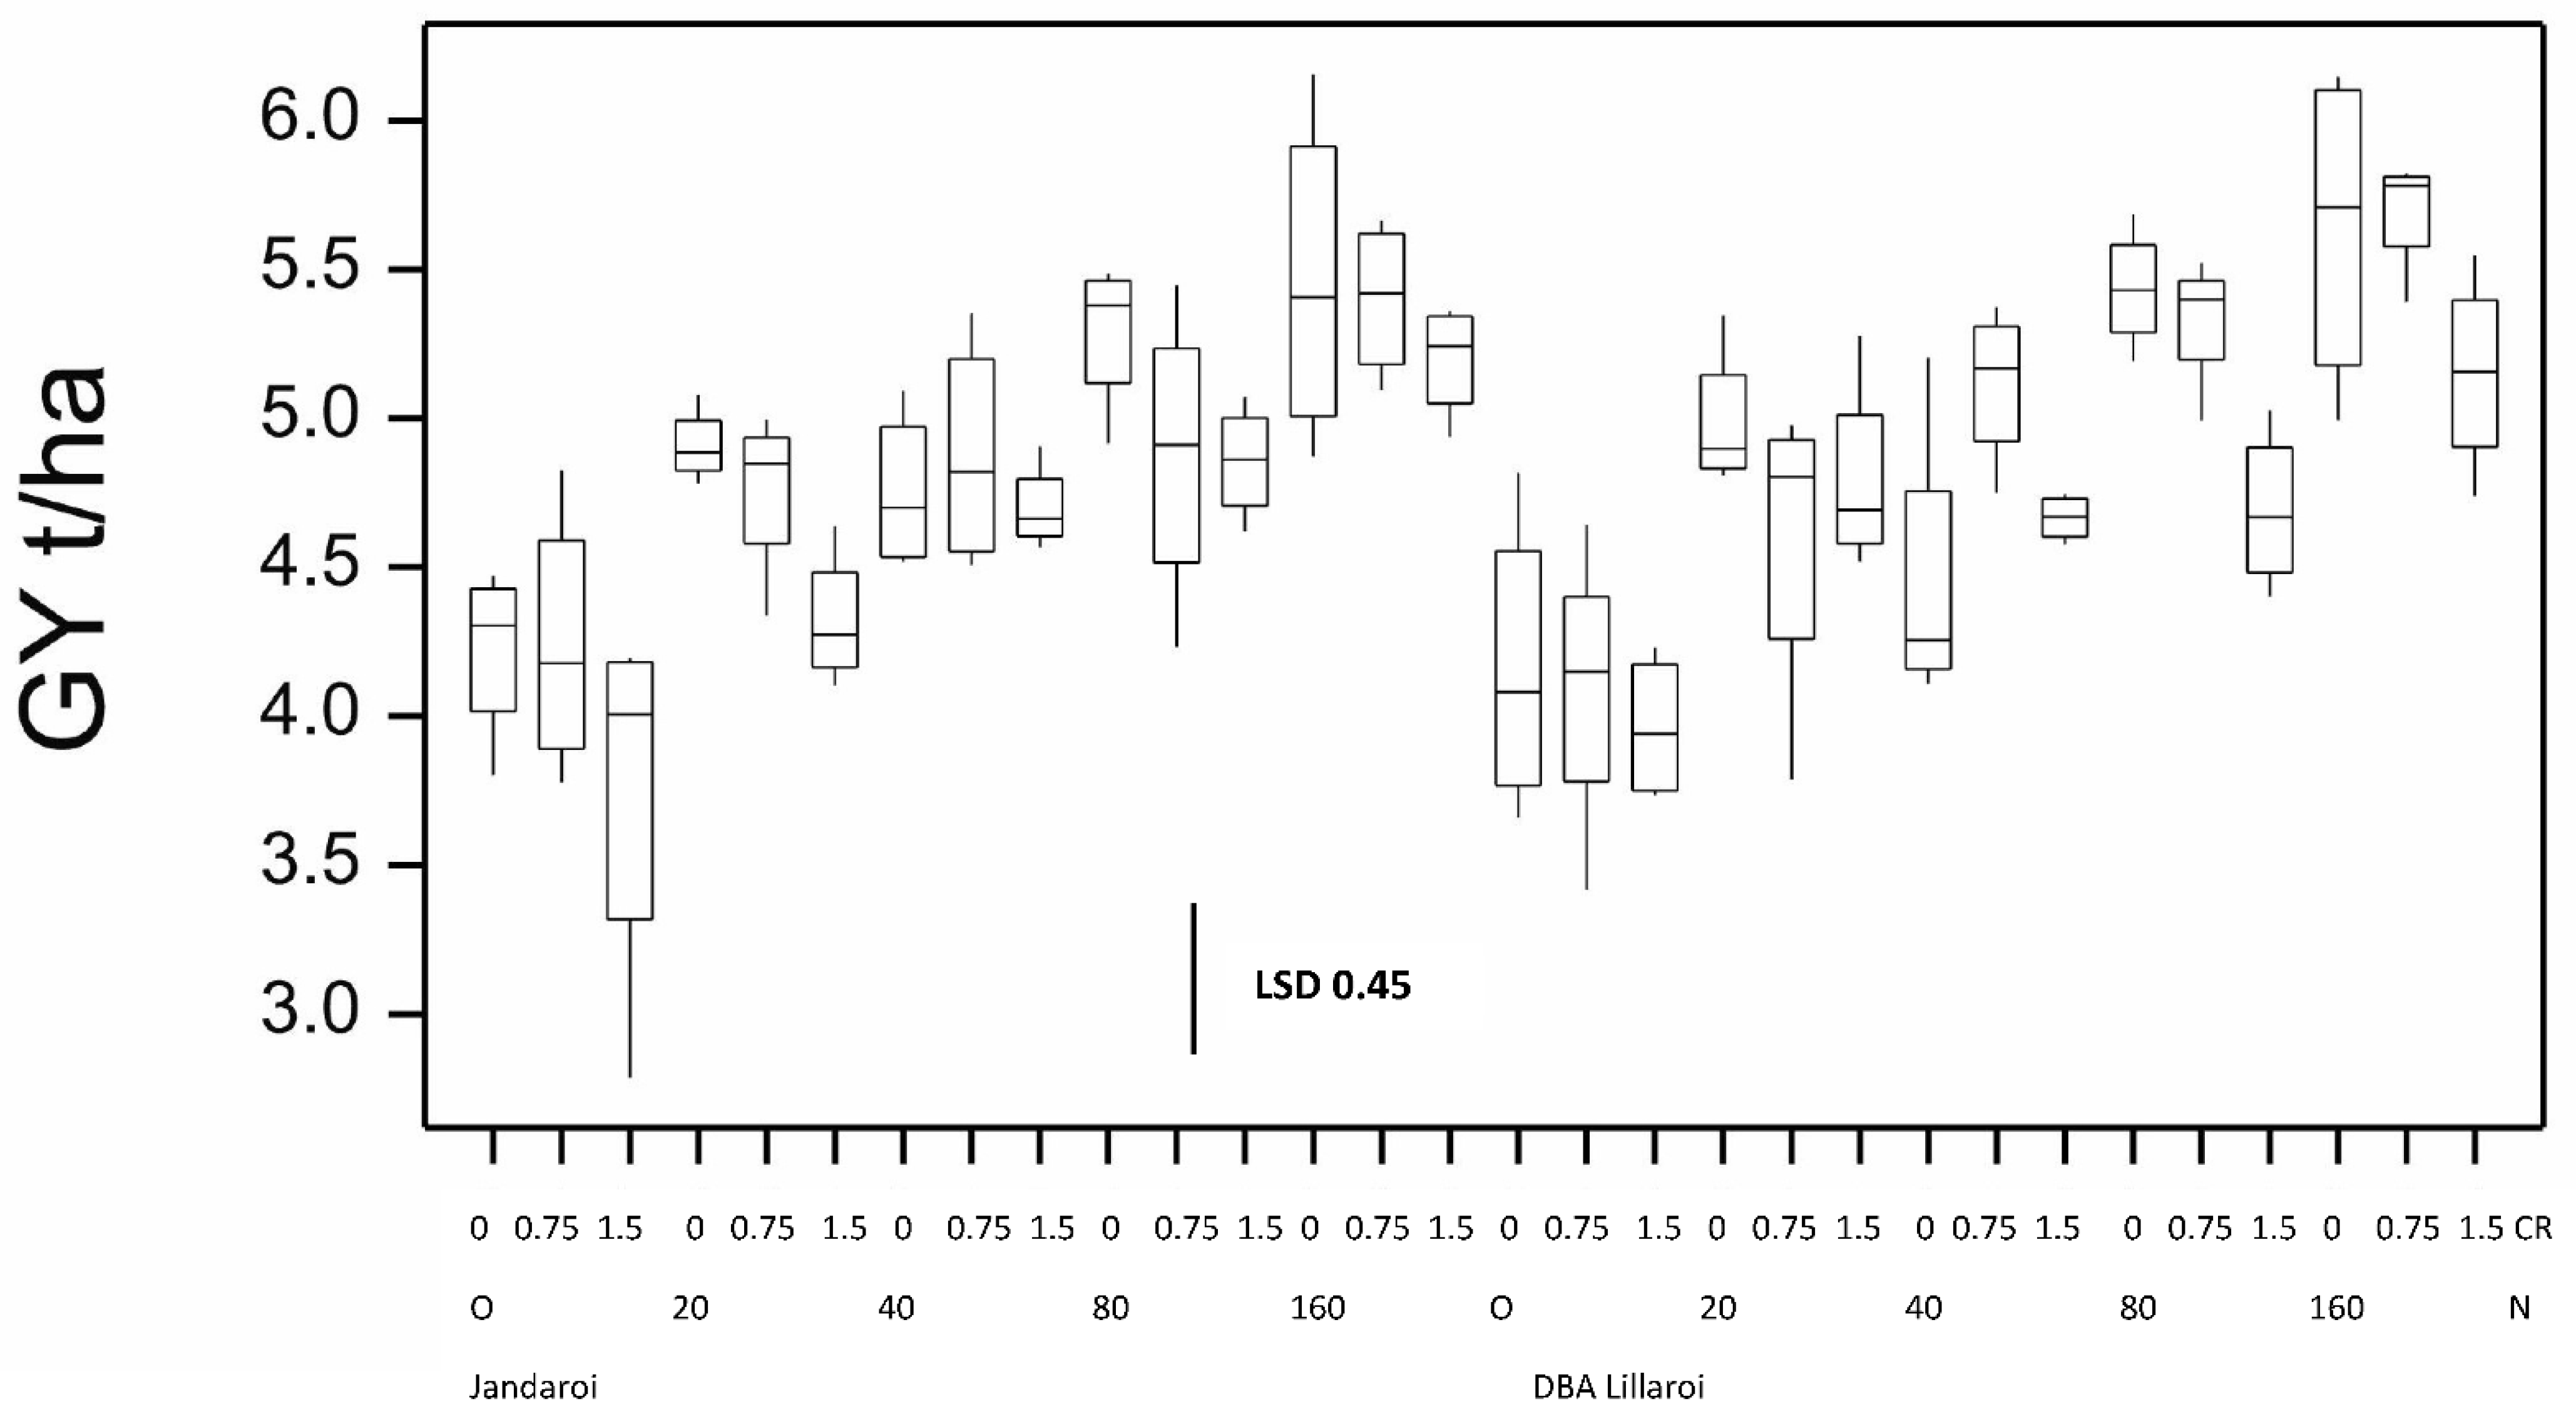
3.1. Results from the 2020 Season

High background soil nitrogen (N) levels at sowing (~250 kg/ha nitrate N in soil between 0 and120 cm) resulted in this site being unresponsive to N application in terms of yield in both varieties (Figure 1). Except for DBA Lillaroi at the 0 and 100 N rates, FCR infection resulted in significant yield losses compared with uninoculated (nil) plots at both infection levels. The yield loss under moderate FCR infection (0.5 g/m of row) ranged from 15 to 27% in Jandaroi and from not significant to 19% in DBA Lillaroi. At the higher level of FCR infection (2.0 g/m of row), the yield loss ranged from 19 to 32% in Jandaroi and 18 to 38% in DBA Lillaroi. There was no interaction between yield loss from FCR and N application rate at sowing at this site in 2020 (Table S1). The baseline grain protein (GP) with no applied N was high (13.7 to 13.9%) with a blunted but significant increase in GP in response to applied N rates (0–200 kgN/ha), increasing in Jandaroi by 7.1% and for DBA Lillaroi by 8.7% (Figure 2). Jandaroi had a higher GP and WG than DBA Lillaroi. The starting soil N levels at this site in 2020 appeared to be too high, which limited responses to additional N inputs. Inoculation with F. pseudograminearum (FCR treatment) had no significant effect on GP (Table S1). The functional component of the grain protein, the wet gluten content, follows a similar trend to GP because the majority of protein in the kernel is gluten, so a high correlation (r = 0.75, n = 120, p < 0.05) was observed, although only small increases in wet gluten were obtained (Table S1).
The grain size expressed as 1000 grain weight (TGW), the packing density as test weight (TW) and the percentage of small kernels as screenings (SCR) were affected differently by the three factors (genotype, Nrate and FCR). For TGW, only the genotype and Nrate were significant. DBA Lillaroi has a larger grain size at all N rates than Jandaroi, with no effect of Nrate on TGW in Jandaroi, while it tended to decrease in DBA Lillaroi, which was not consistent at 150 N (Figure 3). TW was not affected by the Nrate, but genotype and disease were significant (Table S1), with no difference in DBA Lillaroi with FCR level but a decrease in Jandaroi (Figure 4). Screenings (SCR) were significantly affected by genotype and FCR, with Jandaroi having a higher and more variable SCR than DBA Lillaroi, sometimes exceeding the market cut-off of 5% for a downgrade in feed grade. FCR increased SCR in Jandaroi only, with no difference between the two rates of inoculation (Table S1). All grain samples showed very high vitreousness (HVK), averaging 99.8%.
The kernel characteristics can impact the milling potential of the grain, which is important for the economic returns of high yielding low speck and semolina with an acceptable ash content. The milling quality was assessed by measuring laboratory milling yields. The semolina yield (SY) was significantly affected by genotype and disease but not the Nrate (Figure 5 and Table S1). DBA Lillaroi had a significantly higher SY under all treatments than Jandaroi, with a tendency to increase with FCR inoculation and being highest at the 2 g/m rate, while Jandaroi SY was not significantly changed. A more sensitive indicator is the measure of Semolina Only yield (Semo only), but this was significant for genotype and Nrate but not FCR (Table S1). Again, DBA Lillaroi had a higher Semo only yield at all Nrates than Jandaroi (Figure 6). There was a tendency for Semo only to decline in both varieties with the Nrate, but more so for DBA Lillaroi, being lowest at 200 kg/ha compared to no additional applied N at sowing.
Semolina quality was also assessed by its colour parameters: brightness (L*), redness (a*) and yellowness (b*). The colour of the semolina is important as this determines the colour of the pasta. The brightness L* achieved high values of ~80 with minimal differences between samples (Table S1), while the mean b* varied from 27.9 to 31.5, with DBA Lillaroi having a higher yellowness at all treatments than Jandaroi (Figure 7). The yellowness tended to decline slightly with an increased Nrate (Figure 7) and FCR inoculum rate (Table S1) but not always consistently.
The ANOVA on the 2020 data showed significant effects on dough strength (gluten index, GI) from the genotype and FCR application (Table S1). Jandaroi is known for its high GI, averaging 93 compared to the 68 of DBA Lillaroi in the absence of FCR inoculation. Values above 90 are considered to have very strong dough properties. Inoculation had a significant effect in reducing GI in both varieties, with a larger decline at the highest FCR inoculation rate (Figure S1). This was a bigger issue for DBA Lillaroi, declining by up to 21% compared to Jandaroi at 10%. While Jandaroi also showed a reduced GI with inoculation, it still achieved high GI values, dropping only to 83, which is still high, but the decline in DBA Lillaroi would cause processing issues. In 2020, there were minimal changes in the dough strength with N rate (Figure 8). The mixograph is another instrument to assess the dough properties of semolina and two key measures, MPT and RBD, both showed significant genotype and disease effects (Figure 9 and Table S1). Jandaroi MPT declined slightly at low and high inoculations, while DBA Lillaroi MPT did not change. However, RBD is a better indicator of dough strength and is correlated with GI (r = 0.49, p < 0.05), with no change in Jandaroi but an increase in DBA Lillaroi with a moderate–high FCR infection, consistent with the large effect on GI from inoculation. Nrate had no effect on RBD in this season. Overall, GI was the most responsive trait to FCR infection (Table S1).

3.2. Results from the 2021 Season and Comparison to the 2020 Season

The mild weather conditions, i.e., wet and cool during grain filling, in 2020 reduced the expression of FCR, and the high pre-sowing soil N levels also restricted the grain protein response. To reduce the likelihood of this happening in the 2021 season, the field trial was established following growth of a commercial sorghum crop across the site in the summer prior to sowing the durum wheat experiment. This significantly reduced the starting soil N levels (~64 kg/ha nitrate N in soil between 0 and 120 cm).
The grain yield (GY) in both durum varieties increased in response to applied N (20 to 160 kg/ha) at sowing when compared to the nil N treatment by up to 29% and 36% for Jandaroi and DBA Lillaroi, respectively, in the absence of FCR inoculation (Figure 10). While there was a significant negative effect of FCR on yield especially at the 1.5 g/m row inoculation rate (Table S2), some treatments were not significant. In 2020, the Nrate had no effect on GY compared to a large positive effect in 2021 because of the high starting soil N, and so considerably higher yields were obtained (overall yield 2020, ~2 t/ha vs. 2021, 4.2–5.5 t/ha in the absence of inoculum). There were no significant interactions between FCR infection and N rate (Table S2).
There were good GP responses in 2021 (range 2.4%) compared to 2020 (range 1.04%) from 10.1% at 0 N up to 12.8% at 160 kgN/ha, increasing on average by 23% and 24% for Jandaroi and DBA Lillaroi, respectively (Figure 2). There was a bigger increase in GP between 40 and 160 kgN/ha application rates that were significant, compared to between 20 and 40 kgN/ha that were not significant. Both varieties achieved similar protein levels, with Jandaroi slightly higher than DBA Lillaroi over the range of N levels. There was no effect of FCR infection on GP, as was the case in 2020 (Table S2). The selected application rates differed from those in 2020 due to more refinements of the treatments to obtain a better spread in FCR infection levels. Much higher responses in GP were achieved in 2021 using the strategy of lowering the starting soil N rather than the blunted and narrow range obtained over a larger range of applied N in 2020. This aligned with the GY response in 2021, although FCR inoculation did not significantly affect GP due to prolonged wet and mild temperature conditions during grain fill which limited the expression of FCR. Periods of heavy rain around harvest impacted the grain falling number, averaging 250 s and ranging from 185 to 290 s (Table S2). The screening levels were very low, ranging from 0.7 to 1.2%, well below the market cut-off of 5% in 2021 compared to some plots experiencing over 5% in the 2020 season (Table S2). The grain hardness measured by SKHI showed a narrow range (79.6–99.8), indicative of the very hard grain typical of durum wheat. The low SCR observed in all plots is very much related to the sound TW (78–79.2 kg/hl) and high TGW achieved (43.7–49 g) in 2021. The TW was not influenced by FCR, whereas in 2020, FCR reduced the TW significantly although only marginally (in Jandaroi only), still meeting the minimum level of 76 kg/hl (Figure 4). Higher TGWs were obtained for both varieties in 2021 compared to 2020 (Figure 3), with no effect of Nrate in Jandaroi and a slight increase for DBA Lillaroi at the highest Nrate compared to a decline in 2020 (except for the blip at 150 kg/ha). DBA Lillaroi had larger grains than Jandaroi, as noted in the 2020 season.
While the grain dimensions and low SCR levels in 2021 indicate good grain quality, another important trait for durum and market grading is the percentage of hard vitreous kernels (HVKs). The HVK percentage was quite variable, ranging from 53.8 to 98.2, with both varieties displaying a higher HVK percentage with increased applied N which was not affected by FCR infection. Low N (<20 kg/ha) reduced the HVK percentage in DBA Lillaroi to a low level well below the market cut-off of 70%, but not in Jandaroi even with nil N (Figure 11A). At 160 N, both varieties achieved similar HVK percentages, but at all other N rates, DBA Lillaroi had lower HVK percentages than Jandaroi. The grain TGW, TW, SCR, SKHI and HVK can all impact milling potential yields. The SY% values for DBA Lillaroi were all higher than Jandaroi at all N application rates (Figure 5), but this was not so for Semo only at all Nrates, where values between varieties were closer in 2021 only (Figure 6). SY values were higher in 2020 than in 2021. In 2020, increasing N had no impact on the SY but increased the SY in 2021 (Figure 5). The highest SY was at 40 N, with no further increase as the Nrate increased to 160 N for both varieties.
For semolina colour, there was a tendency for semolina L* to decrease with the Nrate, while genotype and disease were not significant (Table S2). However, only up to 1.3 units were lost, which is not considered important enough for pasta production; the true indicator of brightness is not the semolina, which is more predictive of different particle sizes and shapes. Semolina b* is more important, with significant genotype and Nrate effects (Table S2). DBA Lillaroi achieved a higher semolina b* than Jandaroi at all Nrates, as was found in 2020 (Figure 7). In 2021, there was a significant increase in semo-b* in DBA Lillaroi with increasing rates of applied N from as low as 20 kgN/ha to the highest levels at 160 kgN/ha N. For Jandaroi, 20 N increased the semo-b* values, with no further increases with more applied N (Figure 7). This is a desirable trait but needs to be balanced by the slight decrease in semo-L*.
As observed in 2020, Jandaroi showed much stronger dough properties than DBA Lillaroi (longer MPT, lower RBD and higher GI). In 2020, there were minimal changes in the dough strength with N rate (RBD and GI). However, in 2021, the Nrate led to a decline in GI in DBA Lillaroi but not Jandaroi (Figure 8) and an increase in RBD for both varieties (Figure 9). Jandaroi typically had a very high GI, staying above 90 at all N rates and was unaffected by FCR infection (Figure S1). However, in 2020, both varieties were impacted by FCR, with a reduced GI which was not seen in 2021 likely because there was little to no FCR expression in this season (Figure S1). The much larger decline in the GI in DBA Lillaroi was evident in 2021, with a more restrained fall in the GI in the 2020 season with the Nrate. For DBA Lillaroi, while having a high GI of 90+ at 0 kgN/ha up to a 40 kgN/ha application rate, the GI tended to decline with increasing rates of applied N, reaching its lowest levels at the 160 kgN/ha application rate with a GI of ~70–80, which is still an acceptable level. The mixograph RBD hardly changed with Nrate in 2020 for both varieties, but in 2021 both varieties showed large increases in RBD (indicative of less stable dough) in line with the declining GI with increasing Nrate (Figure 9). However, there was a larger decline in the GI for DBA Lillaroi but little difference in RBD between the varieties with increasing N rate, while FCR had a significant effect on RBD only in 2020 and especially for DBA Lillaroi (Table S1). A lack of FCR impact in 2021 is consistent with a lack of expression not infection in 2021 (Table S3). The season was too wet and temperatures were mild during grain filling, which limited the expression of whiteheads and hence the yield loss. Many quality traits were unaffected from FCR infection due to these climatic conditions, while in 2020 there was infection and expression of FCR, with significant effects from the genotype and Nrate and a FCR × Nrate interaction from the ANOVA (Table S4).

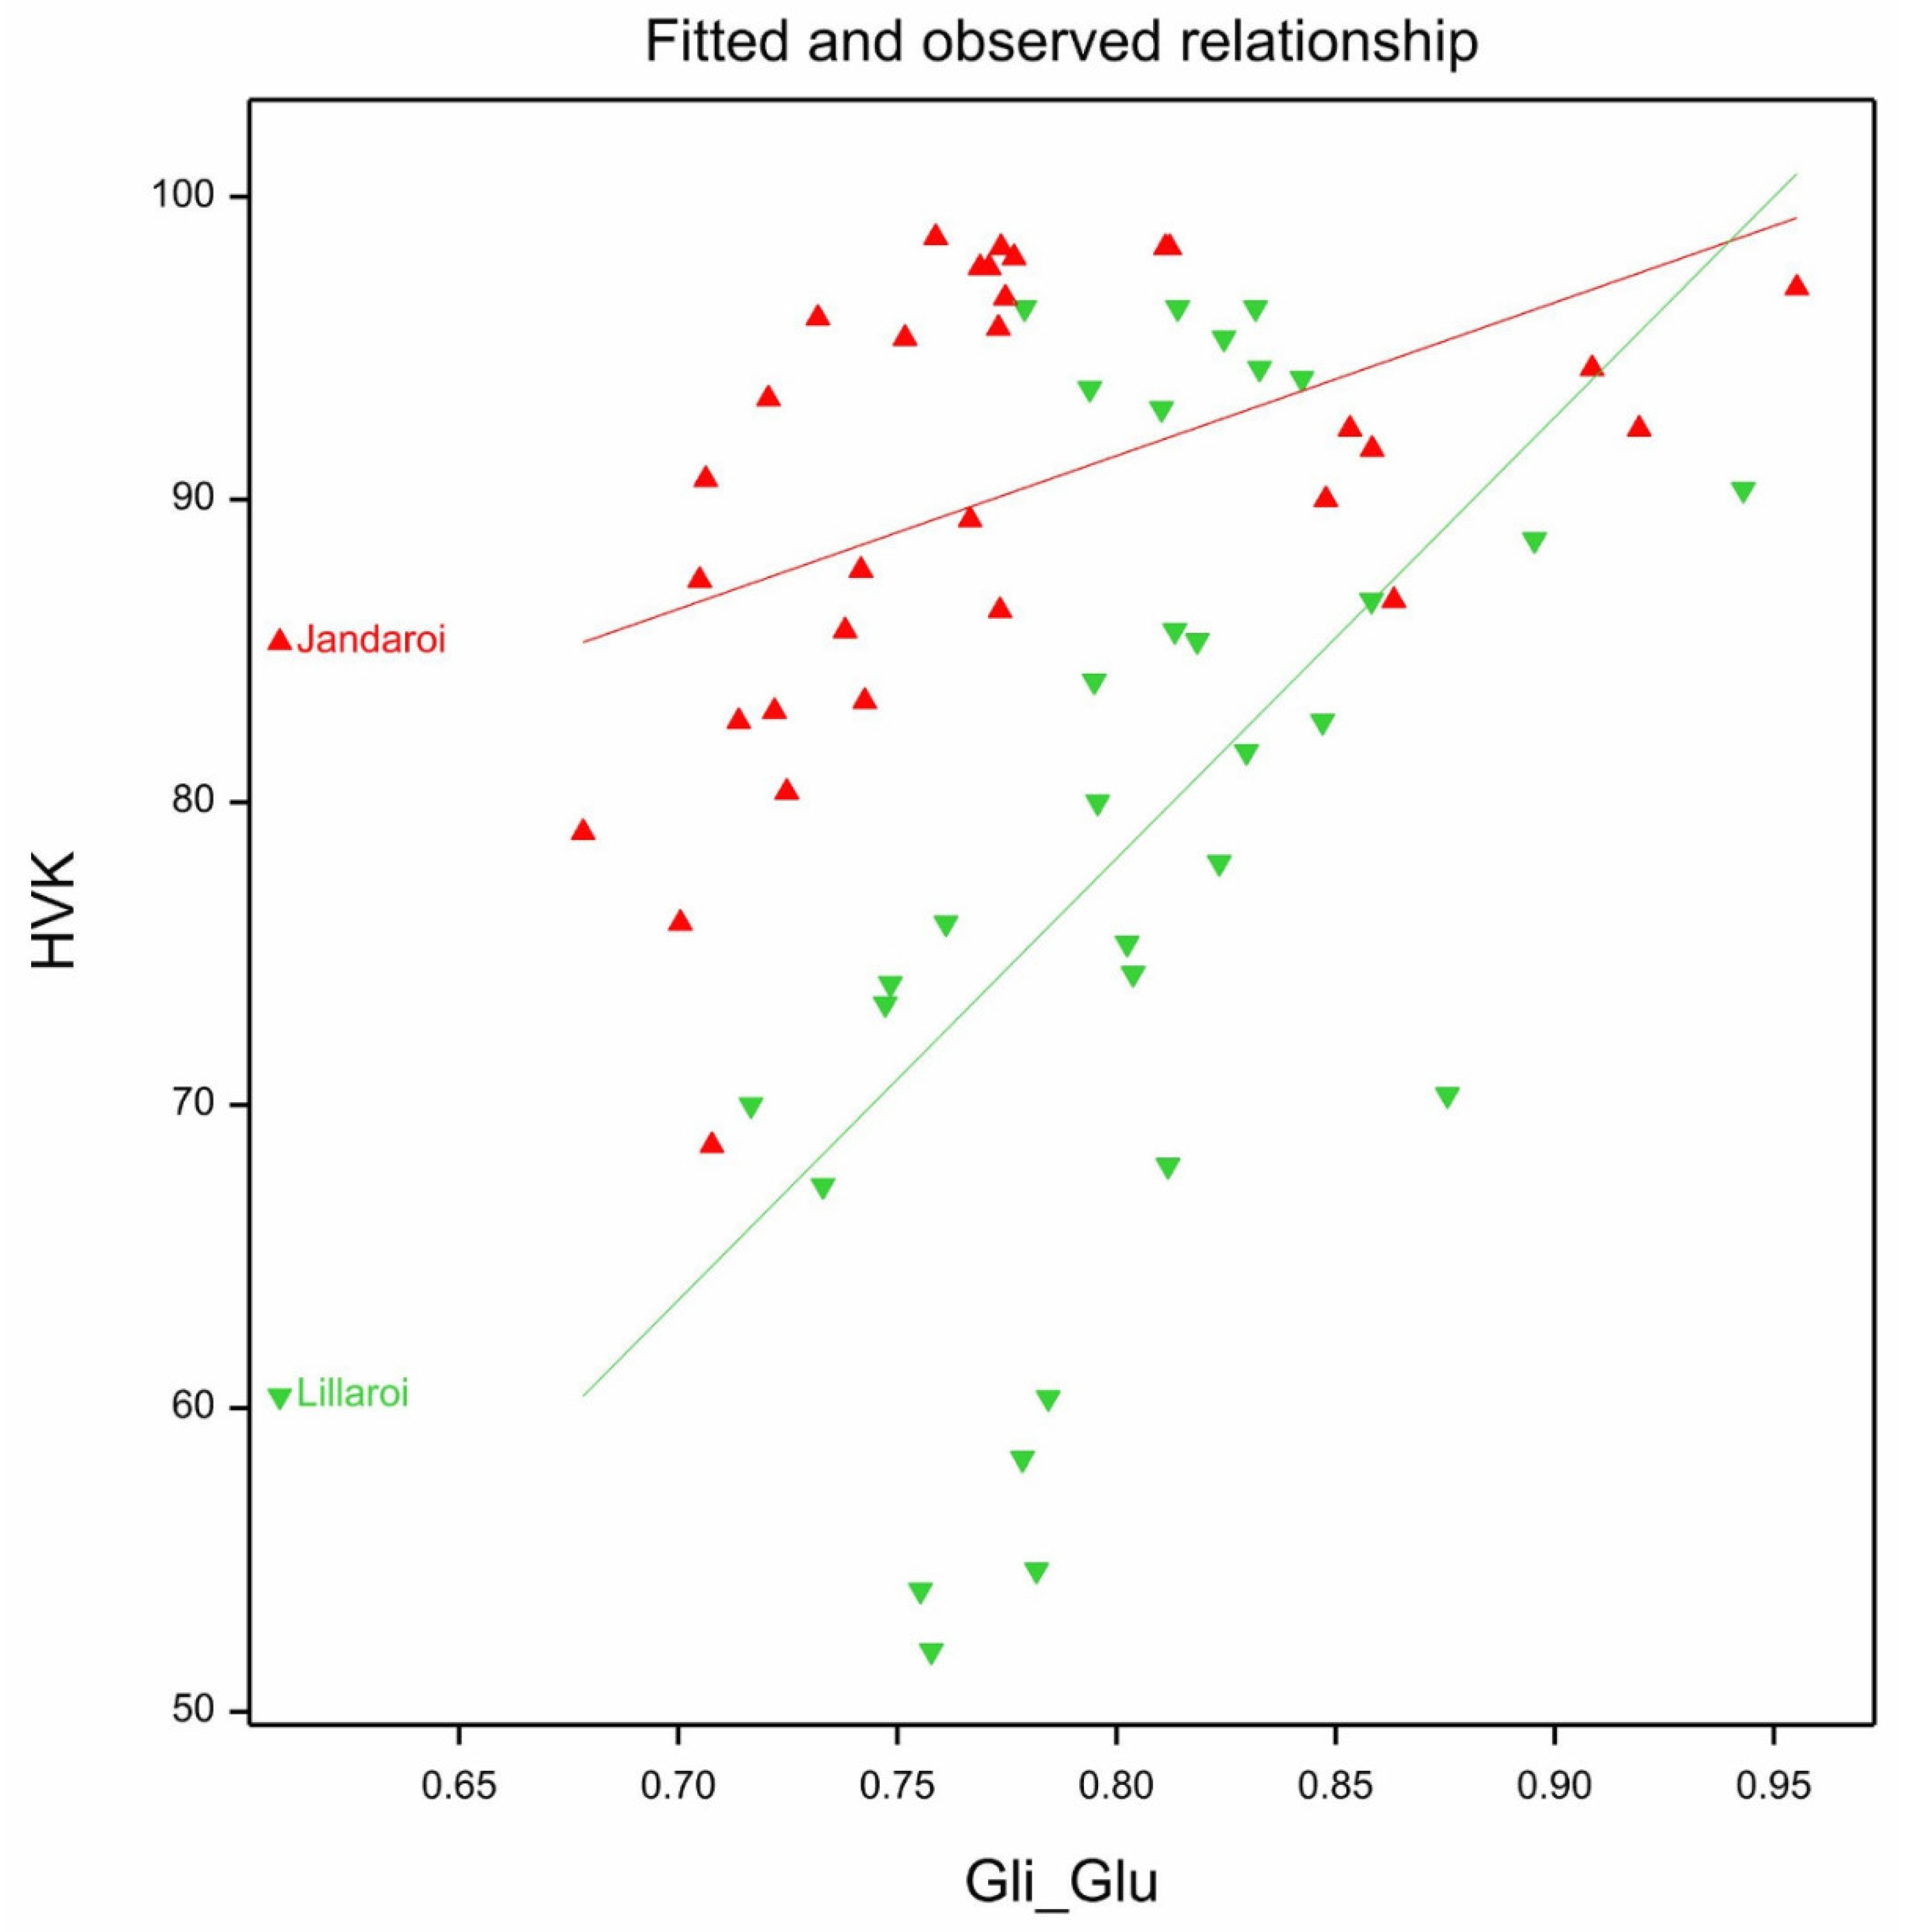
3.3. Protein Compositional Changes (2021 Season)

The protein composition of the mature grain samples can provide some explanation for the observed effects of the three treatments based on an understanding of the role of gluten proteins in grain quality. Only data from the 2021 season were examined by HPLC. As the protein content of the sample increased, the total area of each peak also increased (Table S5). Looking for trends in the data with genotype, Nrate and FCR infection reveals significant genotype effects for all six HPLC peak areas and for three derived parameters, except SolC, while for the Nrate the effect was only significant for SolB, InsolA, InsolA, InsolB and Gli/Glu, with no significant effect of FCR inoculation and no interactions (Table S5). Higher SolB mean values were found in DBA Lillaroi at the same corresponding Nrate than Jandaroi (Figure 12A). Only the higher N application led to a significant increase in the gliadin to glutenin ratio, changing the protein composition of the grain. For insolA, while some significant differences were apparent with Nrate, there was no consistent trend (Table S5). Overall, the mean Gli/Glu for DBA Lillaroi (0.806) was significantly higher than Jandaroi (0.777), but Jandaroi showed more response to the Nrate, plateauing at 80 N and increasing from 0 to 160 N by 8.1% compared to DBA Lillaroi at 5.1% (Figure 12B). A correlation analysis shows significant (p < 0.05) and strong correlations (defined as r ~ 0.7–0.9) between Gli/Glu and L* (−0.72), MPT (−0.74), RBD (0.78) and GI (−0.70); between SolA% and L* (−0.78), MPT (−0.88), RBD (0.87) and GI (−0.80); and between InsolA and TGW (−0.82), SY (−0.94), b* (−0.92) and GI (0.72). Low correlations (r ~ 0.3–0.7) were obtained between HVK and all these three HPLC parameters.
Principal component analyses (PCA) enable insight into the presence of patterns and relationships in available data by providing information of defined variables which behave similarly to each other. Traits showing simple correlations were analysed and separated by Nrate (Figure 13A,C) or genotype (Figure 13B,D). The first two principal components accounted for 90.73% or 98.79% of the variability of the data, respectively. For example, in Figure 13A, MPT was negatively correlated to RBD, while the GP, yield and WG were strongly positively correlated and higher values for GP, yield, WG, HVK were associated with higher Nrates. For varieties, these same traits (Figure 13B) show that Jandaroi data points cluster to higher values for HVK and GI. For milling traits, SY, Semo only and TGW were all correlated (Figure 13C) and for genotype split, higher milling and grain weight values were evident for DBA Lillaroi over Jandaroi (Figure 13D).

4. Discussion

Increased nitrogen (N) inputs are required to achieve higher grain protein levels desirable for obtaining premium durum wheat grades in Australia. Unfortunately, higher N inputs can exacerbate infections and yield losses from FCR [14,15], which is prevalent across the northern grain region of Northern New South Wales [6]. The two seasons were unseasonably wet compared to the long-term average rainfall (Table 1), but with important differences between the seasons during the critical grain filling period, which is September–November in this environment. The total rainfall in 2020 during this period was 103.4 mm, with a higher average maximum temperature of 27.4 °C, showing that 2020 was a drier and hotter season compared to 2021, with continued rainfall during grain filling and mild temperatures (rainfall of 279.8 mm and 24.5 °C). These overall differences in rainfall and temperature between the seasons, with 2020 being hotter and drier, are known to favour expression of FCR infection, resulting in a higher impact on grain yield [21] and some quality measures (TW, MPT, SCR and especially GI) in 2020. In 2020, high residual soil N levels reduced N responsiveness, with limited impacts on durum quality. The background soil N levels following extended mineralisation during drought years (2019 and earlier) potentially limited the impact of N treatments in 2020, as seen with yield and GP, which consequently limited impact on grain protein synthesis (reduction in glutenin and gliadin) that impacts grain structure and hence vitreosity (no change, very high). In 2021, the field experimental site was preceded by a sorghum crop which reduced soil N levels and resulted in significant GP and yield responses to varying N application rates and consequential effects on grain quality and gluten protein composition. Over the two years of this project, we did not have the combination of low starting soil N levels to drive strong responsiveness to N application rates and drier/hotter conditions during grain fill to favour FCR expression following inoculation. A third season (2022) would have been desirable but as it turned out, due to a persistent La Niña, the wet and mild conditions continued in 2022 (September–November had 389.8 mm rainfall and an average maximum temperature of 23.3 °C) that would have also limited the FCR expression at this location.

Comparison of Seasonal Impact on Yield and Quality

The grain yield in 2020 showed no significant difference between genotype and Nrate, but FCR infection impacted the GY in both varieties (reducing it), with a higher dose of inoculum having more impact in most situations. In the 2021 season, higher yields were obtained (overall mean in 2020: 2.0 t/ha; 2021, 4.8 t/ha) with much more responsiveness to applied N in both varieties but no significant effect from FCR inoculation. Yield increases were similar between varieties in 2021. The grain yield was responsive to applied N fertiliser in durum wheat, as N fertilization is largely considered to be the main factor affecting yield and protein content [22], where the N is converted into protein and biomass. This was reflected in the GP responses being dampened in 2020 (range 1.04%) compared to higher responsiveness at all N rates in 2021 (range 2.4%), especially between 40 and 160 N. These increases had the expected effects on technological quality traits. Nitrogen fertilization contributes to increases in protein content when the fertilizer rates satisfy the requirements of both yield and protein synthesis [23,24]. Indeed, in 2021, traits significantly affected by Nrate were GY, GP, WG, TW, TGW, HVK, SKHI, SY, Semo only, L*, b*, MPT, RBD, mixograph peak height and GI, compared to 2020, where only GP, WG, TGW, b* and Semo only were significantly affected by Nrate. In 2021, both varieties responded similarly to applied N, with DBA Lillaroi having a starting GP lower than Jandaroi. The response was larger at 80 N and above compared to lower rates. If the soil N at sowing is high, then the plant relies less on the applied N to fill the grain with protein. The GP content obtained in the mature grain depends on other factors such as water and N availability, length of grain filling, weather conditions prevailing during grain filling (like higher rainfall and lower temperatures prolonging the flowering and grain filling period), partitioning of N and dry matter to the grain and source–sink relations with leaves and stems [25]. An inverse relationship between the grain yield and grain N concentration has been reported in durum wheat [26,27,28,29,30]. Against this trend was a strong positive correlation between GY and GP in 2021 (r = 0.84, p < 0.05) but not in 2020. This relationship can be affected by soil fertility, water availability, etc. [25]. The combination of the above average rainfall and high rates of N application satisfying the requirements for both yield and protein synthesis could explain this positive correlation in 2021 [23]. Based on the GP responses, both varieties appear to have similar abilities to transfer the applied N to more grain protein. Grains were smaller in 2020 than in 2021 (mean TGW in 2020 was 41.8 g compared to 46.4 g in 2021) and this could also result in the higher protein in that season (mean 0 N GP of 13.8% in 2020 vs. 12.7% at 160 N in 2021).
Genetic differences in grain weight were evident between the two varieties and DBA Lillaroi was selected during breeding to achieve a high TGW and milling potential and the data support this as do other studies [31,32]. The overall TGWs achieved are typical for durum wheat grown in the NNSW region under non-drought situations, as was the case in the two seasons of this study. The Jandaroi TGW did not respond to Nrate, while that of DBA Lillaroi tended to decrease, but this was not consistent in 2020 and hardly changed in 2021. FCR had no impact on the TW in both varieties in 2021 because there was very little FCR expression despite the infection from the inoculation, but it reduced the TW for Jandaroi in 2020 significantly from 78.7 kg/hl to 77.6 kg/hl. This is not a large change and is of no commercial significance as these levels are above the trading discount of 76 kg/hl. There was some evidence of weather damage in the visual appearance of the kernels, especially in 2021, where a much lower HVK was found. Rainfall at or near harvest (1 December 2021) of 191 mm in November (Table 1) could have been responsible for the low falling numbers from 185 to 290 s in 2021 that was not found in the 2020 season (with only 3 mm of rain near harvest (24 November 2020) with a mean FN of 571 sec). While 185-290 s is below the minimum GTA trading value of 300 s required for acceptable grain [33], evidence from the literature suggests only if the weather damage to durum wheat is severe (FN < 100 s or thereabouts), is there any influence on pasta colour and cooking quality [33].
The percentage of kernels that are vitreous is an important grade determinant for durum wheat because of its impact on the semolina milling yield and end-product quality. Durum wheat with high HVK percentages (>80) and test weights will generally give high semolina yields with a minimum number of white starchy particles [34]. According to the grading standards in Australia [3], durum is graded as ADRI HVK > 80%; ADR2 HVK 70–80%; or ADR3 < 70%, which means that despite what the grain protein is, the grain could be downgraded at grain receival centres to a low HVK percentage with consequent financial penalties for growers. The grain vitreousness was affected in 2021 but not in 2020, where HVK percentage had average values of >95% probably because the protein was >13% and unresponsive to applied N. In 2021, the increase in N fertilisation led to an increase in HVK percentage, which is mostly likely due to an increase in GP that has been found by others [35,36]. A high grain protein content allows the formation of a compact grain structure due to the starch granules in the amyloplasts being surrounded by the protein matrix, and this creates reduced air spaces in the grain structure, resulting in a vitreous or “glassy” appearance, i.e., a high HVK score. In contrast, a less compact grain structure has many open spaces with a lower density endosperm [35], and the protein matrix is discontinuous, creating an opaque appearance due to light diffraction and diffusion in the void spaces [35]. There is generally a strong correlation between GP and HVK as observed in the 2021 data (GP vs. HVK, r = 0.81, p < 0.001, Figure 11B) in line with other reports [2,33]. This relationship differed between Jandaroi and DBA Lillaroi, with the former genotype showing a more gradual change and maintaining a HVK percentage mostly above 75% even at 9–10% GP, whereas DBA Lillaroi’s slope was larger with a HVK percentage of <80% as GP declined below 11.5%, reaching values as low as 42%. Given that a HVK percentage > 80 ensures a top grade (ADR1) in Australia, Jandaroi for most field plots met this requirement, whereas DBA Lillaroi did not, especially at Nrates below 80 kg/ha. Even with no applied N, many Jandaroi samples achieved HVK percentages of >80%, whereas for DBA Lillaroi, the applied N was found to be critical in achieving the highest grade and an 80 N minimum was required, with downgrading to the lowest grade at ≤20 N. This would strongly impact the price a grower would receive. Jandaroi has more potential to achieve a higher GP than DBA Lillaroi in the NNSW environment, although it quite often gives a lower yield [32]. So, despite the known relationship between HVK and GP, this was not observed for Jandaroi since even at very low GPs of 9–11%, the HVK percentage was mostly >75%. It has been noted by others that this strong association between protein and HVK is inconsistent [2] and Sieber et al. [37] found large variations in grain protein in non-vitreous kernels. A possible explanation is related to the protein composition and how that influences the grain structure. At the same Gli/Glu ratio range of 0.65–0.79, Jandaroi had a mean HVK percentage of 89 ± 8.3% and a GP of 11.4 ± 1%, while DBA Lillaroi had a mean HVK percentage of 70 ± 14.6% with a similar GP of 10.8 ± 1.1%, showing that despite very similar GPs and Gli/Glu ratios between the varieties, the grain structure in Jandaroi must be quite different to DBA Lillaroi to account for this large difference in HVK percentage. Thus, other factors are operating. The question then is why is Jandaroi able to maintain a high HVK percentage at low protein levels? Samson et al. [35] found that the genotype Néodur was able to synthesise protein more efficiently from applied N than other varieties examined (like the case for Jandaroi vs. DBA Lillaroi in this study) and showed the highest density kernels, consistent with a high HVK percentage. We found that as the HVK percentage increased, the gliadin to glutenin ratio increased in both durum varieties (Figure 14). This result is consistent with other studies showing preferential accumulation of gliadin in vitreous kernels [2,33]. Samson et al. [35] suggested that gliadin proteins facilitate the formation of the vitreous endosperm by providing better adhesion of the protein matrix to starch granules during kernel desiccation. Our data suggest this would at least have some dependence on the genotype, but none of the above studies examined the relationship between HVK percentage, GP and Glu/Gli in multiple genotypes. Further analysis of the glutenin proteins during grain maturation should confirm if Jandaroi does synthesise gliadins faster during grain development than DBA Lillaroi, and this may assist the formation of a “tighter grain structure” which translates into higher mature HVK levels in this genotype irrespective of the grain protein content, making Jandaroi a better genotype when soil N levels are low, but more studies are needed to confirm this.
Grain weight, TW and vitreousness can contribute to milling yield and purity (ash content and bran specks in semolina) that can impact pasta appearance and colour [38]. For the trait Semo only, in 2020, there was a tendency for this to decline with increased N, but only significantly for DBA Lillaroi (Figure 6). However, in 2021, there was a much greater change (increase) in Semo only which was very clear for DBA Lillaroi, increasing significantly from 20 N to 80 N, while Jandaroi showed little response to applied N (Figure 6). This was less apparent for the trait SY%, which showed smaller increases with applied N, and no change was noted in SY% for both varieties in 2020 (Figure 5). The increase in Semo only in DBA Lillaroi in 2021 could be due to a good response to applied N for the HVK percentage and less so for the TGW that was not the case for Jandaroi. It seems that DBA Lillaroi has more potential to improve its milling potential than Jandaroi, possibly by translating more N into starch through higher starch synthase activity or improving the milling potential of this genotype by changes in the endosperm to bran ratio, the separability of the bran or other factors [39]. However, further testing in more environments is needed to confirm this response, which is very interesting and shows potential to manipulate the milling potential with applied N dependent on genotype. Interestingly, despite DBA Lillaroi at Nrates < 80 kg/ha (2021 data only) having a HVK percentage of <75, Semo only and the SY% were still superior to Jandaroi, and even at 0 N DBA Lillaroi has a higher milling yield than Jandaroi at 160 N (for SY% only). It was noted by Fu et al. [2] that low protein durum can have acceptable milling yields even with a HVK percentage of <70%. Other factors come into play in particular genetic factors [32]. DBA Lillaroi’s genetic tendency to produce a high TGW could contribute to a higher semolina yield than Jandaroi and not so much, if at all, from HVK contributions. In particular, the N response seen in the TGW in DBA Lillaroi and not in Jandaroi would help in achieving a higher semolina yield. Fu et al. [2] found that when using composite durum wheat samples varying in GP from 14.5 to 9.9% and providing a HVK percentage of >70%, the semolina yield did not change with GP content, but the semolina yield declined significantly if a low HVK percentage coincided with low grain protein values. This could explain why the semolina yield in Jandaroi did not respond to N fertilisation (even at GPs of ~10.5% with 0 N) because the mean HVK percentage was >80%. However, for DBA Lillaroi at N < 80 kg/ha where the HVK percentage was <75% and the GP was < 11.5%, this combination resulted in the grain producing significantly less semolina on milling. In the 2020 season, both the GP of > 13% and the HVK percentage of >96% were high, which could explain the lack of SY response to applied N in that season. A high HVK percentage confers a superior milling performance and high wheat protein levels can mitigate the negative impact of a low HVK percentage on durum milling by reducing the size of the starchy areas in the piebald kernels [2].
The semolina colour is an important characteristic in durum because a high semolina yellowness tends to translate to a high pasta yellowness, although during milling and pasta processing loss of colour can occur [40]. Higher protein semolina is known to be duller (lower L*) as the protein affects the brightness/redness of semolina [41], and the semolina L* decreased with increasing N rate (Table S2). High HVK percentage grain can negate the effects of duller semolina due to high grain protein levels, resulting in the final pasta still remaining a bright yellow colour [2]. DBA Lillaroi has a higher semolina b* than Jandaroi because this genotype has a higher natural yellow pigment level in the endosperm as a result of years of breeding and selection to enhance semolina b* levels [32]. While there were no significant changes in semolina b* in 2020, in 2021, there was a significant increase for DBA Lillaroi but not for Jandaroi with increasing N. This is probably related to the increase in GP, as Dalla Marta et al. [42] reported an association between protein content increases and increases in yellow pigment content.
Jandaroi was selected to breed for its high dough strength reflected in the MPT (3–5 min), low RBD (<50) and very high GI (>90) superior to DBA Lillaroi [32]. While there was little effect of Nrate on the GI in the 2020 season for both varieties, in 2021, increasing the N application reduced the GI slightly in Jandaroi (95 to 85) and to a much larger extent in DBA Lillaroi (92 to 76). The FCR inoculum, however, significantly reduced the GI in both varieties in 2020 but had no effect in 2021 (Figure S1). The season was too wet and temperatures were mild during grain filling, which limited the expression of whiteheads and hence the yield loss and many quality traits were unaffected by FCR infection in 2021. The RBD in both varieties in 2021 increased with increasing N (Jandaroi from 27 to 46; DBA Lillaroi from 27 to 53) but not in 2020. These data indicate a weakening of dough strength with increasing N application, consistent with the decrease in the GI. The reason for the seasonal differences and effect of N is complex and may depend on other conditions like water availability and other environmental changes, as a genotype’s dough properties are affected by both genotypic and environmental factors [31,43]. Giuliani et al. [25] found in their N application study in durum wheat that while the GI was affected by N in one year, there was no change in another season. Other studies in wheat have shown a decrease in gluten strength with N fertilization in hard white winter wheats due to a preferential increase of gliadins over glutenins [44]. The negative influence of a higher Gli/Glu ratio on common wheat dough rheological properties is well known [45,46]. Increasing N led to an increase in the Gli/Glu ratio in both varieties, with different responses between varieties (Figure 12B). The regression of Gli/Glu on RBD and GI (Figure 15) shows that as the gliadin percentage increases, the dough becomes weaker. In Jandaroi, the increase in Gli/Glu did not result in much change in the GI, whereas in DBA Lillaroi, there was a much stronger relationship, suggesting that changes in Jandaroi Gli/Glu are much less likely to result in large shifts in the GI compared to DBA Lillaroi. This supports the findings of Saint Pierre et al. [44], but further verification is needed. This relationship is more complex and related to genetic differences in varieties’ abilities to retain gluten strength despite a changing protein composition. However, both varieties showed a similar change in RBD, increasing with an increase in Gli/Glu, but that did not translate to much reduction in the GI for Jandaroi. While the mixograph parameters and the gluten index tests are correlated, they measure different aspects of dough properties because they are fundamentally different methods to evaluate dough [47]. Horvat et al. [48] showed that, in common wheat, increasing the nitrogen level led to a higher grain protein content, with changes in the gliadin to glutenin ratio to a lesser extent, which was genotype specific.

5. Conclusions

This study was performed to illustrate the impact of fusarium crown rot (FCR) infection and its interaction with nitrogen fertiliser application levels at sowing on the grain yield and quality. The cool and wet conditions during the growing season in 2021 limited disease expression and FCR’s impact on yield and quality despite the infection of plants. Residual soil N levels at sowing were much higher in 2020 than in 2021, which limited the effects of N treatments on the yield and quality in the first year of experimentation. The lowering of residual soil N levels prior to sowing in 2021 resulted in good nitrogen responses in terms of the grain yield and grain protein content, with consequent effects on other technological properties such as TW, TGW, SY, L*, b*, MPT, RBD and GI. Jandaroi was found to maintain its kernel vitreosity at all protein levels, allowing a good probability of a grower obtaining the premium grade, while DBA Lillaroi did not and could be downgraded if the nitrogen application was insufficient. However, a higher nitrogen application needed to achieve a protein level of more than 12% could reduce the dough strength under some conditions, as was the case in 2021, but Jandaroi maintained its dough strength much better than DBA Lillaroi. While dough strength is not reflected in grain trading standards, it can impact pasta processing and pasta quality, so a genotype that has this trait is important to pasta processors. The response of the protein composition of the two varieties to nitrogen fertilisation differed and it was proposed that Jandaroi’s tendency to have a lower Gli/Glu ratio in response to nitrogen helps to maintain a high grain vitreousness and a high dough strength. This suggests that genetics plays an important role in a genotype’s response to nitrogen fertilisation and should be considered when selecting a genotype where a high grade is desirable. The potential of nitrogen application to increase the milling yield found in the 2021 season, especially in DBA Lillaroi, should be explored, and the mechanism for this effect should be determined, as it has the potential to increase the value to the miller. DBA Lillaroi’s genetic potential for a higher grain weight through breeding is an important characteristic. Further validation of these findings is needed over drier and warmer grain filling periods which favour the expression of FCR to better understand the relationships between genotype, Nrate and FCR.

Supplementary Materials

The following supporting information can be downloaded at: https://www.mdpi.com/article/10.3390/agronomy13061658/s1. Table S1. ANOVA table showing means and significance for treatments for the 2020 season. Table S2. ANOVA table showing means and significance for treatments for the 2021 season. Table S3. Means and LSD for % Fusarium infection for both varieties at different disease application rates—Tamworth 2021. Table S4. Means and LSD for % Fusarium infection for both varieties at different disease and nitrogen application rates—Tamworth 2020. Table S5. Mean SE-HLPC data for two durum wheat varieties at four N rates and two CR inoculations in mature grain for the 2021 season. Figure S1. Boxplot showing GI for both varieties at different CR inoculation rates (g/m) for the 2020 and 2021 seasons. LSD statistics shown for each year.

Author Contributions

Conceptualization, M.S. and S.S.; methodology, M.S., N.E. and S.S.; formal analysis, M.S.; investigation, M.S. and N.E.; resources, M.S. and S.S; writing—original draft preparation, M.S.; writing—review and editing, N.E. and S.S.; supervision, M.S. and S.S.; project administration, S.S.; funding acquisition, M.S. and S.S. All authors have read and agreed to the published version of the manuscript.

Funding

This research was funded under the Grains Agronomy and Pathology Partnership between New South Wales Department of Primary Industries and the Grains Research & Development Corporation, Project code DAN00212.

Institutional Review Board Statement

Not applicable.

Informed Consent Statement

Not applicable.

Data Availability Statement

Please contact the corresponding author with requests for data.

Acknowledgments

We would like to acknowledge the contributions of technical staff at New South Wales Department of Primary Industries for their technical support in the project.

Conflicts of Interest

The authors declare no conflict of interest.

References

  1. Richards, R.A.; Rebetzke, G.J.; Condon, A.G.; van Herwaarden, A.F. Breeding opportunities for increasing the efficiency of water use and crop yield in temperate cereals. Crop Sci. 2002, 42, 111–121. [Google Scholar] [CrossRef] [PubMed]
  2. Fu, B.X.; Wang, K.; Dupuis, B.; Taylor, D.; Nam, S. Kernel vitreousness and protein content: Relationship, interaction and synergistic effects on durum wheat quality. J. Cereal Sci. 2018, 79, 210–217. [Google Scholar] [CrossRef]
  3. Anonymous. Grain Trade Australia Wheat Standards 2020/21. 2020. Available online: http://www.graintrade.org.au/sites/default/files/WHEAT%20STANDARDS%202020-2021%20All%20Grades%20updated%20061120.pdf (accessed on 22 November 2022).
  4. Herbert, A. An international benchmarking comparison of Australian crop production and profitability. In GRDC Updates; GRDC, Ed.; GRDC: Perth, Australia, 2017. [Google Scholar]
  5. Chakraborty, S.; Liu, C.L.; Mitter, V.; Scott, J.B.; Akinsanmi, O.A.; Ali, S.; Dill-Macky, R.; Backhouse, D.; Simpfendorfer, S. Pathogen population structure and epidemiology are keys to wheat crown rot and Fusarium head blight management. Australas. Plant Pathol. 2006, 35, 643–655. [Google Scholar] [CrossRef]
  6. Simpfendorfer, S.; McKay, A.; Ophel-Keller, K. New approaches to crop disease management in conservation agriculture. In Australian Agriculture in 2020: From Conservation to Automation; Pratley, J., Kirkegaard, J., Eds.; Agronomy Australia and Charles Sturt University: Wagga Wagga, Australia, 2019; pp. 173–188. [Google Scholar]
  7. Alahmad, S.; Simpfendorfer, S.; Bentley, A.R.; Hickey, L.T. Crown rot of wheat in Australia: Fusarium pseudograminearum taxonomy, population biology and disease management. Australas. Plant Pathol. 2018, 47, 285–299. [Google Scholar] [CrossRef]
  8. Murray, G.M.; Brennan, J.P. Estimating disease losses to the Australian wheat industry. Australas. Plant Pathol. 2009, 38, 558–570. [Google Scholar] [CrossRef]
  9. Petronaitis, T.; Simpfendorfer, S.; Hüberli, D. Importance of Fusarium spp. in Wheat to Food Security: A Global Perspective. In Plant Diseases and Food Security in the 21st Century; Scott, P., Strange, R., Korsten, L., Gullino, M.L., Eds.; Springer International Publishing: Cham, Switzerland, 2021; pp. 127–159. [Google Scholar]
  10. Evans, M.L.; Hollaway, G.J.; Dennis, J.L.; Correll, R.; Wallwork, H. Crop sequence as a tool for managing populations of Fusarium pseudograminearum and F. culmorum in south-eastern Australia. Australas. Plant Pathol. 2010, 39, 376–382. [Google Scholar] [CrossRef]
  11. Kirkegaard, J.A.; Simpfendorfer, S.; Holland, J.; Bambach, R.; Moore, K.J.; Rebetzke, G.J. Effect of previous crops on crown rot and yield of durum and bread wheat in northern NSW. Aust. J. Agric. Res. 2004, 55, 321–334. [Google Scholar] [CrossRef]
  12. Verrell, A.G.; Simpfendorfer, S.; Moore, K.J. Effect of row placement, stubble management and ground engaging tool on crown rot and grain yield in a no-till continuous wheat sequence. Soil Tillage Res. 2017, 165, 16–22. [Google Scholar] [CrossRef]
  13. Forknall, C.R.; Simpfendorfer, S.; Kelly, A.M. Using yield response curves to measure variation in the tolerance and resistance of wheat cultivars to Fusarium crown rot. Phytopathology 2019, 109, 932–941. [Google Scholar] [CrossRef]
  14. Davis, R.A.; Huggins, D.R.; Cook, J.R.; Paulitz, T.C. Nitrogen and crop rotation effects on fusarium crown rot in no-till spring wheat. Can. J. Plant Pathol. 2009, 31, 456–467. [Google Scholar] [CrossRef]
  15. Buster, M.; Simpfendorfer, S.; Guppy, C.; Sissons, M.; Flavel, R.J. Interactions of Fusarium crown rot of wheat with nitrogen. Plants 2023, 12, 533. [Google Scholar] [CrossRef]
  16. Hughes, N.; Galeano, D.; Hatfield-Dodds, S. The Effects of Drought and Climate Variability on Australian Farms; Australian Bureau of Agricultural and Resource Economics and Sciences: Canberra, Australia, 2019. [CrossRef]
  17. Zörb, C.; Ludewig, U.; Hawkesford, M.J. Perspective on wheat yield and quality with reduced nitrogen supply. Trends Plant Sci. 2018, 23, 1029–1037. [Google Scholar] [CrossRef] [PubMed] [Green Version]
  18. Ophel-Keller, K.; McKay, A.; Hartley, D.; Herdina; Curran, J. Development of a routine DNA-based testing service for soilborne diseases in Australia. Australas. Plant Pathol. 2008, 37, 243–253. [Google Scholar] [CrossRef]
  19. Sissons, M.; Ovenden, B.; Adorada, D.; Milgate, A. Durum wheat quality in high input irrigation systems in south-eastern Australia. Crop Pasture Sci. 2014, 65, 411–422. [Google Scholar] [CrossRef]
  20. Sissons, M.J.; Batey, I.L. Protein and starch properties of some tetraploid wheats. Cereal Chem. 2003, 80, 468–475. [Google Scholar] [CrossRef]
  21. Hollaway, G.J.; Evans, M.L.; Wallwork, H.; Dyson, C.B.; McKay, A.C. Yield loss in cereals, caused by Fusarium culmorum and F. pseudograminearum, is related to fungal DNA in soil prior to planting, rainfall, and cereal type. Plant Dis. 2013, 97, 977–982. [Google Scholar] [CrossRef] [Green Version]
  22. Fuertes-Mendizabal, T.A.; Aizpurua, M.B.; Gonzalez-Moro, J.M.; Estavillo, J.M. Improving wheat breadmaking quality by splitting the N fertilizer rate. Euro. J. Agron. 2010, 33, 52–61. [Google Scholar] [CrossRef]
  23. Johansson, V.A.; Mattern, P.J. Wheat, rye, and triticale. In Nutritional Quality of Cereal Grains; Olson, R.A., Frey, K.J., Eds.; ASA: Branchburg, NJ, USA; CSSA: Little Rock, ML, USA; SSSA: Madison, WI, USA, 1987; Volume 28, pp. 133–182. [Google Scholar]
  24. Reznick, J.P.K.; Barth, G.; Kaschuk, G.; Pauletti, V. Nitrogen and cultivars as field strategies to improve the nutritional status of wheat grain and flour. J. Cereal Sci. 2021, 102, 103290. [Google Scholar] [CrossRef]
  25. Giuliani, M.M.; Giuzio, L.; De Caro, A.; Flagella, Z. Relationships between nitrogen utilization and grain technological quality in durum wheat: II. Grain yield and quality. Agron. J. 2011, 103, 1668–1675. [Google Scholar] [CrossRef]
  26. Ehdaie, B.; Waines, J.G. Sowing date and nitrogen rate effects on dry matter and nitrogen partitioning in bread and durum wheat. Field Crops Res. 2001, 73, 47–61. [Google Scholar] [CrossRef]
  27. Martre, P.; Porter, J.R.; Jamieson, P.D.; Triboi, E. Modelling grain nitrogen accumulation and protein composition to understand the sink/source regulation of nitrogen remobilization for wheat. Plant Phys. 2003, 133, 1959–1967. [Google Scholar] [CrossRef] [PubMed] [Green Version]
  28. Clarke, J.M.; Clarke, F.R.; Pozniak, C.J. Forty-six years of genetic improvement in Canadian durum wheat cultivars. Can. J. Plant Sci. 2010, 90, 791–801. [Google Scholar] [CrossRef]
  29. DePauw, R.M.; Knox, R.E.; Clarke, F.R.; Wang, H.; Fernandez, M.R.; Clarke, J.M.; McCaig, T.N. Shifting undesirable correlations. Euphytica 2007, 157, 409–415. [Google Scholar] [CrossRef]
  30. Motzo, R.; Fois, S.; Giunta, F. Relationship between grain yield and quality of durum wheats from different eras of breeding. Euphytica 2004, 140, 147–154. [Google Scholar] [CrossRef]
  31. Sissons, M.; Kadkol, G.; Taylor, J. Genotype by environment effects on durum wheat quality and yield implications for breeding. Crop Breed. Genet. Genomics. 2020, 2, e200018. [Google Scholar]
  32. Kadkol, G.; Sissons, M.; Lambert, N.; Lisle, C. Genetic improvement in grain yield and quality of Australian durum wheat over six decades of breeding. Cereal Chem. 2022, 100, 109–130. [Google Scholar] [CrossRef]
  33. Dexter, J.E.; D’Egidio, M.G. Grading factors impacting durum wheat processing quality. In Durum Wheat Chemistry and Technology, 2nd ed.; Sissons, M.S., Abecassis, J., Marchylo, B., Carcea, M., Eds.; AACC International Press: St. Paul, MN, USA, 2012; pp. 235–250. [Google Scholar]
  34. Dexter, J.E.; Williams, P.C.; Edwards, N.M.; Martin, D.G. The relationships between durum wheat vitreousness, kernel hardness and processing quality. J. Cereal Sci. 1988, 7, 169–181. [Google Scholar] [CrossRef]
  35. Samson, M.-F.; Mabille, F.; Cheret, R.; Abecassis, J.; Morel, M.H. Mechanical and physicochemical characterization of vitreous and mealy durum wheat endosperm. Cereal Chem. 2005, 82, 81–87. [Google Scholar] [CrossRef]
  36. Boukef, S.; Karmous, C.; Trifa, Y.; Rezgui, S. Durum wheat grain quality traits as affected by nitrogen fertilization sources under mediterranean rainfed conditions. J. Agric. Sustain. 2013, 4, 99–114. [Google Scholar]
  37. Sieber, A.N.; Würschum, T.; Longin, C.G.H. Vitreosity, its stability and relationship to protein content in durum wheat. J. Cereal Sci. 2015, 61, 71–77. [Google Scholar] [CrossRef]
  38. Wang, K.; Taylor, D.; Chen, Y.; Suchy, J.; Fu, B.X. Effect of kernel size and its potential interaction with genotype on key quality traits of durum wheat. Foods 2021, 10, 2992. [Google Scholar] [CrossRef] [PubMed]
  39. Sissons, M.; Abecassis, J.; Cubadda, R.; Marchylo, B. Methods used to assess and predict quality of durum wheat, semolina and pasta. In Durum Wheat Chemistry and Technology, 2nd ed.; Sissons, M.S., Abecassis, J., Marchylo, B., Carcea, M., Eds.; AACC International Press: St. Paul, MN, USA, 2012; pp. 213–234. [Google Scholar]
  40. Ficco, D.B.M.; Mastrangelo, A.M.; Trono, D.; Borrelli, G.M.; Vita, P.D.; Fares, C.; Beleggia, R.; Platani, C.; Papa, R. The colours of durum wheat: A review. Crop Pasture Sci. 2014, 65, 1–15. [Google Scholar] [CrossRef]
  41. Feillet, P.; Autran, J.C.; Icard-Verniere, C. Pasta brownness: An assessment. J. Cereal Sci. 2000, 32, 215–233. [Google Scholar] [CrossRef]
  42. Dalla Marta, A.D.; Grifoni, M.; Mancini, G.; Zipoli, S.; Orlandini, S. The influence of climate on durum wheat quality in Tuscany, central Italy. Intern. J. Biometeorol. 2011, 55, 87–96. [Google Scholar] [CrossRef]
  43. Fois, S.; Schlichting, L.; Marchylo, B.; Dexter, J.; Motzoa, R.; Giuntaa, F. Environmental conditions affect semolina quality in durum wheat (Triticum turgidum ssp. durum L.) cultivars with different gluten strength and gluten protein composition. J. Sci. Food Agric. 2011, 91, 2664–2673. [Google Scholar] [CrossRef]
  44. Saint Pierre, C.; Peterson, C.J.; Ross, A.S.; Ohm, J.B.; Verhoeven, M.C.; Larson, M.; Hoefer, B. Winter wheat cultivars under different levels of nitrogen and water stress: Changes in grain protein composition. J. Cereal Sci. 2008, 47, 407–416. [Google Scholar] [CrossRef]
  45. Barak, S.; Mudgil, D.; Khatkar, B.S. Influence of gliadin and glutenin fractions on rheological, pasting, and textural properties of dough. Intern. J. Food Prop. 2014, 17, 1428–1438. [Google Scholar] [CrossRef]
  46. Tang, J.W.; Liu, J.J.; Zhang, P.P.; Zhang, Y.; Xiao, Y.G.; Qu, Y.Y.; Zhang, Y.; He, Z.H. Effects of gluten protein fractions on dough property and products quality in common wheat. Sci. Agric. Sin. 2008, 41, 2937–2946. [Google Scholar]
  47. AbuHammad, W.A.; Elias, E.M.; Manthey, F.A.; Alamri, M.S.; Mergoum, M. A comparison of methods for assessing dough and gluten strength of durum wheat and their relationship to pasta cooking quality. Intern. J. Food Sci. Tech. 2012, 47, 2561–2673. [Google Scholar] [CrossRef]
  48. Horvat, D.; Šimić, G.; Dvojković, K.; Ivić, M.; Plavšin, I.; Novoselović, D. Gluten protein compositional changes in response to nitrogen application rate. Agronomy 2021, 11, 325. [Google Scholar] [CrossRef]
Figure 1. Boxplot showing grain yield for both varieties at different N application (kg/ha) and CR inoculation (g/m) rates from 2020 season. Boxplots show the median and interquartile range of trial data. LSD statistic shown as bar with value, p < 0.05.
Agronomy 13 01658 g001
Figure 2. Boxplot showing grain protein % (GP%) for both varieties at different N application rates at sowing for the 2020 and 2021 seasons. J = Jandaroi; L = DBA Lillaroi; numbers are N kg/ha. Boxplots show the median and interquartile range of trial data. LSD statistics shown for each year.
Agronomy 13 01658 g002
Figure 3. Boxplot showing the 1000 grain weight (TGW) for both varieties at different N application rates at sowing for the 2020 and 2021 seasons. LSD statistics shown for each year.
Agronomy 13 01658 g003
Figure 4. Boxplot showing the test weight (TW) for both varieties at different CR inoculation rates (g/m) for the 2020 and 2021 seasons. LSD statistics shown for each year. Green cross refers to an outlier value.
Agronomy 13 01658 g004
Figure 5. Boxplot showing the semolina yield % (SY) for both varieties at different N application rates at sowing for the 2020 and 2021 seasons. LSD statistics shown for each year.
Agronomy 13 01658 g005
Figure 6. Boxplot showing the semolina only yield for both varieties at different N application rates at sowing for the 2020 and 2021 seasons. LSD statistics shown for each year.
Agronomy 13 01658 g006
Figure 7. Boxplot showing the semolina yellowness (b*) of both varieties at different N application rates at sowing for the 2020 and 2021 seasons. LSD statistics shown for each year.
Agronomy 13 01658 g007
Figure 8. Boxplot showing the gluten index (GI) for both varieties at different N application rates at sowing for the 2020 and 2021 seasons. LSD statistics shown for each year.
Agronomy 13 01658 g008
Figure 9. Boxplot showing the mixograph resistance breakdown (RBD) for both varieties at different N application rates at sowing for the 2020 and 2021 seasons. LSD statistics shown for each year.
Agronomy 13 01658 g009
Figure 10. Boxplot showing the grain yield for both varieties at different N application and CR inoculation rates in the 2021 season.
Agronomy 13 01658 g010
Figure 11. (A) Boxplot showing the HVK% for both varieties at different N application rates at sowing for the 2021 season. LSD statistics shown and green crosses refers to outlier values. (B) Linear regression plots for each genotype, lines are the best fit coloured according to genotype, r2 = 0.76, p < 0.001.
Agronomy 13 01658 g011
Figure 12. (A) Boxplot showing SE-HPLC soluble B (SolB%) and (B) gliadin/glutenin ratio (Gli/Glu) for both varieties at different N application rates at sowing for the 2021 season. LSD statistics shown with cross showing outlier.
Agronomy 13 01658 g012
Figure 13. PCA plots of mean values of samples for selected traits from the 2021 season. Colour coding for Nrate (A,C) and genotype (B,D) is shown in the legends. Lines are scales relevant to each trait. Traits for A & B shown are HVK, Corr P, Yield, %WG, RBD, MPT, GI and for C & D, Yield, S_Only, TGW, SY, b, HVK.
Agronomy 13 01658 g013aAgronomy 13 01658 g013b
Figure 14. Linear model showing fitted values (line) and observed values (triangles) between HVK and the Gli/Glu ratio by genotype.
Agronomy 13 01658 g014
Figure 15. Linear models showing fitted values (line) and observed values (triangles) between the Gli/Glu ratio and RBD (A) and between the Gli/Glu ratio and the GI (B) according to genotype.
Agronomy 13 01658 g015
Table 1. Seasonal rainfall (mm), minimum temperature and maximum temperature (°C) at Tamworth in 2020, 2021 and LTA average data (1993–2021).
MetricJanuaryFebruaryMarchAprilMayJuneJulyAugustSeptemberOctoberNovemberDecemberAnnual
Rainfall 202097.4202.283.449.039.229.437.029.226.873.63.0223.6893.8
Rainfall 202123.6108.2162.022.624.6125.065.448.436.852.0191.070.6930.2
Rainfall LTA61.273.957.225.330.453.440.939.546.358.382.380.4638.5
Min T 202021.419.014.49.85.13.73.52.96.610.313.317.0
Min T 202115.315.714.47.04.13.72.93.44.18.714.014.7
Min T LTA17.716.914.510.06.03.62.32.85.89.713.315.7
Max T 202036.329.727.524.118.917.516.917.623.327.131.830.4
Max T 202130.829.927.423.920.516.816.619.922.125.425.929.9
Max T LTA33.031.529.225.520.817.016.518.522.025.628.630.8
LTA = long-term average from Australian Bureau of Meteorology data. http://www.bom.gov.au/jsp/ncc/cdio/weatherData/av?p_nccObsCode=139&p_display_type=dataFile&p_startYear=&p_c=&p_stn_num=055325, accessed on 2 April 2023.
Disclaimer/Publisher’s Note: The statements, opinions and data contained in all publications are solely those of the individual author(s) and contributor(s) and not of MDPI and/or the editor(s). MDPI and/or the editor(s) disclaim responsibility for any injury to people or property resulting from any ideas, methods, instructions or products referred to in the content.

