Article

The Effect of Foliar Zinc Application on the Leaf Chlorophyll Concentrations and Grain Yields of the Winter Wheat (Triticum aestivum L.) in the Field Experiments of Two Seasons

by
Katalin Irmes
1,*,
István Kristó
2,
Lajos Szentpéteri
1,
Attila Rácz
1,
Marianna Vályi-Nagy
1,
Mária Katalin Kassai
1,
Klára Veresné Valentinyi
3 and
Melinda Tar
4
1
Institute of Agronomy, Hungarian University of Agriculture and Life Sciences, Páter Károly Street 1, Gödöllő, H-2100 Pest, Hungary
2
Cereal Research Non-Profit Company Ltd., Alsó kikötő sor 9, H-6726 Szeged, Hungary
3
Institute of Rural Development and Sustainable Economy, Hungarian University of Agriculture and Life Sciences, Páter Károly Street 1, Gödöllő, H-2100 Pest, Hungary
4
Faculty of Agriculture, University of Szeged, Andrássy Street 15, H-6800 Hódmezővásárhely, Hungary
*
Author to whom correspondence should be addressed.
Agronomy 2023, 13(6), 1640; https://doi.org/10.3390/agronomy13061640
Submission received: 12 May 2023 / Revised: 13 June 2023 / Accepted: 16 June 2023 / Published: 19 June 2023
(This article belongs to the Topic Plants Nutrients)

Abstract

:
This research examined the effectiveness of zinc foliar fertilizers. Two winter wheat varieties, GK Pilis and Zvezdana, were tested in a Zn-limited meadow chernozem soil. Crop yields and chlorophyll concentrations of the leaves were examined in the growing seasons of 2020/2021 of favorable weather conditions and 2021/2022 of drought weather conditions. In the experiment, three treatments were carried out with monozinc foliar fertilizer of a concentrated 12% (w/v) zinc sulfate heptahydrate solution, and the fourth plot was designed as the untreated control. The first monozinc treatment was applied at a dose of 1 L ha−1 and the second monozinc treatment at a dose of 2 L ha−1. These treatments were applied at tillering (BBCH 21–22). The third monozinc treatment was applied at a dose of 1 L ha−1 at tillering and flag leaf emergence (BBCH 21–22, BBCH 37). Samples were taken several times in the vegetation period, and measurements were made using different methods (SPAD, determination of total chlorophyll concentration from acetone solution) before and after Zn treatments. In 2020/2021 of favorable weather conditions, the yield of Zvezdana was 5.47 t ha−1 and that of Gk Pilis was 6.11 t ha−1, compared to 2021/2022 of drought weather conditions, in which year the yield of Zvezdana was 3.14 t ha−1 and that of Gk Pilis was 2.79 t ha−1. Yields of both varieties increased with increasing NPK nutrient doses. In 2021/2022, even at nutrient level D (NPK basal fertilizer and two-times N topdressing), we harvested on average twice as much as in 2020/2021 at nutrient level A (N basal fertilizer and once N topdressing). No significant effects were found between the foliar fertilizers in 2020/2021. In 2021/2022, Zn treatments, mainly at four nutrient levels tended to increase the yields of both varieties. The first treatment resulted in a grain yield reduction of 3% for GK Pilis, and the second treatment resulted in a grain yield reduction of 1.2% for Zvezdana. After the second and third treatments, grain yield reductions were 0.1%–0.5%. Although there was no significant difference in terms of the main averages, foliar fertilizer was found to be effective in the second year. The relationship between chlorophyll and grain yield was found to depend on the year and variety. A weak correlation (r = 0.33, p < 0.05) was found between the total chlorophyll concentration in leaves for Zvezdana in 2021, and a medium correlation for GK Pilis (r = 0.67, p < 0.05). Concerning grain yield and chlorophyll concentration, a strong correlation (r = 0.81, p < 0.05) was found for Zvezdana in 2022, and a weak correlation (r = 0.44, p < 0.05) for GK Pilis. A strong correlation was found between the total leaf chlorophyll concentration and SPAD index in both years (r = 0.81, p < 0.05)

1. Introduction

Winter wheat (Triticum aestivum L.) is the second-most-commonly cultivated crop worldwide [1]. The size of the area under cultivation in Hungary has long been approaching 1 million hectares per year, the yield exceeds 5 million tons per year, and the average yield is around 5.5 tons/hectare [2]. The different varieties can achieve maximum yield only when growing conditions are optimal for them [3]. In recent decades, the technology of wheat cultivation has changed significantly, the amount of input materials has decreased, and weather anomalies and stresses caused by climate change have affected the amount of the crop to a great extent [4]. The main stresses include salt, drought, water excess, UV-B radiation, cold, heat, pathogens, insects, and chemicals [5,6,7]. For wheat, the effects of drought stress and heat stress are most significant. These two types of stress most often occur at the same time [8,9]. Both biotic and abiotic stress factors affect the content and efficiency of leaf photosynthetic pigments and/or their reciprocal ratio [10]. For example, the assessment of leaf photosynthetic pigments is an important indicator of senescence because the breakdown of leaf chlorophyll is associated with environmental stress [11]. Winter wheat is particularly sensitive to drought and heat stress, mostly during the period of full flowering and grain filling [12]. During this period, the combined stress effect can lead to a reduction in yield and deterioration of quality [13]. Leaf chlorophyll concentration varies within wide limits (from 0.05 to 0.30% of fresh matter). The highest chlorophyll concentration in plants occurs at the beginning of the flowering phase, and chlorophyll is thought to be involved in the process of organogenesis [14].
Fertilization has economic benefits as well, since the proper fertilization of winter wheat is one of the agrotechnical factors that influence the yield [15]. Therefore, it is necessary to know the quantity and dynamics of the nutrients absorbed by the plant, the influence of the crop previously grown in the area, the nutrient supply capacity of the soil, and the cultivation goals [16]. The utilization of the fertilizer can be influenced by a number of factors, including the efficiency of the nutrient that is crucial for increasing crop yield and its quality that reduce the amount of fertilizer inputs and minimize the environmental damages of the cultivated wheat variety [17]. Consequently, the selection of the appropriate wheat variety for specific agroecological parameters is a basic variable for efficient and economical wheat cultivation [18,19]. According to the nutrient uptake dynamics of wheat, the plant takes up 90% of the nutrients needed for crop formation upon its emergence [20].
Early and/or efficient nutrient remobilization is associated with higher concentrations of desirable micronutrients such as Fe and Zn [21,22,23]. All nutrient deficiencies affected chlorophyll concentration and generally increased reflectance in the visible (VIS) ranges of 400–700 nm and infrared (IR) ranges of 700–1100 nm. Nitrogen deficiencies had the most pronounced effect on chlorophyll concentration and reflectance [21]. In addition to macroelements, the role of essential microelements cannot be neglected either, because the lack of microelements can reduce the efficiency of fertilization. Their absence also reduces the yield, increases the stress effect, and can result in susceptibility to pathogens [24,25]. The nutrients in the soil that can be absorbed by the roots depend on a wide range of factors. They can bind to soil particles to varying degrees depending, for example, on the clay content and chemical effect, and the physical condition of the soil (moisture content, compaction, aeration) can also influence the amount of nutrients available and to be absorbed by plants [26]. Foliar fertilizers or plant conditioners are not plant protection agents but important supplements in the nutrient supply [27]. For some elements, plant nutrition through the foliage is more efficient and economical under certain physiological conditions [28]. In addition to basic fertilization with macroelements, foliar fertilization by complex or individual elements is becoming increasingly important [29]. The use of foliar fertilizers has become more and more common in intensive agricultural practices. Besides macronutrients, micronutrients play a particularly important role in wheat cultivation [30].
Among trace elements, zinc (Zn) is an essential element, which is indispensable for the life processes of living organisms. In wheat, zinc plays an important role in seed formation, root growth, and in developing resistance to diseases. In recent decades, zinc deficiency in agricultural areas has been a serious problem [31]. It is an essential microelement for plants, an important enzyme component, and an enzyme activator. For this reason, zinc fertilization also contributes to the protection against diseases. The plant absorbs Zn2+ ions or its chelated form from the soil [32]. In our research, the effects of zinc foliar fertilizers on the yield and chlorophyll concentration of two different maturity groups of winter wheat in four different doses of fertilizers were investigated.

2. Materials and Methods

2.1. The Background of the Experiment

Field experiments were conducted in two consecutive seasons of 2020–2021 and 2021–2022 in the Applied Agronomy Research Station of the Institute of Agronomy of the Hungarian University of Agriculture and Life Sciences (MATE), in Szeged-Öthalom(46°17′29.6″ N 20°05′17.3″ E). The experiments conducted since 1998 were set up in a small plot in a randomized block design with monoculture fertilization, four nutrient levels, and four replications. The nutrient levels were set up as follows: level A = 60 kg ha−1 of nitrogen, no phosphorus, and no potassium were used; level B = 90 kg ha−1 of nitrogen, 30 kg ha−1 of phosphorus, and 30 kg ha−1 of potassium were used; level C = 120 kg ha−1 of nitrogen, 60 kg ha−1 of phosphorus, and 60 kg ha−1 of potassium were used; and level D = 150 kg ha−1 of nitrogen, 60 kg ha−1 of phosphorus, and 60 kg ha−1 of potassium were used. Autumn multinutrient fertilizer was applied as a base fertilizer. Spring top-dressing fertilization was carried out by hand in two stages, using ammonium nitrate. Doses for the adjustment of the required nutrient levels are given in Table 1. Organic fertilizer was not applied in the experimental site in the last 24 years.
In 2019, we carried out an extended soil test in the area (Table 2). The results showed the soil characteristics for four nutrient levels in different soil depths. The meadow chernozem soil had a humus content of 2.07%–2.32%, a slightly alkaline reaction of pH = 7.5–7.7, and a liquid limit between 39.9 and 43.15. Of the macroelements, nitrogen was 11.9–17.44 mg kg−1, phosphorus was 167–409 mg kg−1, potassium was 197.4–336.1 mg kg−1, and zinc was 0.8–1.6 mg kg−1. The uptake of zinc by the plant is strongly influenced by the liquid limit, pH value, and the amount of macroelements in the soil [33,34]. The Zn content in the soil generally ranges between 10 and 300 mg kg−1 with a global mean value of 50 mg kg−1 [35]. The zinc content of the soil depends on the amount of organic matter in the soil. Hungarian sandy soils have 30 mg kg−1 zinc in concentration, while in chernozem, the zinc content can reach 150 mg kg−1 [36]. Under these conditions, the value of zinc was below the limit value, so in the experiment, foliar treatments were designed to add microelement zinc.
Both varieties were sown with a parcel sowing machine (Wintersteiger Plotman) on the 18th of October in 2020 and the 19th of October in 2021. Before sowing, the fields were ploughed at a soil depth of 30 cm, and the seedbed was pre-prepared with a combinator.
Plots of wheat were treated with fungicide (azoxystrobin) and insecticide (alpha-cypermethrin) in a dose of 0.7 L per ha in the BBCH 24–26 growing stages in both years. In the growing stages of wheat, BBCH 47–49 plots were treated with insecticide (gamma-cyhalothrin) in doses of 0.08 L per ha. The first herbicide treatment was a pre-emergence treatment with pendimethalin in October. The next treatment was carried out in the growing stage of wheat in BBCH 21–25 with early post-emergence herbicide (bentazon). Irrigation was not used in the experiment.

2.2. Treatments

In the experiment, 4 treatments were carried out as follows: a control treatment without foliar fertilization and three treatments with monozinc foliar fertilization. Zinc foliar fertilizer is an aqueous solution that contains concentrated zinc sulfate heptahydrate of 12% (120 g Zn per L) in dissolved form. The application was carried out with a Wintersteiger plot sprayer in three different doses in two growing stages of the wheat. The first monozinc treatment was applied at a dose of 1 L ha−1 and the second monozinc treatment at a dose of 2 L ha −1. These treatments were applied at tillering (BBCH 21–22). The third monozinc treatment was applied at a dose of 1 L ha−1 at tillering (BBCH 21–22) and flag leaf emergence (BBCH 37) (Table 3). We tested two winter wheat varieties: Zvezdana, a middle-aged variety, bred in Novi Sad, in winter of favorable weather conditions; Gk Pilis, an early maturing winter wheat variety of high yield and good quality. These varieties were investigated in different growing periods.
Harvesting was carried out with a Wintersteiger-type plot combine on the 9th of July 2021 and the 1st of July 2022 in the stage of late ripening. The wheat harvested by the combine was collected in bags and the yield per plot was determined using a digital scale.
Figure 1 shows the average precipitation and temperature. The figure shows that the area received much less precipitation in 2022 than in 2021. The distribution of precipitation was unfavorable in the stage of emergence (October) and also in the stages of tillering and ripening (March–June). Compared to 2021 (404 mm), 30% more precipitation fell in the growing season than in 2022 (279.5 mm), which had a major impact on the development of wheat.

2.3. Measurements with SPAD-502 Meter

Leaf chlorophyll concentration was measured with the SPAD-502-type chlorophyll meter in the field, once a week after flag leaf elongation until maturity (Table 4). Chlorophyll absorbs light of different wavelengths to different extents. Light absorption peaks in the range of blue and red wavelengths. Since radiation extinction is low in the ranges of green and yellow, it is practically zero in the infrared range. It is therefore advisable to choose the infrared range as a reference value and use either the blue or the red range for measurement. The SPAD-502 device uses red light for measurement, as its absorption is not affected by the carotene content of the leaf. The calculation is based on the ratio of the intensity of infrared and red light passing through the leaf. This ratio is higher; more red light is absorbed in the leaves of the plant, which is closely related to the chlorophyll concentration. Its value can range from 0 to over 100 (Minolta Camera Co. Ltd., Osaka, Japan, 1989).

2.4. UV Spectrophotometric Measurement of Chlorophyll Concentration

Leaf samples were collected immediately before treatments with foliar fertilizer, and two weeks after the treatments. Chlorophyll concentrations were determined with spectrophotometry according to [37]. Samples of 0.2 g of each plant were mixed with 15 mL of acetone of 80%. The crude extract was centrifuged at 1500× g for 5 min. A stock solution of acetone of 80% was used to read the absorbance at 663.2 nm and 646.8 nm with a Shimadzu UV mini-Model 1240 spectrophotometer. The calibration curve formula using acetone aqueous solution of 20% is as follows:
Chlorophyll a (Ca), µg mL = 12.25 A663.2–2.79 A646.8,
Chlorophyll b (Cb), µg mL = 21.50 A646.8–5.10 A663.2,
The concentrations of Chl a (Ca) and Chl b (Cb) were calculated with the above equations for the different solvents, in which the concentrations of pigment are given in µg/mL.

2.5. Statistics

Statistical data were evaluated with the four-factor MANOVA analysis of variance using SPSS v.27 (SPSS). The probability level was p = 0.05 as accepted in agricultural practice. Bivariate trait relationships were summarized with Pearson’s correlation.

3. Results

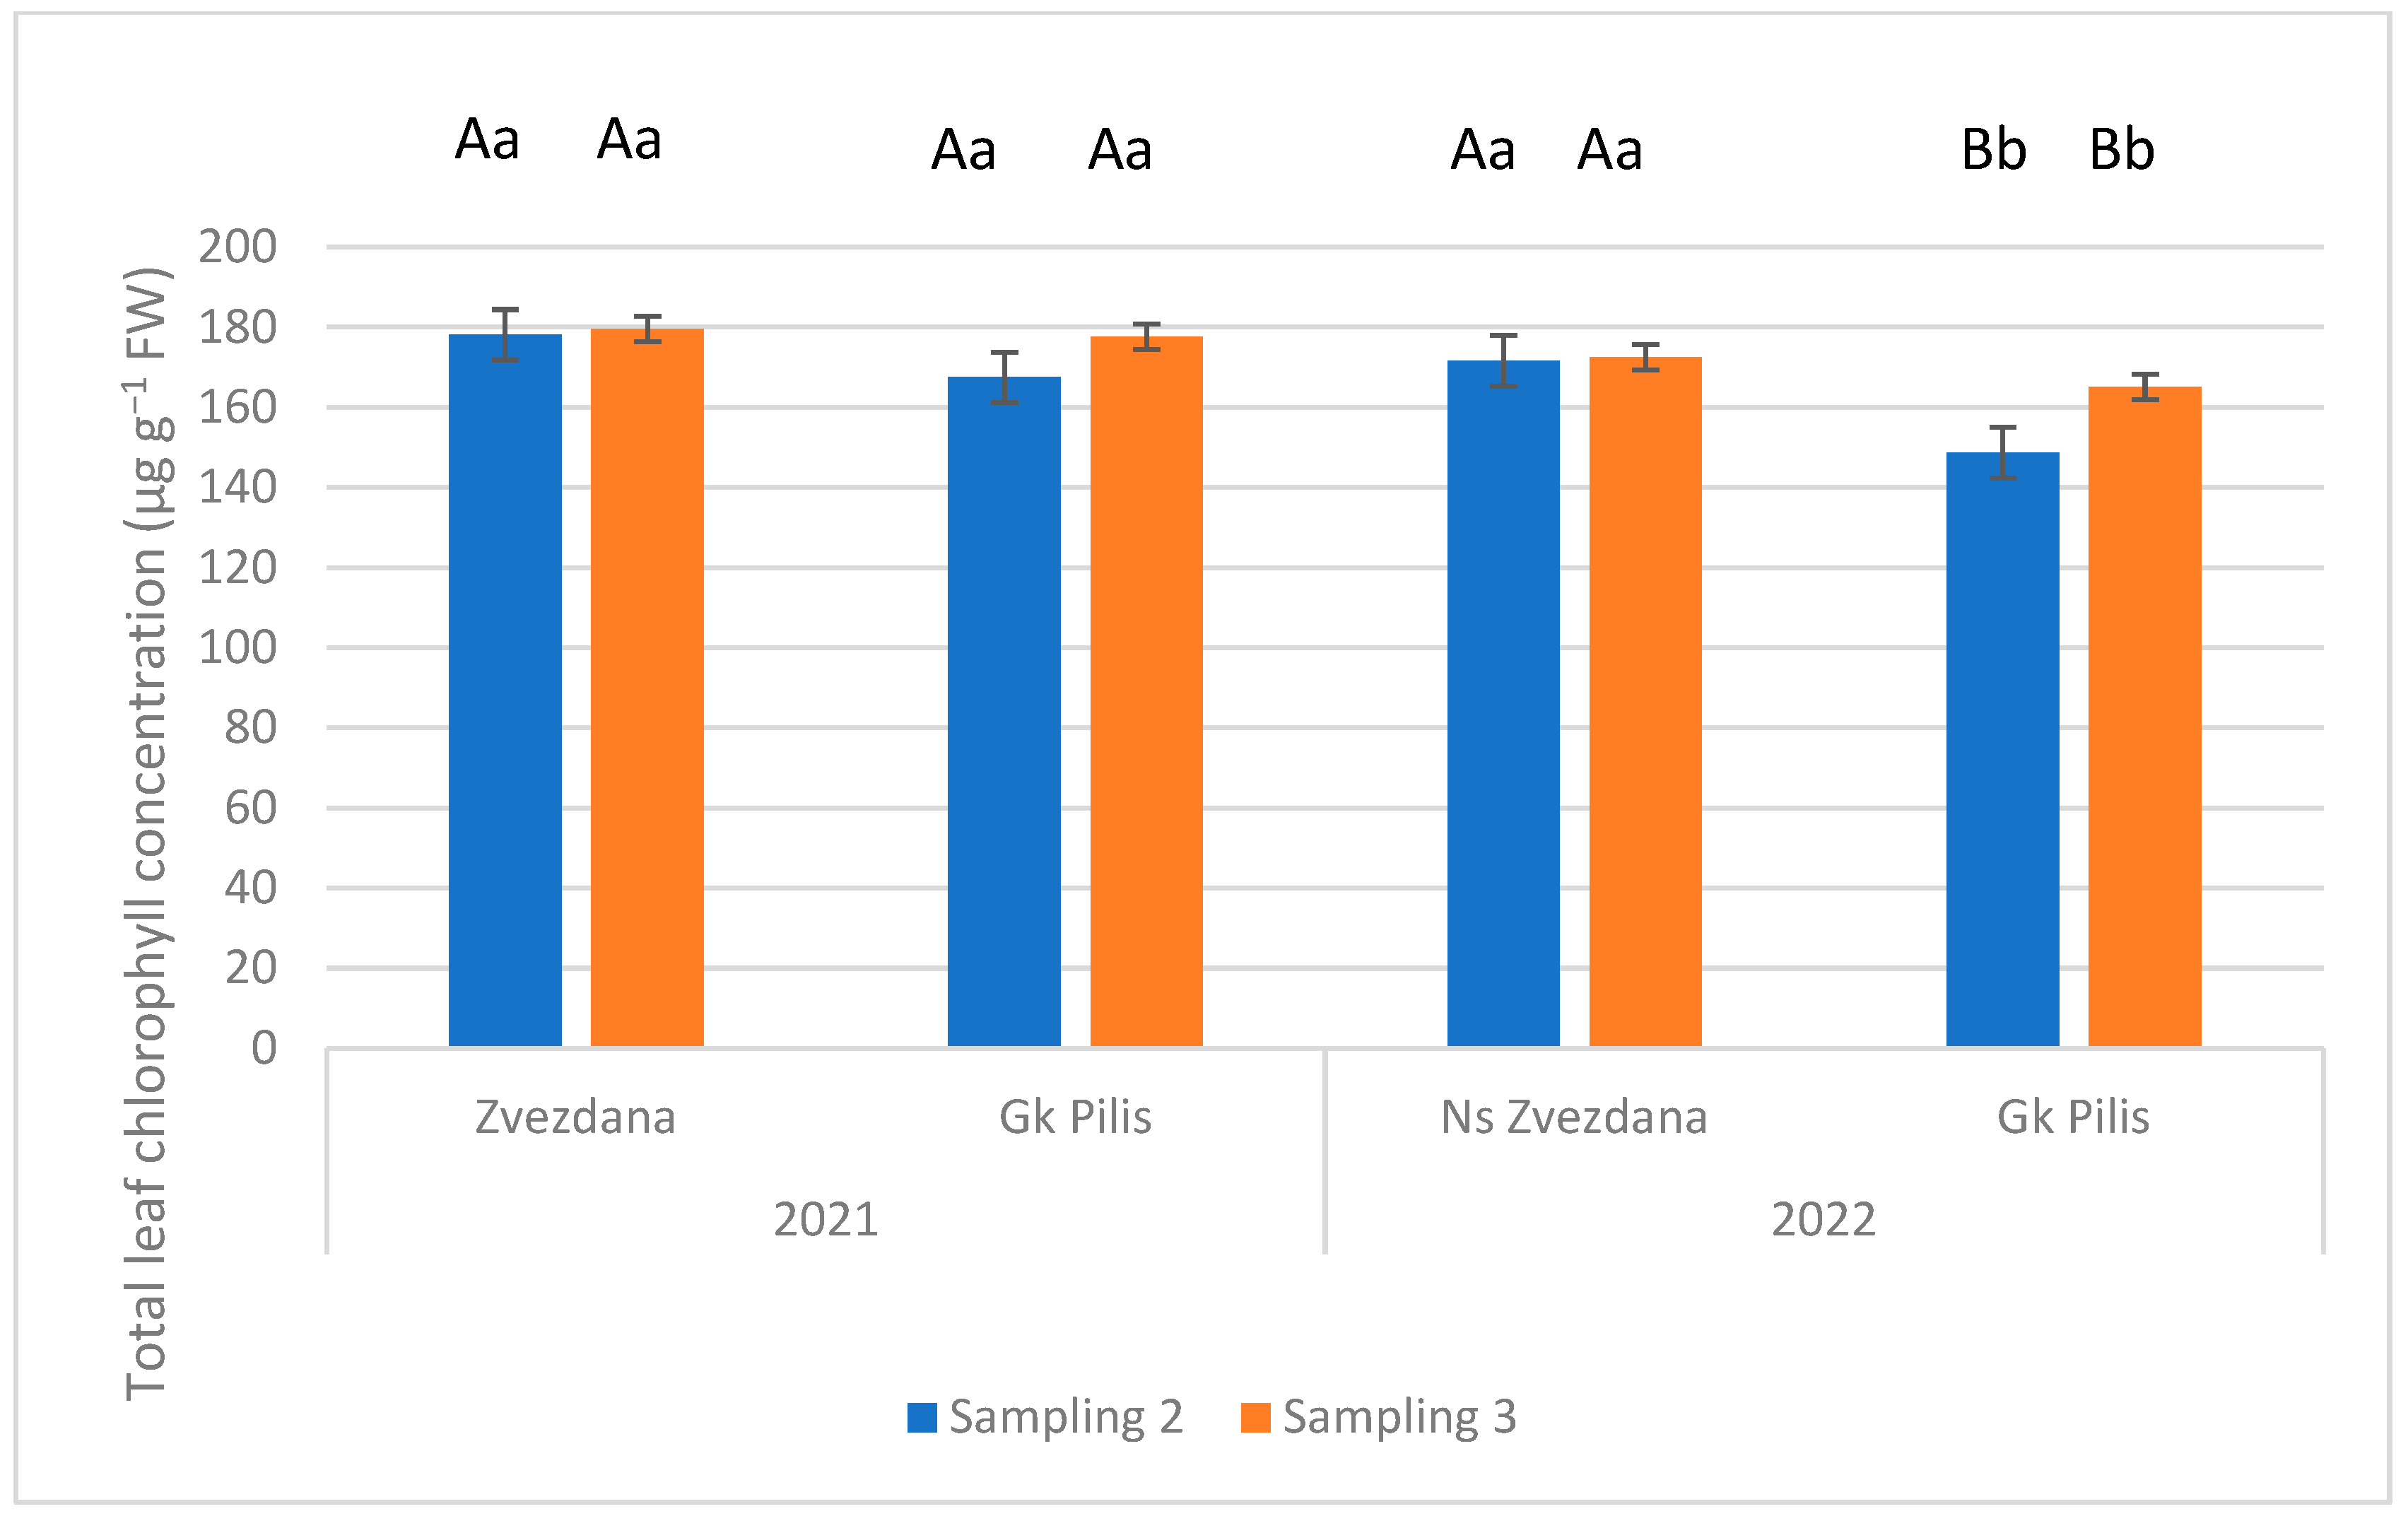
3.1. The Effect of Zn Treatments to Chlorophyll Concentration

Figure 2 shows the total leaf chlorophyll concentration by treatments and nutrient levels (dates of sampling have been given in Table 3). In 2021–2022, the total leaf chlorophyll concentration of Zvezdana was 0.8% and that of GK was 5% between the second and third samplings. In 2021–2022, the difference was 0.4% for Zvezdana and 9.9% for GK Pilis. In the vegetation period of 2021–2022, there was no significant difference between the varieties except for GK Pilis.
Table A1 in Appendix A shows the total leaf chlorophyll concentration in the years of research. In 2021, the results of the third sampling show that the chlorophyll concentration of nutrient D increased statistically significantly only in the third treatment. Treatments of nutrient level C were most effective. A higher chlorophyll concentration of 38%–130% was measured in the treated plots compared to the control plot. In 2022, the zinc treatment of nutrient level B was most effective with a significantly higher chlorophyll concentration than in the control plot at both sampling times (51%–80% at the second sampling time and 21%–40% at the third sampling time). Table A2 in Appendix A shows the total leaf chlorophyll concentration of Zvezdana in the two years of the study. Significant differences between the treatments were found only at nutrient level A after the second sampling in the year of 2021. A higher chlorophyll concentration of 9%–45.5% was found in the control plots than in the treated plots. At the same nutrient level, the result was not clear at the third sampling, and the lowest chlorophyll concentration (145 µg g−1 FW) was found in the control plot. In 2022, significant differences were found between the treatments at nutrient levels B, C, and D, and with treatments having positive effects only at nutrient level D. There was a difference of 31%–127% between the control and the treated plots after the second sampling.

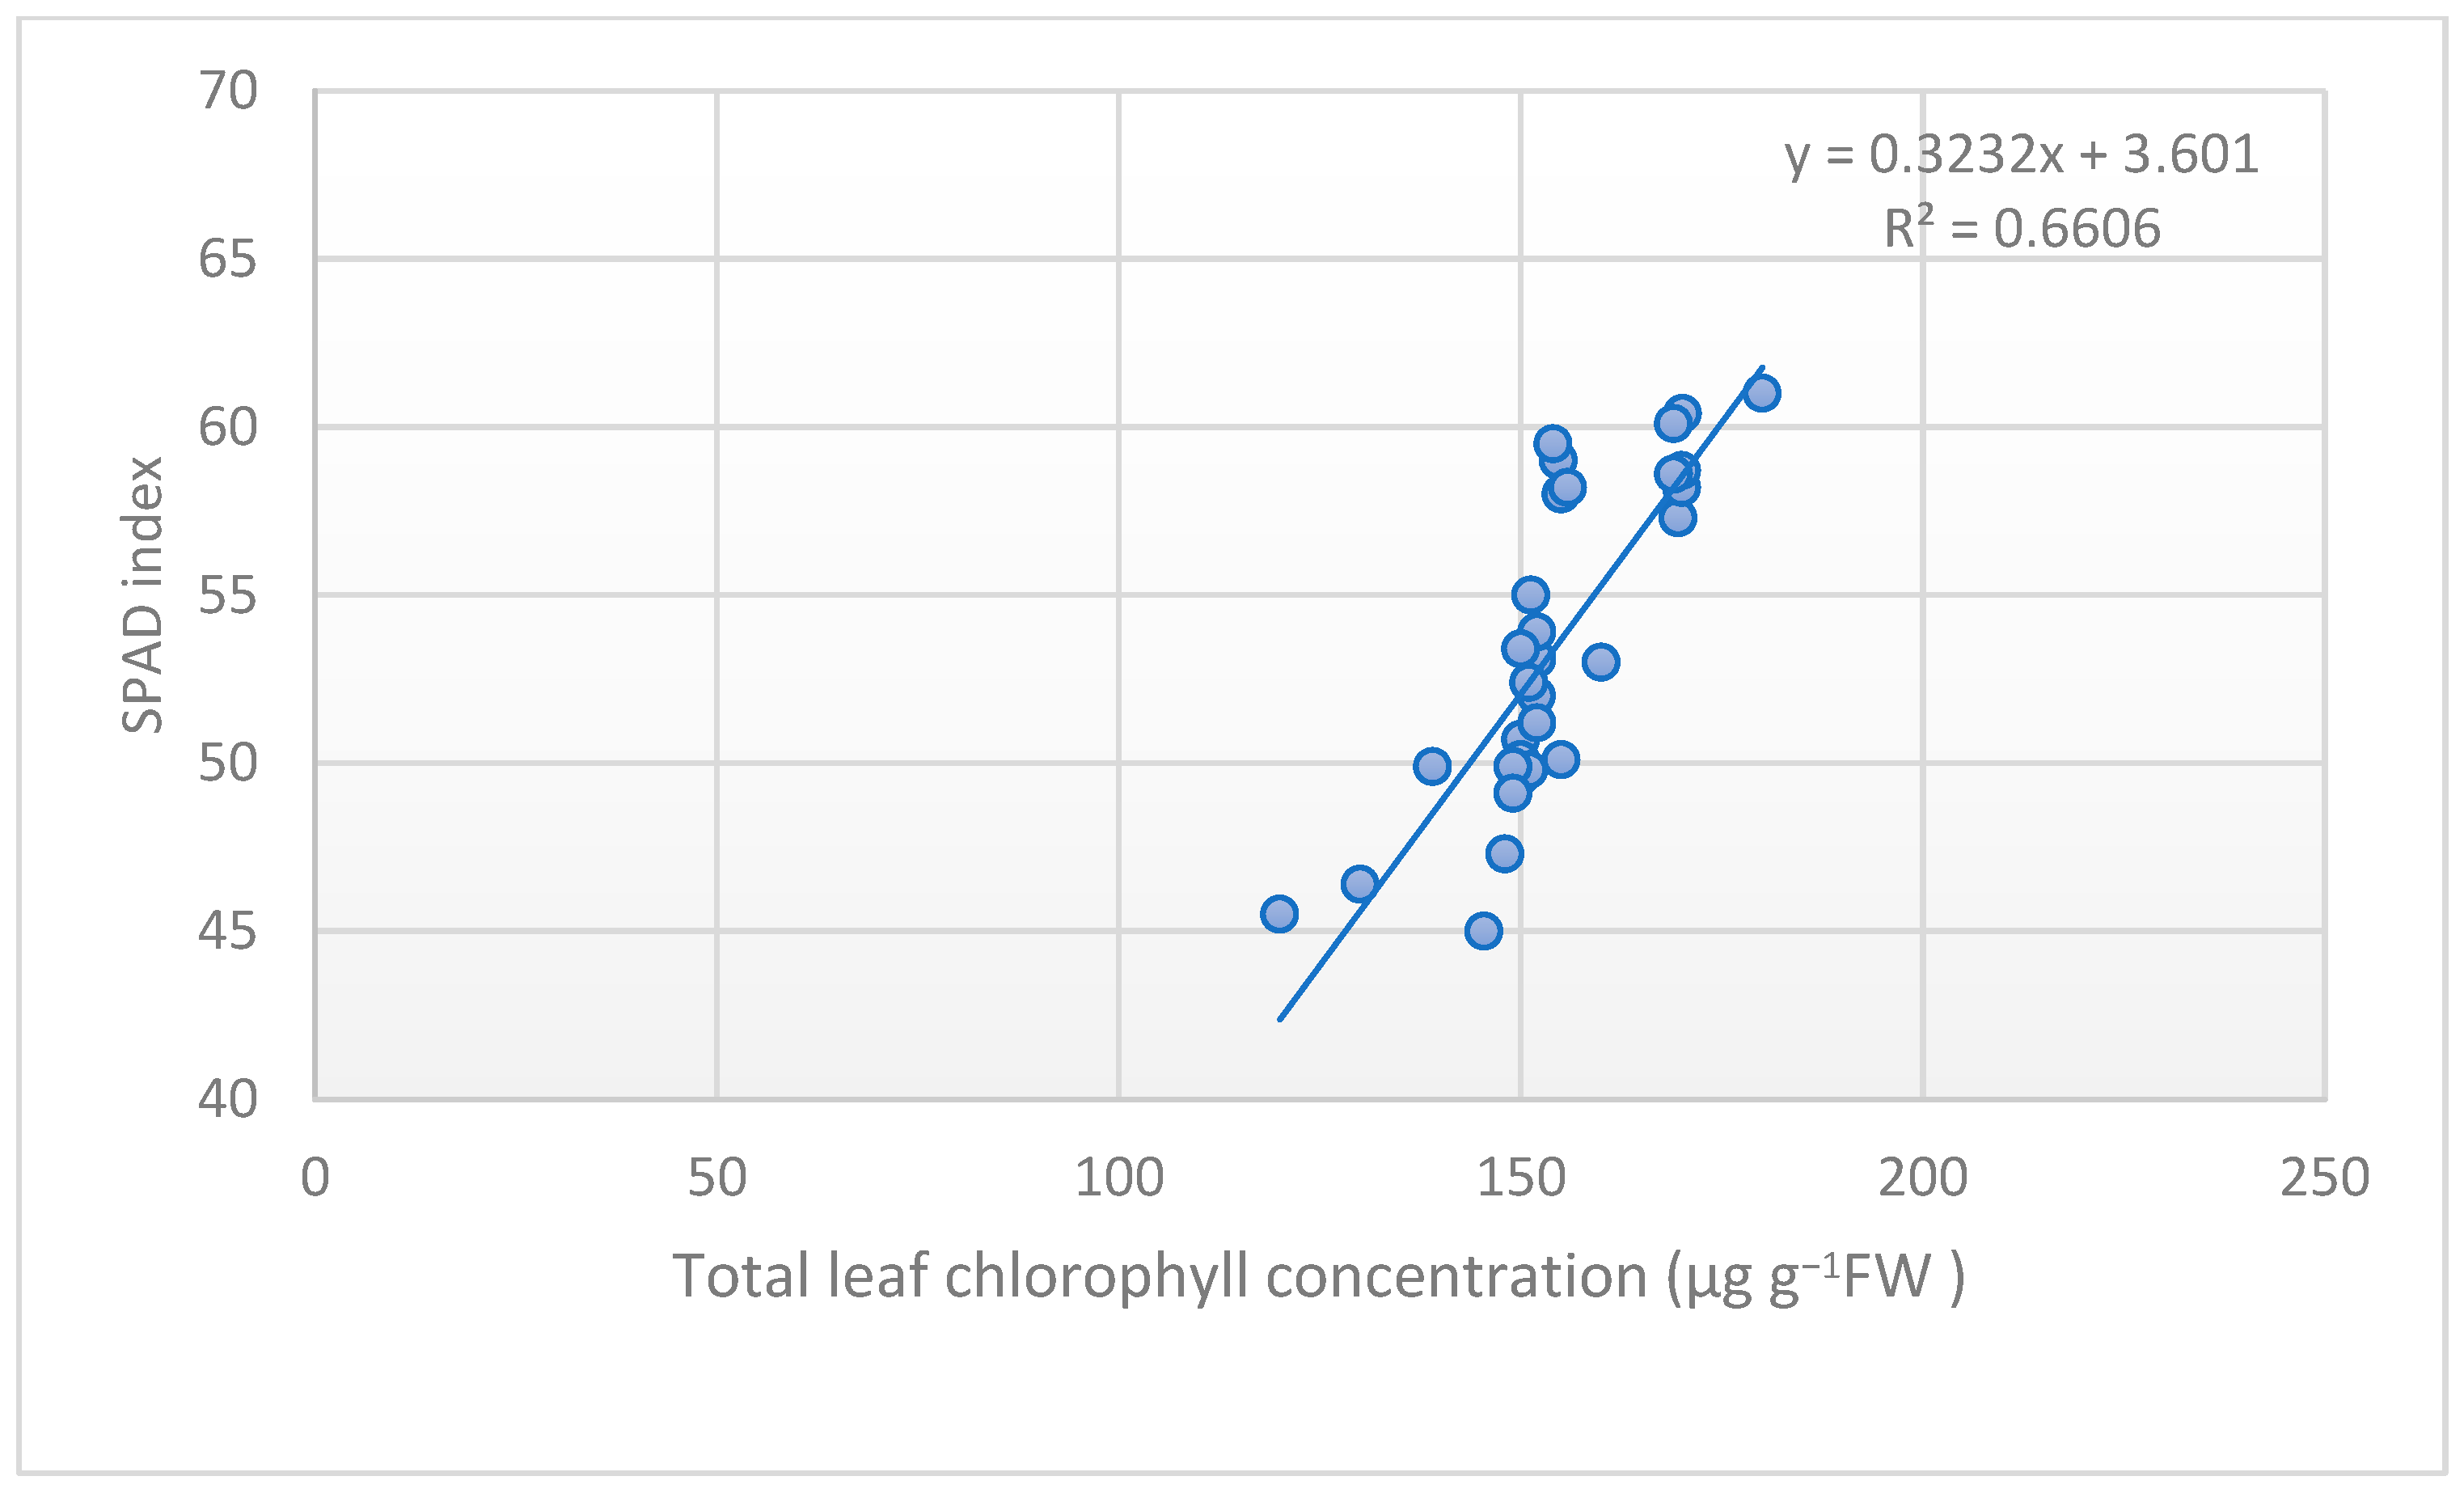
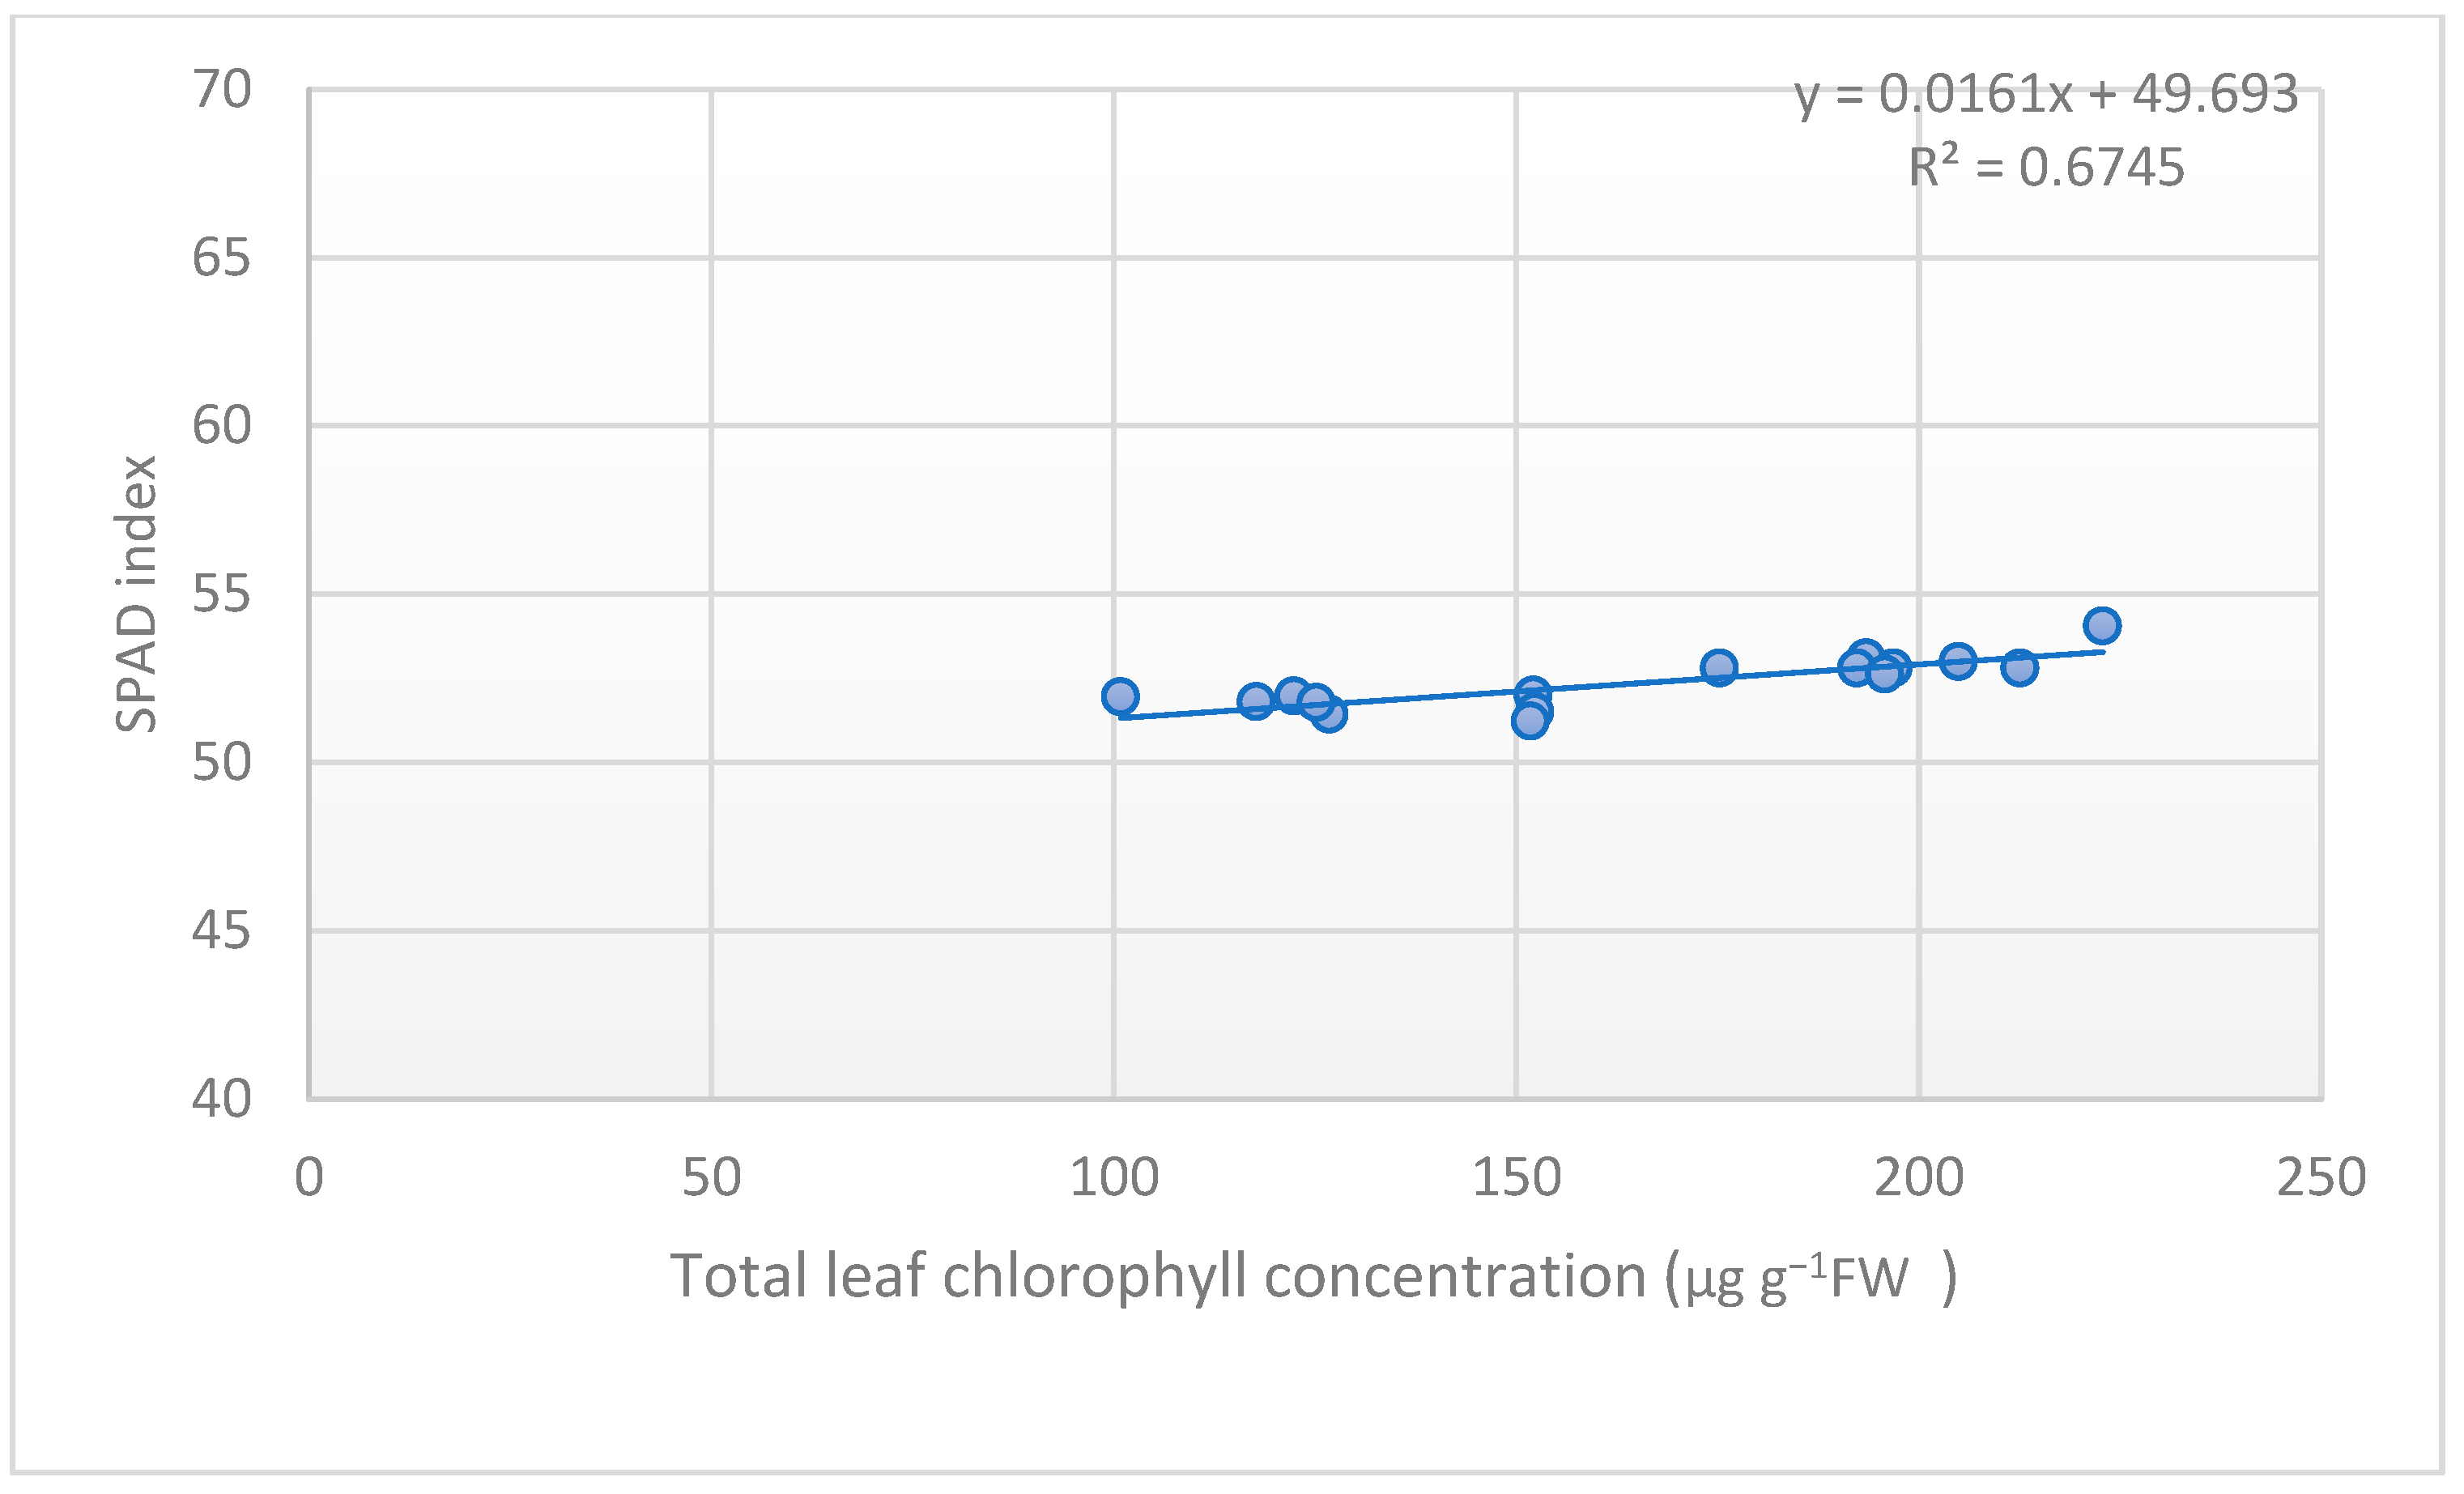
3.2. Results of SPAD Tests

SPAD test results were compared with the results of our simultaneous chlorophyll measurements at the time of flag leaf emergence (BBCH 65–69). Sampling times are shown in Table 4. A positive correlation was found between the total leaf chlorophyll concentration and SPAD index in both years (r = 0.81, p < 0.05), as seen in Figure 3 and Figure 4.
We compared the results of SPAD tests in both years. The difference between the two measurements is noticeable. Figure 5 shows the minimum value for both varieties measured in the first measurement and the maximum value in the fourth measurement in 2021. Table 4 shows the sampling dates. The difference between the two varieties was 2.4–2.9%. The minimum value in the first measurement and the maximum value in the third measurement showed a difference of 0.4–1.1% in 2022 (Figure 6). The values of GK Pilis were highest in both years, except for the values in the last measurement. In the fifth and sixth measurements, the values of Pilis decreased, showing a difference of 7.4% between varieties in the year of 2021 and a difference of 2.5% in the year of 2022.

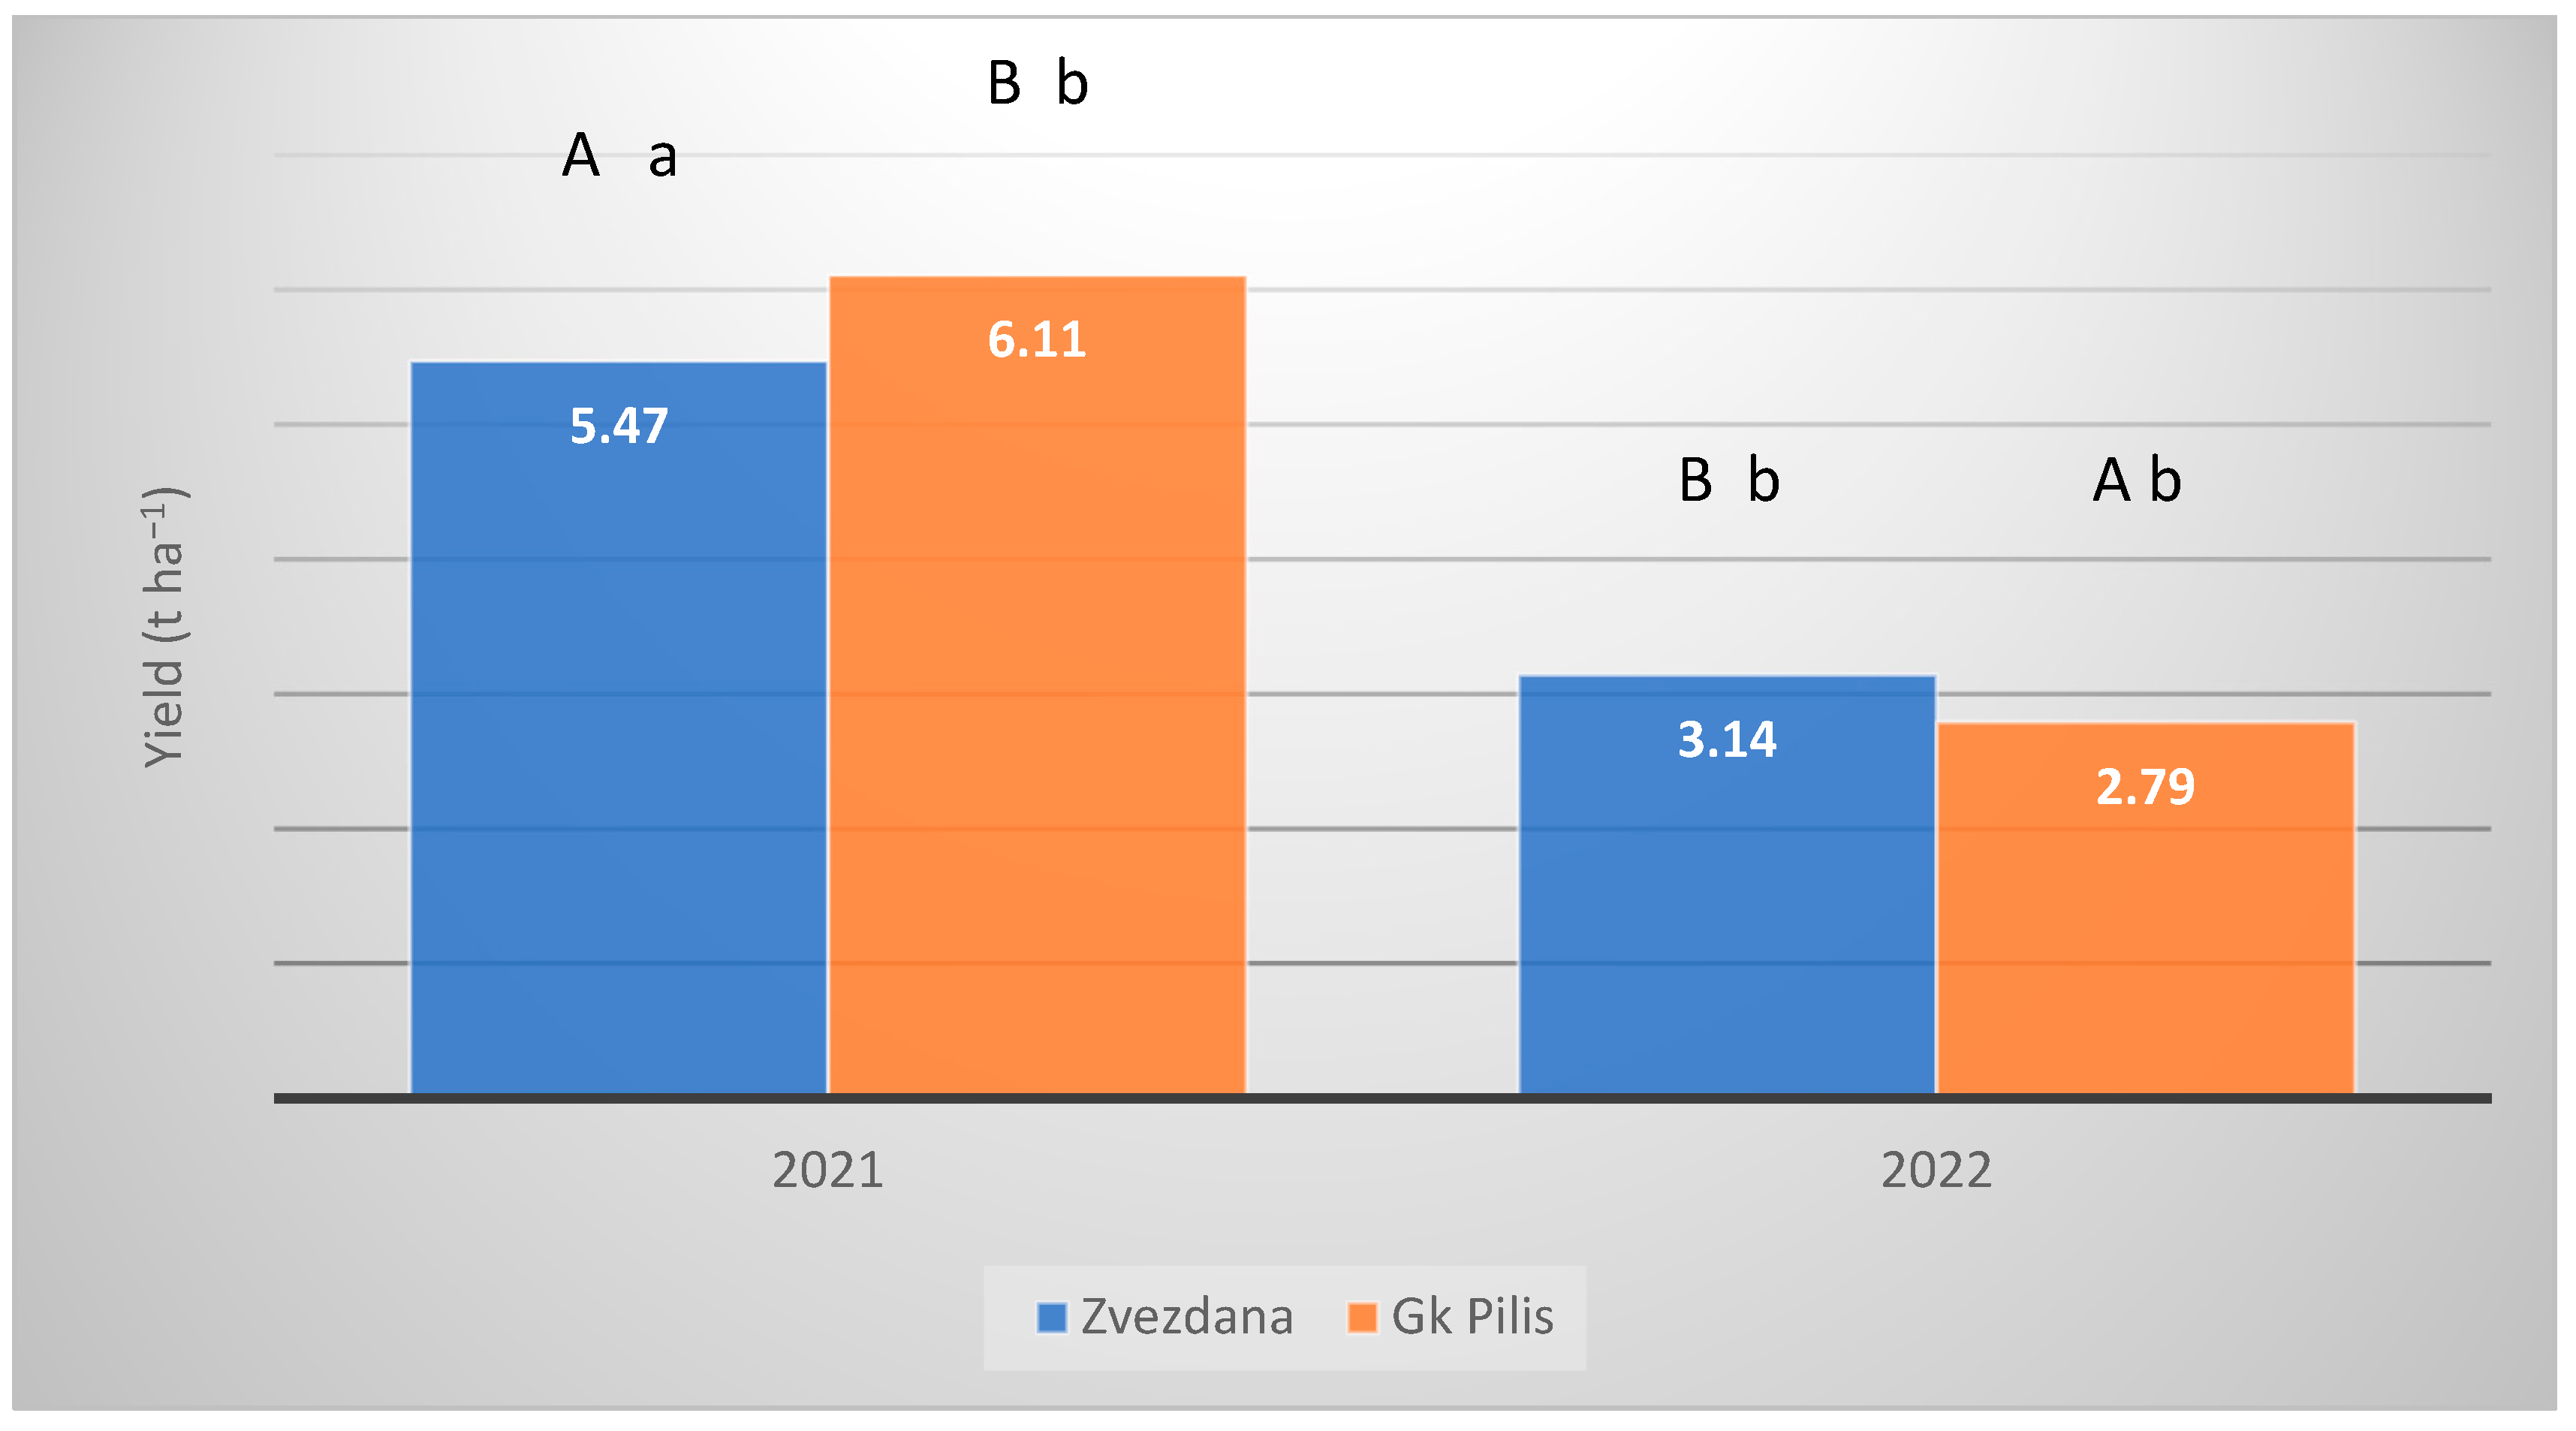
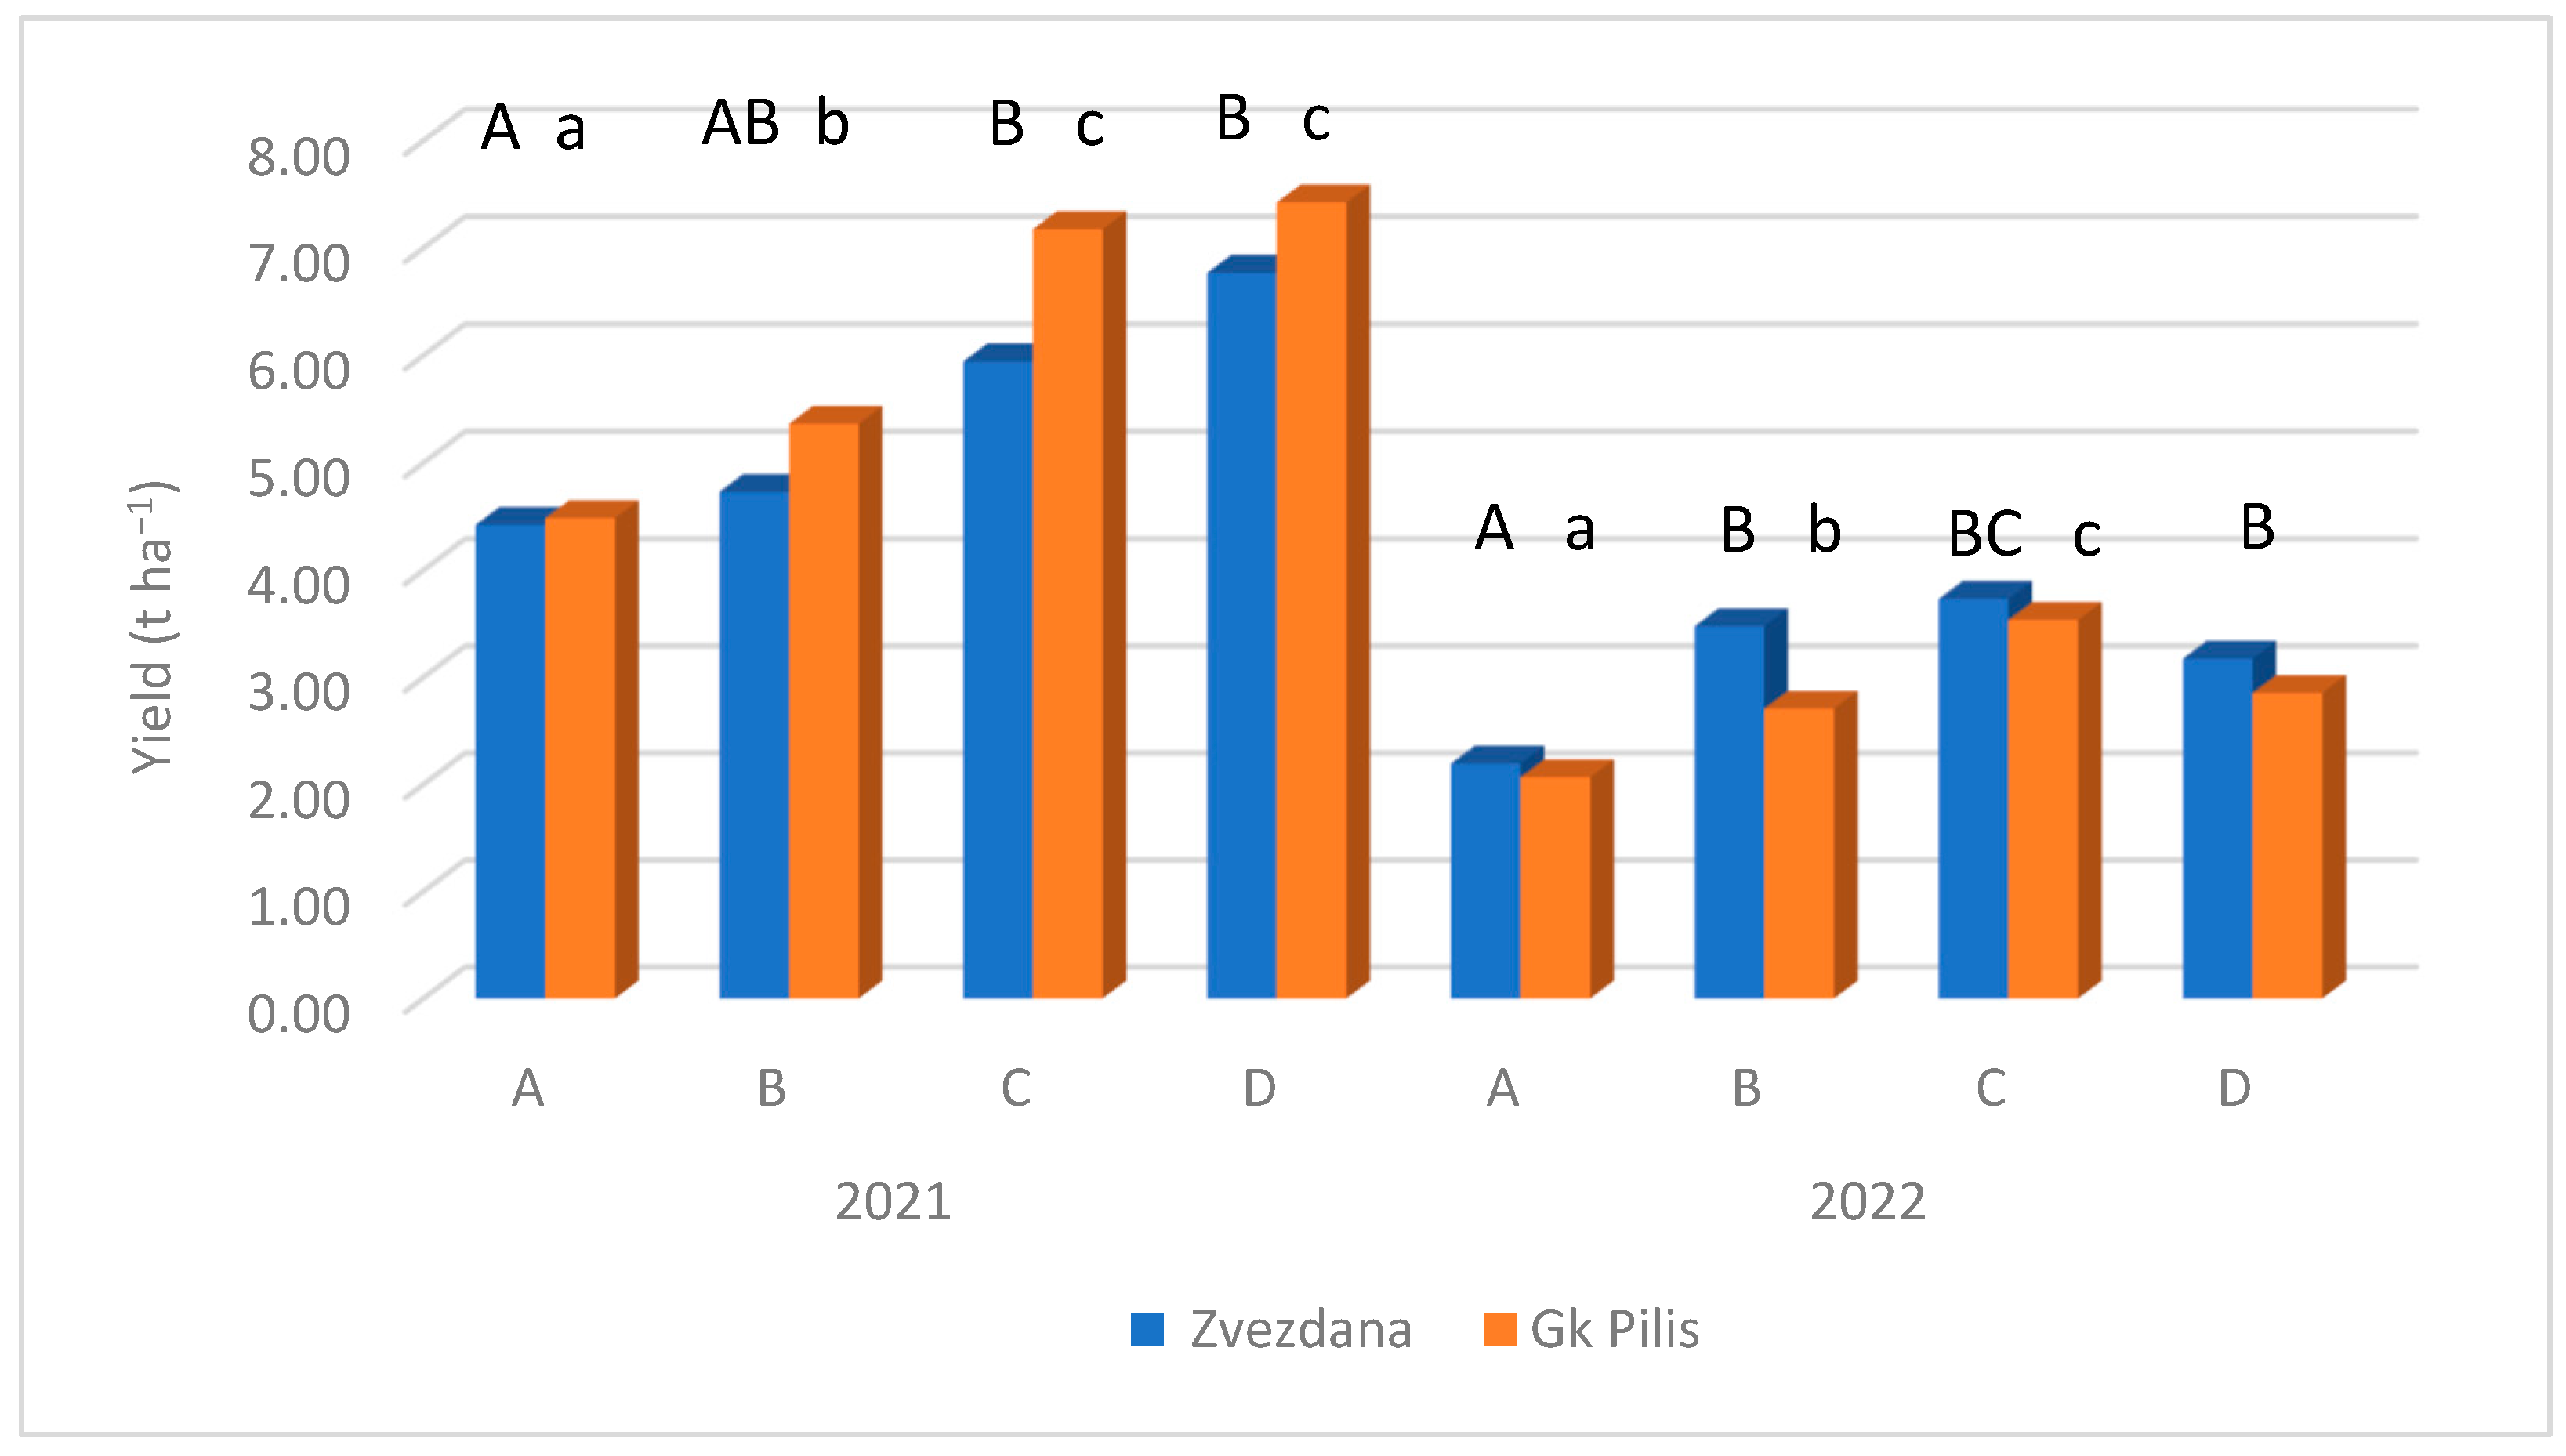
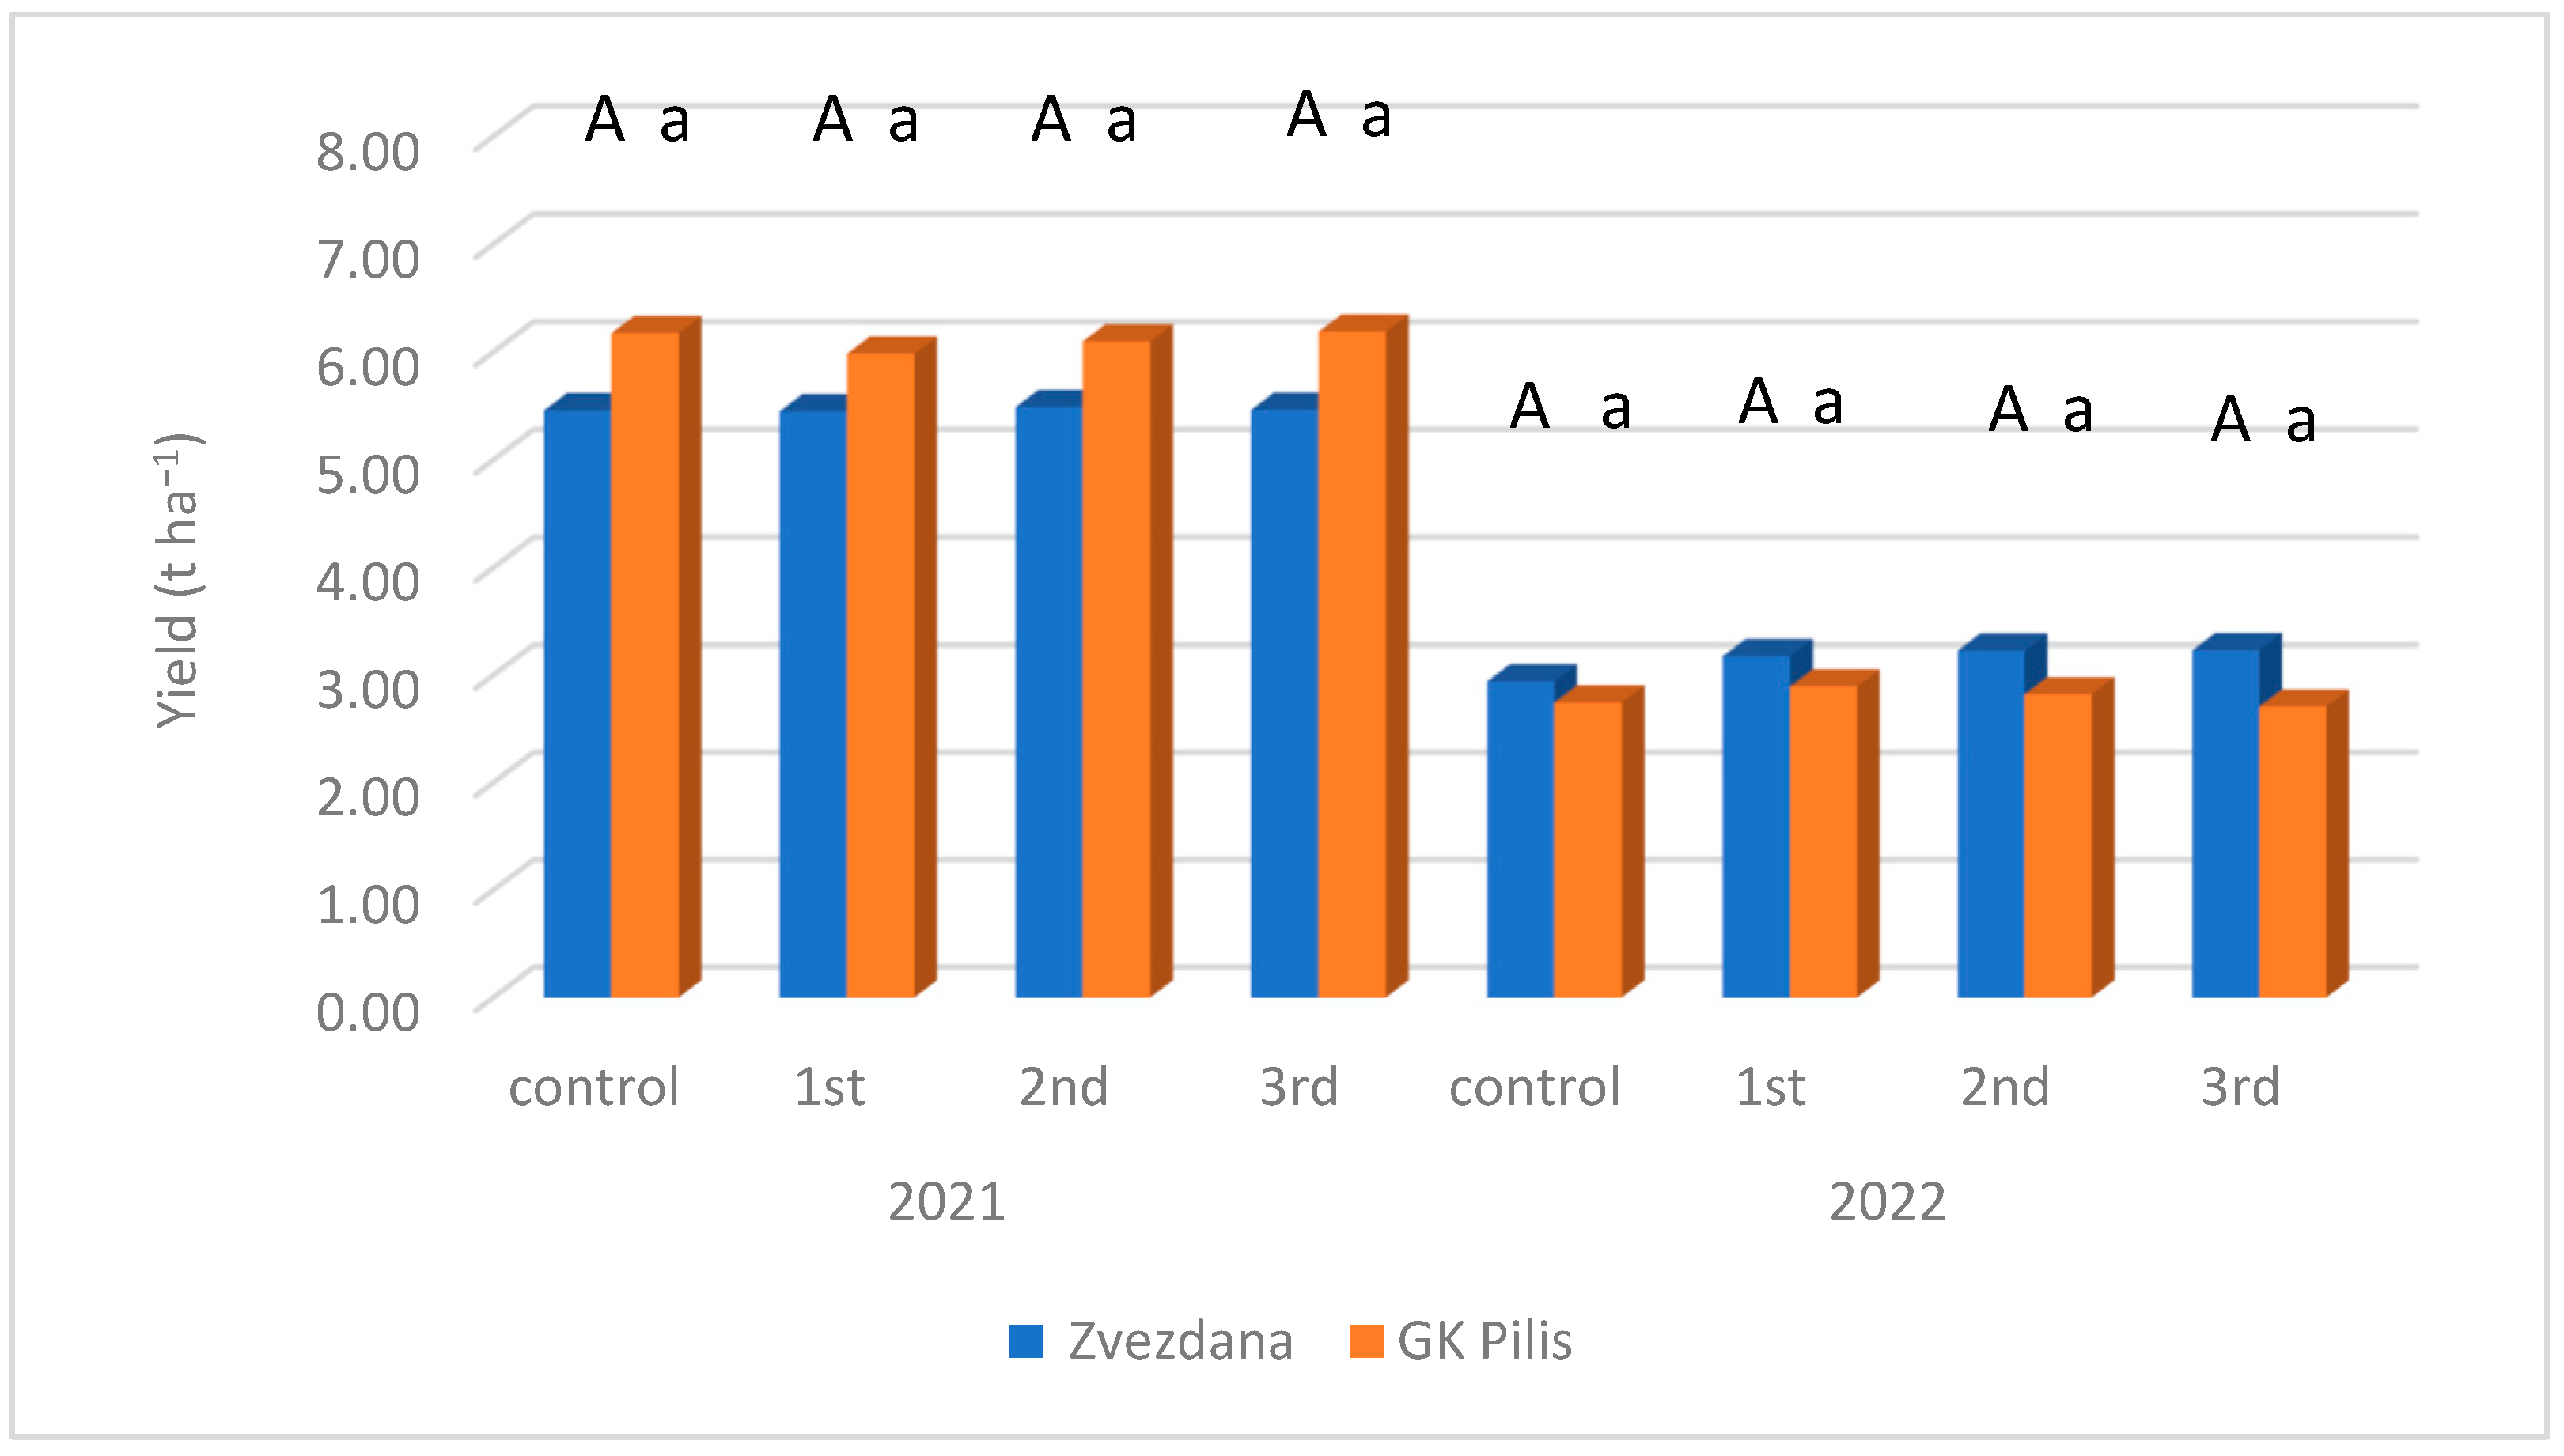
3.3. Effects of Different Nutrient Levels and Foliar Fertilizer Treatments on Crop Yield

In 2021, significant differences were found in the yields between the varieties of Zvezdana (5.47 t ha−1) and Gk Pilis (6.11 t ha−1) compared to 2022, when the differences were smaller than in 2021 (Zvezdana 3.14 t ha−1, Gk Pilis 2.79 t ha−1). No significant difference in yields was found between the two years (Figure 7).
Figure 8 shows the relationship between yields and higher fertilizer doses. The lowest yield was measured at nutrient level A (Zvezdana 4.42 t ha−1, GK Pilis 4.49 t ha−1). The yield of both varieties increased with the rise in doses of the fertilizer. While Zvezdana increased to a lesser extent (6.7%, 34.4%, 53%), the yield of GK Pilis increased to a greater extent (19%, 60%, 65.4%). Significant differences were obtained between the two higher (C, D) and the two lower (A, B) nutrient levels, but the expected increase in yields could still be observed. In 2022, even at nutrient level D, we harvested on average twice as much as in 2021 at nutrient level A. In 2022, even at nutrient level D, we harvested on average twice as much as in 2021 at nutrient level A. Nutrients could not be utilized, as shown by the smaller differences in yields between nutrient levels B, C, and D (Zvezdana: 58%, 70%, 44%; GK Pilis: 23%, 53.6%, 28.7%).
No significant effects between the foliar fertilizers were found for the main averages (Figure 9) in 2021. The first treatment resulted in a grain yield reduction of 3% for GK Pilis and the second treatment in a grain yield reduction of 1.2% for Zvezdana. After the second and third treatments, grain yield reductions were 0.1–0.5%. Although there was no significant difference in terms of the main averages, foliar fertilizer was found to be effective in the second year.
We marked the significance between varieties with a capital letter and between treatments with a normal letter. Significant differences between varieties are marked in capital letters and significant differences between treatments are indicated in normal-sized letters and with a sign *.
Table 5 shows the total grain yield and the interactions between treatments and nutrient levels in the two years under challenge. The effectiveness of the applied dose depends on the nutrient levels and varieties. As shown, individual nutrient levels were not significantly influenced by the treatments in any year. Only nutrient level C of Zvezdana shows that zinc treatments resulted in yields 2.2%–6.2% higher than the control plot in 2021. All nutrient levels of Zvezdana resulted in higher grain yields compared to the untreated control (from 5.3%–9.2%) in 2022. In the same year, except for nutrient level D of GK Pilis, smaller yields were found in the untreated plots (6.9%–18.1%).
Statistical values of correlation show that the relationship between chlorophyll and grain yield depended on the year and variety. Figure 10 shows a weak correlation (r = 0.33, p < 0.05) between the total chlorophyll concentration of leaves for Zvezdana in the year of 2021, and a medium correlation for GK Pilis (r = 0.67, p < 0.05) (Figure 11). In the year of 2022, a strong correlation (r = 0.81, p < 0.05) was found for Zvezdana (Figure 12), and a weak correlation for GK Pilis (r = 0.44, p < 0.05) with grain yield and chlorophyll concentration (Figure 13).

4. Discussion

Marquard and Tipton [38] found a significant correlation between chlorophyll concentration and SPAD values for several maize hybrids. A high correlation was also found between N concentration and SPAD index by Tian et al. and Uchino et al. [39,40]. Glynn [41] compared the SPAD values of total chlorophyll and carotenoid content, leaf N content, and leaf photosynthetic efficiency of Sycamore (Acer pseudoplatanus), English Oak (Quercus robur), and European Beech (Fagus sylvatica). He found high correlations for all parameters, except between total chlorophyll concentration and SPAD, regardless of varieties. Our results showed a moderate correlation between the total chlorophyll concentration of the cultivars and the SPAD index in the same stages of growth of wheat (BBCH 65–69) in both years studied. The values were suitable to determine the ripening of the cultivars. The values of SPAD increased with the rate of plant and leaf growth and they began to decrease at maturity, just as was found by Kandel [42], who had the same results in the study of maize (Zea Mays). Our measurements also supported Ilze [43], who used a SPAD device to determine the ripeness of winter wheat. During his tests, he measured the maximum values obtained with SPAD at the end of the period of winter wheat flowering. The measurements were carried out from May to June. In these two months, there was a total of 81 mm of precipitation in 2021, and 59.5 mm in 2022. Much less rain fell in both areas compared to the averages of the last 30 years (137 mm). The lowest values were observed on the first measurement date (51.46; 52.9) and the highest values on the fourth measurement date (60.43; 58.93) for Zvezdana in both years. Also, GK Pilis had the lowest SPAD value on the first measurement date in both years (44.57; 44.77) and the highest in the third year (53; 53.61). All measurements were carried out in the flowering stage of BBCH 61–65 for both cultivars.
Comparing the results of the two years, a difference was found in the average of treatments and nutrient levels between the two tested varieties. For Zvezdana, differences of 3%–10% were found in the two years. For GK Pilis, the results were very similar in 2021 and in 2022. The growth in the vegetation period of the year under study was mainly influenced by weather factors, which were statistically confirmed during the evaluation. In the year 2020–2021, the temperature and precipitation distribution were both favorable after sowing. The average temperatures in October and November were 12.5–5.70 °C, and the total precipitation in the two months was 111.3 mm. Leaf emergence was uniform; nothing hindered the utilization of the fertilizer applied in the fall. On the other hand, at the time of leaf emergence at the end of October in the year 2021–2022, the temperature was 10.4–6.2 °C and only 47.5 mm of precipitation fell, which was almost half of the 30-year average (82 mm). Treatments and sampling were carried out in March, May, and June in both years. In 2021, 30 mm of rain fell in March and April, and 70 mm in May. In 2022, 0.5 mm of rain fell in March, 35 mm in April, and 38.1 mm in May, significantly less precipitation compared not only to 2021 but also to the 30-year average in the region (30 mm, 31 mm, 61 mm). As a result, it can be concluded that in the growing season of 2021/2022, there was an extreme drought, which is also reflected in the yield. Our findings confirmed the results of Debreczeni and Debreczeni B. [44], who found that the lack of water in the reproductive phase caused large crop losses. In addition, several other studies such as Ágoston and Pepó [18] proved that the variety used significantly determined the yield. Árendás et al. [45] concluded that the quantitative and qualitative parameters of the crop were primarily determined by the biological-genetic properties of the cultivated varieties and by the nutrient supply capacity of the soil. Therefore, it makes sense to determine the quantitative and qualitative values of the nutrient supply not only for the plant culture but also for the variety. The yield of the varieties studied was found to be different in both years. While GK Pilis performed better in 2021, Zvezdana performed better in 2022, which shows Zvezdana’s better adaptability.
In Hungary, Pollhammerné [46] conducted successful experiments with copper and zinc fertilization in order to improve the quality of winter wheat. Pecznik [47] also used copper and zinc compounds in his experiments and proved their beneficial effect on quality. Rose and others [48] investigated the effect of the basic zinc carbonate complex on winter wheat. Their experiments proved that zinc positively influenced both the yield and the quality parameters of winter wheat. In Turkey, the studies of İlknur [49] showed that the administration of increased doses of zinc had a favorable effect on the content parameters of wheat, and its bakery values improved especially. A similar result was obtained by Peck et al. [50]. In their research, they found that zinc foliar fertilization influenced the amount of wheat protein. Thorne [51] concluded that although phosphates act against the solubility of zinc in the soil, it is doubtful that the Zn deficiency could be explained by direct Zn precipitation by phosphates.
Correlations were found between yield and chlorophyll for years and cultivars. In 2021, the correlation was low in both cases. In 2022, we obtained small to medium correlations. Recent studies suggest that the diffusive limitation through stomatal closure and the nonstomatal limitation (such as oxidative damage to chloroplast) are responsible for the decline in photosynthesis under the stress of drought [52]. In the study of different drought-tolerant durum wheats, it was proved that the relative chlorophyll concentration of the tested variety decreased in the later stages of ontogenesis as a result of drought [53]. Several authors have found that chlorophyll synthesis depends on mineral nutrition [54,55]. Several other studies have shown that the presence of N delays the ageing process of leaves [56,57]. High N levels can delay senescence [58,59,60,61], as the sink demand may be satisfied to a higher extent from stored inorganic or organic nitrogen, allowing higher levels of ongoing photosynthesis. Comparing the results of two years, we examined the chlorophyll concentration of GK Pilis and Zvezdana. First, we compared the results of the second and third sampling times. In both years, four weeks elapsed between the two measurements. In all cases, the chlorophyll concentration in the plant increased as the vegetation progressed. It was also noticeable that the chlorophyll concentration of Zvezdana was higher in both years. Compared to the first year, the chlorophyll concentration decreased by 3.7% for Zvezdana and 9% for GK Pilis. Measurements were taken on 25 April and 26 May 2021, and the average rainfall was 30.4 and 70.6 mm, respectively. In 2022, sampling took place on 26 April and 23 May, and the average rainfall was between 35 mm and 38.1 mm. As a comparison, the average amount of precipitation in the last twenty years was around 36 mm and 61 mm in these months. The average total chlorophyll concentration suggests that GK Pilis was more sensitive to less precipitation.
The treatments had different effects on the four nutrient levels in both years. In most cases, treatments either had no effect on chlorophyll content or reduced it. The results did not confirm that zinc treatments of different doses had significantly positive or negative effects on the total chlorophyll concentration of winter wheat in the years of the study. However, the results showed that the treatments exerted different effects at different fertilizer doses, and differences were also observed between varieties. In order to be able to find more conclusive evidence about the interaction of zinc and macroelements, the vintage effect and the chlorophyll concentration must be compared over a period of several years. We were lucky in the experiment because the average rainfall in the two years of research was different; thus, the vegetation of a normal and an extreme year could be compared, but this fact prevents us from drawing clear conclusions.

5. Conclusions

Foliar fertilizers containing trace elements can play an important role in modern agricultural practices, because they have been shown to have positive impacts on crop physiology and productivity. Although micronutrient supplementation has already been investigated, the results are still unique in long-term and monocultural experiments.
Some important findings are summarized below:
  • The two varieties reacted differently to different weather conditions in terms of chlorophyll concentration and the amount of crop yield. This result has practical relevance, as this is an important consideration for farmers to select the optimal wheat variety. In the dry year of 2021/2022, Zvezdana produced higher yields after zinc treatment. Zinc treatments had different effects on the four nutrient levels in the experiment.
  • The effectiveness of the foliar Zn treatment also depends on the nutrient levels and varieties.
  • Further studies are needed to draw more conclusions about the interactions between the variables.
  • Analytical measurements have confirmed the effectiveness of SPAD to measure chlorophyll concentrations.
  • This is confirmed by the strong correlation between the results. Since measurement with SPAD is a faster and cheaper way to determine chlorophyll content, it can be used in some cases instead of analytical tests.
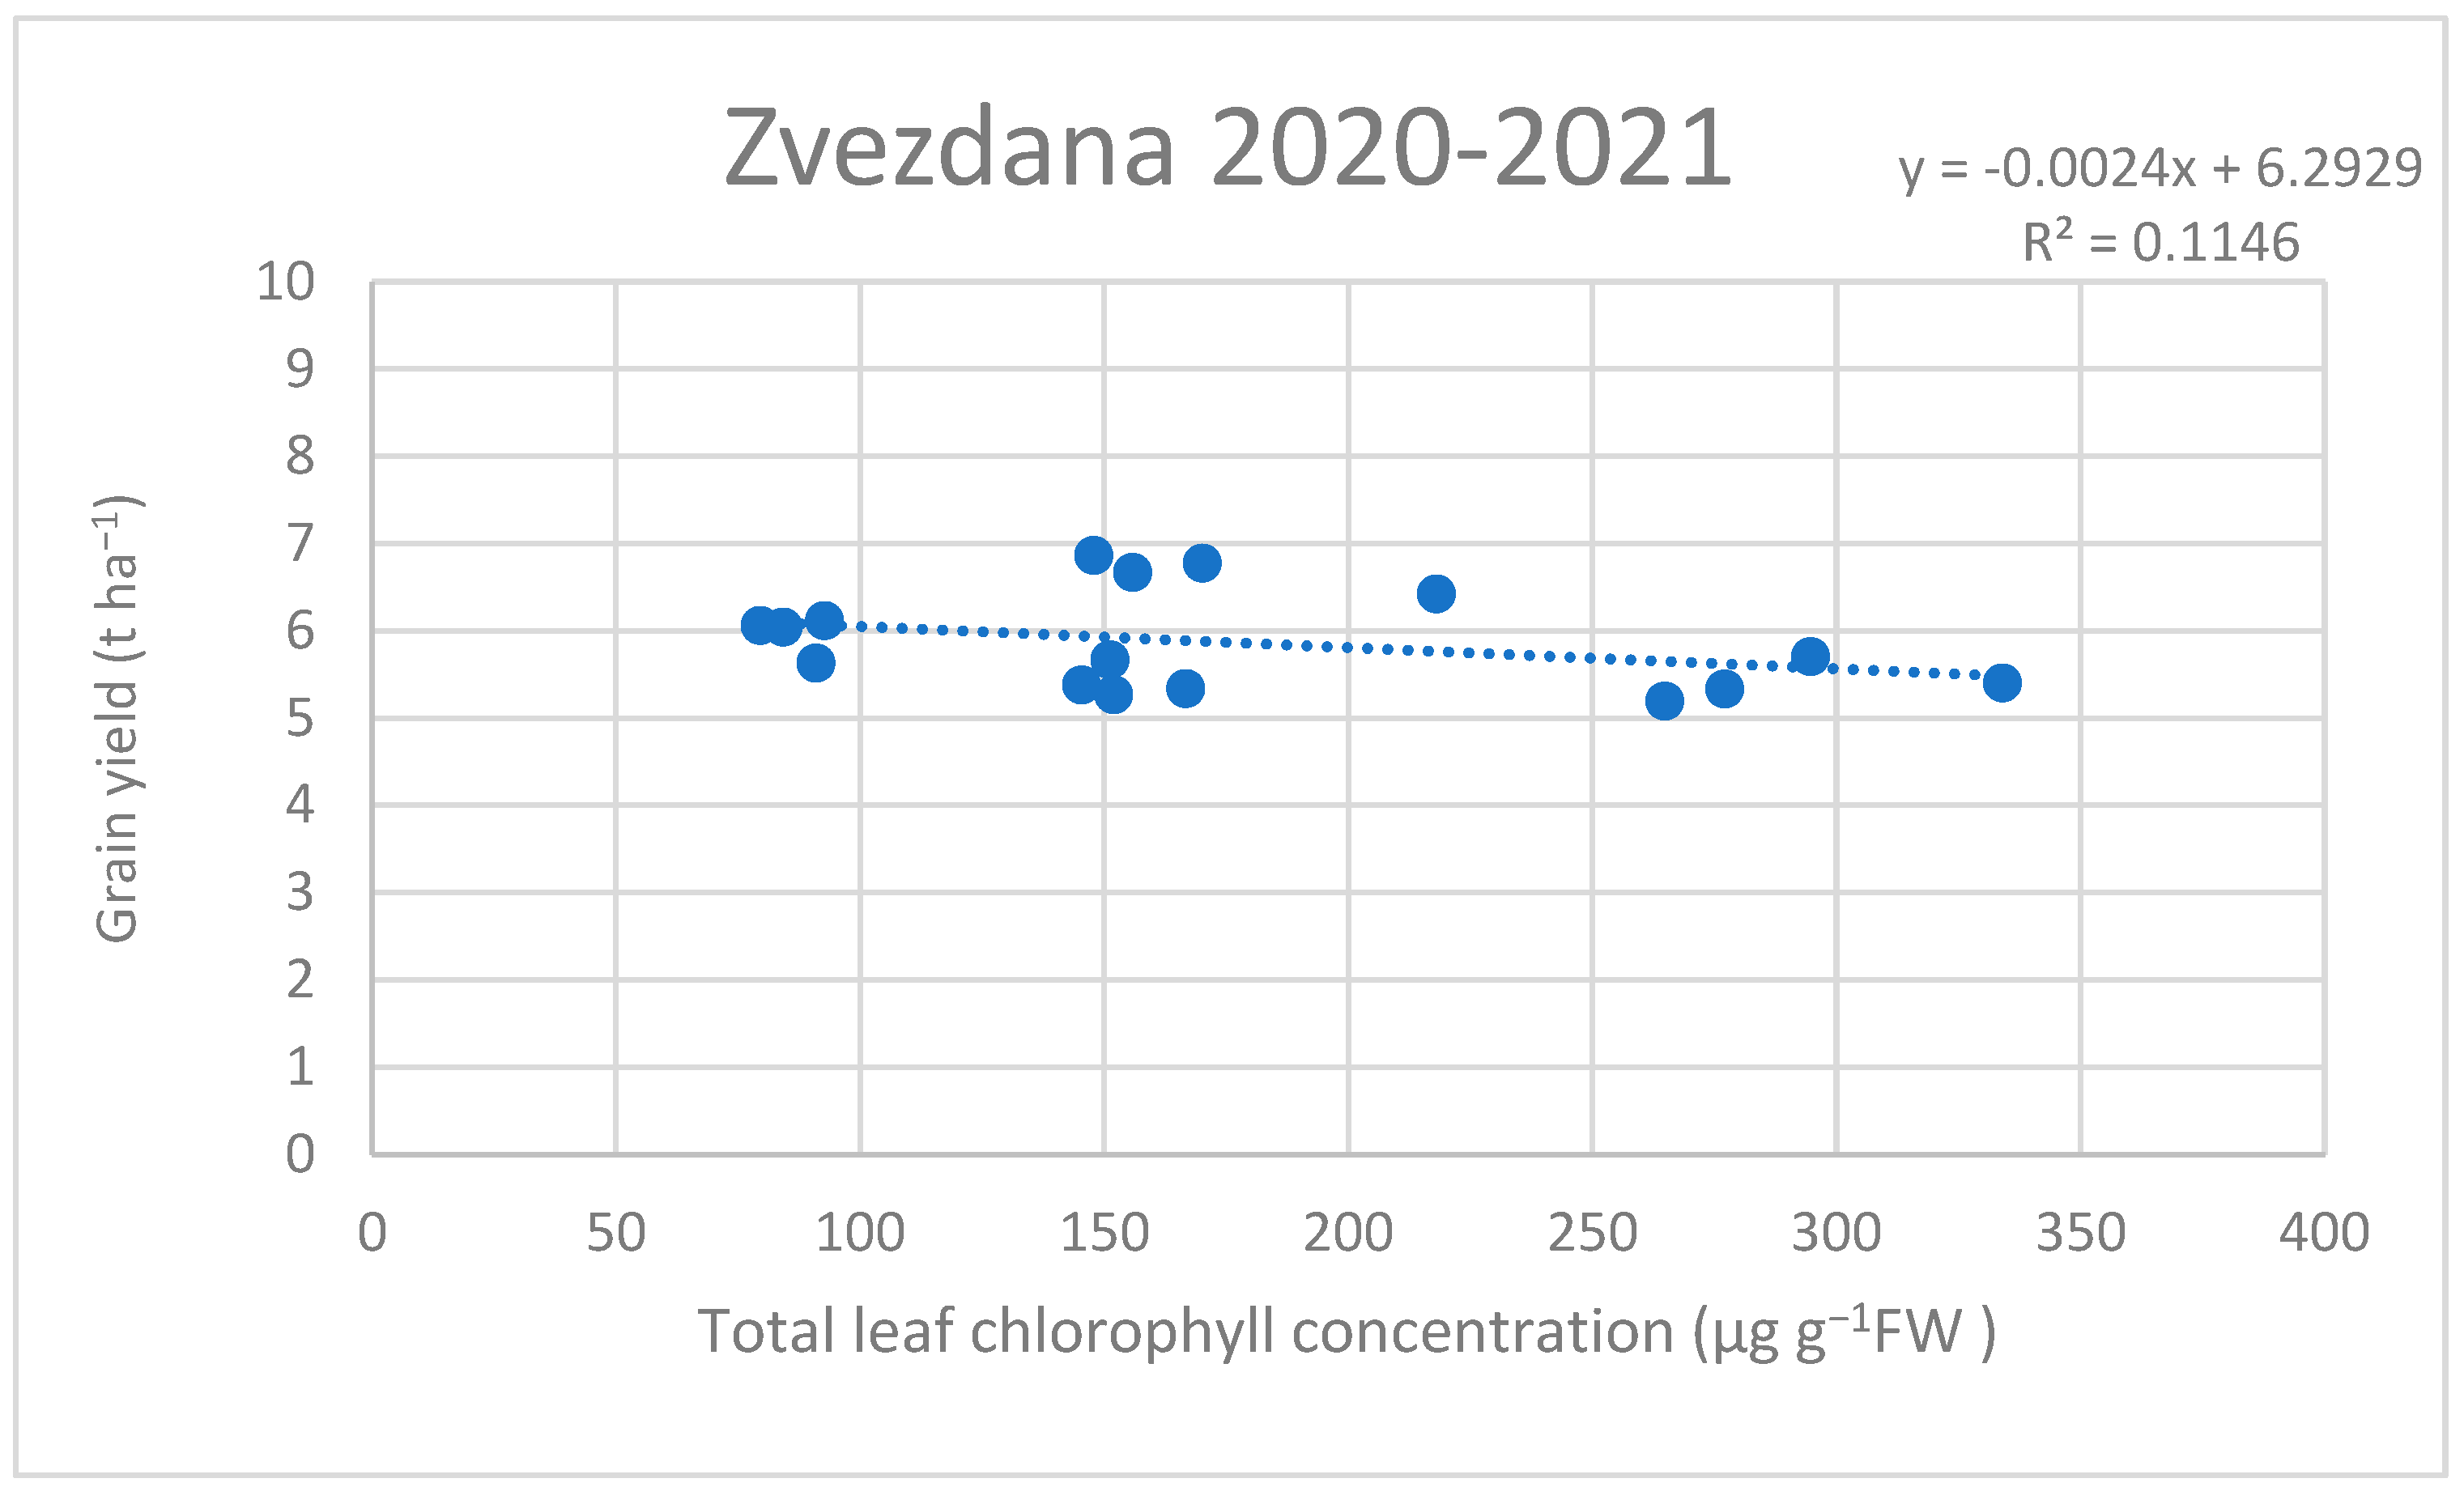
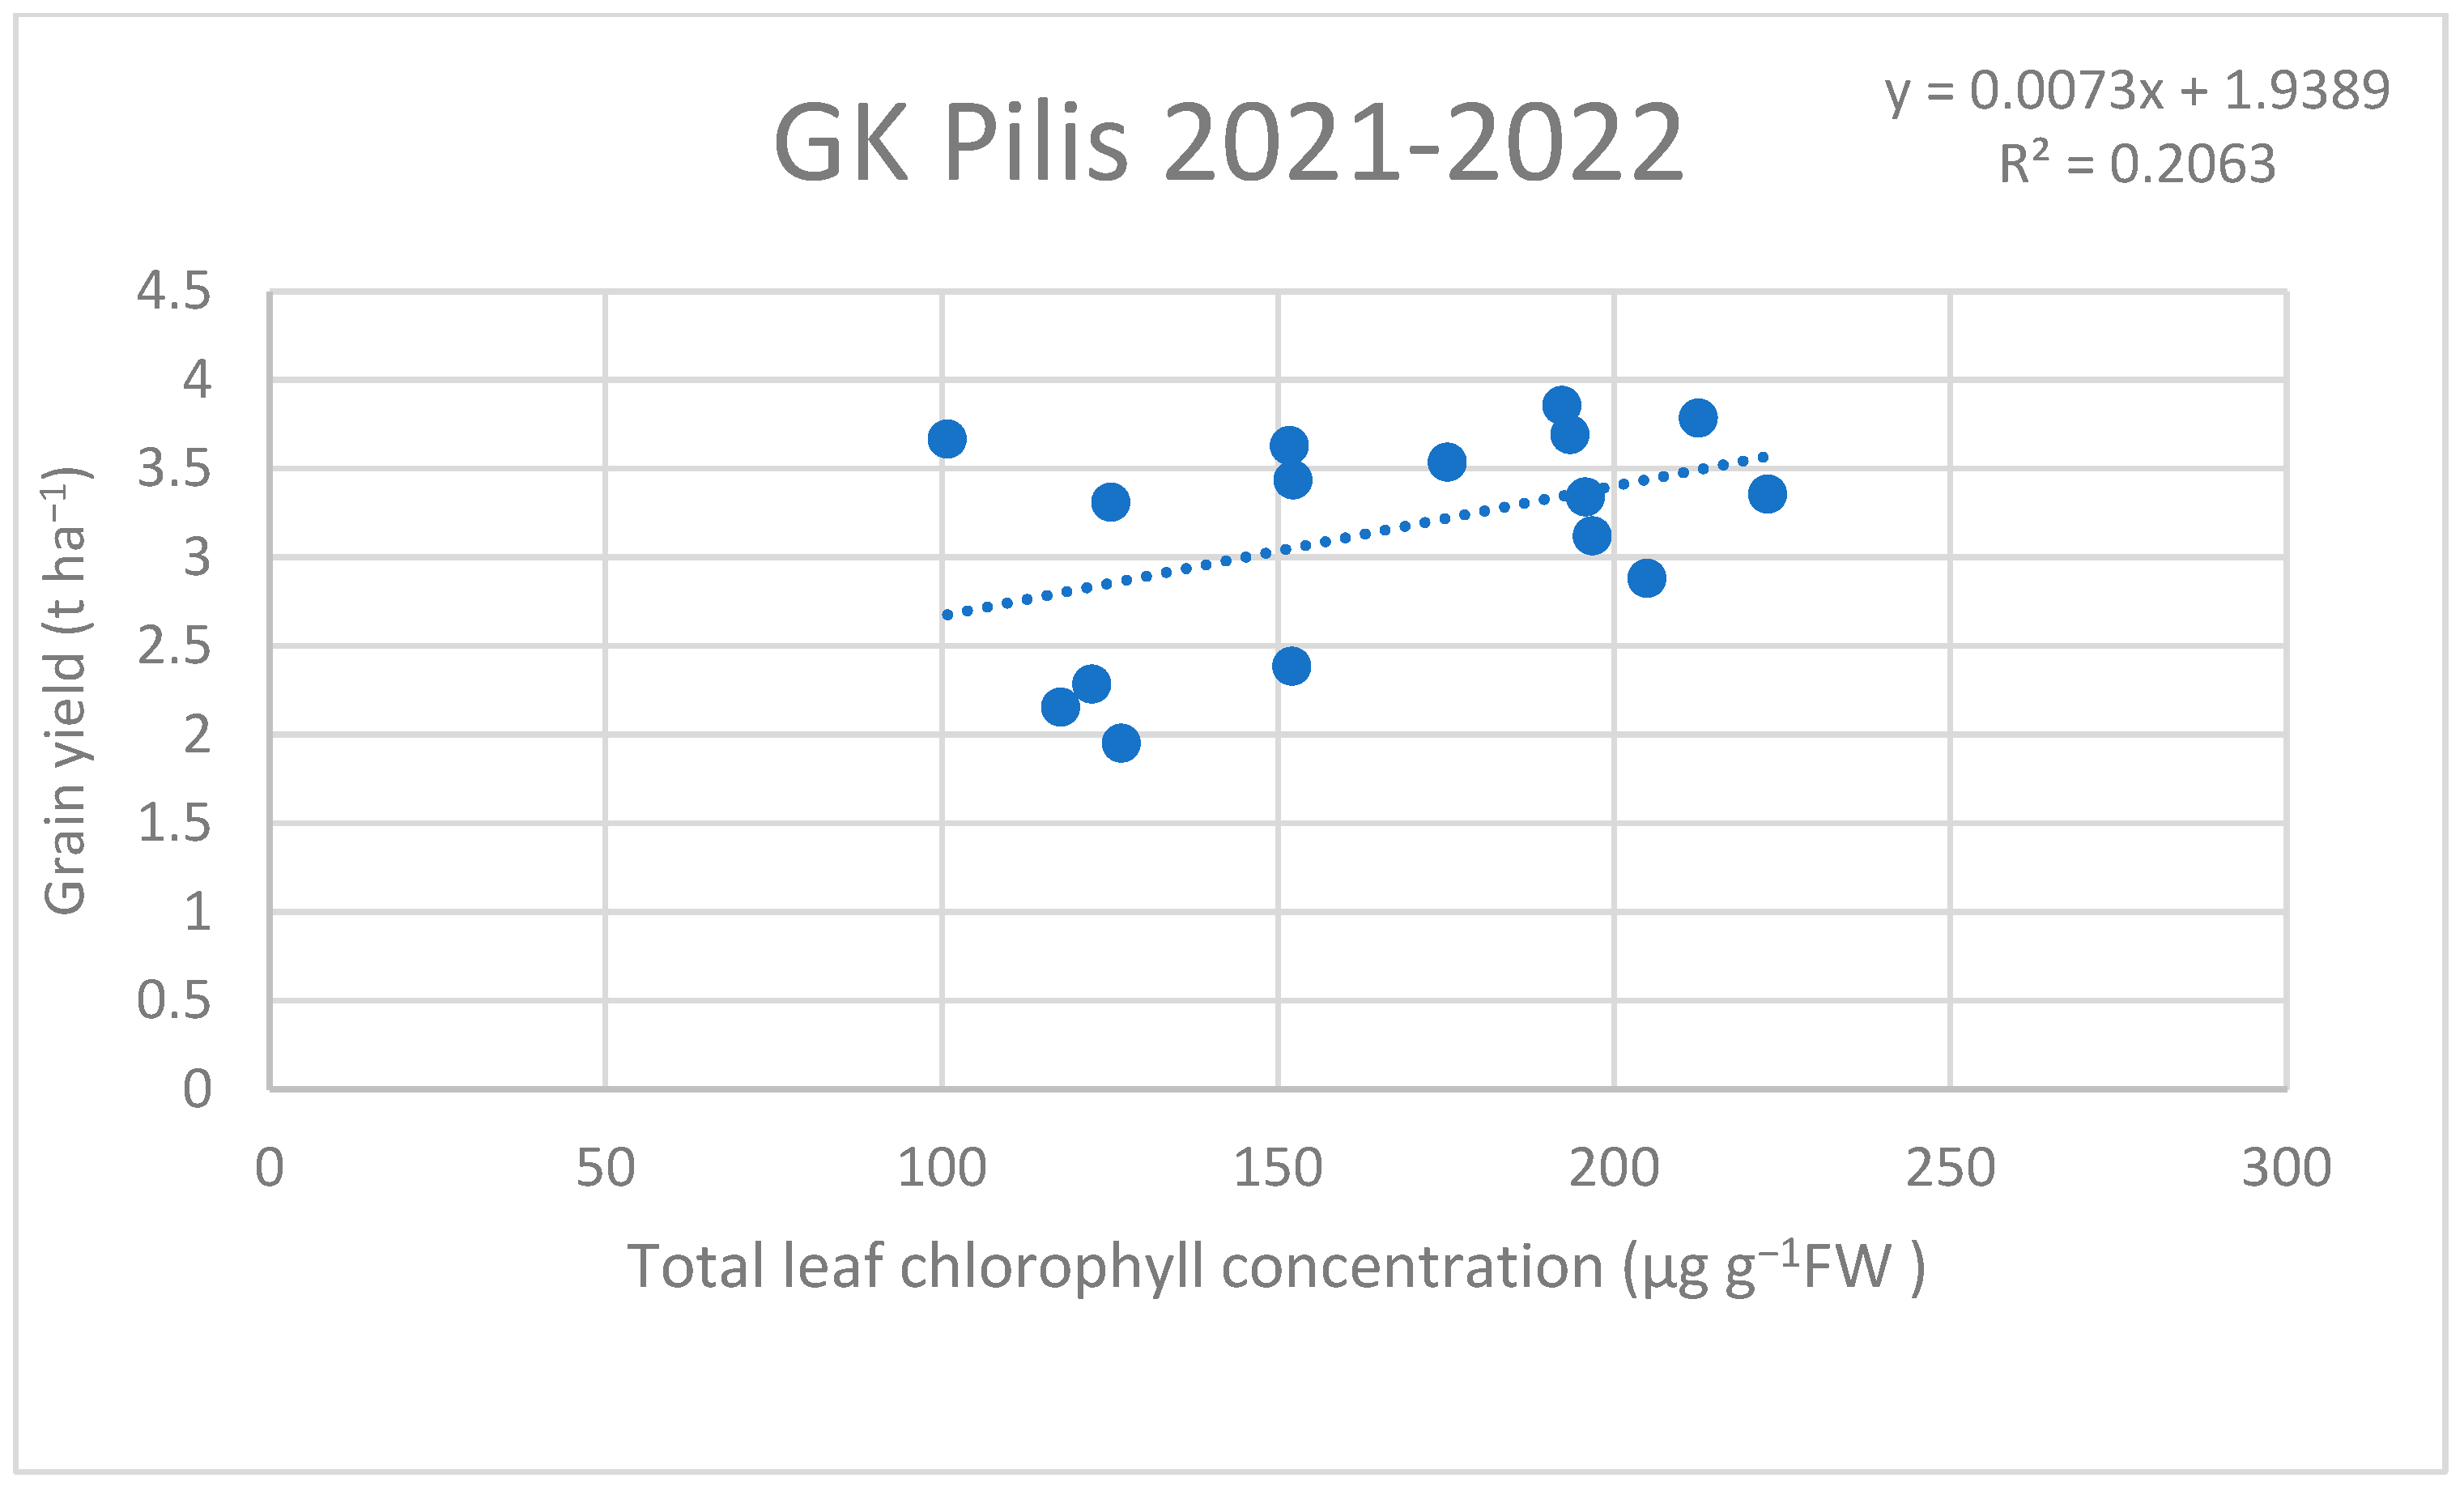
  • The correlation between yields and chlorophyll content was higher in the dry year of 2021/2022 than in the year of 2020/2021 of favorable weather conditions.

Author Contributions

Conceptualization, K.I. and M.T.; methodology, K.I. and M.T.; software, K.I. and M.T.; validation, K.I., M.T. and M.K.K.; formal analysis, K.I. and A.R.; investigation, K.I., I.K., L.S. and M.T.; resources, K.I. and M.T; data curation, K.I, I.K. and M.T.; writing—original draft preparation, K.I., L.S., A.R., I.K., M.V.-N., M.K.K., K.V.V. and M.T.; writing—review and editing, K.I., L.S., A.R., I.K., M.V.-N., K.V.V. and M.T.; visualization, K.I. and A.R.; supervision, M.T. and K.V.V.; project administration, K.I.; funding acquisition, K.I., M.T. and M.K.K. All authors have read and agreed to the published version of the manuscript.

Funding

Supported by the ÚNKP-21-3. New National Excellence Program of the Ministry for Innovation and Technology from the source of the National Research, Development and Innovation Fund.

Data Availability Statement

The data presented in this study are available on request from the corresponding author.

Conflicts of Interest

The authors declare no conflict of interest.

Appendix A

Table A1. The total leaf chlorophyll concentration of GK Pilis in the vegetation periods of 2020–2021 and 2021–2022.
Growing SeasonNutrient LevelZn TreatmentSecond Sampling (µg g−1 FW)Third Sampling (µg g−1 FW)
2020/2021Acontrol147 aA *159 aA
1st160 aA201 aA
2nd125 aA158 aA
3rd111 aA152 aA
Bcontrol177 aA 273 aB
1st179 aA266 aB
2nd159 aA150 aA
3rd202 aBC224 aB
Ccontrol183 aA94 aA
1st182 aA129 bA
2nd142 aA217 cA
3rd143 aAB140 bdA
Dcontrol178 abA173 aA
1st193 abA144 aA
2nd174 aA157 aA
3rd218 bC199 aA
2021/2022Acontrol113 aAB126 aA
1st178 bAB152 aA
2nd186 bcA122 aA
3rd214 bdcA117 aA
Bcontrol80 aA125 aA
1st138 bA175 bAB
2nd148 bcAB152 abA
3rd121 abcB151 abA
Ccontrol124 abAB193 aB
1st184 bB100 bC
2nd113 aB192 aB
3rd150 abB212 aB
Dcontrol157 abB204 aB
1st140 abAB196 aB
2nd183 acA195 aB
3rd141 abB222 aB
* Means marked by the same letters in the same columns show no significant difference (Tukey test p < 0.05). Significant differences between nutrient levels are marked in capital letters and significant differences between treatments are indicated in normal-sized letters.
Table A2. Total leaf chlorophyll concentration of Zvezdana in the vegetation periods of 2020–2021 and 2021–2022.
Growing SeasonNutrient LevelZn TreatmentSecond Sampling (µg g−1 FW)Third Sampling (µg g−1 FW)
2021Acontrol183 aA *145 aA
1st126 bA151 aA
2nd132 abA166 aA
3rd167 abA151 aA
Bcontrol155 aA294 aB
1st228 aB277 aA
2nd226 aB264 aA
3rd179 aA334 aB
Ccontrol179 aA179 aA
1st175 aAB184 aA
2nd189 aAB191 aB
3rd158 aA192 aA
Dcontrol179 aA170 aAB
1st206 aB155 aA
2nd190 aAB147.85 aAB
3rd170.08 aA218 aAB
2022Acontrol158 aA121 aA
1st109 aA176 aA
2nd164 aA151 aA
3rd133 aA138 aA
Bcontrol164 aA231 aB
1st108 bA180 abA
2nd105 bB118 bA
3rd102 bA160 abA
Ccontrol138 aA203 aAB
1st151 aB101 bB
2nd182 aA153 abA
3rd145 aA125 bAB
Dcontrol118 aA232 aB
1st156 aB144 bAB
2nd164 aA130 bA
3rd270 bB224 aB
* Means marked by the same letters in the same columns show no significant difference (Tukey test p < 0.05).Significant differences between nutrient levels are marked in capital letters and significant differences between treatments are indicated in normal-sized letters.

References

  1. Hlaváčová, M.; Klem, K.; Rapantová, B.; Novotná, K.; Urban, O.; Hlavinka, P.; Trnka, M. Interactive effects of high temperature and drought stress during stem elongation, anthesis and early grain filling on the yield formation and photosynthesis of winter wheat. Field Crops Res. 2018, 221, 182–195. [Google Scholar] [CrossRef]
  2. Curtis, B.C. Wheat in the World. Available online: http://www.fao.org/3/y4011e/y4011e04.htm (accessed on 28 December 2022).
  3. Szabó, M. Fajtakérdés, fajtarotáció, fajtavédelem. In A Búzatermesztés Kézikönyve; Barabás, Z., Ed.; Mezőgazdasági Kiadó: Budapest, Hungary, 1987; pp. 237–251. [Google Scholar]
  4. Erekul, O.; Köhn, W. Effect of weather and soil conditions on yield components and bread-making quality of winter wheat (Triticum aestivum L.) and winter Triticale (Triticosecale Wittm.) varieties in North-East Germany. J. Agron. Crop Sci. 2006, 192, 452–464. [Google Scholar] [CrossRef]
  5. Mahajan, S.; Tuteja, N. Cold, salinity and drought stresses: An overview. Arch. Biochem. Biophys. 2005, 444, 139–158. [Google Scholar] [CrossRef]
  6. de Almeida Cançado, G.M. The importance of genetic diversity to manage abiotic stress. In Abiotic Stress in Plants–Mechanisms and Adaptations; InTechOpen: Rijeka, Croatia, 2011; pp. 351–366. [Google Scholar] [CrossRef] [Green Version]
  7. Murata, N.; Takahashi, S.; Nishiyama, Y.; Allakhverdiev, S.I. Photoinhibition of photosystem II under environmental stress. Biochim. Et Biophys. Acta (BBA)-Bioenerg. 2007, 1767, 414–421. [Google Scholar] [CrossRef] [Green Version]
  8. Statkevičiūtė, G.; Liatukas, Ž.; Cesevičienė, J.; Jaškūnė, K.; Armonienė, R.; Kuktaite, R.; Brazauskas, G. Impact of Combined Drought and Heat Stress and Nitrogen on Winter Wheat Productivity and End-Use Quality. Agronomy 2022, 12, 1452. [Google Scholar] [CrossRef]
  9. Mani, R.G.; Smet, J.H.; von Klitzing, K.; Narayanamurti, V.; Johnson, W.B.; Umansky, V. Zero-resistance states induced by electromagnetic-wave excitation in GaAs/AlGaAs heterostructures. Nature 2002, 420, 646–650. [Google Scholar] [CrossRef] [PubMed] [Green Version]
  10. Bacci, L.; De Vincenzi, M.; Rapi, B.; Arca, B.; Benincasa, F. Two methods for the analysis of colorimetric components applied to plant stress monitoring. Comput. Electron. Agric. 1998, 19, 167–186. [Google Scholar] [CrossRef]
  11. Kristó, I.; Vályi-Nagy, M.; Rácz, A.; Tar, M.; Irmes, K.; Szentpéteri, L.; Ujj, A. Effects of Weed Control Treatments on Weed Composition and Yield Components of Winter Wheat (Triticum aestivum L.) and Winter Pea (Pisum sativum L.) Intercrops. Agronomy 2022, 12, 2590. [Google Scholar] [CrossRef]
  12. Trnka, M.; Hlavinka, P.; Semenov, M.A. Adaptation options for wheat in Europe will be limited by increased adverse weather events under climate change. J. R. Soc. Interface 2015, 12, 20150721. [Google Scholar]
  13. Prasad, P.V.V.; Staggenborg, S.A.; Ristic, Z. Impacts of drought and/or heat stress on physiological, developmental, growth, and yield processes of crop plants. In Response of Crops to Limited Water: Understanding and Modeling Water Stress Effects on Plant Growth Processes; American Society of Agronomy, Inc.: Madison, WI, USA, 2008; Volume 1, pp. 301–355. [Google Scholar] [CrossRef] [Green Version]
  14. Simova-Stoilova, L.; Stoyanova, Z.; Demirevska-Kepova, K. Ontogenic changes in leaf pigments, total soluble protein and Rubisco in two barley varieties in relation to yield. Bulg. J. Plant Physiol. 2001, 27, 15–24. [Google Scholar]
  15. Pepó, P. Újabb Adatok az Őszi Búza Fajtaspecifikus Tápanyagellátásához; Debreceni Agrártudományi Egyetem Tudományos Közleményei: Debrecen, Hungary, 1995; Volume XXXII, pp. 125–142. [Google Scholar]
  16. Kristó, I.; Tar, M.; Vályi Nagy, M.; Petróczi, I.M. Impact of nutrient supply on the relative development of yield components of winter wheat. Columella J. Agric. Environ. Sci. 2020, 7, 25–32. [Google Scholar] [CrossRef]
  17. Szabó, M. Őszi Búza Műtrágyázási és CCC Hatás Kísérlet, Országos Mezőgazdasági Fajta-és Termeléstechnikai Minősítő Intézet; Budapest, Hungary, 1966; Volume 1.
  18. Ágoston, T.; Pepó, P. Examination of the Effect of Cropyear on the Yield Potential and Yield Stability of Winter Wheat Varieties. Acta Agrar. Debr. 2005, 16, 62–67. [Google Scholar] [CrossRef] [PubMed]
  19. Panozzo, J.F.; Eagles, H.A. Cultivar and environmental effects on quality characters in wheat. II. Protein. Aust. J. Agric. Res. 2000, 51, 629–636. [Google Scholar] [CrossRef]
  20. Gavito, M.E.; Curtis, P.S.; Mikkelsen, T.N.; Jakobsen, I. Interactive effects of soil temperature, atmospheric carbon dioxide and soil N on root development, biomass and nutrient uptake of winter wheat during vegetative growth. J. Exp. Bot. 2001, 52, 1913–1923. [Google Scholar] [CrossRef] [Green Version]
  21. Ayala-Silva, T.; Beyl, C.A. Changes in spectral reflectance of wheat leaves in response to specific macronutrient deficiency. Adv. Space Res. 2005, 35, 305–317. [Google Scholar] [CrossRef]
  22. Uauy, C.; Distelfeld, A.; Fahima, T.; Blechl, A.; Dubcovsky, J. A NAC gene regulating senescence improves grain protein, zinc, and iron content in wheat. Science 2006, 314, 1298–1301. [Google Scholar] [CrossRef] [PubMed] [Green Version]
  23. Gregersen, P.L.; Culetic, A.; Boschian, L.; Krupinska, K. Plant senescence and crop productivity. Plant Mol. Biol. 2013, 82, 603–622. [Google Scholar] [CrossRef] [PubMed]
  24. Árendás, T.; Csathó, P.; Németh, T. Tápanyagellátás a minőségorientált búzatermesztésben. In A jó minőségű keményszemű búza nemesítése és termesztése; Martonvásár–Nádudvar–Szeged: Budapest, Hungary, 2001; pp. 73–74. [Google Scholar]
  25. Jagodin, B.A. Sulphur, magnesium and micronutrients and their role in plant nutrition. A búzatermesztés kézikönyve. Mezőgazdasági Kiadó, Budapest, Hungary, 1987; 356p.
  26. Wojtkowiak, K.; Stepien, A.; Warechowska, M.; Raczkowski, M. Content of copper, iron, manganese and zinc in typical light brown soil and spring triticale grain depending on a fertilization system. J. Elem. 2014, 19, 833–844. [Google Scholar] [CrossRef]
  27. Harnos, N.; Erdélyi, É.; Árendás, T. Tartamkísérletek jelentősége a klímaváltozás hatásainak tanulmányozásában. In Tartamkísérletek Jelentősége a Növénytermesztés Fejlesztésében; Berzsenyi, Z., Árendás, T., Eds.; A Magyar Tudományos Akadémia Mezőgazdasági Kutatóintézete: Martonvásár, Hungary, 2009; pp. 101–106. [Google Scholar]
  28. Irmes, K.; Kristó, I.; Vályi-Nagy, M.; Rácz, A.; Tar, M. Provocation study of a long-term experiment in winter wheat using zn foliar fertilizers applied at different times. Res. J. Agric. Sci. 2021, 53, 69–80. [Google Scholar]
  29. Izsáki, Z. Alap-és levéltrágyázás hatása a takarmánylucerna termésére és beltartalmára. Növénytermelés 1987, 36, 377–383. [Google Scholar]
  30. Solomon Wisdom, G.O.; Ndana, R.W.; Abdulrahim, Y. The Comparative study of the effect of organic manure cow dung and inorganic fertilizer NPK on the growth rate of maize (Zea mays L). Int. Res. J. Agric. Sci. Soil Sci. 2012, 2, 516–519. [Google Scholar]
  31. Péntek, A.; Fazekas, C. A cink hiányának kiváltó okai a talaj-növény rendszerben. Acta Agrar. Kaposváriensis 2016, 20, 48–61. [Google Scholar]
  32. Mengel, K. A növények táplálkozása és anyagcseréje. In Ernährung und Stoffwechsel der Planze; Mezőgazdasági Kiadó: Budapest, Hungary, 1976; pp. 162–163. [Google Scholar]
  33. Birkás, M. Földmûvelés és Földhasználat; Mezõgazda Kiadó: Budapest, Hungary, 2006; pp. 279–280. [Google Scholar]
  34. Xian, X.; Shokohifard, G.I. Effect of pH on chemical forms and plant availability of cadmium, zinc, and lead in polluted soils. Water Air Soil Pollut. 1989, 45, 265–273. [Google Scholar] [CrossRef]
  35. Alloway, B.J. Heavy metals in soils. Blackie Academic and Professional; Chapman & Hall: London, UK, 1995; p. 368. [Google Scholar] [CrossRef]
  36. Kádár, I. A szennyezett talajok vizsgálatáról. In Kármentesítési Kézikönyv 2; Környezetvédelmi Minisztérium: Budapest, Hungary, 1998. [Google Scholar]
  37. Lichtenthaler, H.K. Chlorophylls and carotenoids: Pigments of photosynthetic biomembranes. In Methods in Enzymology; Academic Press: Cambridge, MA, USA, 1987; Volume 148, pp. 350–382. [Google Scholar] [CrossRef]
  38. Marquard, R.D.; Tipton, J.L. Relationship between extractable chlorophyll and an in situ method to estimate leaf greenness. HortScience 1987, 22, 1327. [Google Scholar] [CrossRef]
  39. Tian, Y.; Zhu, Y.; Cao, W.; Fan, X.; Liu, X. Monitoring protein and starch accumulation in wheat grains with leaf SPAD and canopy spectral reflectance. Zhongguo Nong ye ke xue = Zhongguo Nongye Kexue 2004, 37, 808–813. [Google Scholar]
  40. Uchino, H.; Watanabe, T.; Ramu, K.; Sahrawat, K.L.; Marimuthu, S.; Wani, S.P.; Ito, O. Effects of nitrogen application on sweet sorghum (Sorghum bicolor (L.) Moench) in the semi-arid tropical zone of India. Jpn. Agric. Res. Q. 2013, 47, 65–73. [Google Scholar] [CrossRef] [Green Version]
  41. Percival, G.C.; Keary, I.P.; Noviss, K. The potential of a chlorophyll concentration SPAD meter to quantify nutrient stress in foliar tissue of Sycamore (Acer pseudoplatanus), English Oak,(Quercus robur), and European Beech (Fagus sylvatica). Arboric. Urban For. 2008, 34, 89. [Google Scholar] [CrossRef]
  42. Kandel, B.P. Spad value varies with age and leaf of maize plant and its relationship with grain yield. BMC Res. Notes 2020, 13, 475. [Google Scholar] [CrossRef] [PubMed]
  43. Skudra, I.; Ruza, A. Effect of nitrogen and sulphur fertilization on chlorophyll concentration in winter wheat. Rural. Sustain. Res. 2017, 37, 29–37. [Google Scholar] [CrossRef] [Green Version]
  44. Debreczeni, B.; Debreczeni, B. A Tápanyag-és a Vízellátás Kapcsolata; Mezőgazdasági Kiadó: Budapest, Hungary, 1984. [Google Scholar]
  45. Árendás, T.; Bónis, P.; Berzsenyi, Z.; Sugár, E.; Láng, L. Fajta és tápláltság: A búzaminőség és a minőségstabilitás alapjai. Martonvásár 2014, 1, 8–9. [Google Scholar]
  46. Pollhamer, E. A búza minősége a különböző agrotechnikai kísérletekben. In Martonvásár 1963–1971; Akadémiai Kiadó: Budapest, Hungary, 1973. [Google Scholar]
  47. Pecznik, J. A fotoszintézis és környezeti tényezői. In Levéltrágyázás; Mezőgazdasági Kiadó: Budapest, Hungary, 1976; pp. 5–7. [Google Scholar]
  48. Rose, T.J.; Impa, S.M.; Rose, M.T.; Pariasca-Tanaka, J.; Mori, A.; Heuer, S.; Wissuwa, M. Enhancing phosphorus and zinc acquisition efficiency in rice: A critical review of root traits and their potential utility in rice breeding. Ann. Bot. 2013, 112, 331–345. [Google Scholar] [CrossRef] [Green Version]
  49. Akgun, İ.; Karaman, R.; Eraslan, F.; Kaya, M. Effect of zinc on some grain quality parameters in bread and Durum wheat cultivars. Univers. J. Agric. Res. 2016, 4, 260–265. [Google Scholar] [CrossRef] [Green Version]
  50. Peck, A.W.; McDonald, G.K.; Graham, R.D. Zinc nutrition influences the protein composition of flour in bread wheat (Triticum aestivum L.). J. Cereal Sci. 2008, 47, 266–274. [Google Scholar] [CrossRef]
  51. Thorne, W. Zinc deficiency and its control. Adv. Agron. 1957, 9, 31–65. [Google Scholar] [CrossRef]
  52. Zhou, Y.; Lam, H.M.; Zhang, J. Inhibition of photosynthesis and energy dissipation induced by water and high light stresses in rice. J. Exp. Bot. 2007, 58, 1207–1217. [Google Scholar] [CrossRef] [PubMed]
  53. Huseynova, I.M. Photosynthetic characteristics and enzymatic antioxidant capacity of leaves from wheat cultivars exposed to drought. Biochim. Et Biophys. Acta (BBA)-Bioenerg. 2012, 1817, 1516–1523. [Google Scholar] [CrossRef] [Green Version]
  54. Bojović, B.M.; Stojanović, J. Chlorophyll and carotenoid content in wheat cultivars as a function of mineral nutrition. Arch. Biol. Sci. 2005, 57, 283–290. [Google Scholar] [CrossRef]
  55. Riahi, A.; Hdider, C. Bioactive compounds and antioxidant activity of organically grown tomato (Solanum lycopersicum L.) cultivars as affected by fertilization. Sci. Hortic. 2013, 151, 90–96. [Google Scholar] [CrossRef]
  56. Distelfeld, A.; Avni, R.; Fischer, A.M. Senescence, nutrient remobilization, and yield in wheat and barley. J. Exp. Bot. 2014, 65, 3783–3798. [Google Scholar] [CrossRef] [Green Version]
  57. Pearce, S.; Tabbita, F.; Cantu, D.; Buffalo, V.; Avni, R.; Vazquez-Gross, H.; Dubcovksy, J. Regulation of Zn and Fe transporters by the GPC1 gene during early wheat monocarpic senescence. BMC Plant Biol. 2014, 14, 368. [Google Scholar] [CrossRef] [PubMed] [Green Version]
  58. Martre, P.; Jamieson, P.D.; Semenov, M.A.; Zyskowski, R.F.; Porter, J.R.; Triboi, E. Modelling protein content and composition in relation to crop nitrogen dynamics for wheat. Eur. J. Agron. 2006, 25, 138–154. [Google Scholar] [CrossRef]
  59. Maharaj, R.; Arul, J.; Nadeau, P. Effect of photochemical treatment in the preservation of fresh tomato (Lycopersicon esculentum cv. Capello) by delaying senescence. Postharvest Biol. Technol. 1999, 15, 13–23. [Google Scholar] [CrossRef]
  60. Robson, P.R.; Donnison, I.S.; Wang, K.; Frame, B.; Pegg, S.E.; Thomas, A.; Thomas, H. Leaf senescence is delayed in maize expressing the Agrobacterium IPT gene under the control of a novel maize senescence-enhanced promoter. Plant Biotechnol. J. 2004, 2, 101–112. [Google Scholar] [CrossRef] [PubMed] [Green Version]
  61. Benbella, M.; Paulsen, G.M. Efficacy of treatments for delaying senescence of wheat leaves: II. Senescence and grain yield under field conditions. Agron. J. 1998, 90, 332–338. [Google Scholar] [CrossRef]
Figure 1. Monthly precipitation and mean temperature in the growing seasons of 2020–2021, 2021–2022, and in the last 20 years (1991–2020).
Agronomy 13 01640 g001
Figure 2. Total leaf chlorophyll concentration in the years of 2020–2021 and 2021–2022. The values marked by the same letters in the same columns show no significant differences (Tukey test p < 0.05). Significant differences between years are marked in capital letters and significant differences between varieties are indicated in normal-sized letters.
Agronomy 13 01640 g002
Figure 3. Correlation between SPAD and total leaf chlorophyll concentration at the time of flag leaf emergence (BBCH 65–69) in 2020–2021.
Agronomy 13 01640 g003
Figure 4. Correlation between SPAD and total leaf chlorophyll concentration at the time of flag leaf emergence (BBCH 65) in 2021–2022.
Agronomy 13 01640 g004
Figure 5. Comparison of SPAD values in 2021.
Agronomy 13 01640 g005
Figure 6. Comparison of SPAD values in 2022.
Agronomy 13 01640 g006
Figure 7. Crop yields by the averages of treatments and fertilizer doses in comparison of the two studied varieties in 2021 and in 2022. The same letters in the same columns show no significant difference (Tukey test p < 0.05). Significant differences between years are marked in capital letters and significant differences between varieties are indicated in normal-sized letters.
Agronomy 13 01640 g007
Figure 8. Effect of nutrient levels on crop yields by treatments in comparison of the two studied varieties in 2021 and in 2022. The same letters in the same columns show no significant differences (Tukey test p < 0.05). Significant differences between varieties are marked in capital letters and significant differences between nutrient levels are indicated in normal-sized letters.
Agronomy 13 01640 g008
Figure 9. Effects of Zn treatments on crop yields by the averages of fertilizer doses in comparison of the two studied varieties in 2021 and in 2022. The same letters in the same columns show no significant differences (Tukey test p < 0.05). Significant differences between varieties are marked in capital letters and significant differences between Zn treatments are indicated in normal-sized letters.
Agronomy 13 01640 g009
Figure 10. Regression between total leaf chlorophyll concentration and yield for Zvezdana (2020/2021).
Agronomy 13 01640 g010
Figure 11. Regression between total leaf chlorophyll concentration and yield for GK Pilis (2020/2021).
Agronomy 13 01640 g011
Figure 12. Regression between total leaf chlorophyll concentration and yield for Zvezdana (2021/2022).
Agronomy 13 01640 g012
Figure 13. Regression between total leaf chlorophyll concentration and yield for GK Pilis (2021/2022).
Agronomy 13 01640 g013
Table 1. Doses and the date of application of NPK fertilizations in the growing seasons of 2020–2021 and 2021–2022.
Date of TreatmentsName of TreatmentsNutrient Level ANutrient Level BNutrient Level CNutrient Level D
1 October 202029 September 2021autumn multinutrient fertilizer (NPK)N:P:K = 30:0:0N:P:K = 30:30:30N:P:K = 60:60:60N:P:K = 60:60:60
10 March 202128 February 2022top-dressing fertilization I. (ammonium nitrate)N = 30N = 60N = 60N = 60
26 April 20219 May 2022top-dressing fertilization II. (ammonium nitrate)N = 0N = 0N = 0N = 30
Table 2. The soil characteristics for four nutrient levels at different soil depths.
Nutrient LevelpH ValueLiquid LimitCaCO
m m%−1
Humus
%
Nitrogen
mg kg−1
Potassium mg kg−1Phosphorus mg kg−1Zinc
mg kg−1
Depth (cm)0–2525–500–2525–500–2525–500–2525–500–2525–500–2525–500–2525–500–2525–50
A7.537.5539.942.56.156.482.242.2416.912.72582302311871.431.18
B7.657.7239.541.210.411.32.152.0716.312.52391972171671.291.00
C7.677.7240.243.110.611.92.202.1417.411.92872013522141.300.82
D7.547.6340.543.16.765.862.332.317.212.3362754092801.621.24
Table 3. The dates of the treatments used in the experiment according to stages of phenological growth of GK Pilis and Zvezdana in the growing seasons of 2020–2021 and 2021–2022.
Nutrient LevelZn TreatmentTreatments (L ha−1 Doses)Applied at Tillering (BBCH 21–22)Applied at Flag Leaf Elongation (BBCH 37)20212022
Acontrol0----
A1st1🗸 9 April8 April
A2nd2🗸 9 April8 April
A3rd2 × 1🗸🗸9 April + 11 May9 April + 11 May
Bcontrol0----
B1st1🗸 9 April8 April
B2nd2🗸 9 April8 April
B3rd2 × 1🗸🗸9 April + 11 May9 April + 11 May
Ccontrol0----
C1st1🗸 9 April8 April
C2nd2🗸 9 April8 April
C3rd2 × 1🗸🗸9 April + 11 May9 April + 11 May
Dcontrol0----
D1st1🗸 9 April8 April
D2nd2🗸 9 April8 April
D3rd2 × 1🗸🗸9 April + 11 May9 April + 11 May
Table 4. Measurements with the SPAD-502 Plus Chlorophyll Meter and the date of sampling to measure the chlorophyll concentration of the leaf.
Sampling Number of Measurements202120222021
GK Pilis-Zvezdana
2022
GK Pilis-Zvezdana
SPAD110 May6 MayBBCH 61-BBCH 65BBCH 55-BBCH55
218 May9 MayBBCH 65-BBCH 65BBCH 58-BBCH 58
326 May16 MayBBCH 65-BBCH 69BBCH 59-BBCH 59
41 June23 MayBBCH 71-BBCH 73BBCH 65-BBCH 65
57 June30 MayBBCH 75-BBCH 75BBCH 69-BBCH 69
614 June6 JuneBBCH 77-BBCH 81BBCH 77- BBCH 77
Chlorophyll19 April30 MarcBBCH 24-BBCH 24BBCH 24-BBCH 24
225 April26 AprilBBCH 49-BBCH 47BBCH 49-BBCH 47
326 May23 MayBBCH 65-BBCH 69BBCH 65-BBCH 65
Table 5. The effects of Zn fertilization and four nutrient levels on the yield in the years of 2020/2021 and 2021/2022.
Growing SeasonGenotypeNutrient LevelControl (t ha−1)1st Treatment (t ha−1)2nd Treatment (t ha−1)3rd Treatment (t ha−1)
2021ZvezdanaA4.49 AaA *4.41 aaA *4.48 aaA *4.31 aaA *
B4.83 aaA *4.70 aabA *4.76 aaA *4.62 aaA *
C5.75 aaA *5.88 abA *6.11 bbA *6.03 abA *
D6.76 abA *6.81 acA *6.60 abA *6.89 abA *
GK PilisA4.58 aaA *4.35 aaA *4.40 aaA *4.61 aaA *
B5.38 aaA *5.18 abA *5.61 abB *5.27 abB *
C7.01 abB *7.15 acB *7.15 acB *7.38 acB *
D7.72 abB *7,25 acA *7.22 acB *7.49 acA *
2022ZvezdanaA1.95 aaA2.38 aaA *2.28 aaA *2.15 aaA *
B3.31 abA3.53 abA *3.43 abA *3.63 abA *
C3.62 abA3.66 abA *3.85 abA *3.78 abA *
D2.88 acA3.12 abA *3.34 abA *3.35 abA *
GK PilisA1.99 aaA2.09 aaA *2.04 aaA *2.14 aaA *
B2.64 abB2.70 abB *2.79 abB *2.74 aaB *
C3.35 acA3.69 acA *3.63 acA *3.47 abA *
D3.03 abcA3.09 acA *2.82 abA *2.47 aaB *
The same letters in the same columns show no significant differences (Tukey test p < 0.05).
Disclaimer/Publisher’s Note: The statements, opinions and data contained in all publications are solely those of the individual author(s) and contributor(s) and not of MDPI and/or the editor(s). MDPI and/or the editor(s) disclaim responsibility for any injury to people or property resulting from any ideas, methods, instructions or products referred to in the content.

