Article

Modeling of Typically Shaped Corn Seeds and Calibration of the Coefficient of Rolling Friction

College of Mechanical and Electrical Engineering, Gansu Agricultural University, Lanzhou 730070, China
*
Author to whom correspondence should be addressed.
Agronomy 2023, 13(6), 1573; https://doi.org/10.3390/agronomy13061573
Submission received: 20 April 2023 / Revised: 3 June 2023 / Accepted: 7 June 2023 / Published: 9 June 2023

Abstract

:
The shape of corn seeds not being spherical affects their mobility. This study focuses on modeling the typically shaped corn seeds and calibrating the coefficient of rolling friction for different shape types to improve simulation reliability. By analyzing the corn seed shape characteristics and size statistics, this study establishes a classification system that enables the determination of the average value and quantity of different types of corn seed using the spherical granule cluster method. The discrete element method is used to model simplified corn models, and contact parameters are validated through two types of repose angle and a seed metering experiment. In the collapse repose experiment, the relative error between the simulation and the experiment was only 0.72%, while the relative error in another repose experiment was 0.2%. The verification experiment for the metering of seeds showed that the relative error between the simulation and the experiment was below 15% at both low and high speeds, and the multi-grain rate error was less than 10%. This shows that the method proposed in this paper is somewhat accurate.

1. Introduction

The coefficient of rolling friction is a vital factor in the effective design and optimization of particle-processing machines [1]. It denotes the measure of the friction experienced when two objects roll relative to one another. Notably, the shape of the particle being processed significantly impacts its ease of rolling. The particle shape is an important input model in the Discrete Element Method. Because particle shape is a computationally expensive property to model in DEM, spherical particles with rolling friction are often employed to simulate the effects of shape [2]. However, the consideration of rolling friction alone does not predict simulation results when simulating the angle of repose, because the rolling friction only acts in opposition to the rolling motion, whereas the non-sphericity of a particle may increase rolling [3]. A single sphere with a rolling friction coefficient provides results that closely match those of experiments using the clumped sphere method, but its most suitable value is unknown a priori, and therefore the approach is empirical rather than predictive [3]. The change in particle shape due to higher aspect ratio under uniaxial compression results in decreased porosity but increased stiffness [4]. The angle of repose increases linearly with the coefficient of rolling friction of corn particles [5].
Recently, many studies have been conducted in which it was found that the coefficient of rolling friction between particles significantly affects the behavior and movement of the particles. Rolling friction can reduce the horizontal velocity of pea particles that are discharged from a flat-bottomed bin [6]. The angle of repose is influenced by certain changes in the friction coefficient and rolling friction values [7]. The coefficient of rolling friction can reduce the velocity of particles during the discharge of a flat-bottomed bin [6]. The accumulation characteristics of particles were affected significantly, and with increasing coefficient of rolling friction, the angle of repose of the particles increases and the gap between the boundary circle and the continuous circle decreases [8]. The coefficient of rolling friction has a significant impact on the accuracy of the results, and there are many ways to determine it. DEM and a physical test were combined to determine the coefficient of rolling friction of irregularly shaped corn particles, and the golden section method was used to determine the range of the corn particle’s coefficient of rolling friction, and a single-factor test was used to determine the relationship between the corn particle’s coefficient of rolling friction and their angle of repose [9]. Determination of the rolling friction coefficient of corn seeds based on the principle of energy conservation with the aid of high-speed camera technology [10].
To build a particle model of corn seed assemblies, it is essential to investigate the geometrical shape of corn seed particles. The complex nature of the shape of corn seeds necessitates the inclusion of multiple forms in the simulation process. The corn seed particle shapes can be divided into large flat grains, small flat grains, and spheroid grains [11]. It has been found that corn seeds can possess horse-tooth, spherical cone, spheroid, prism, and irregular shapes [12]. Different researchers have used different classifications for the shapes of corn seed particles, so it is necessary to perform further research on the classification of corn seed particles. This shows that the shape of corn seeds varies greatly, and in order to improve the accuracy of the simulation results, the rolling friction coefficient needs to be classified and determined.
The discrete-element method (DEM) is a useful tool for investigating the microscopic properties of particles for which the transient forces and energy dissipation are difficult to obtain by conventional experimental techniques [13,14]. The coefficient of rolling friction of particles is a basic and computationally significant property for simulation [15]. The accuracy of discrete element simulation depends on the input parameters and the shape model [16]. Particle shapes are usually made by combining spherical particles, which is referred to as sphere aggregation [17,18]. This method has been successfully applied to model grains and seeds, such as peas [4], corn [19], rice [20], soybean [21], and wheat [22]. A simple sphere particle may decrease the accuracy and credibility of the study results. However, a simplified shape model incorporating rolling friction remains to be properly outlined.
Studies on the coefficient of rolling friction of corn particles have focused primarily on single simple particles. In corn-particle processing, the shapes of most particles are irregular and vary widely. The microscopic mechanical properties of a particle system are non-homogeneity and anisotropy. The angle of repose is the target value of the simulation. The detailed coefficients of rolling friction for mixed horse-tooth-, spherical cone-, and spherically shaped corn seeds were predicted based on the repose angle [23], and the effect of the corn shape on the behavior during corn accumulation was investigated in detail [24]. However, it is difficult to obtain an accurate value of the repose angle. The coefficient of rolling friction is calibrated by defining the repose angle boundary to measure the height [25]. To further improve the accuracy of the coefficient of rolling friction for mixed-shape corn seeds, in this paper, a method is proposed for obtaining the coefficient of rolling friction of the mixed irregularly shaped particles via a physical experiment and DEM simulations. A physical experiment that incorporates DEM simulation is used to determine the value of the coefficient of rolling friction of six groups. EDEM software is used to simulate the accumulation process of irregularly shaped corn particles. The results are verified on the basis of two stacking angle and seed metering experiments.

2. Materials and Methods

2.1. Corn Model

2.1.1. Corn Shape

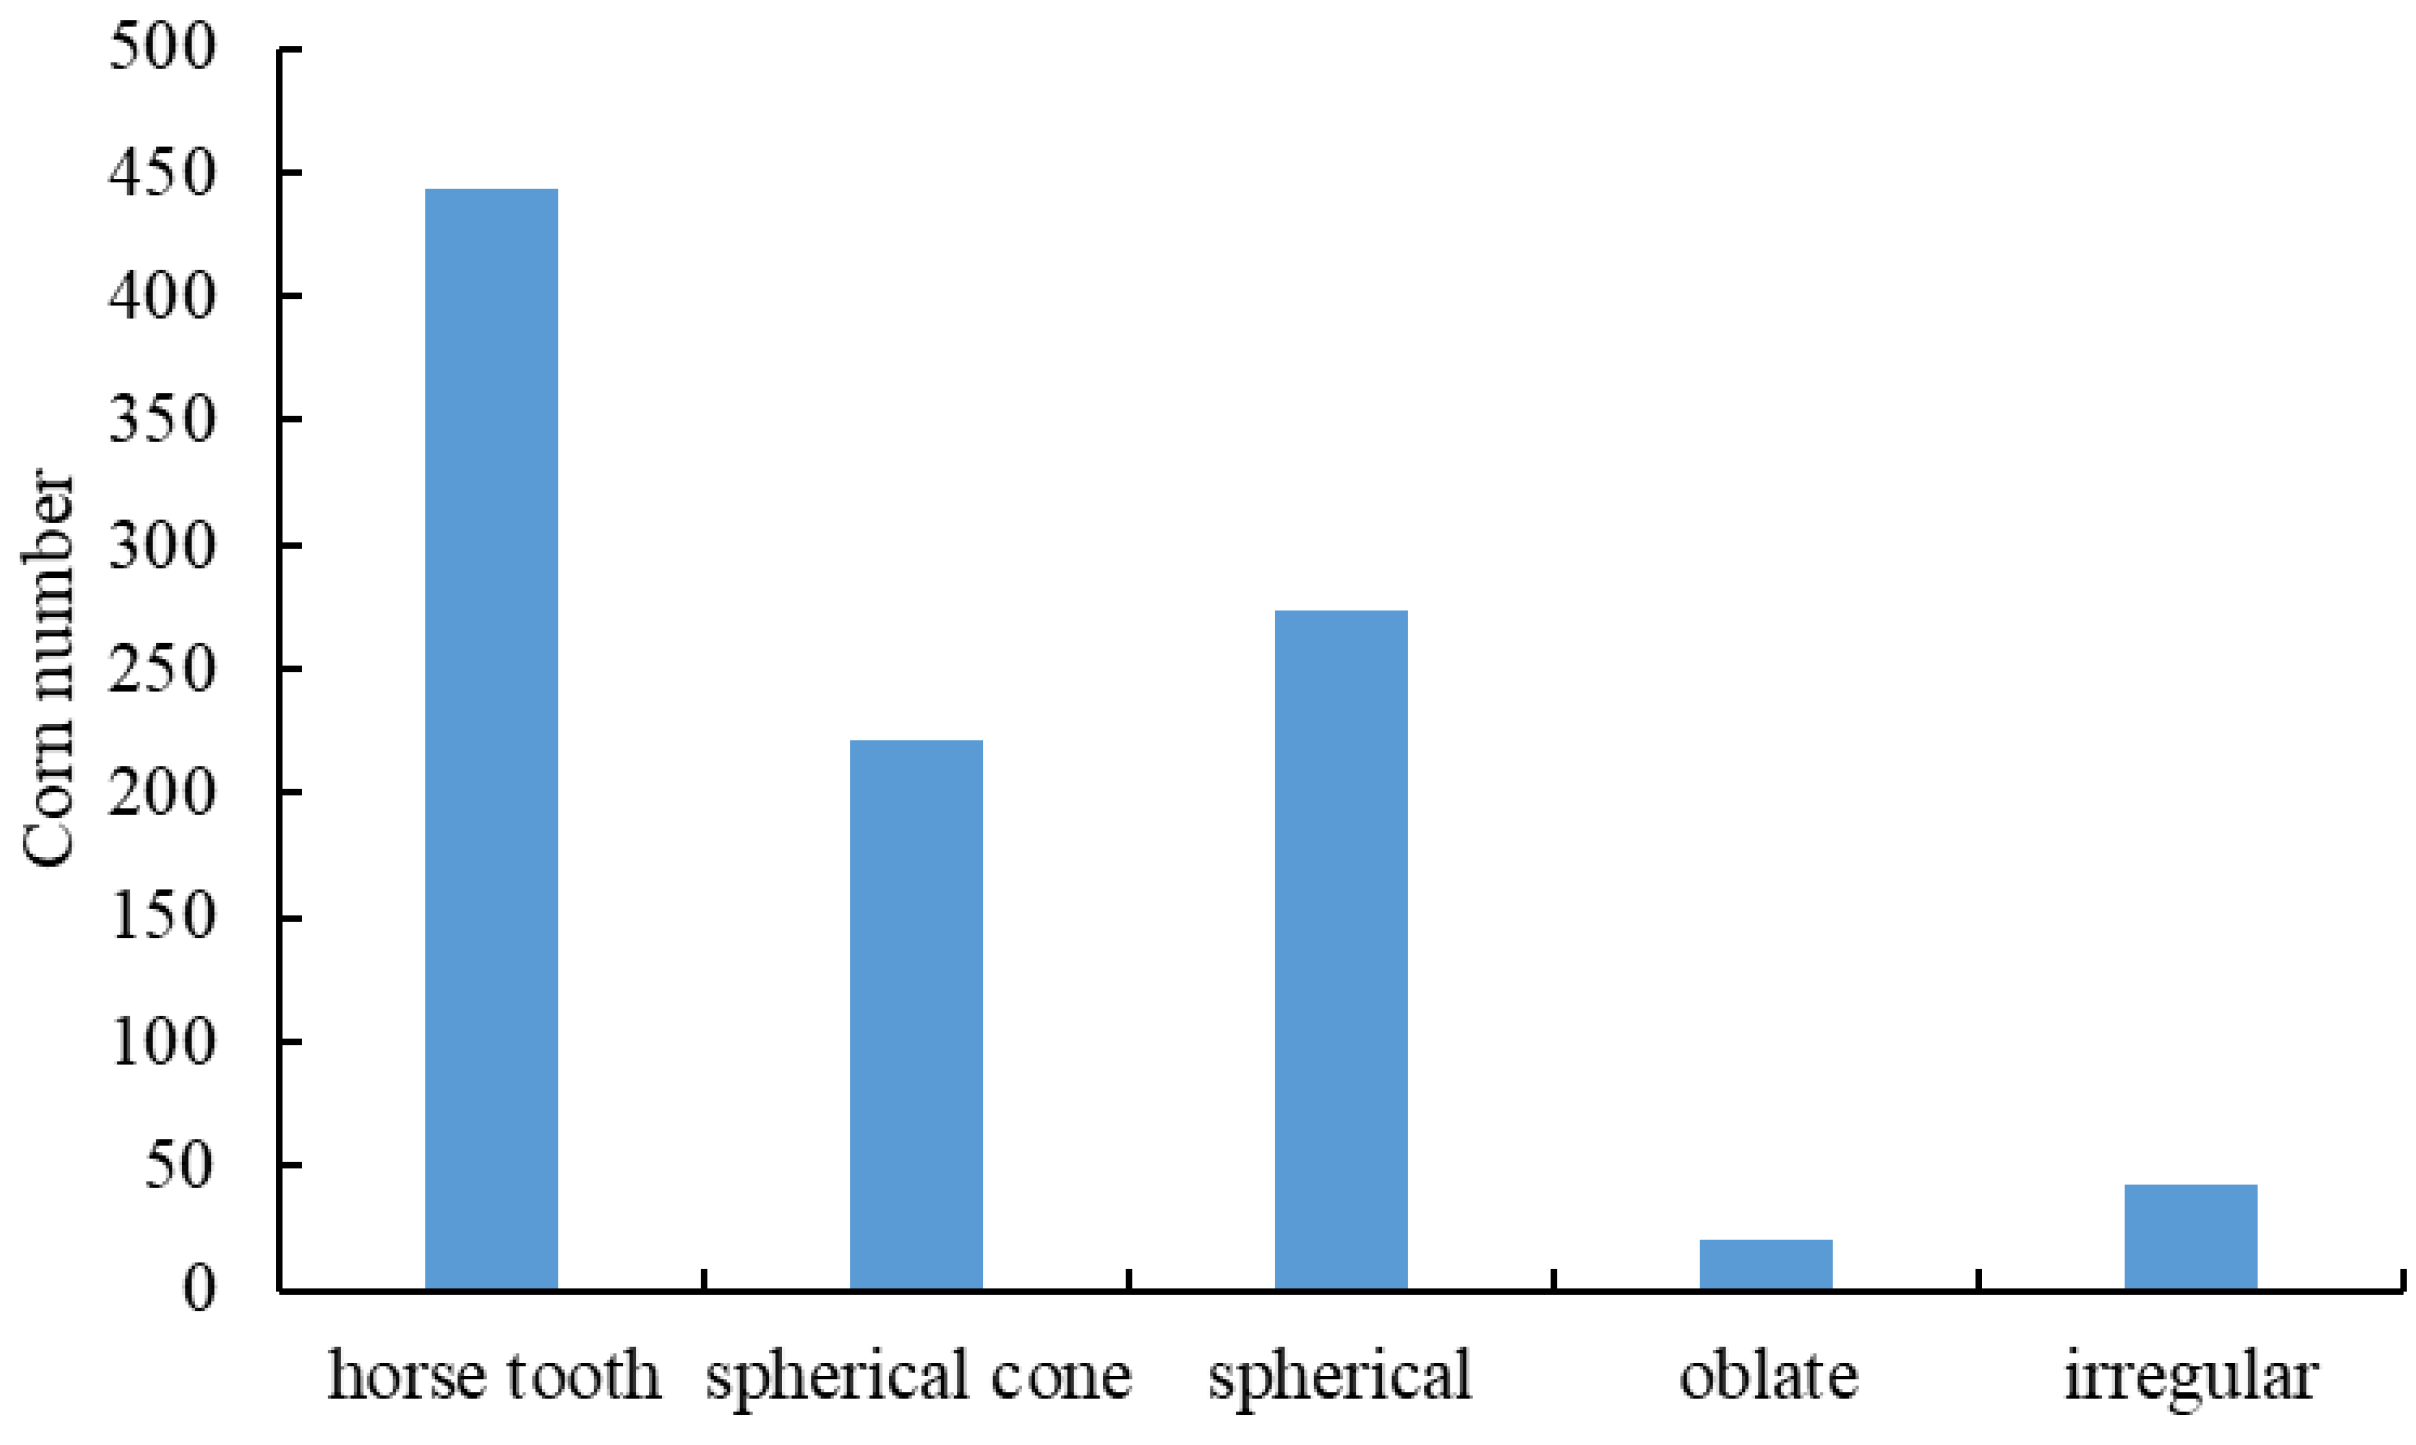
Jiuquan City, Gansu Province, is well suited to the development of the corn seed industry due to its abundant light and heat resources and its considerable day–night temperature difference. In this experiment, Zhengdan 958 corn seeds (produced by Gansu Longfengxiang Seed Co., Ltd., Lanzhou, China) were used, which possess a moisture content within the range 12.15~15.15% (wet base) and are widely planted in Gansu. A thousand randomly selected seeds were then analyzed for their shape characteristics. The various shapes of which the seeds can be classified include horse tooth (trapezoidal front and back profile, with width much larger than thickness), spherical cone (rounded in section, tapered from front to back), spherical (nearly uniform diameter, usually most ideal), oblate (flat in section, with width much larger than thickness), and irregular (obvious defects or odd shape); these shapes are illustrated in Figure 1. For accurate differentiation, corn seed shape types can be expressed by their sphericity. Sphericity is estimated on the basis of φ = D/H, and D3 = HWT. The sphericity of horse tooth seeds is 0.57–0.66, the sphericity of spherical cone seeds is 0.63–0.77, the sphericity of spherical seeds is 0.77–0.96, the sphericity of oblate seeds is 0.80–0.85, and the sphericity of irregular seeds is 0.91–0.93. The numbers of seeds counted for each type are presented in Figure 2.
From Figure 2, it can be observed that the number of horse tooth, spherical cone, and spherical corn seeds accounted for nearly 93.8% of the total among the five types of corn seed analyzed (443, 221, 274, 20, and 42, respectively). Their number-to-total ratios were 44.3%, 22.1%, 27.4%, 2.0%, and 4.2%, respectively, indicating a ratio of approximately 2:1:1.2. To simplify the modeling, only these three types of corn seed were modeled.

2.1.2. Corn Seed Size Analysis

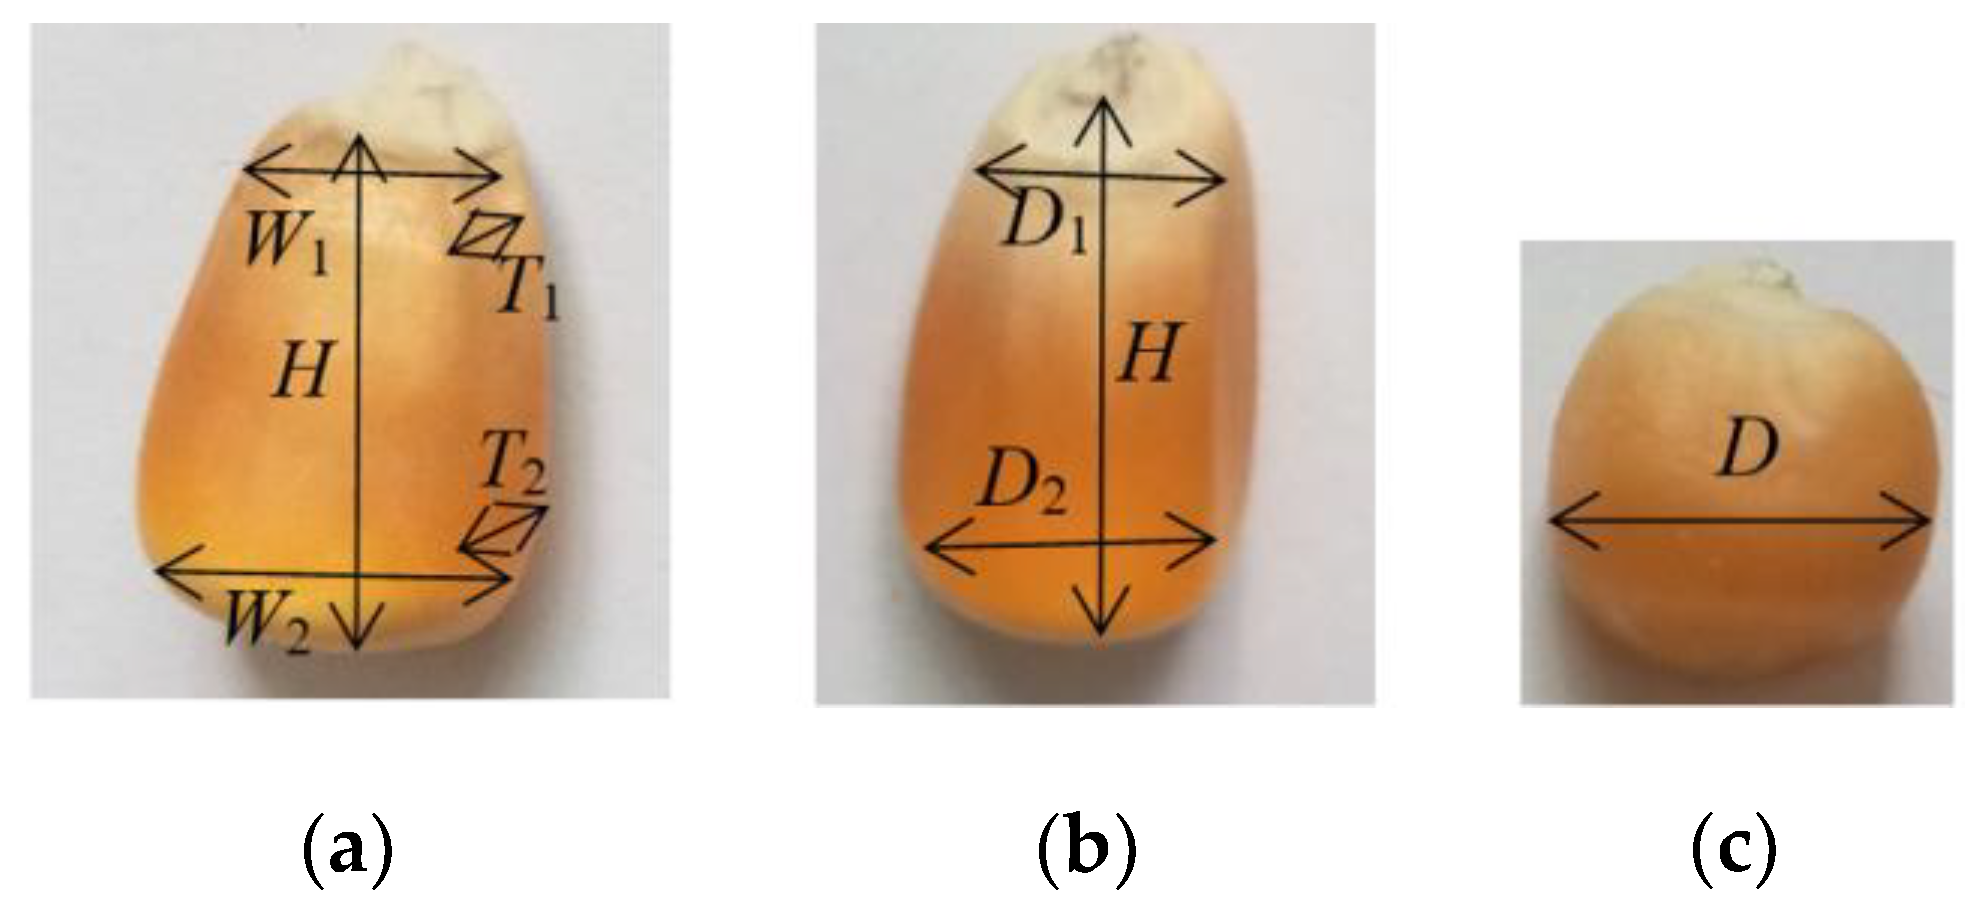
The feature dimensions of each shape need to be determined separately to be able to model the horse tooth, spherical cone, and spherical corn simulations. The characteristic dimensions of the horse tooth shape were defined as upper width (W1), lower width (W2), height (H), upper thickness (T1), and lower thickness (T2), as shown in Figure 3a. For spherical cone corn, the dimensions were defined as upper diameter (D1), lower diameter (D2), and height (H), as shown in Figure 3b. The spherical corn was represented by the diameter (D), as shown in Figure 3b.
The shape of horse tooth corn is complex and five characteristic dimensions are required to express it clearly. Two hundred seeds of horse tooth corn were selected to determine the dimensional statistics and to analyze the upper width (W1), lower width (W2), height (H), upper thickness (T1), and lower thickness (T2). The distribution of the five characteristic sizes of horse tooth corn conforms to a normal distribution. To determine the minimum spherical particle diameter of the model, the relationships between the five characteristic dimensions of horse tooth corn were investigated. From the results, the relationships between upper width (W1) and upper thickness (T1), lower width (W2) and lower thickness (T2), height (H) and upper thickness (T1), lower width (W2) and upper thickness (T1), and lower thickness (T2) and upper thickness (T1) of the horse tooth corn were fitted by linear regression. In addition, the upper width (W1) and upper thickness (T1), lower width (W2) and lower thickness (T2), height (H) and upper thickness (T1), lower width (W2) and upper thickness (T1), and lower thickness (T2) and upper thickness (T1) of the horse tooth corn were linear. Therefore, the upper thickness T1 can be used as the minimum particle diameter.
The shape of spherical cone corn is simpler than that of horse tooth corn, and requires three characteristic dimensional expressions. Two hundred spherical cone corn seeds were selected to obtain the dimensional statistics and to analyze the upper diameter (D1), lower diameter (D2), and height (H), respectively. From the results, the distribution of the three characteristic sizes of spherical cone corn satisfied the normal distribution. The relationships between the lower diameter (D2) and the upper diameter (D1), the height (H), and the upper diameter (D1) of the spherical cone corn were fitted by linear regression. There was a linear relationship between the lower diameter (D2) and the upper diameter (D1) and between the height (H) and the upper diameter (D1) of the spherical cone corn. Thus, the upper diameter (D1) can be used as the minimum particle diameter.
Spherical corn is more straightforward than horse tooth and spherical cone corn and requires one feature size expression. Two hundred spherical cone corn seeds were selected separately to obtain the diameter (D) size statistics. From the results, the characteristic size distribution of spherical corn satisfied the normal distribution.

2.1.3. Modeling Methods of Corn Seeds

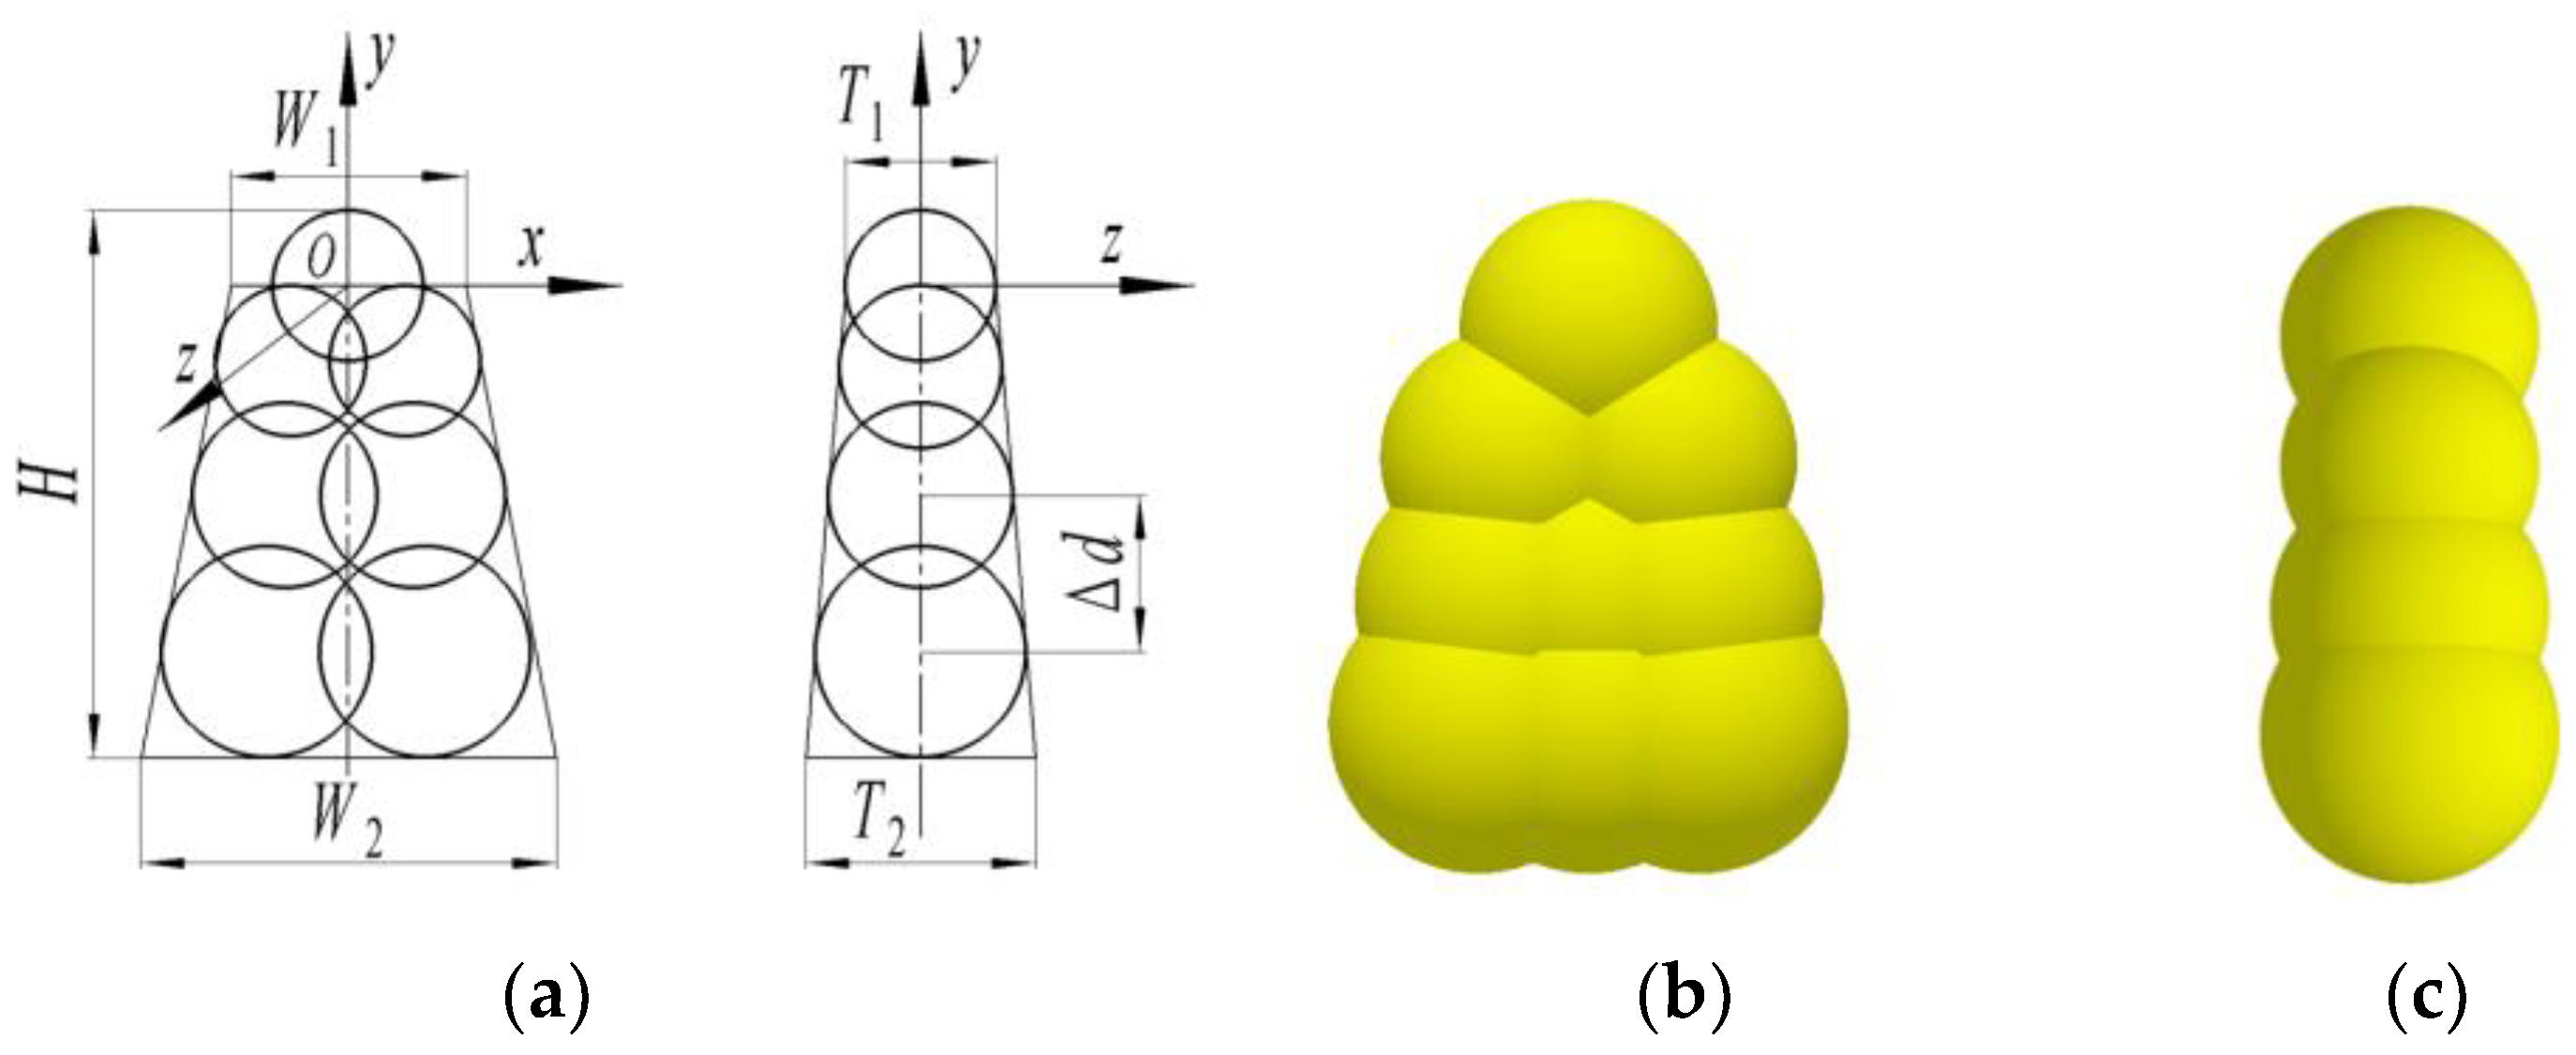
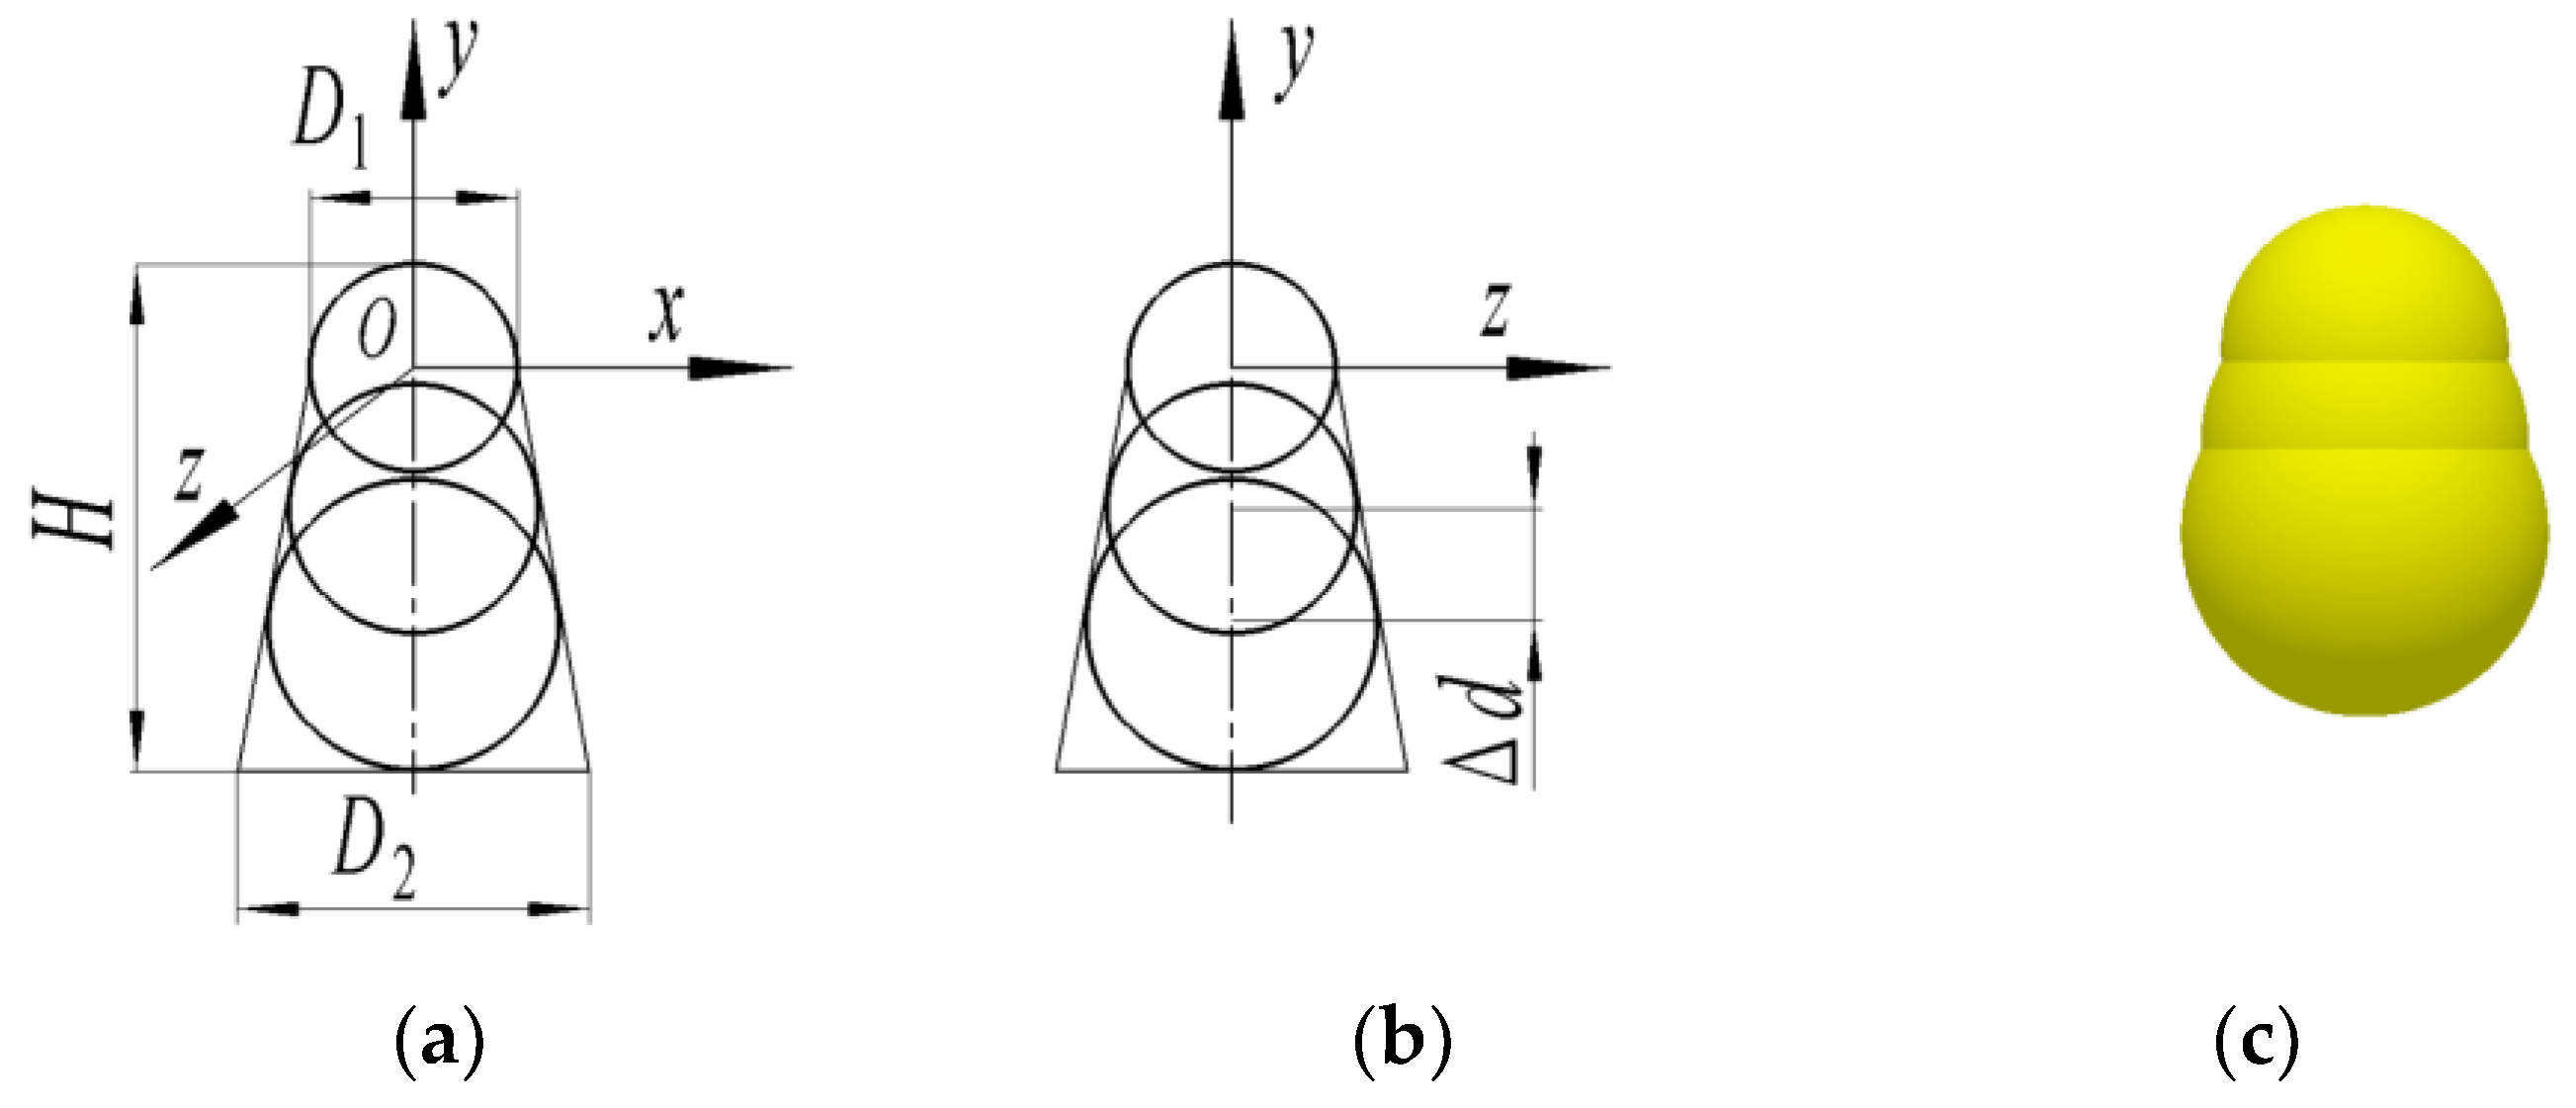
Based on the statistical results of corn seed shape and size, a discrete elements model for three typical shapes has been established [14]. To generate the models, the upper and lower thicknesses of the main dimensions of each of the three shapes, based on a positive-terrestrial distribution, were selected randomly, and then other feature dimensions were calculated on the basis of these dimensions. This produced a corn seed model with dimensions close to the actual shape and size distribution. Figure 4, Figure 5 and Figure 6 provide depictions of the shape, size, and particle filling methods for horse tooth, spherical cone, and spherical corn, respectively, with corresponding parameters for size calculation.
To determine the relationship between the minimum size of the horse tooth corn seed and the other dimensions, and to be able to conveniently use the EDEM software to generate a corn model with a certain relationship, the linear relationship between W1/T1, W2/T2, H/T1, H/T2, T2/T1 and T1 was fitted. Additionally, the significance of their differences was tested (F-test). The results are shown in Table 1.
As can be seen from Table 1, there is a significant linear relationship between W1/T1, H/T1 and T1, and between H/T2 and T2. Meanwhile, there are non-significant linear relationships between W2/T2 and T2, and between T2/T1 and T1. This indicates that the model for horse tooth corn seeds was established based on T1. The calculated parameters for the horse tooth corn seed model are presented in Table 2.
To determine the relationship between the minimum size of the horse tooth corn seed and the other dimensions, and to conveniently be able to use the EDEM software to generate a corn model with a certain relationship, the linear relationship between D2/D1, H/D1 and D1 was fitted. Additionally, their significance of the differences was tested (F-test). The results are shown in Table 3.
As can be seen from Table 3, there are non-significant linear relationships between D2/D1, H/D1 and D1. However, they can be used as a reference for modeling spherical cone maize seeds based on D1. The calculated parameters for the spherically shaped corn seed model are presented in Table 4.

2.2. Simulation Parameters

The model parameters have a significant influence on simulation results. Traditional methods for determining parameters include using values from the literature, direct measurement of seed characteristic parameters, calibration of one or several parameters using the volume method, and a combination of these methods [26]. Since grain moisture content and variety are both known to affect the parameters, the reference literature can be used as a reasonable rough estimate. Direct measurement of parameters can be time consuming and laborious, but yields more accurate results than the literature values [25]. Likewise, irregularly shaped seeds and unevenly distributed material constituents make it more difficult to directly measure parameters such as the coefficient of static friction, the coefficient of rolling friction, collision recovery coefficient, and the adhesion force between seeds. Therefore, they can be better obtained through volume calibration [27].
On the basis of the Hertz–Mindlin contact model, the simulation parameters of the corn model were divided into two categories: material property parameters and interaction parameters. The material property parameters consist of shape, size distribution, particle density, bulk density, Poisson’s ratio, and shear modulus. The interaction parameters include collision recovery coefficient, the coefficient of static friction, and the coefficient of rolling friction. Additionally, when the material is not highly compressed, the effective modulus has little effect on the flow behavior [5]. The corn simulation parameters are listed in Table 5 below.

Volume Distribution Analysis

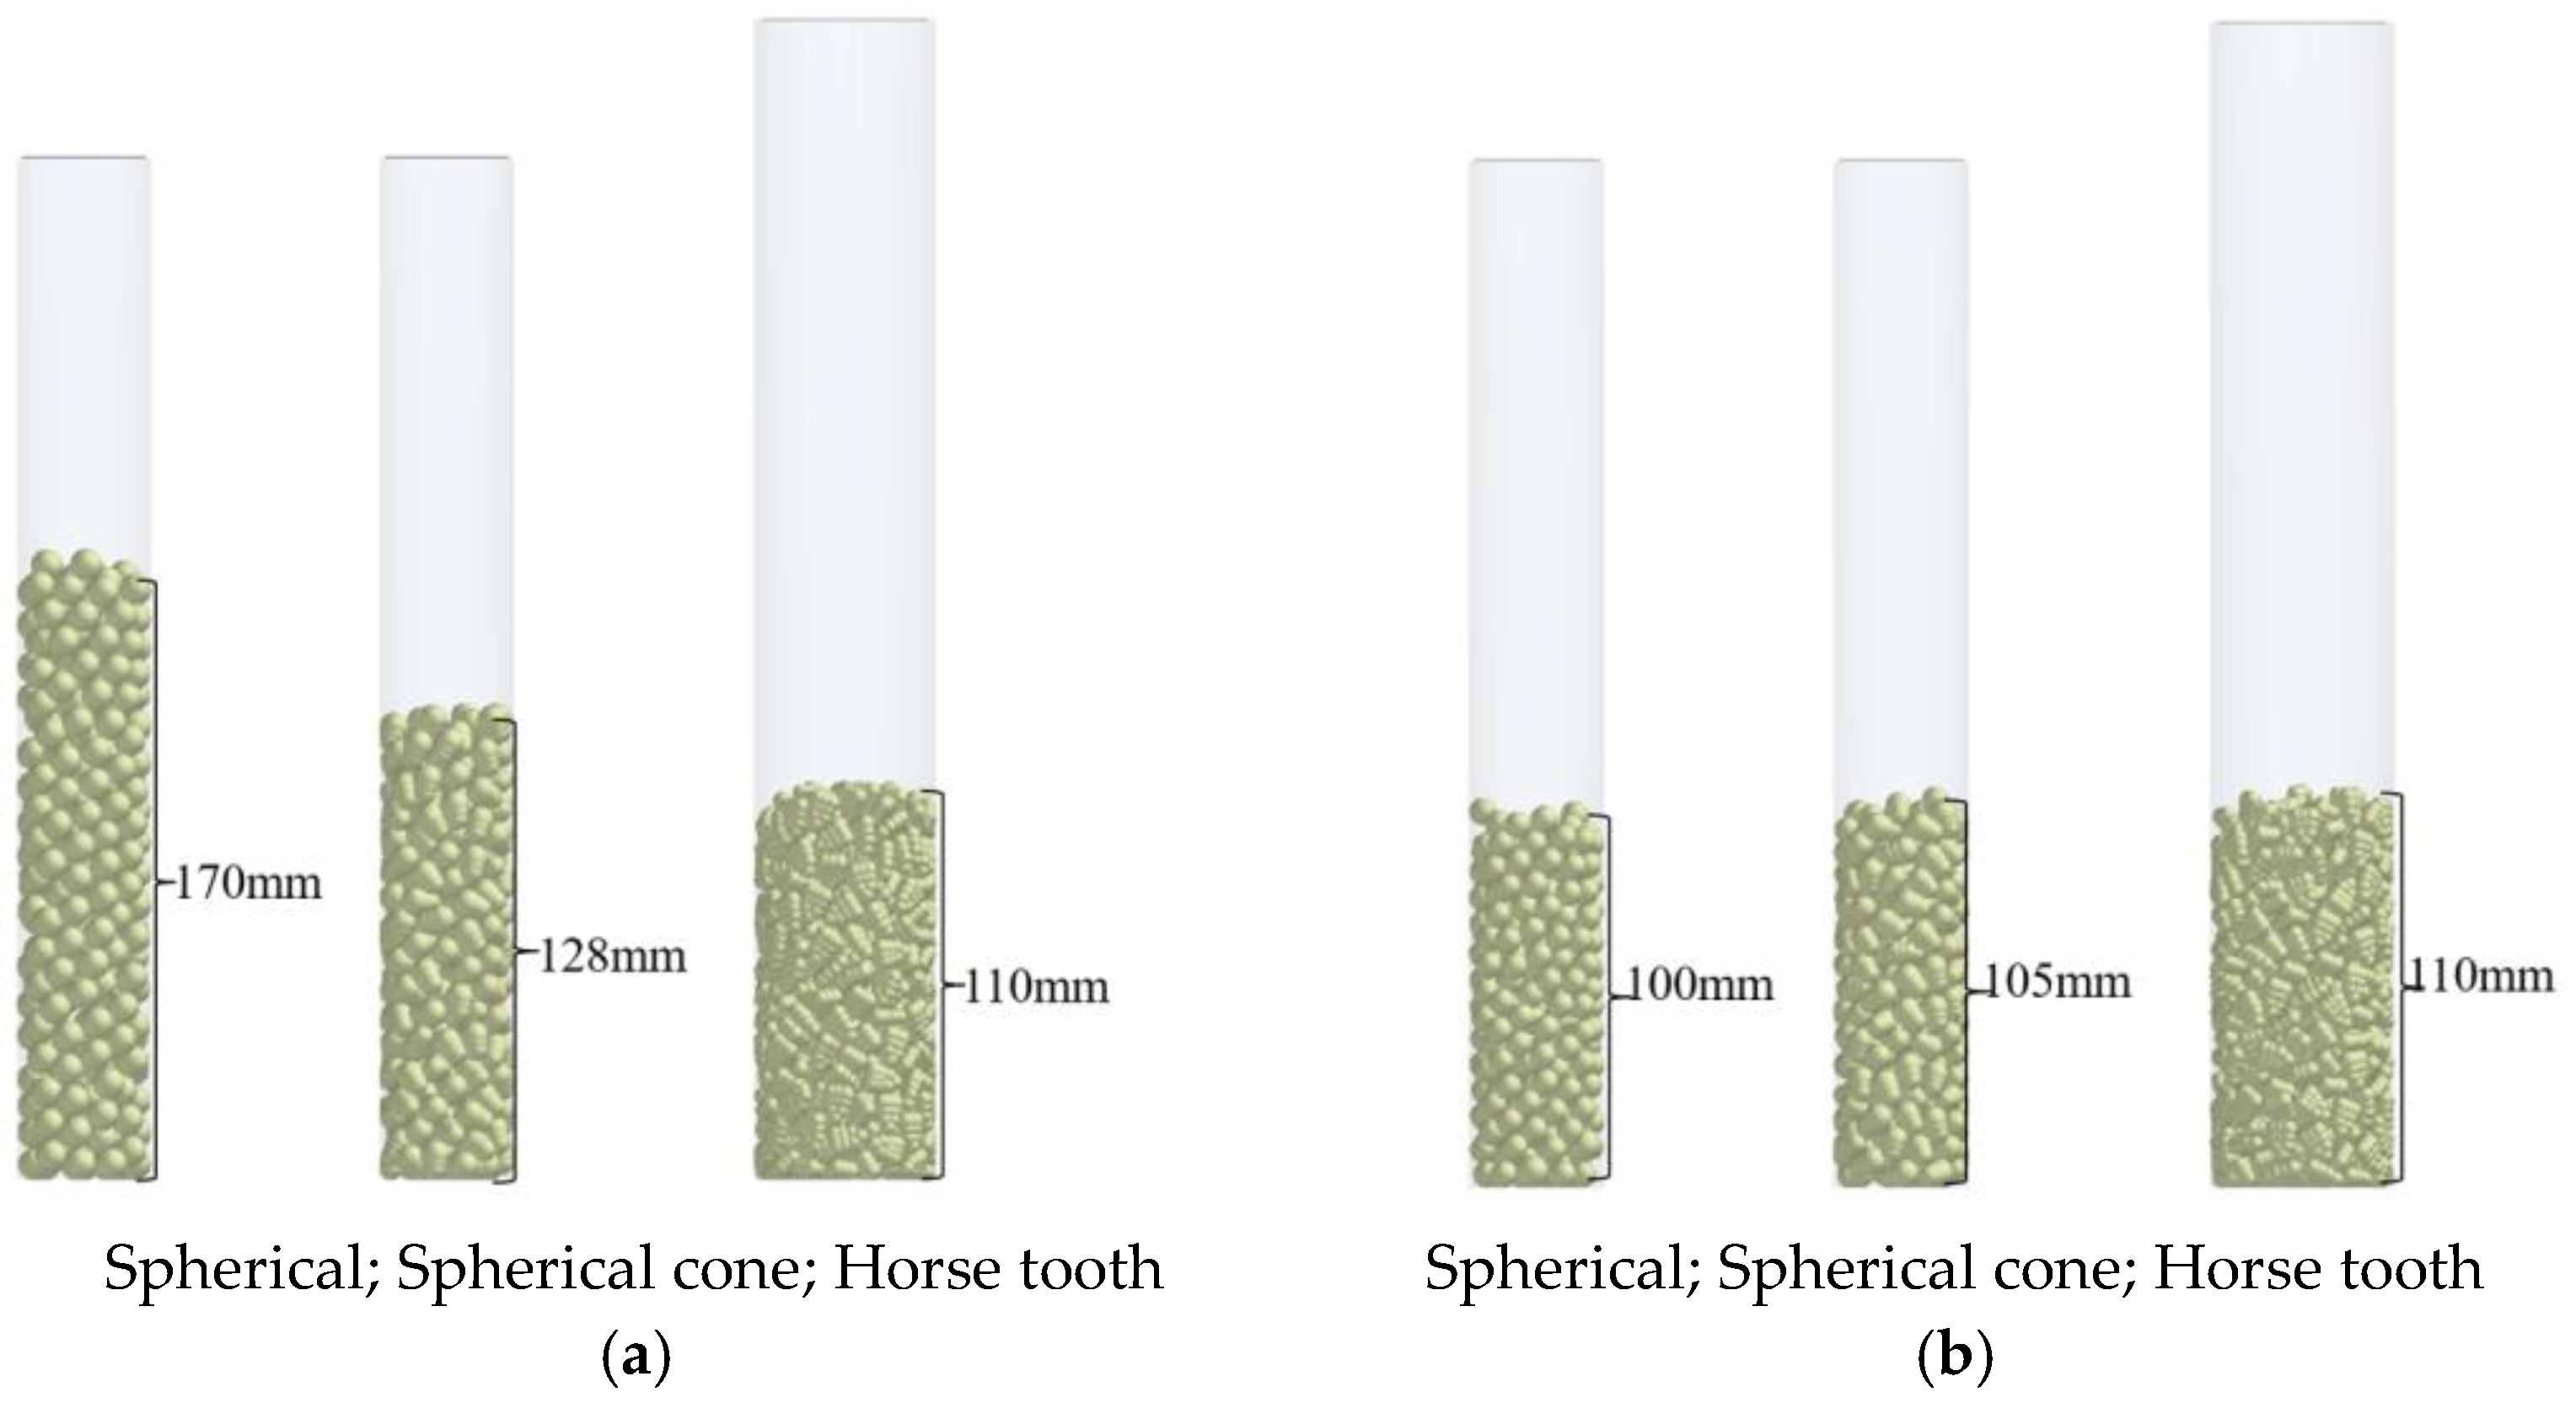
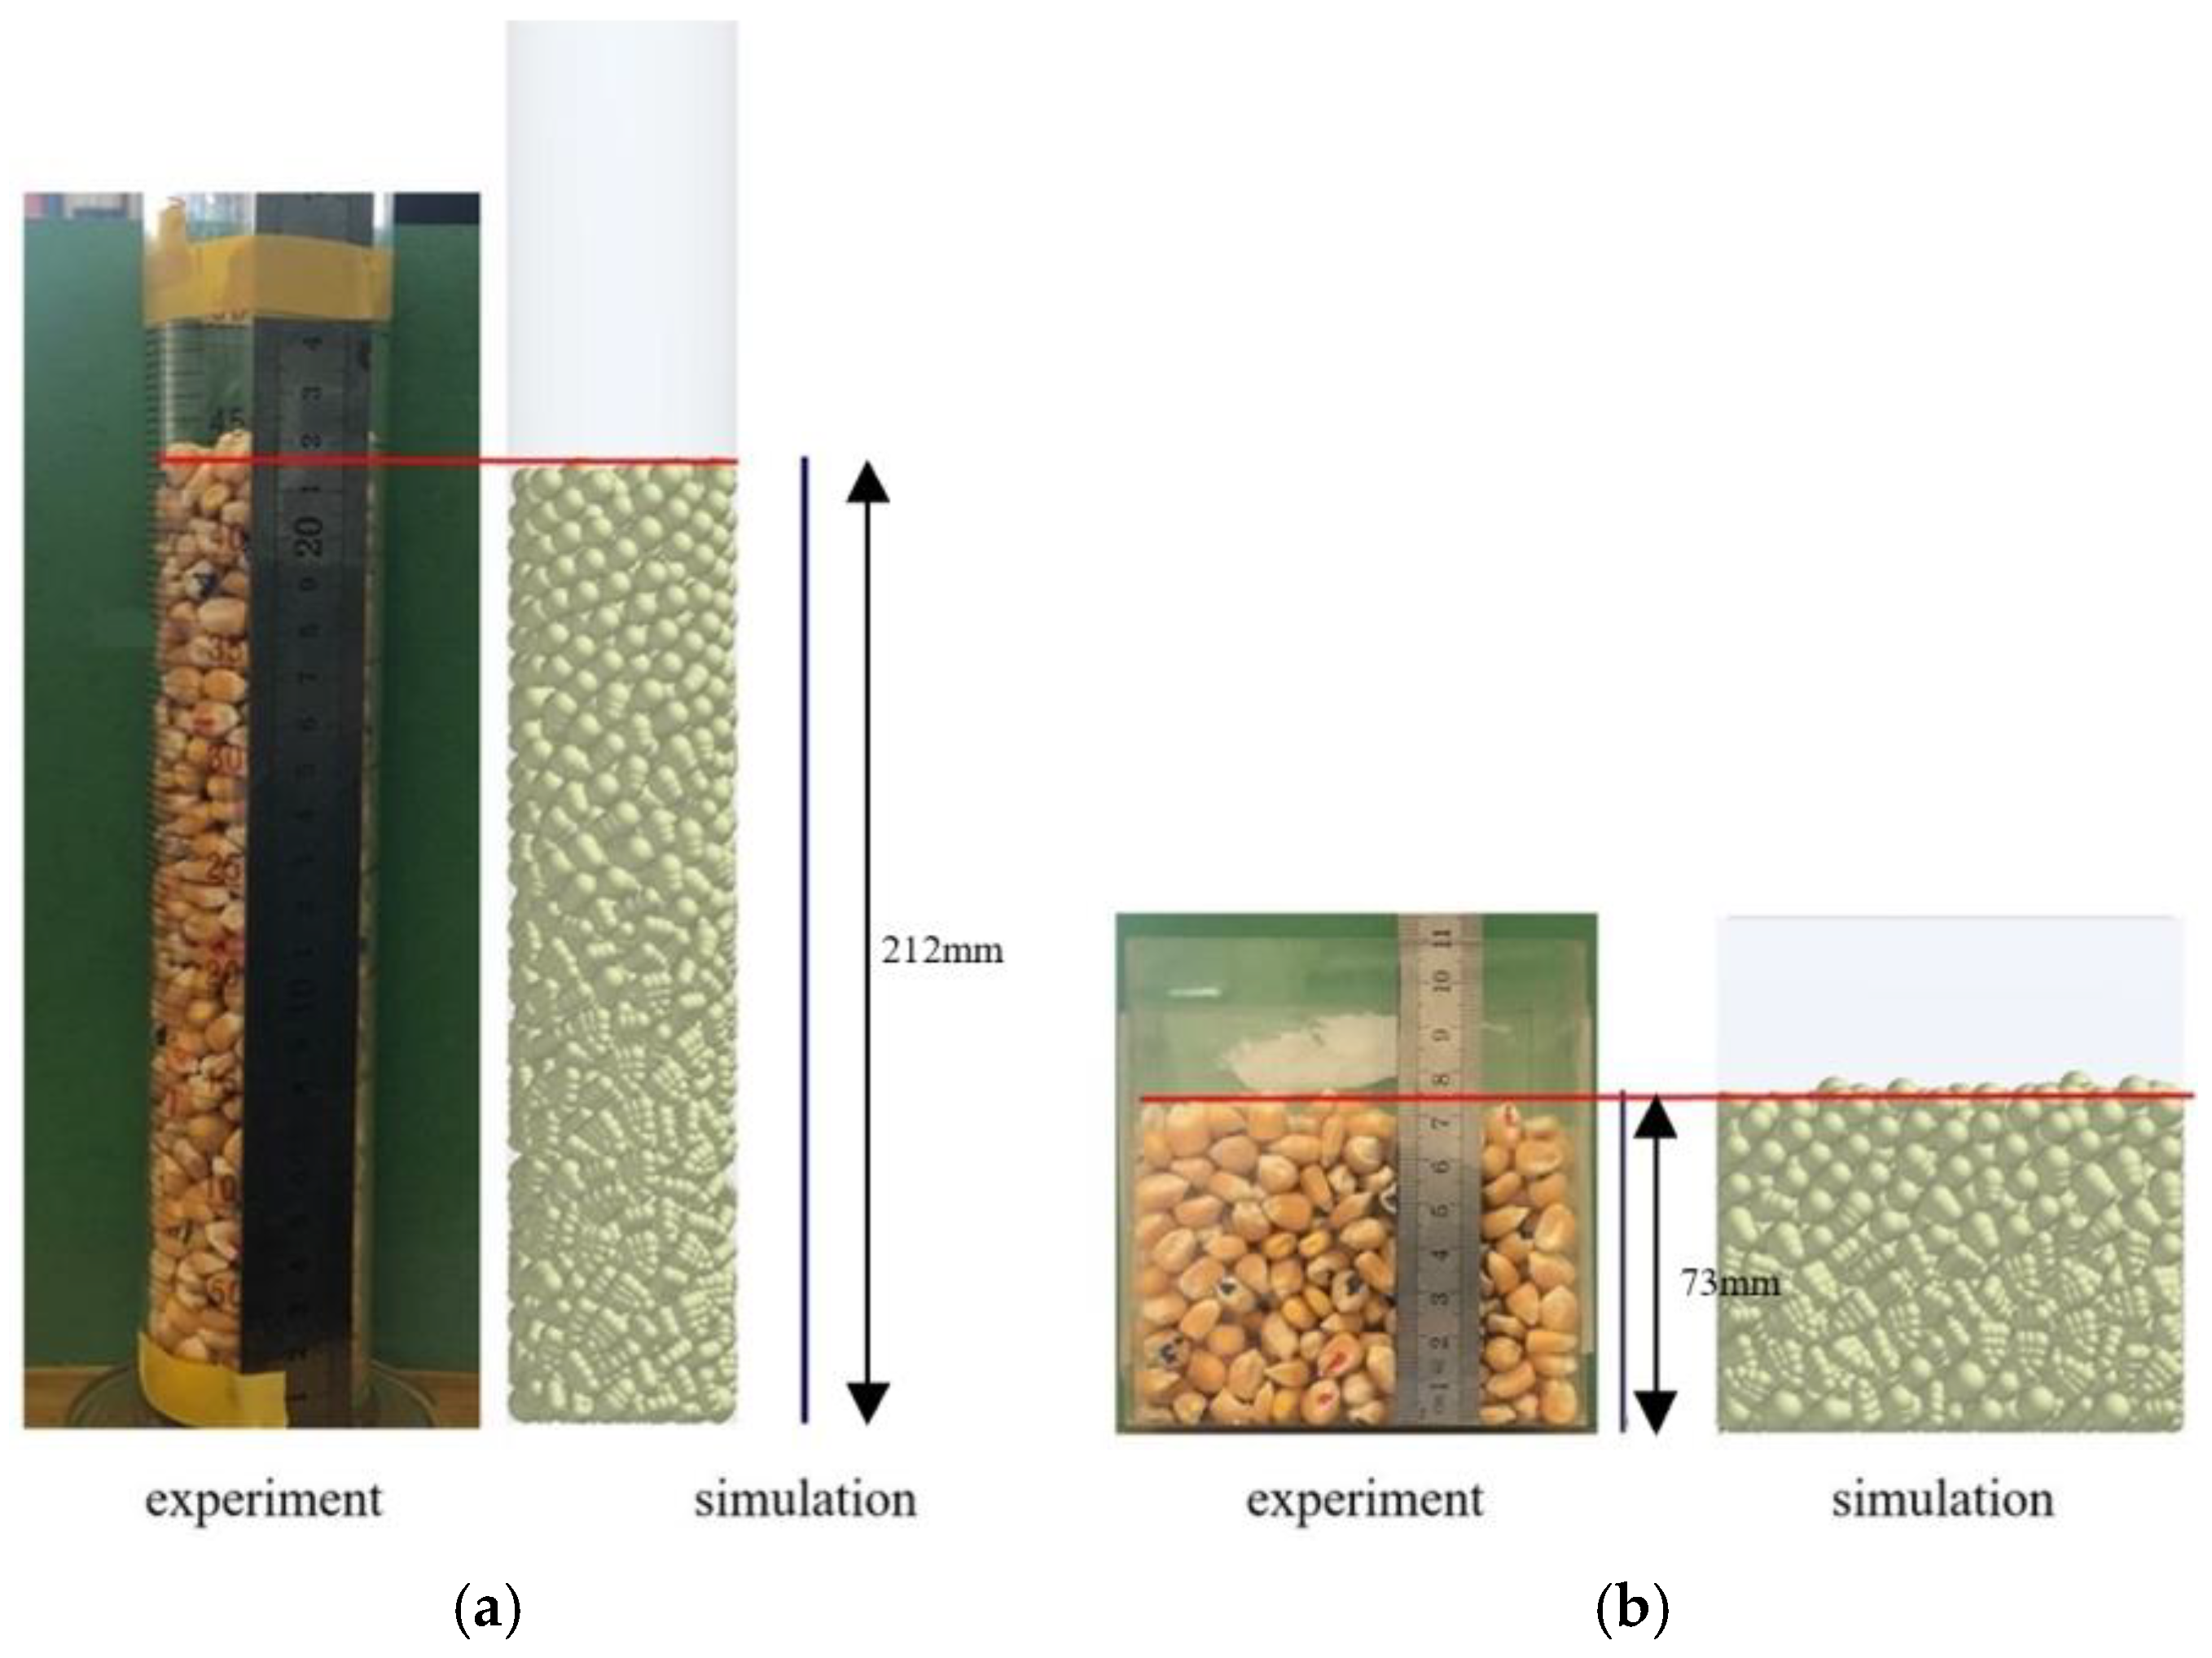
To make the simulation of the corn seeds more realistic, the bulk densities of the horse tooth, spherical cone, and spherical corn were calibrated to match the real-world volumes of the seeds. To accurately estimate the volume of the corn, 250 mL and 500 mL measuring cylinders were used (Figure 7). The height of the corn in the measuring cylinder was altered to generate the correct volume (Figure 8), and the change in volume with variance is shown in Figure 9. To further confirm the accuracy of the volume of the mixed corn seeds, horse tooth, spherical cone, and spherical corn were mixed in a 2:1:1.2 ratio and placed into a Plexiglas box (100 mm × 60 mm × 110 mm) (Figure 10). An aluminum cylinder (inner diameter × height: 54 mm × 300 mm) was used to compare their heights.
When the corn generation rate was 500 seeds/s, the horse tooth model was filled better than the spherical cone and spherical corn models. This finding is corroborated by Figure 9, which demonstrates that the mean values of the calibrated horse tooth corn size, the spherical corn size distribution, and the spherical corn size distribution were all 1, with respective standard deviations of 0.00, 0.10, and 0.15. Moreover, the simulated and actual filled heights were equal for the measuring cylinders and the Plexiglas boxes.
As the moisture content of corn influences its coefficient of static friction [31], it has a smaller effect on the coefficient of rolling friction. In this research paper, the contact parameters of corn seeds and the effect that their shape has on the coefficient of rolling friction are discussed. Sources from the relevant literature are primarily used to obtain information on static friction and the collision recovery coefficient. To focus on the influence of shape on the coefficient of rolling friction, a prediction is made for different corn shapes, including oblate and irregular. The results indicate that the angular architecture of corn has a higher coefficient of rolling friction than the other two architectures.

2.3. Prediction for the Coefficient of Rolling Friction

2.3.1. Repose Angle Determination of Corn Seeds

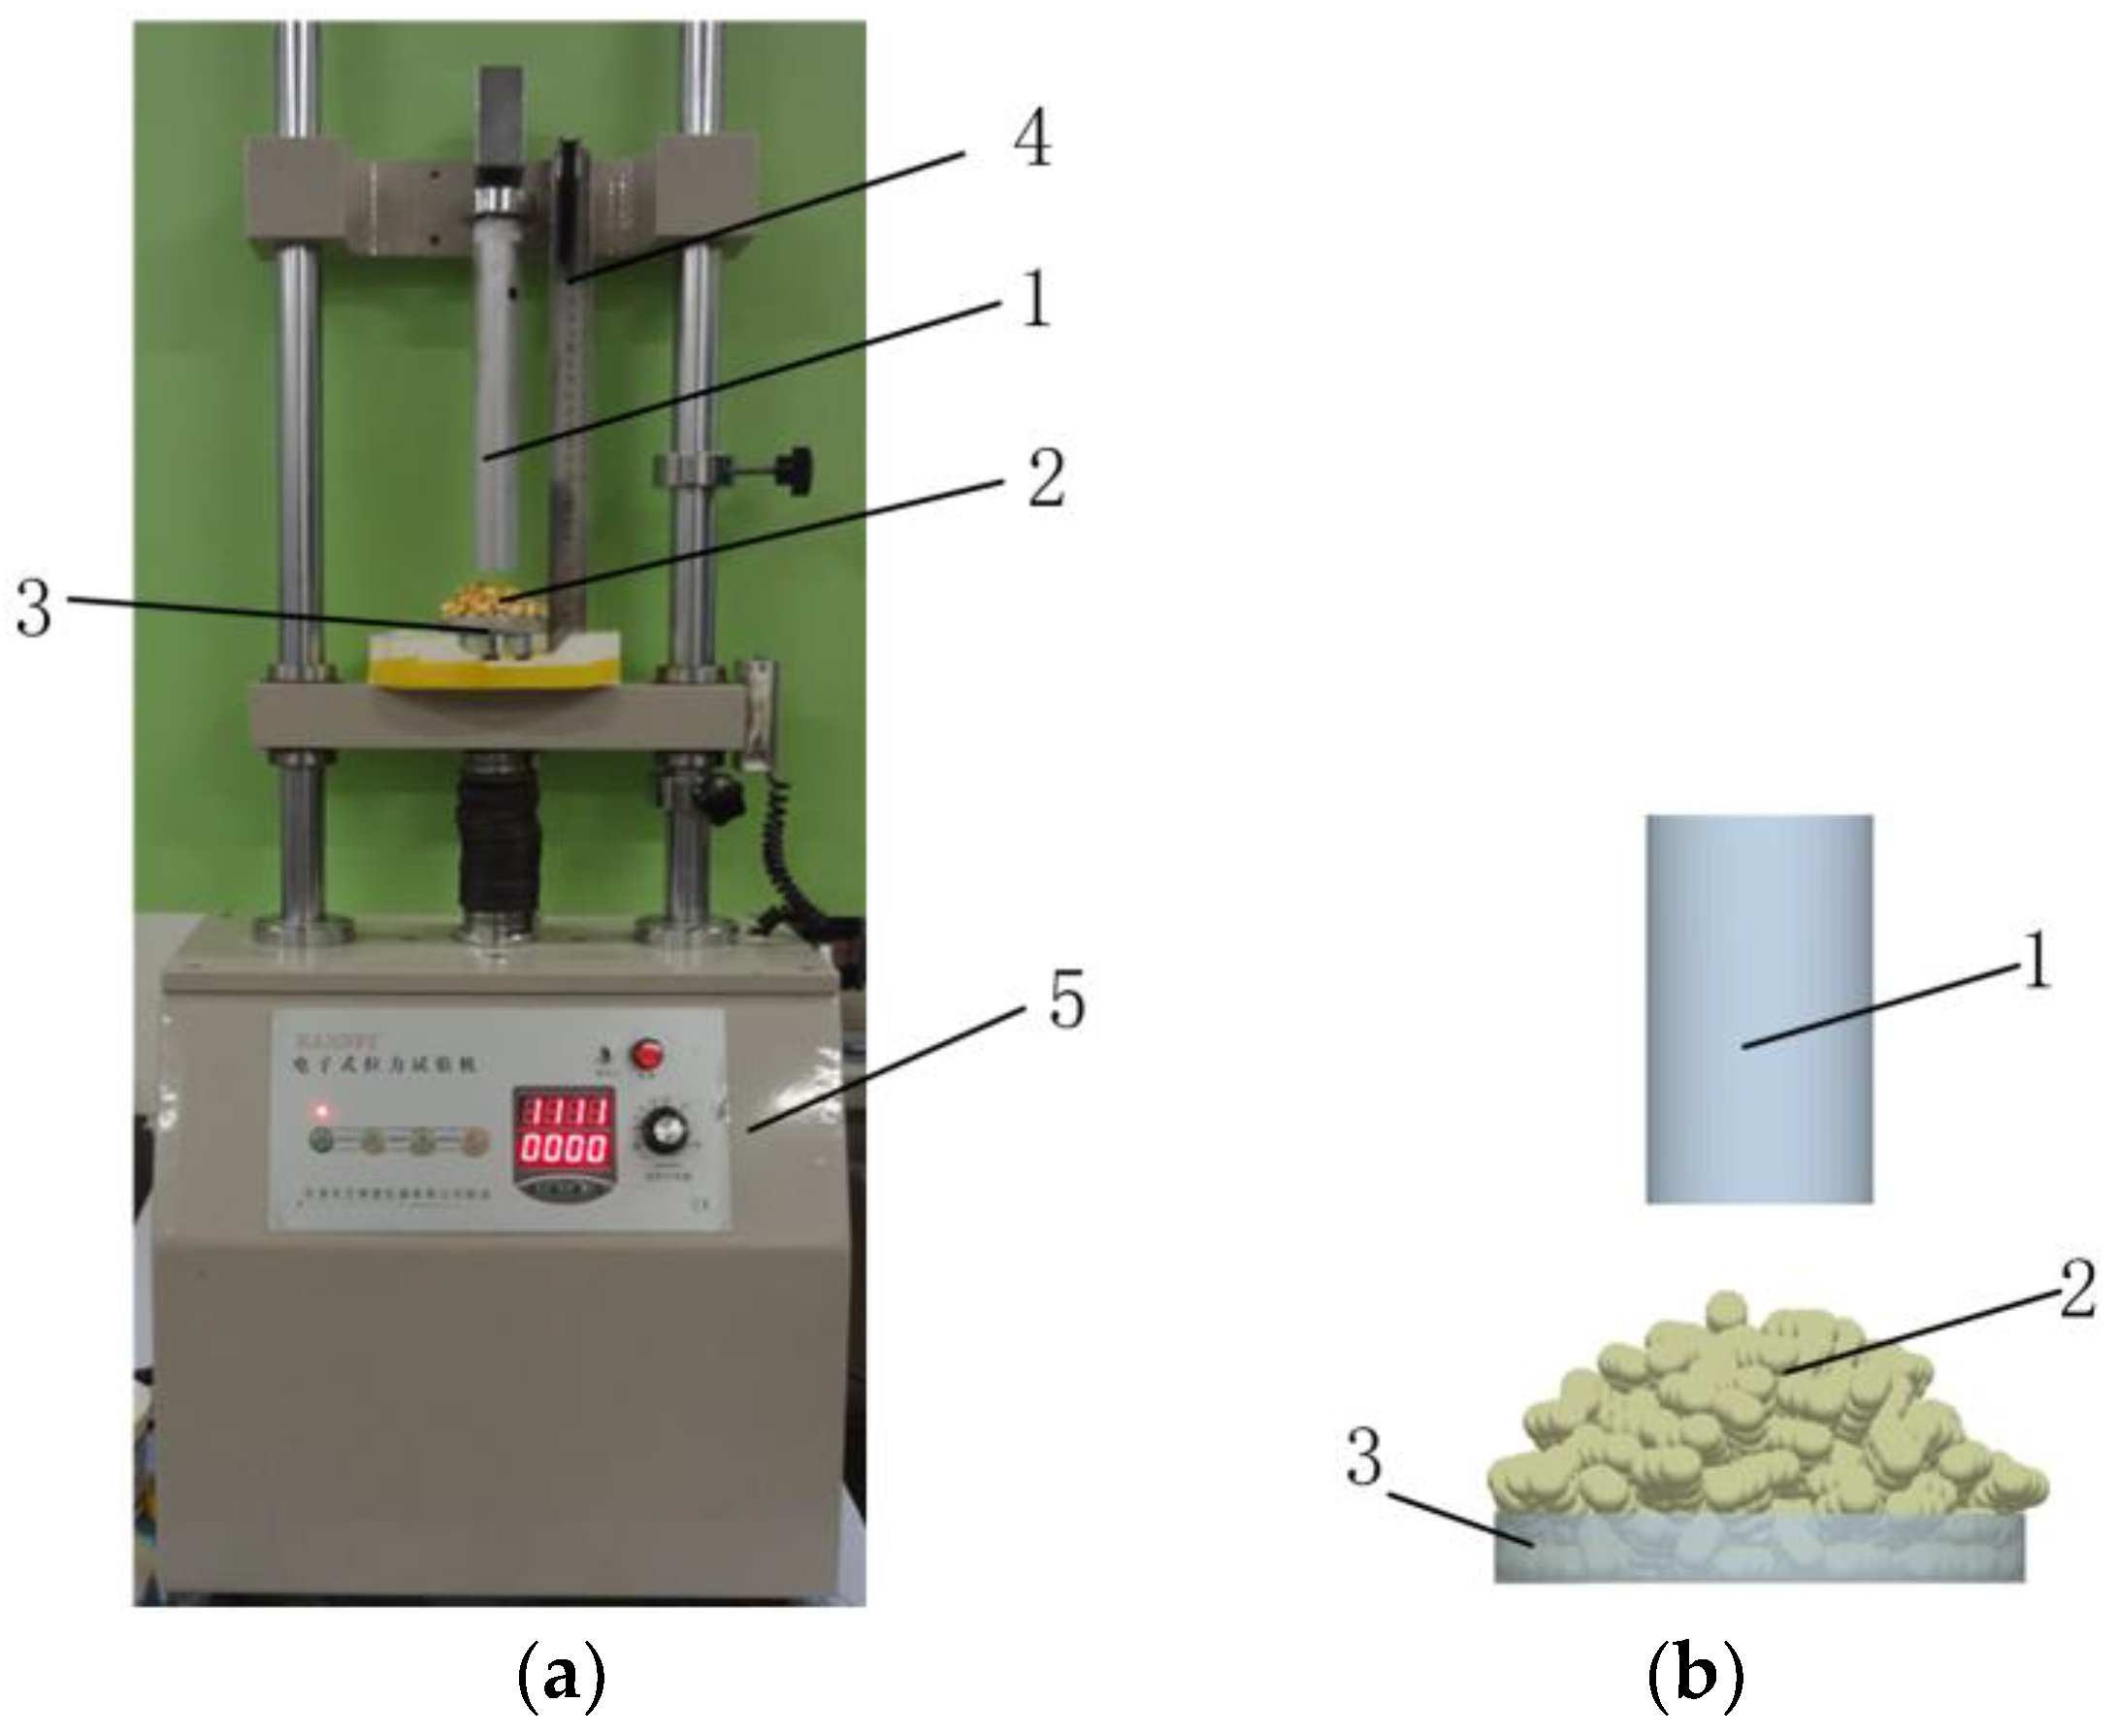
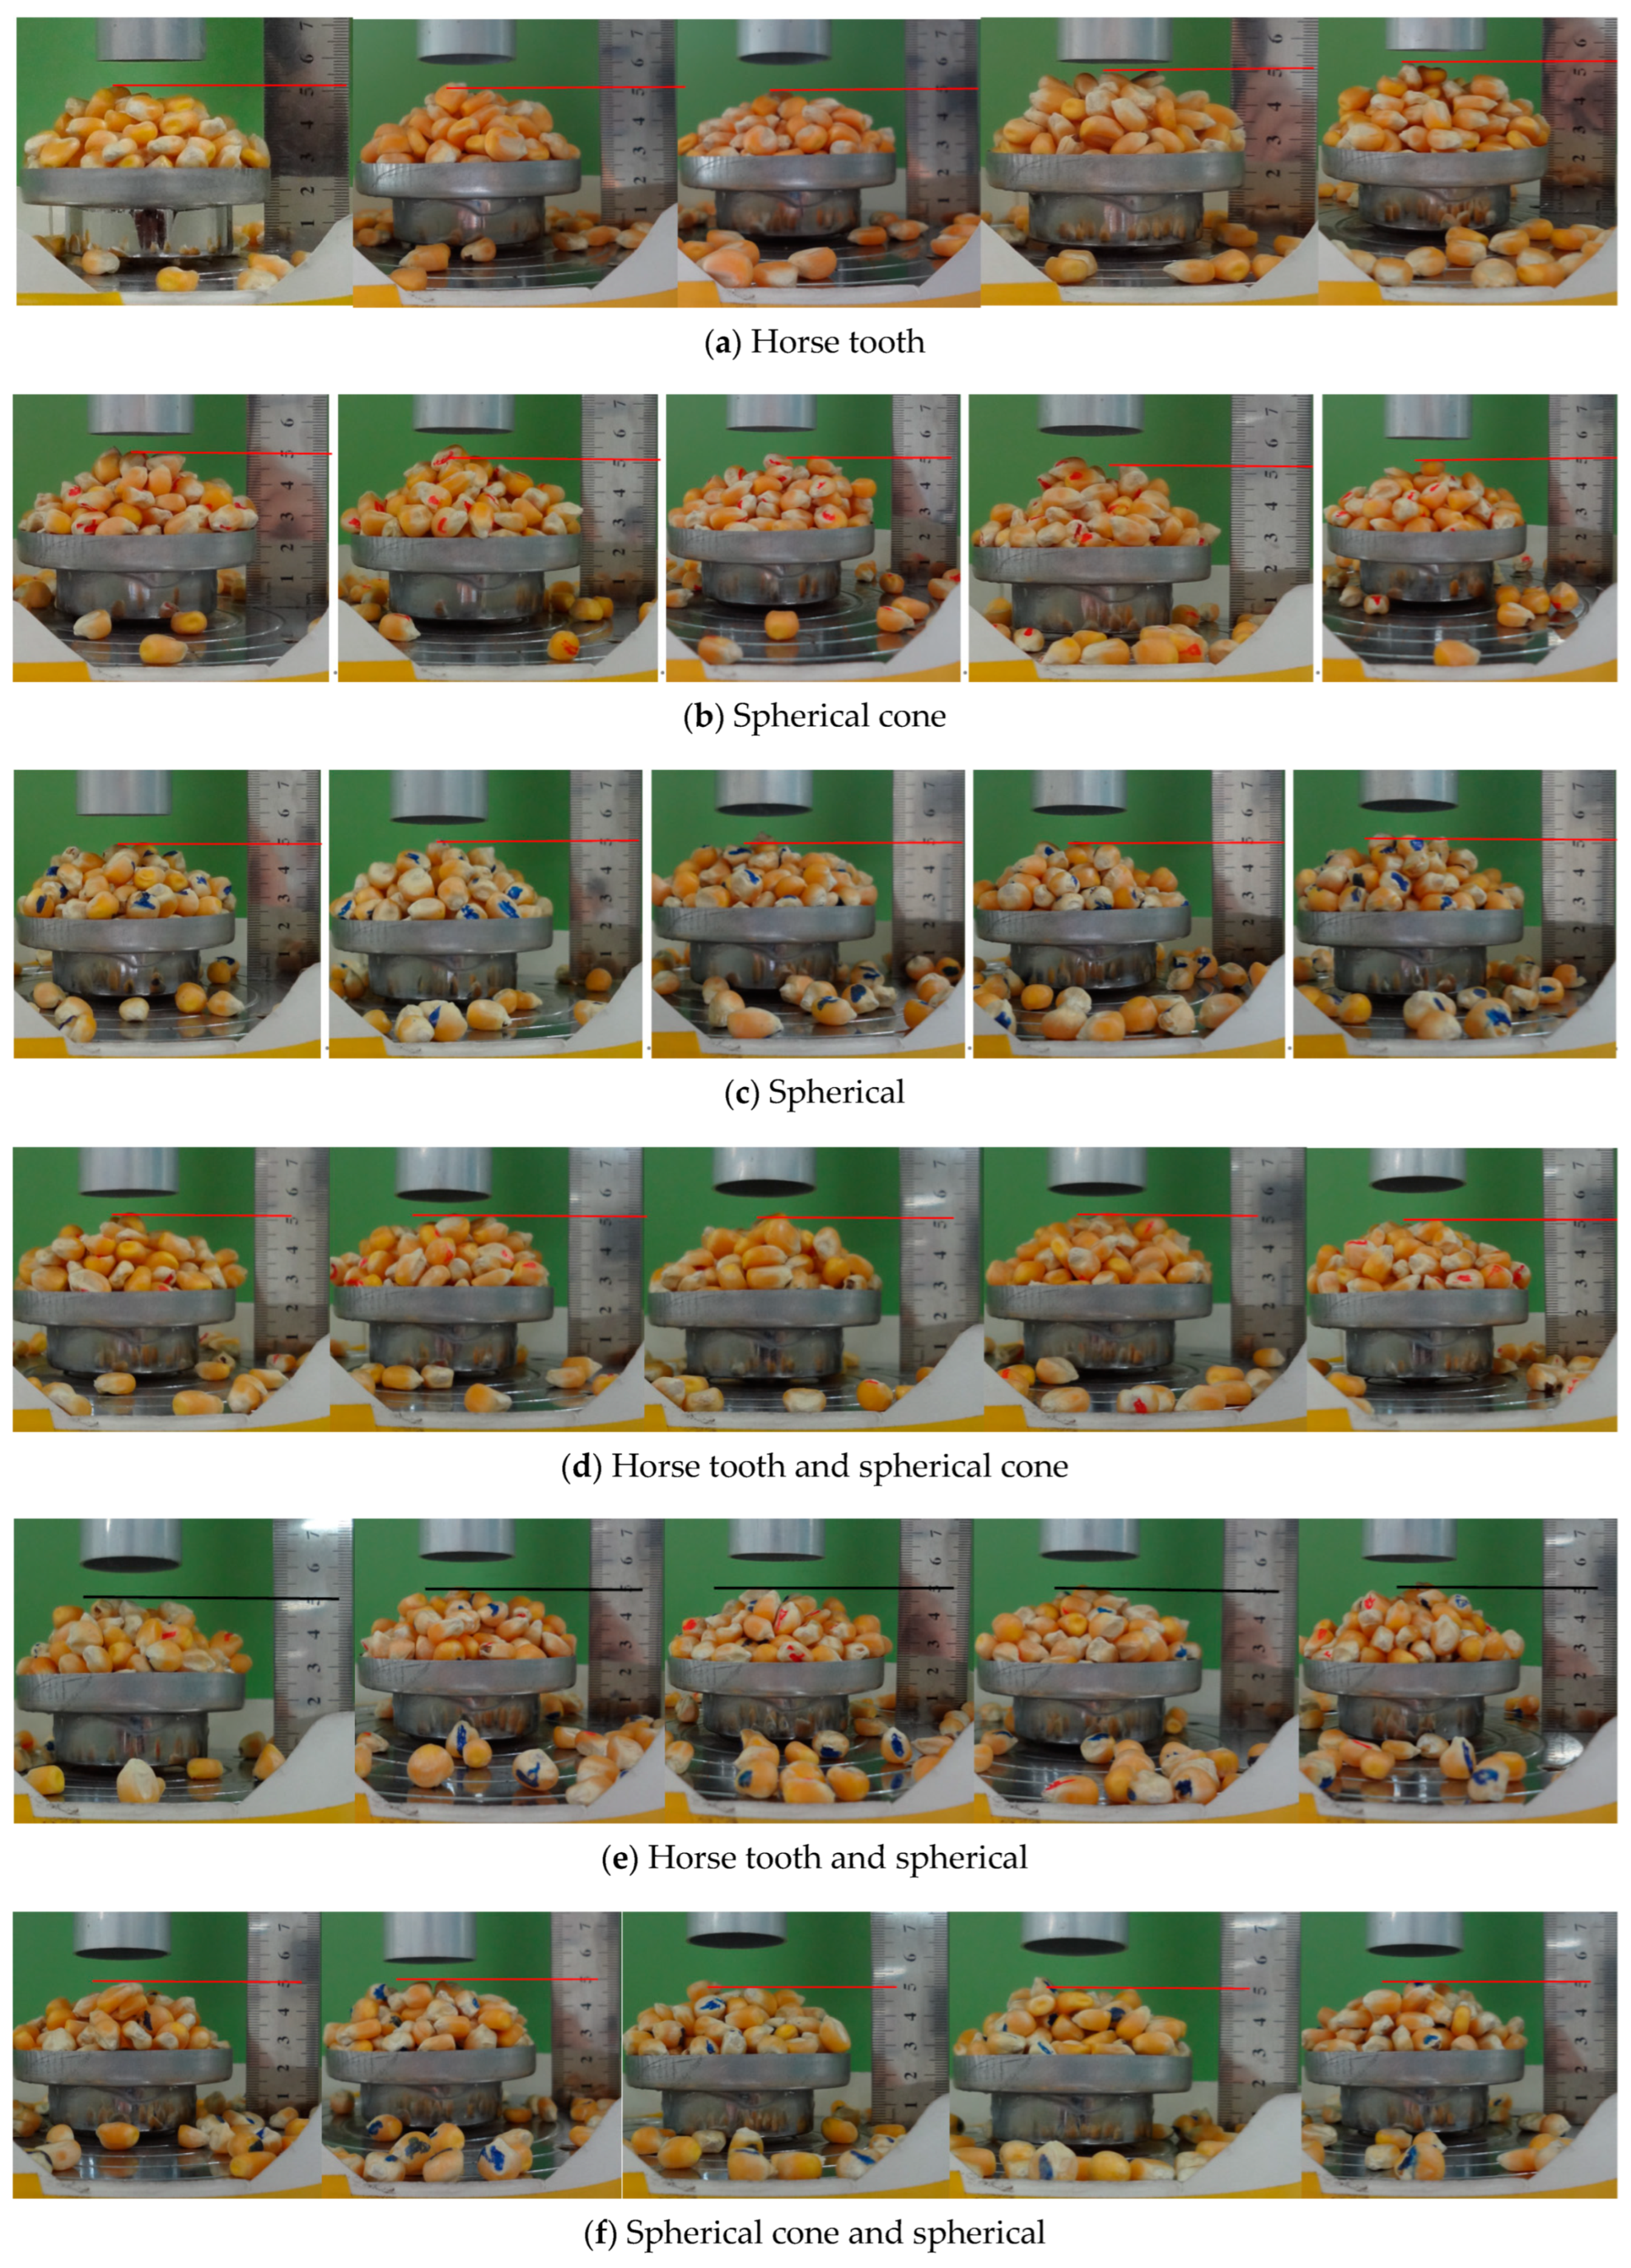
A digital display push–pull instrument was used to lift an aluminum cylinder with an inner diameter of 54 mm and a height of 300 mm, thus constituting the experimental apparatus for the corn pile-up angle and the repose angle, as shown in Figure 11. The diameter of the chassis was 70 mm and the depth was 9 mm. The pile-up angle size was determined by measuring its height. Single-shaped corn seeds (200 seeds) and mixtures of different types of seeds (100 grains of malleable and 100 of spherical cone, 100 grains of malleable and 100 of spherical, or 100 grains of spherical cone and 100 of spherical) were tested in five trials each to determine the repose angle, and the average was taken. The results of the measurements are shown in Figure 12 and Table 6.
From Table 6, it can be observed that the average heights of the repose angle formed by horse teeth, spherical cone, and spherically shaped corn seeds in an aluminum cylinder were 34.13, 33.33 and 32.13 mm, respectively. It can also be seen that the height of the angle tended to decrease with the transition from irregular to regular shapes. This suggests that the shape of the corn has a specific effect on macroscopic population volume.

2.3.2. Relationship between the Coefficient of Rolling Friction and the Height of Repose Angle

Under the same conditions as the actual repose angle experiment, a simulation experiment model was established as shown in Figure 11b. The stacking was carried out by varying the coefficient of rolling friction of the simulated corn model and the height of repose angle was measured. The relationship between the coefficient of rolling friction and the height of repose angle for three common shapes of corn horse tooth, spherical cone, and spherical is demonstrated in Figure 13. Furthermore, the relevant data were tested for significance of differences (F-test).
The significance test analysis shows that the p-values for the differences between the height of the horse tooth spherical cone, the spherical corn model and the coefficient of rolling friction were 1.48 × 10⁻⁶, 2.47 × 10⁻⁶ and 2.79 × 10⁻⁷, respectively. When also considering R2, it was shown that the three linear regression equations fitted were able to effectively predict the coefficient of rolling friction for the single shape corn models.
In this simulation experiment, the repose angle of the corn model was made to be close to the actual repose angle by changing the coefficient of rolling friction. This ranged from 0 to 0.07, with four specific values (0, 0.01, 0.03, and 0.05). Equation (1) predicted this to be 0.003 for horse tooth corn. Equation (2) yielded a coefficient of rolling friction for the spherical cone corn of 0.004, whereas Equation (3) gave a coefficient of rolling friction of 0.037. The repose angles of corn seeds when the coefficient of rolling friction was changed from 0.01 to 0.07 were obtained by the simulation experiment.
y = 133.9x + 33.237
y = 78.814x +33.102
y = 182.5x + 25.325
where y is the height of the corn repose angle and x is the coefficient of rolling friction.
When the repose angle reaches 35 mm, the coefficients of rolling friction for the horse tooth, spherical cone, and spherical corn seeds were 0.013, 0.024, and 0.053, respectively, as shown in Equations (1)–(3). The higher coefficient of rolling friction for the spherical corn seeds suggests that non-spherical shapes constrain the rotation ability of the model. This suggests that the shape of the corn seeds affects the coefficient of rolling friction.

2.3.3. The Coefficient of Rolling Friction of the Mixed Corn Model

Figure 14 presents the relationship existing between the coefficient of rolling friction and the height of repose angle for three different corn seed shapes, mixed in pairs. Additionally, the significance of their differences (F-test) was tested.
The significance test analysis showed that the p-values for the difference between the height of horse tooth and spherical cone, horse tooth and spherical, spherical cone and spherical corn model and the coefficient of rolling friction were 2.37 × 10⁻⁷, 2.44 × 10⁻⁶ and 4.32 × 10⁻⁷, respectively. Considering also R2, it was shown that the three linear regression equations fitted were able to effectively predict the coefficient of rolling friction for the mixed-shape corn model.
During the simulation, the coefficient of rolling friction was set at specific levels for the three types of corn seed: the horse tooth, horse tooth and spherical, and spherical corn models. These values were 0.013, 0.024, and 0.053, respectively. Additionally, the coefficient of rolling friction varied between 0, 0.01, 0.03, and 0.05, depending on the pair of corn seed shapes being tested. To predict the coefficient of rolling friction using these seeds, equations were derived by fitting a straight line to the data points, as shown in Equations (4)–(6).
y = 191.53x + 33.441
y = 190.68x + 32.085
y = 157.63x + 30.203
The rolling friction coefficient between the horse tooth and spherical cone corn was estimated using Equations (4)–(6). The coefficients predicted using these equations were 0.004, 0.003, and 0.014, respectively, for the combination of the spherical cone and spherical corn. Surprisingly, the horse tooth and spherical corn were not significantly affected by changes in the rolling friction coefficient due to the fact that the non-spherical shape of the corn seeds hinders the formation of a repose angle on the surface.

3. Results and Discussion

Our findings confirm the applicability of our modeling method for corn seeds, and demonstrate the value of the predicted coefficients of rolling friction. On the basis of our simulations and experiments, we were able to refine our models and better understand the complexities of corn seed behavior.

3.1. Slump Stacking Experiment

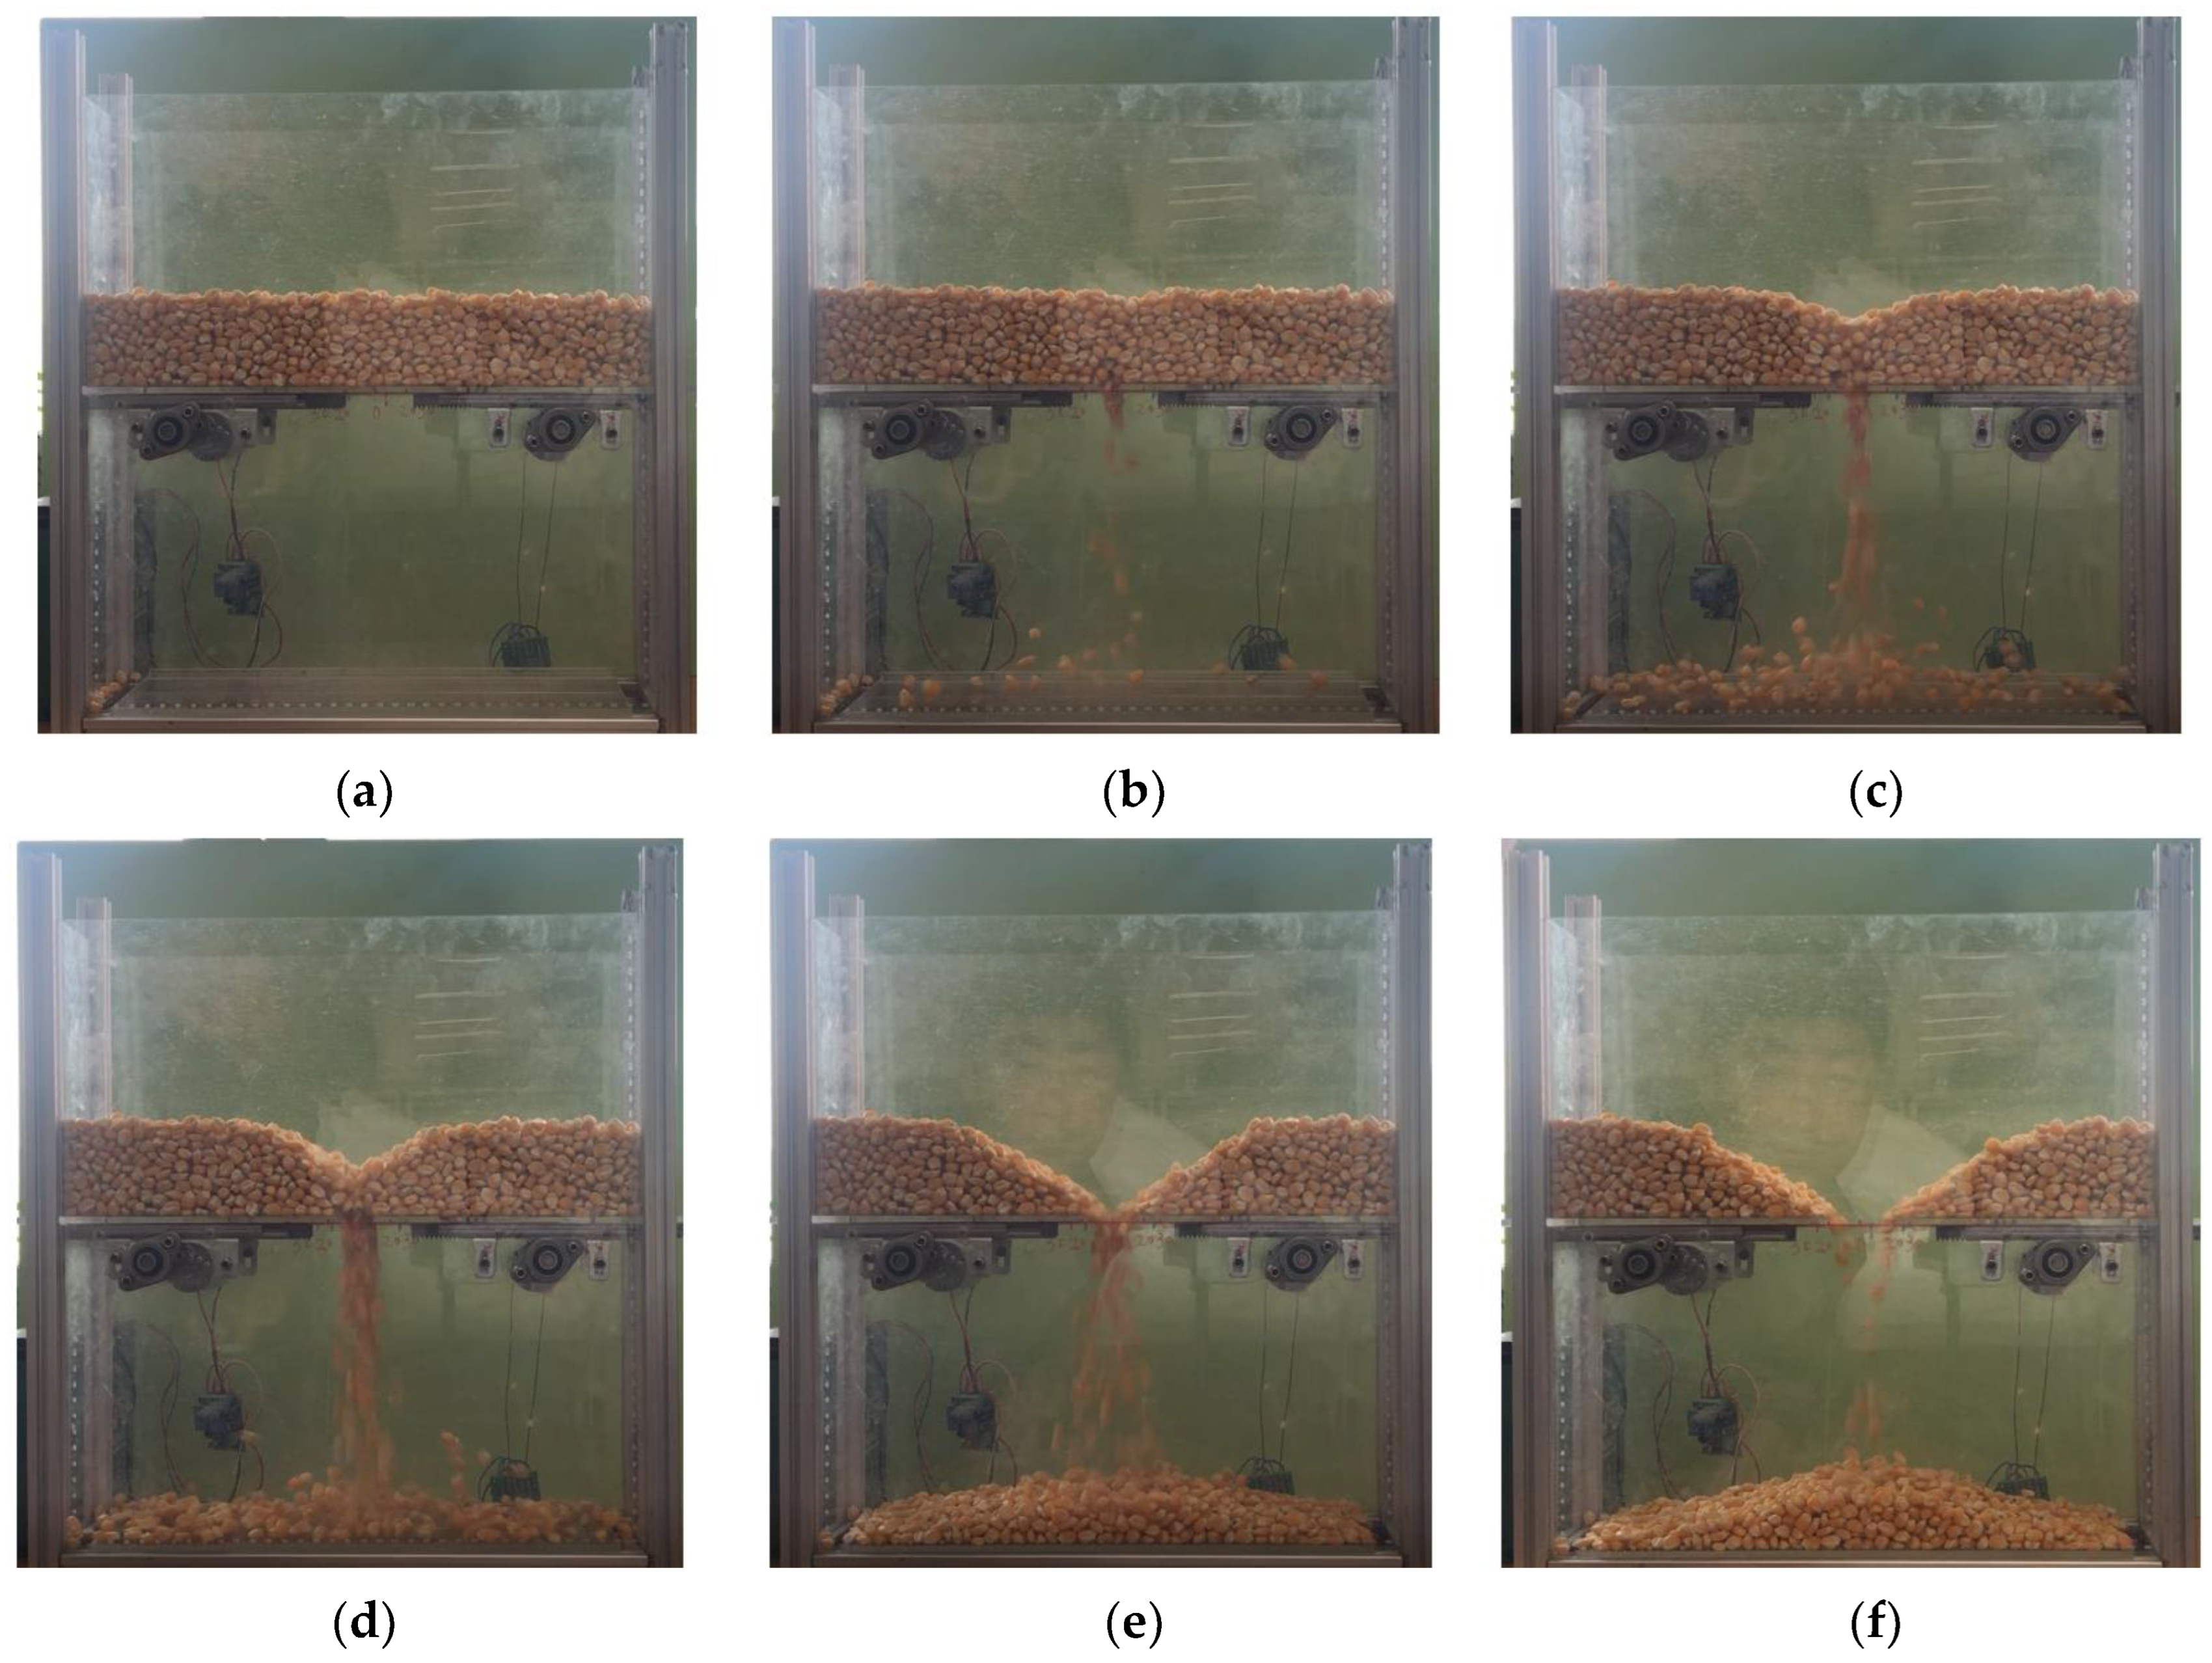
Rectangular Plexiglas stacking corners were used to create containers for corn seed stacking experiments. The corn collapse pile-up experiment container consisted of an upper and lower container separated by a moving plate. The upper container stored corn seeds and formed corn pile-up angles, while the lower container collected any falling seeds. The composition and dimensions of the repose angle experiment apparatus are displayed in Figure 15a. To minimize human error, the moving plate was powered by a gear driven by the drive motor to open and close it. The experiment was conducted five times. Prior to the experiment, 2 kg of corn seeds were poured into the upper container, and the surface was flattened. During the experiment, a remote control was used to activate the wireless relay to turn on the power, and the motor drove the gear on the moving plate at a set speed of 3.33 mm/s. The corn seeds in the center lost support and started to fall and pile up, which was recorded using a high-speed camera phone. Each experiment was repeated five times to determine corn accumulation angles in the upper and lower regions, and the actual stacking process is shown in Figure 16.
The simulation experiment was also conducted five times. In the experiment depicted in Figure 16, the rectangular container’s moving plates slowly shifted to the sides. The small distance between the plates made it impossible for the corn seeds to penetrate, causing them to begin to fall downward, impacting the lower container when the distance became large enough to allow it. As the plates were further separated, V-shaped notches formed in the corn group in the upper container, implying that the corn on the upper side of the plates filled the missing corn below, extending to both sides. The mobile plate above the single measurement of the corn moved closer to the center from top to bottom as the corn lost its support. When the plates were stationary at 40 mm, corn continued to flow downward, forming three corn repose angles, as shown in Figure 16.
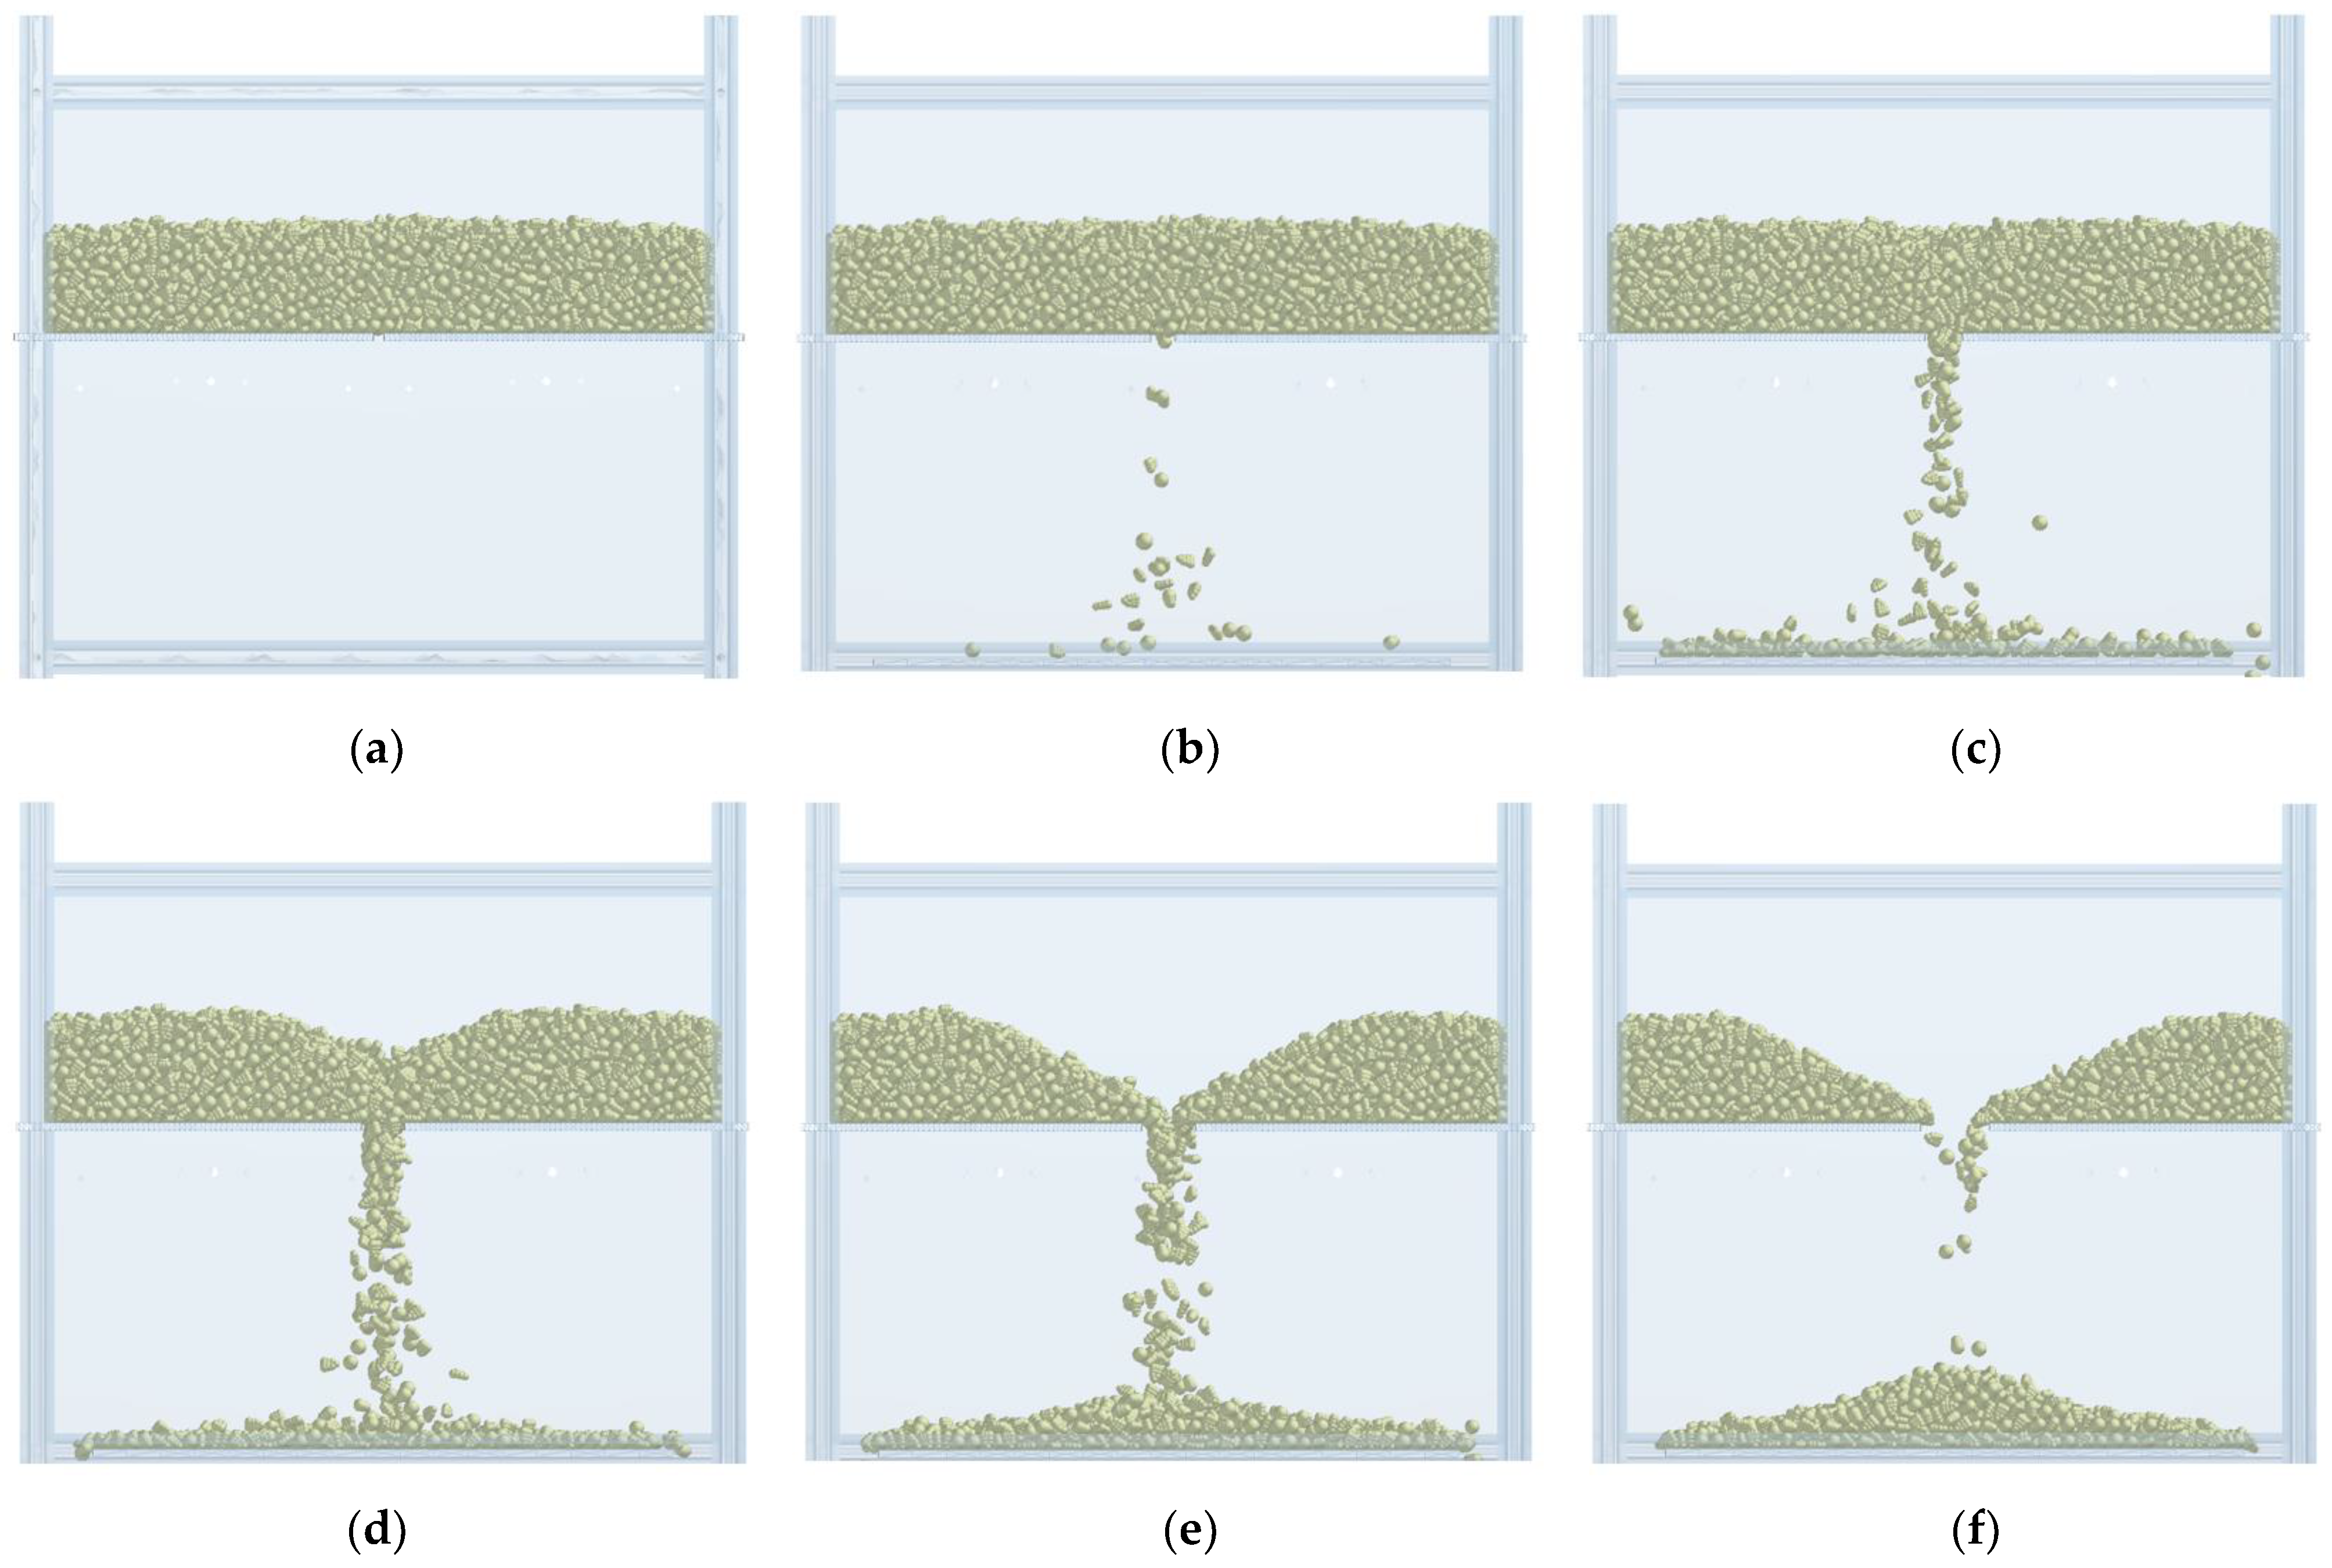
We established and calibrated three simplified models of corn using the coefficient of rolling friction, as well as other relevant parameters, as listed in Table 5. These models were used to simulate the corn stacking process under identical conditions, as illustrated in Figure 17.
When comparing the simulated and natural corn repose angle formation in Figure 16 and Figure 17, it was found in this study that the simulated corn formed similarly to natural corn in a rectangular container. The average repose angle values of the simulated and experimental groups were 26.29° and 26.48°, respectively. The relative error between them was only 0.72%, indicating that the simplified model of corn established in this study, along with the calibrated coefficient of rolling friction, could effectively simulate corn population behavior.

3.2. Stacking Experiment

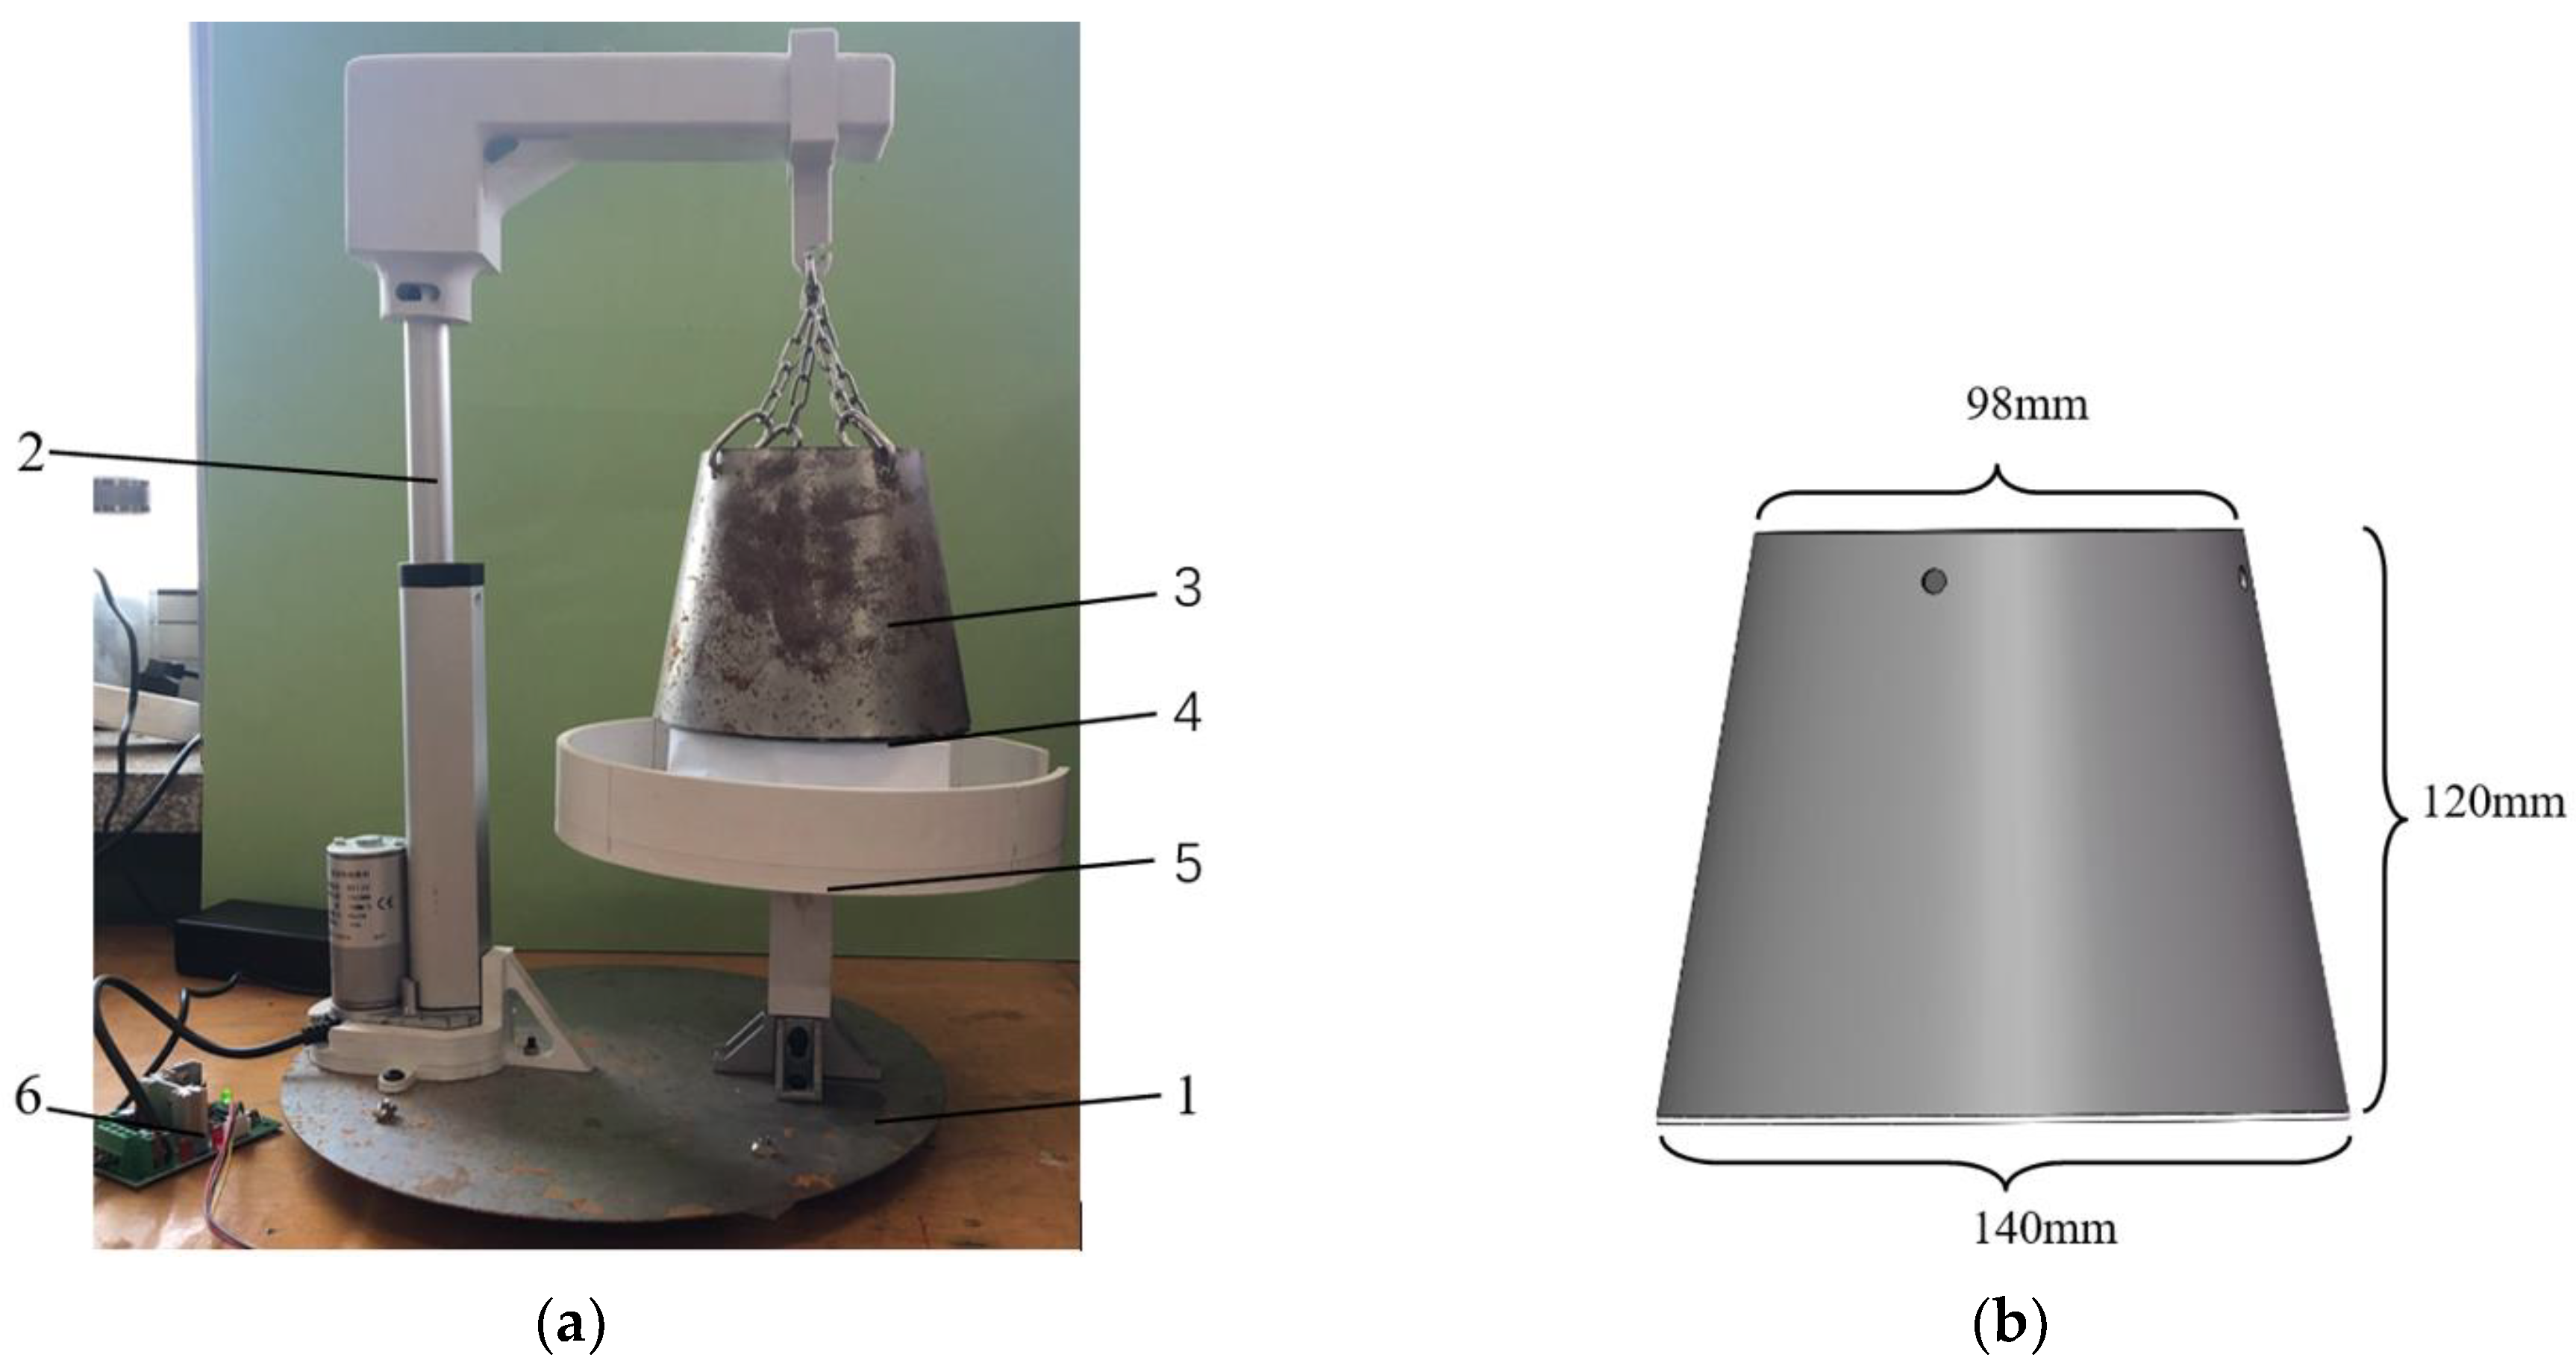
To further confirm the accuracy of the simplified corn model and its parameters, we utilized a cone table repose angle forming apparatus that we developed ourselves. This apparatus consisted of a support, a linear pusher, a cone table container, a stacking disk, a seed drop disk, and a commutation circuit. To minimize human error, the cone container was managed by a linear pusher, and lifted upward at a carefully regulated speed.
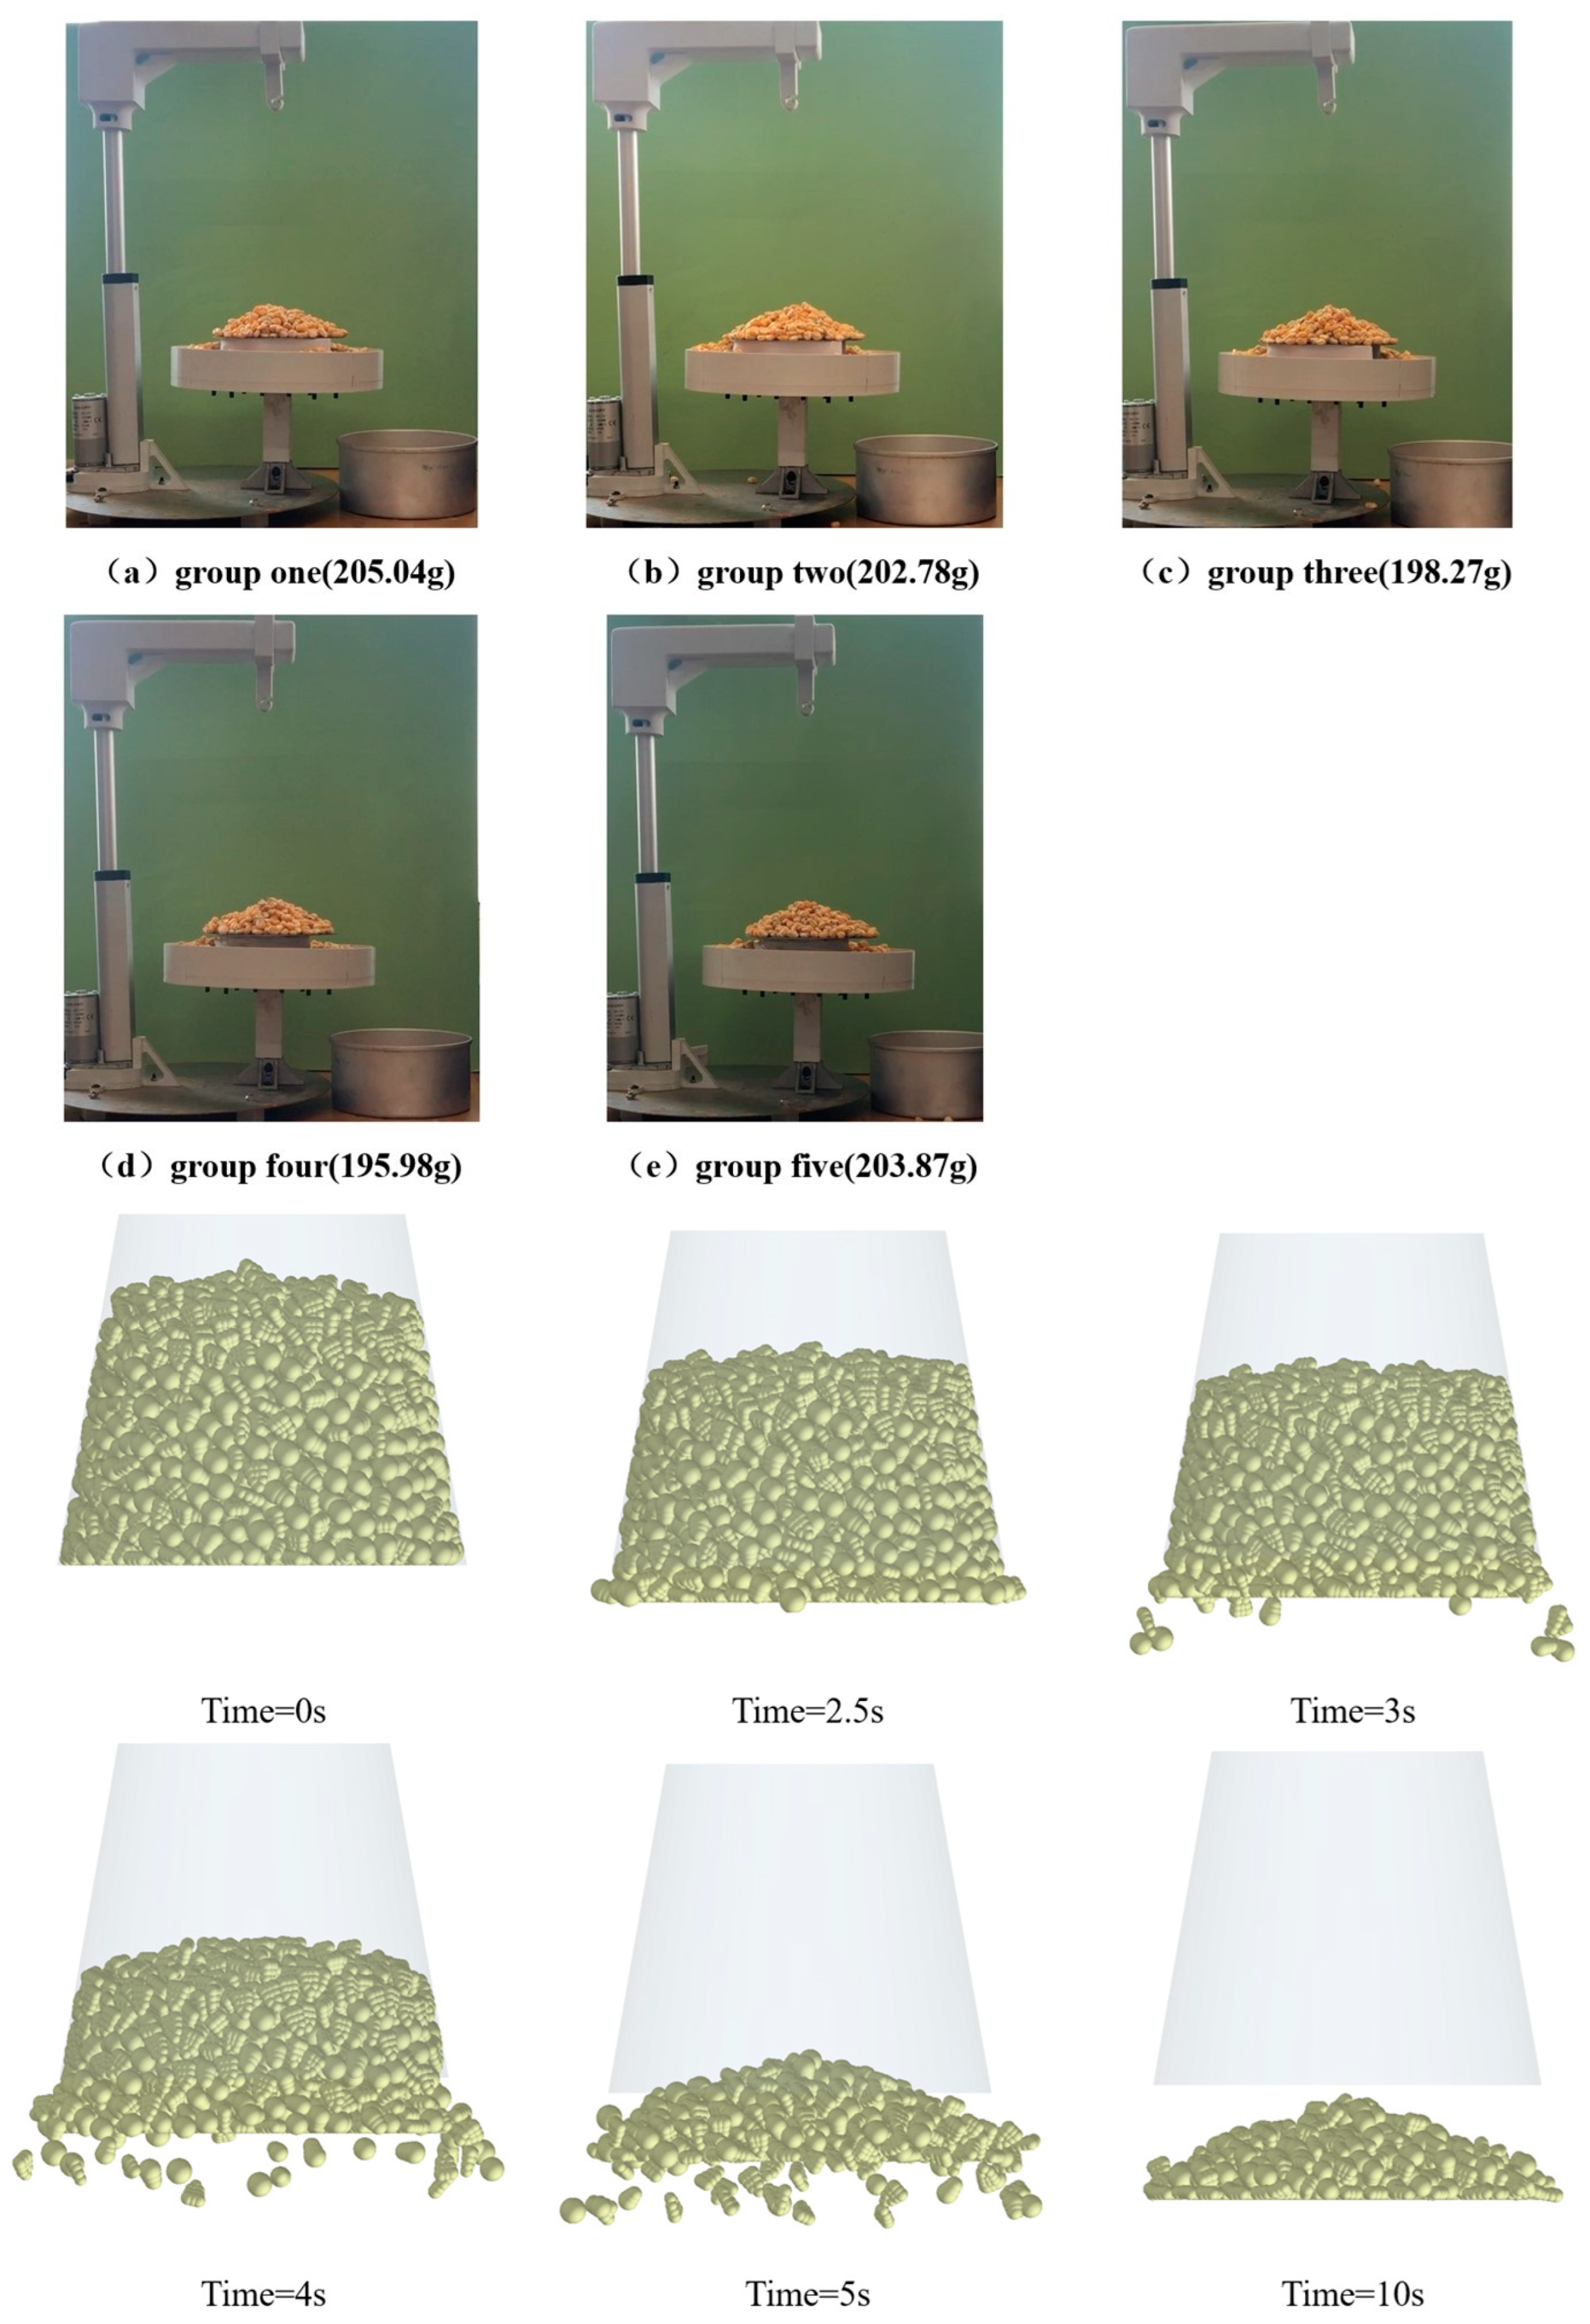
The cone container was practically sized, with an upper diameter of 98 mm, a lower diameter of 140 mm, and a height of 120 mm, as depicted in Figure 18. Before each experiment, 2 kg of corn seeds were carefully poured into the cone container. The commutation circuit was initiated, activating the linear pusher motor to lift the cone container at a speed of 3.33 mm/s, causing the corn seeds to fall and pile-up. Once the pile-up angle had stabilized, the cone container was removed, and the entire process was recorded with a high-speed camera. The pile-up angle that formed on the pile-up tray was measured, and the mass of corn dropped into the drop tray was weighed. The repose angles of corn in the five groups of experiments are shown in Figure 19.
To check the reliability of the simulated corn model and parameters by repose angle and weight, a simulated stacking of corn under the same conditions was carried out, and the simulated stacking process is shown in Figure 19. Five separate actual and simulation tests were carried out.
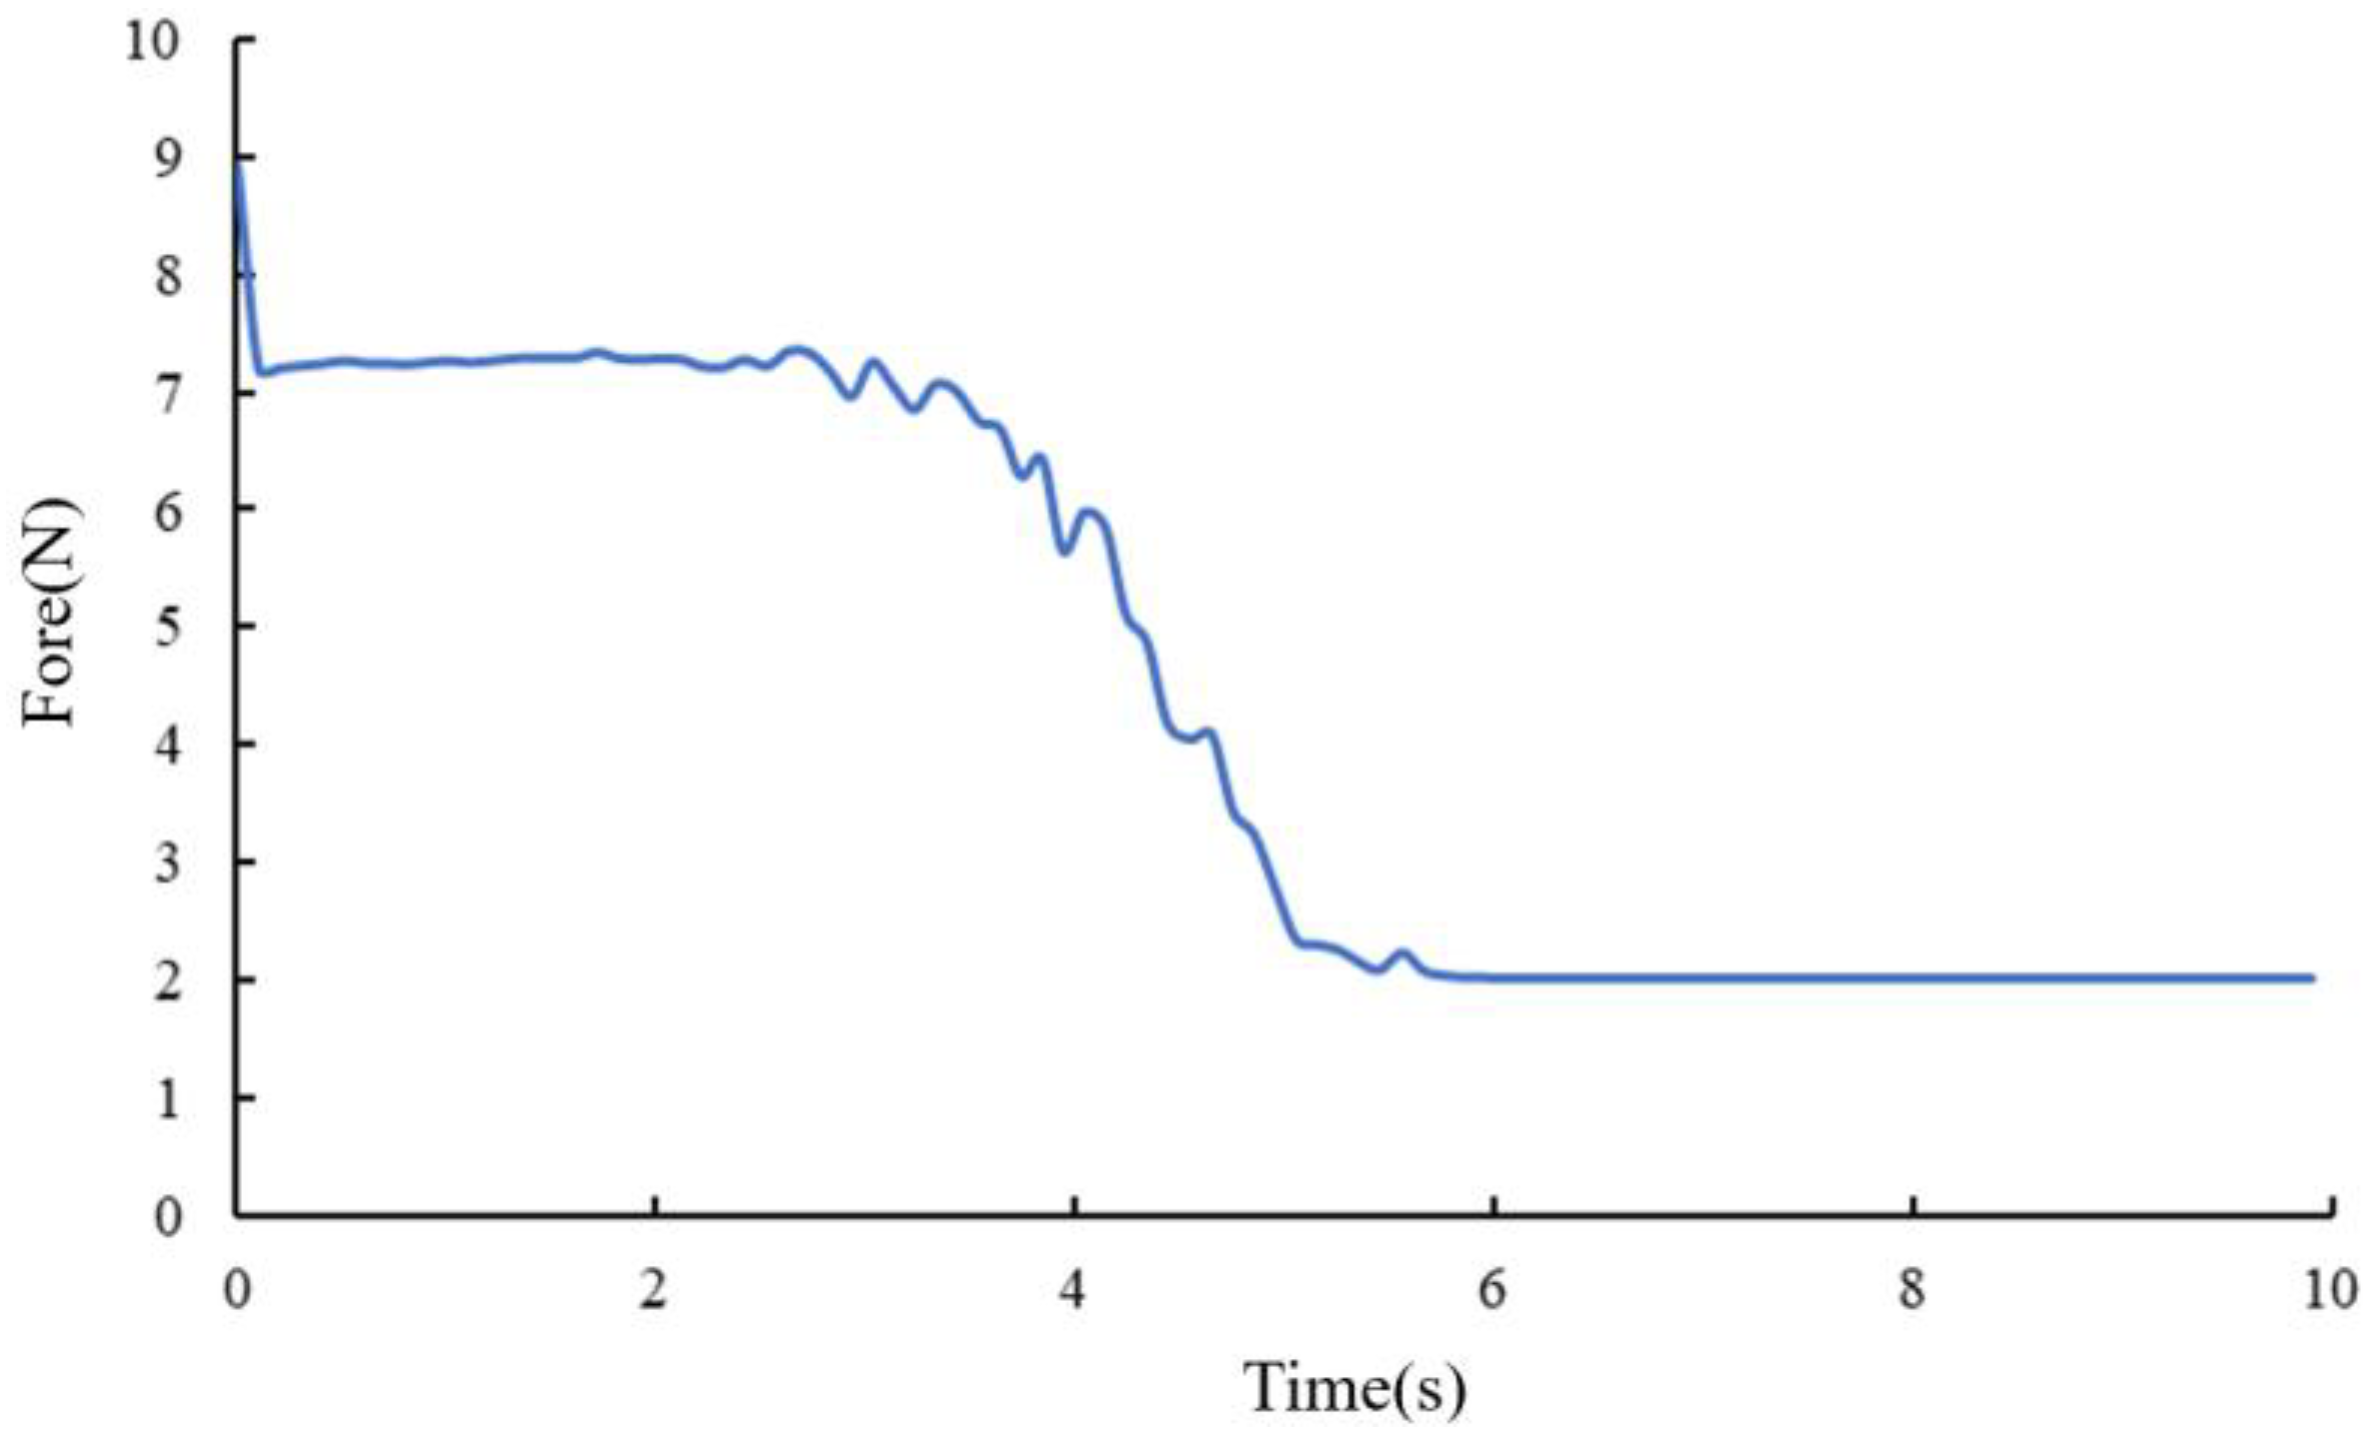
In this study, we analyzed the extrusion behavior of corn when extruded from a cone container onto a stacking tray using a hammer shaper. Figure 20 depicts the initial corn pile-up on the cone container and stacking tray, followed by extrusion of corn from the gap upon their contact. The corn repose angle was determined by comparing the experimental and simulated angle sizes, as well as the gravity of the corn on the stacking disc. We also investigated the change in force on the stacking tray, as illustrated in Figure 16. Our findings shed light on the fundamental mechanics involved in corn extrusion and provide insights for improving corn handling and processing.
A total of five sets of simulations and experiments were carried out. The experiment and simulation yielded average repose angles of 23.6° and 23.55°, respectively, with a negligible relative error of 0.2%. The pressure exerted by the corn model on the stacking disc was 2.02 N, while the average weight of the corn on the disc was 1.97 N, showing a discrepancy of 2.48% between the two. These findings highlight the close alignment of the simulation and experiment results. They offer confirmation that the simplified corn model, along with the calibrated corn coefficient of rolling friction, can provide reliable simulation accuracy. A comparison of the repose angles of the two methods is shown in Table 7.

3.3. Seed Metering Experiment

3.3.1. Seed Metering Simulation Model

A simplified simulation model was developed to simulate the process of seed rowing in corn and compared to the results of actual seed rowing experiments using a mechanical seed rower. The seed rower used in the experiments was equipped with a seed box, seed pickup wheel, seed brushing wheel, and seed disturbing wheel, as shown in Figure 21. The seed pickup wheel had a diameter of 98 mm and was evenly distributed with 16 nest holes. It was primarily responsible for separating seeds from the seed box and transporting them to the seed drop site. The seed discharge process was divided into five stages: seed filling, seed disturbance, seed sweeping, seed draining, and seed cleaning. Seed filling was found to be a crucial determinant of the seed discharging performance. This process was categorized into three types: squeezing seed filling, gravity seed filling, and seed disturbance filling. The seed brush wheel is responsible for clearing excess seeds from the eyelet holes of the seed pickup wheel and incidentally disturbing the seed population. The seed disturbing wheel is in charge of disturbing the seed population and increasing the vitality of the seed movement so that it can better fill the nest hole. The quality of the corn seeds metering device can be measured by the single-grain rate, the multiple-grain rate and the missing grain rate. As the missed grain rate can be deduced from the single-grain rate and the multi-grain rate. In this paper, only the single- and multi-grain rates are used for simulation and test results verification.
The seed box front panel was made of Plexiglas for ease of observation, while the seed brushing wheels, seed picking wheels, and seed disturbing wheels were made of bristle brushes, POM plastic processing, and rotated in a counterclockwise direction. The simulation model included the generation of 700 corn models in a 2:1:1.2 ratio of horse tooth, spherical cone, and spherical shapes. The model had a standard deviation of 0 for horse tooth, 0.10 for spherical cone, and 0.15 for spherically shaped corn. A simulation time step of 6.55 × 10⁻⁶ and a simulator grid size of 3 Rmin were used.
The seed metering simulation model is illustrated in Figure 21d, while the metering experiment rig is shown in Figure 21e. The seeding and simulation experiments were carried out five times each, for different angular speeds of the seed picker wheel, and the results were averaged.
The angular velocity of the seed extraction wheel greatly impacts the efficiency of seed dispersal in the seed dispenser. To determine the angular speed of the metering wheel, we used Equation (7). The distance between the corn holes was 220 mm. The tractor’s minimum and maximum traction speeds were approximately 0.60 m/s and 2.83 m/s, which correspond to metering wheel angular speeds of 1.14 rad/s and 5.35 rad/s, respectively. To facilitate comparison, we used the intermediate value of 3.25 rad/s. By doing so, the seed dispersal performance can easily be assessed and optimized.
ω = 2 π υ a m 1 δ
where v is the tractor speed, m/s; a is the cavity distance, m; m is the number of nest holes, 16; and δ is the ground wheel slip rate, 5.7%.

3.3.2. Seed Metering Process

The simulation experiment of corn metering was conducted considering an angular speed of the seed picker wheel of 1.14 rad/s. In addition, the angular speeds of both the disturbance wheel and the seed brush wheel were 2.28 rad/s. The metering simulation process is shown in Figure 18, and the three seed filling methods employed by the seed picker wheel are illustrated in Figure 22.
Figure 22a–f demonstrate that the seed picking wheel picked up seeds in three different detection areas. When the seed picking wheel had an angular velocity of 1.14 rad/s, the corn model showed higher speeds in detection areas 2 and 3, and the velocity of the corn seeds in the nest eye was greater than the seeds near the seed extraction wheel. The direction of the movement of the corn above detection zone 2 moved tangentially to the rotation of the seed extraction wheel. Seeds enter the nest eye due to crowding pressure and gravity, with the direction of motion in detection zone 2 being downwards and that in zone 3 being upwards. In Figure 22g–f, the seed pickup wheel, the seed brushing wheel, and the seed disturbing wheel rotate counterclockwise, driving the corn seeds into the seed box, while a small number fill the nests in the seed picker wheel. The seed disturbing wheel increases seed movement in the filling area, and the seed brushing wheel removes seeds from the nests, with the seed pickup wheel lining them up sequentially. As corn seeds accumulate, an angle of corn accumulation occurs on the bottom plate.
We observe that the seed picking wheel has three detection areas at which the velocity of corn seeds varies. Seeds enter the nest eye via crowding and gravity in detection zones 2 and 3, respectively. The seed box is filled with seeds driven by the counterclockwise rotation of the seed pickup wheel, seed brushing wheel, and seed disturbing wheel. The seed disturbing wheel enhances movement, and the seed brushing wheel removes seeds from the nests. Finally, the corn seeds are lined up sequentially, forming a corn accumulation angle on the bottom plate as they fall to the ground.

3.3.3. Metering Verification

During the metering experiment, three types of corn were mixed and marked with different colors before being poured into the seed box of the seed rower. To drive the seed rower, a speed-adjustable motor (model: 6IK300RGU-CF, manufacturer: Suzhou Haoyuan Electromechanical Co., Ltd., Suzhou, China, speed range: 4–430 r/min) was utilized. The angular speed of the seed picker wheel was set to 1.14, 3.25, and 5.35 rad/s, while the brush and disturbance wheels operated at twice the speed of the seed picker wheel, and in the same direction. The corresponding number of seeds discharged at each of the three seed selector speeds is illustrated in Figure 23.
Figure 23 demonstrates the relative errors between the number of horse tooth, spherical cone, and spherical corn seeds in simulated and experimental rows at different angular speeds of the seed picking wheel. At 1.14 rad/s, there was a 4.72% error for horse tooth seeds, a 1.54% error for spherical cone seeds, and a 2.56% error for spherical corn seeds. At 3.25 rad/s, there was an 8.62% error for horse tooth seeds, a 5.36% error for spherical cone seeds, and an 8.57% error for spherical corn seeds. At an angular speed of 5.35 rad/s, there was a 3.70% error for horse tooth seeds, a 7.40% error for spherical cone seeds, and a 3.13% error for spherical corn seeds. While the errors increase with higher angular speeds, they are within an acceptable range.
Additionally, in this study, the accuracy of the simulated corn model was evaluated by comparing the single- and multi-grain rates of the simulated results to the experimental results following the GB/T 6973-2005 single-grain planter experiment standard. Equations (8) and (9) detail the calculation of single grain and multi-grain rates. Table 8 displays the results of the simulation and experimental comparison.
S = n 1 N × 100 %
D = n 2 N × 100 %
N is the theoretical number of seeds measured, n1 is the number of single grains, and n2 is the number of multiple seeds.
Table 8 shows the results of our study on single- and multi-grain rates in corn under different angular speeds of the seed picking wheel. At an angular speed of 1.14 rad/s, the single-kernel rate was 80.37% in the simulation and 78.54% in the experiment, with a relative error of 2.28%. For an angular speed of 3.25 rad/s, the single-kernel rates were 71.88% and 73.92% for the simulation and experiment, respectively, with a relative error of 2.76%. Finally, at an angular speed of 5.35 rad/s, the single-kernel rates were 85.22% and 86.55% for the simulation and experiment, respectively, with a relative error of 1.56%.
Regarding multi-grain rates, the simulation and experimental results were comparatively higher than the single-grain rates. The multi-grain rates were 19.63% and 21.46% for an angular speed of 1.14 rad/s, 26.08% and 28.12% for an angular speed of 3.25 rad/s, and 13.45% and 14.78% for an angular speed of 5.35 rad/s, respectively, with a relative error of a maximum of 9%.
The corn repose angle and metering experiments had no difficulty finding that the simplified model of corn developed in this paper and the corresponding calibrated coefficient of rolling friction were somewhat accurate. The corn moisture content has a large effect on the seed density and the coefficient of static friction, but the range of corn moisture content studied in this paper was 12.15–15.15%, and due to space limitations, the effect of corn moisture content on coefficient of rolling friction will need to be investigated at a later stage. At the same time, the work carried out in this paper represents an improvement in terms of modeling standardization and the accuracy of the calibration of the rolling friction coefficient compared to previous work [23], and the calibration of corn models and parameters using two repose angle experiments and seed metering is more convincing.
However, these results are not free from limitations. The simulation of the metering process was not able to perfectly replicate reality, leading to a slight error. Additionally, variations in the size and filling of corn models resulted in some errors. Nevertheless, these findings bring new perspectives to the enhancement of corn model construction methods in future studies.

4. Conclusions

This paper presents the findings of a study on the shape and size statistics of the Zhengdan 958 corn variety, which is planted widely in Gansu Province. The shapes of the seeds were classified as horse tooth, spherical cone, spherical, oblate, and irregular. The analysis showed that the horse tooth, spherical cone, and typical corn shapes accounted for nearly 93.8% of the total corn population, with their ratio being about 2:1:1.2. The study also analyzed the size distributions of the seeds, which were distributed according to a positive distribution. There was a linear relationship between the sizes of different shapes of corn seed.
The shapes of corn seeds affect the rolling behavior of the seeds, constituting a critical factor in the flow of corn. The study focused on calibrating the coefficient of rolling friction of the corn model. The calibration results indicated that the coefficient of rolling friction varies between different shapes of corn. The study then validated the simplified corn model by comparing simulation and experimental results. The relative error between the results of the simulation and those of the experiment was only 0.72% in the collapse stacking experiment, while the relative error was 0.2% in stacking experiment. The relative error for metering the seeds was below 15% at both low and high speeds, and the multi-grain rate error was less than 10%. These results demonstrate that the modeling and calibration of the method for determining the coefficient of rolling friction used in this paper were somewhat accurate.
This study provides an in-depth analysis of the shape and size statistics of the Zhengdan 958 corn variety and its rolling behavior using a simplified corn model. The study highlights the significance of understanding the properties of the corn variety for enhancing crop yield and improving crop handling techniques. The results of this study can be utilized to improve the design of agricultural machinery and equipment, thus contributing to sustainable agriculture practices. This is mainly reflected in the fact that the seeding simulation using the corn model developed in this paper allows a more detailed observation of the mechanical seeder seeding process, the finger clip structure and the specific processes of seed filling, seed cleaning and seed delivery, and the seeding discharge of the nesting wheel, as well as the identification of seed fluency problems in the specific aspects of seeding discharge, which can be targeted in order to improve the structure and enhance the quality of seeding discharge.

Author Contributions

Study design, L.S.; data collection, W.Z.; data analysis, G.R.; experiment, J.G. and Z.W. All authors have read and agreed to the published version of the manuscript.

Funding

The National Natural Science Foundation of China grant number: 52065004, 52165028.

Data Availability Statement

Not applicable.

Conflicts of Interest

The authors declare no conflict of interest.

Abbreviations

DEMDiscrete element method
Nomenclature
W1Upper width of corn seed for horse tooth corn
W2Lower width of corn seed for horse tooth corn
HHeight of corn
T1Upper thickness for horse tooth corn
T2Lower thickness for horse tooth corn
D1Upper diameter for spherical cone corn
D2Lower diameter for spherical cone corn
DDiameter for spherical corn
xThe coefficient of rolling friction
yThe height of the corn repose angle
vThe tractor speed
aThe cavity distance
mThe number of nest holes
δThe ground wheel slip rate
NThe theoretical number of seeds measured
n1The number of single grains
n2The number of multiple seeds
SSingle-grain rate
MMulti-grain rate

References

  1. Jaques, L.B.A.; Coradi, P.C.; Rodrigues, H.E.; Dubal, I.T.P.; Padia, C.L.; Lima, R.E.; Souza, G.A.C.D. Post-harvesting of soybean seeds-engineering, processes technologies, and seed quality: A review. Int. Agrophys. 2022, 36, 59–81. [Google Scholar] [CrossRef]
  2. Wensrich, C.M.; Katterfeld, A. Rolling friction as a technique for modelling particle shape in DEM. Powder Technol. 2012, 217, 409–417. [Google Scholar] [CrossRef]
  3. Pasha, M.; Hare, C.; Ghadiri, M.; Gunadi, A.; Piccione, P.M. Effect of particle shape on flow in discrete element method simulation of a rotary batch seed coater. Powder Technol. 2016, 296, 29–36. [Google Scholar] [CrossRef] [Green Version]
  4. Wiacek, J.; Molenda, M.; Horabik, J.; Ooi, J.Y. Influence of grain shape and intergranular friction on material behavior in uniaxial compression: Experimental and DEM modeling. Powder Technol. 2012, 217, 435–442. [Google Scholar] [CrossRef]
  5. Wang, L.; Li, R.; Wu, B.; Wu, Z.; Ding, Z. Determination of the coefficient of rolling friction of an irregularly shaped maize particle group using physical experiment and simulations. Particuology 2018, 38, 185–195. [Google Scholar] [CrossRef]
  6. Balevicius, R.; Sielamowicz, I.; Mroz, Z.; Kacianauskas, R. Effect of rolling friction on wall pressure, discharge velocity and outflow of granular material from a flat-bottomed bin. Particuology 2012, 10, 672–682. [Google Scholar] [CrossRef]
  7. Nakashima, H.; Shioji, Y.; Kobayashi, T.; Aoki, S.; Shimizu, H.; Miyasaka, J.; Ohdoi, K. Determining the angle of repose of sand under low-gravity conditions using discrete element method. J. Terramech. 2011, 48, 17–26. [Google Scholar] [CrossRef]
  8. Han, Y.L.; Jia, F.G.; Tang, Y.R.; Liu, Y.; Zhang, Q. Influence of granular coefficient of rolling friction on accumulation characteristics. Acta Phys. Sin. 2014, 63, 174501. [Google Scholar] [CrossRef]
  9. Coetzee, C. Calibration of the discrete element method: Strategies for spherical and non-spherical particles. Powder Technol. 2020, 364, 851–878. [Google Scholar] [CrossRef]
  10. Cui, T.; Liu, J.; Yang, L.; Zhang, D.; Zhang, R.; Lan, W. Experiment and simulation of rolling friction characteristic of corn seed based on high-speed photography. Trans. Chin. Soc. Agric. Eng. 2013, 29, 34–41. [Google Scholar]
  11. Wang, Y.; Liang, Z.; Zhang, D.; Cui, T.; Shi, S.; Li, K.; Yang, L. Calibration method of contact characteristic parameters for corn seeds based on EDEM. Trans. Chin. Soc. Agric. Eng. 2016, 32, 36–42. [Google Scholar]
  12. Chen, Z.; Yu, J.; Xue, D.; Wang, Y.; Zhang, Q.; Ren, L. An approach to and validation of maize-seed-assembly modelling based on the discrete element method. Powder Technol. 2018, 328, 167–183. [Google Scholar] [CrossRef]
  13. Zeng, Z.; Ma, X.; Cao, X.; Li, Z.; Wang, X. Critical Review of Applications of Discrete Element Method in Agricultural Engineering. Trans. Chin. Soc. Agric. Mach. 2021, 52, 1–20. [Google Scholar]
  14. Coetzee, C.J. Review: Calibration of the discrete element method. Powder Technol. 2017, 310, 104–142. [Google Scholar] [CrossRef]
  15. Horabik, J.; Molenda, M. Parameters and contact models for DEM simulations of agricultural granular materials: A review. Biosyst. Eng. 2016, 147, 206–225. [Google Scholar] [CrossRef]
  16. Zhong, J.Q.; Tao, L.M.; Li, S.P.; Zhang, B.; Wang, J.Y.; He, Y.L. Determination and interpretation of parameters of double-bud sugarcane model based on discrete element. Comput. Electron. Agric. 2022, 203, 107428. [Google Scholar] [CrossRef]
  17. Liu, Z.; Ma, H.; Zhao, Y. Comparative study of discrete element modeling of tablets using multi-spheres, multi-super-ellipsoids, and polyhedrons. Powder Technol. 2021, 390, 34–49. [Google Scholar] [CrossRef]
  18. Kruggel-Emden, H.; Rickelt, S.; Wirtz, S.; Scherer, V. A Study on the Validity of the Multi-Sphere Discrete Element Method. Powder Technol. 2008, 188, 153–165. [Google Scholar] [CrossRef]
  19. Gonzalez-Montellano, C.; Gallego, E.; Ramirez-Gomez, A.; Ayuga, F. Three dimensional discrete element models for simulating the filling and emptying of silos: Analysis of numerical results. Comput. Chem. Eng. 2012, 40, 22–32. [Google Scholar] [CrossRef]
  20. Markauskas, D.; Kacianauskas, R. Investigation of rice grain flow by multi-sphere particle model with rolling resistance. Granul. Matter 2011, 13, 143–148. [Google Scholar] [CrossRef]
  21. Boac, J.; Casada, M.E.; Maghirang, R.; Harner, J.P. Material and Interaction Properties of Selected Grains and Oilseeds for Modeling Discrete Particles. Trans. ASABE 2010, 53, 1201–1216. [Google Scholar] [CrossRef] [Green Version]
  22. Weigler, F.; Mellmann, J. Investigation of grain mass flow in a mixed flow dryer. Particuology 2014, 12, 33–39. [Google Scholar] [CrossRef]
  23. Shi, L.R.; Zhao, W.Y.; Sun, B.G.; Sun, W. Determination of the coefficient of rolling friction of irregularly shaped maize particles by using discrete element method. Int. J. Agric. Biol. Eng. 2020, 13, 15–25. [Google Scholar] [CrossRef]
  24. Shi, L.R.; Zhao, W.Y.; Yang, X.P. Effects of typical corn kernel shapes on the forming of repose angle by DEM simulation. Int. J. Agric. Biol. Eng. 2022, 15, 248–255. [Google Scholar] [CrossRef]
  25. Chen, Z.; Wassgren, C.; Veikle, E.; Ambrose, K. Determination of material and interaction properties of maize and wheat kernels for DEM simulation. Biosyst. Eng. 2020, 195, 208–226. [Google Scholar] [CrossRef]
  26. Mousaviraad, M.; Tekeste, M.Z.; Rosentrater, K.A. Calibration and Validation of a Discrete Element Model of Corn Using Grain Flow Simulation in a Commercial Screw Grain Auger. Trans. ASABE 2017, 60, 1403–1415. [Google Scholar] [CrossRef] [Green Version]
  27. Coetzee, C.J. Calibration of the discrete element method and the effect of particle shape. Powder Technol. 2016, 297, 50–70. [Google Scholar] [CrossRef]
  28. Wang, L.; Zhou, W.; Ding, Z.; Li, X.; Zhang, C. Experimental determination of parameter effects on the coefficient of restitution of differently shaped maize in three-dimensions. Powder Technol. 2015, 284, 187–194. [Google Scholar] [CrossRef]
  29. Markauskas, D.; Ramírez-Gómez, Á.; Kačianauskas, R.; Zdancevičius, E. Maize grain shape approaches for DEM modelling. Comput. Electron. Agric. 2015, 118, 247–258. [Google Scholar] [CrossRef]
  30. Li, X.; Liu, F.; Zhao, M.; Zhang, T.; Li, F.; Zhang, Y. Determination of contact parameters of maize seed and seed metering device. J. Agric. Mech. Res. 2018, 40, 149–153. [Google Scholar]
  31. Jaques, L.B.A.; Coradi, P.C.; Lutz, E.; Teodoro, P.E.; Jaeger, D.V.; Teixeira, A.L. Nondestructive Technology for Real-Time Monitoring and Prediction of Soybean Quality Using Machine Learning for a Bulk Transport Simulation. IEEE Sens. J. 2023, 23, 3028–3040. [Google Scholar] [CrossRef]
Figure 1. Classification corn seed shapes. (a) Horse tooth; (b) spherical cone; (c) spherical; (d) oblate; (e) irregular.
Agronomy 13 01573 g001
Figure 2. Number counted for each of the five corn seed shapes.
Agronomy 13 01573 g002
Figure 3. Characteristic dimensions of corn seeds. (a) Horse tooth; (b) spherical cone; (c) spherical.
Agronomy 13 01573 g003
Figure 4. Horse tooth corn seed model. (a) Feature size; (b) main view; (c) left view.
Agronomy 13 01573 g004
Figure 5. Spherical cone corn seed model. (a) Feature size; (b) main view; (c) left view.
Agronomy 13 01573 g005
Figure 6. Spherically shaped corn seed model.
Agronomy 13 01573 g006
Figure 7. Volume measurement of 3 shape types of corn seed. (a) Spherical (100 mm); (b) spherical cone (105 mm); (c) horse tooth (110 mm).
Agronomy 13 01573 g007
Figure 8. Volume calibration of the model of 3 shape types of corn seed. (a) Before adjustment; (b) after adjustment.
Agronomy 13 01573 g008
Figure 9. Variation of 3 shape types of corn seed volume with normal distribution values.
Agronomy 13 01573 g009
Figure 10. Volume verification of mixed corn seeds in two types of container. (a) Measuring cylinder; (b) Plexiglas box.
Agronomy 13 01573 g010
Figure 11. Device for determining the repose angle of corn seeds. (a) Experiment; (b) simulation. 1. Aluminum cylinder; 2. corn seed model; 3. sump; 4. ruler; 5. digital display push–pull instrument.
Agronomy 13 01573 g011
Figure 12. The height of the repose angle of corn seeds of single shape or mixed shape. (a) Horse tooth; (b) spherical cone; (c) spherical; (d) horse tooth and spherical cone; (e) horse tooth and spherical; (f) spherical cone and spherical.
Agronomy 13 01573 g012
Figure 13. Relationship between the coefficient of rolling friction and the height of the repose angle of single corn shapes. (a) Horse tooth; (b) spherical cone; (c) spherical.
Agronomy 13 01573 g013
Figure 14. Relationship between the coefficient of rolling friction and the height of repose angle for the mixed corn seeds. (a) Horse tooth and spherical cone; (b) horse tooth and spherical; (c) spherical cone and spherical.
Agronomy 13 01573 g014
Figure 15. Device with a double layer for the formation of the repose angle of corn seeds. (a) Dimensions; (b) actual device. 1. Experiment container; 2. moving plate; 3. driving motor; 4. wireless relay; 5. remote control.
Agronomy 13 01573 g015
Figure 16. Actual collapse process of mixed shape corn seeds with time. (a) 0 s; (b) 2.51 s; (c) 3.31 s; (d) 3.68 s; (e) 4.68 s; (f) 6 s.
Agronomy 13 01573 g016
Figure 17. Simulated collapse process of the corn seed model with time. (a) 0 s; (b) 2.51 s; (c) 3.31 s; (d) 3.68 s; (e) 4.68 s; (f) 6 s.
Agronomy 13 01573 g017
Figure 18. Device with conical table for the formation of the repose angle of the corn seeds. (a) Component; (b) size of the cone table; 1. support; 2. linear pusher; 3. cone table; 4. stacking disk; 5. seed drops disk; 6. commutation circuit.
Agronomy 13 01573 g018
Figure 19. Simulation process to form repose angle of corn seeds model with conical table device.
Agronomy 13 01573 g019
Figure 20. Force curve on the disc during forming repose angle.
Agronomy 13 01573 g020
Figure 21. Corn seed metering device. 1. Seed box; 2. seed pickup wheel; 3. right seed spacer; 4. seed cleaning plate; 5. seed brushing wheel; 6. seed disturbing wheel; 7. left seed spacer; 8. corn model; 9. seed rower; 10. seed conveyor.
Agronomy 13 01573 g021
Figure 22. Method of corn seeds filling hole. Note: The color of the corn changes from blue to red, indicating an increasing trend in the corn speed, with green representing values between low and high speed. The red circle represents the seed of the object under observation.
Agronomy 13 01573 g022
Figure 23. Comparison of corn seed metering number between simulation and experiment condition. (a) 1.14 rad/s; (b) 3.25 rad/s; (c) 5.35 rad/s.
Agronomy 13 01573 g023
Table 1. Equation for calculating the characteristic size of horse tooth corn seeds.
FeaturesRelationship FormulaStandard DeviationR2p
Upper width (W1)W1/T1 = −0.3253T1 + 3.07340.700.49622.2 × 10−7 (**)
Lower width (W2)W2/T2 = −0.322T2 + 3.40860.510.72820.118
Height (H)H/T1 = −0.5746T1 + 5.18810.690.76045.77 × 10−7 (**)
Height (H)H/T2 = −0.4766T2 + 4.72610.690.76721.06 × 10−4 (**)
Lower thickness (T2)T2/T1 = −0.1672T1 + 1.90510.530.32970.117
** represents highly significant, the same as below.
Table 2. Calculated feature size of the horse tooth corn seed.
Feature Size Average/mm
W1 (W1:T1)W2 (W2:T2)H (H:T2~H:T1)T1T2
7.15 (1.63)8.92 (1.76)11.57 (2.61~2.64)4.435.12
Table 3. Equation for calculating the characteristic size of spherical cone corn seeds.
FeaturesRelationship FormulaStandard DeviationR2p
Lower radius (D2)D2/D1 = −0.1093D1 + 1.9730.750.44770.168
High (H)H/D1 = −0.2256D1 + 3.21460.800.67780.399
Table 4. Calculated feature size of the spherical cone corn seed.
Feature Size Average/mm
H (H:D1)D1D2
11.14 (1.80)6.278.00
Table 5. DEM simulation parameters.
MaterialsParametersValueSource
CornPoisson’s ratio0.4[15]
Young’s modulus/MPa26[15]
Density of horse tooth particle/(kg/m3)1213Measurement
Density of spherical cone particles/(kg/m3)1194Measurement
Density of spherical corn/(kg/m3)1234Measurement
Collision recovery coefficient0.37[28]
Coefficient of static friction0.2[29]
AluminumPoisson’s ratio0.34[23]
Shear modulus/Pa2.5 × 1010[23]
Density/(kg/m3)2700[23]
PlexiglasPoisson’s ratio0.35[10]
Shear modulus/Pa1.3 × 109[10]
Density/(kg/m3)1200[10]
SteelPoisson’s ratio0.3EDEM materials
Shear modulus/Pa7.9 × 1010EDEM materials
Density/(kg/m3)7800EDEM materials
Corn and aluminumCollision recovery coefficient0.729[23]
Coefficient of static friction0.342[23]
Coefficient of rolling friction0.052[23]
Corn and PlexiglasCollision recovery coefficient0.621[10]
Coefficient of static friction0.459[10]
Coefficient of rolling friction0.093[10]
Corn and steelCollision recovery coefficient0.5[30]
Coefficient of static friction0.408[30]
Coefficient of rolling friction0.01[30]
Table 6. The height of the repose angle of corn seeds of single shape or mixed shape.
Corn TypeHeight of Repose Angle (mm)Average Value (mm)Standard Deviation (mm)
Horse tooth34.4333.9332.4333.9335.9334.131.25
Spherical cone32.4333.4333.4334.9332.4333.331.02
Spherical31.4332.4331.9331.4333.4332.130.84
Horse tooth and spherical cone33.9334.4332.4334.4333.9333.830.82
Horse tooth and spherical32.4332.4332.4332.9333.4332.730.45
Spherical cone and spherical32.9331.9332.4332.4332.4332.430.35
Table 7. Comparison of the repose angles of the two methods.
Slump Stacking ExperimentStacking Experiment
Simulation repose angle/°26.29 ± 0.523.60 ± 0.7
Experiment repose angle/°26.48 ± 1.523.55 ± 1.7
Their relative error/%0.720.20
Table 8. Comparison of single- and multi-seed rates between the simulated and experimental condition.
Metering Wheel Angular SpeedIndicators
Single-Grain Rate (%)Multi-Grain Rate (%)
1.14 rad/sExperiment78.5421.46
Simulation80.3719.63
3.25 rad/sExperiment71.8828.12
Simulation73.9226.08
5.35 rad/sExperiment85.2214.78
Simulation86.5513.45
Disclaimer/Publisher’s Note: The statements, opinions and data contained in all publications are solely those of the individual author(s) and contributor(s) and not of MDPI and/or the editor(s). MDPI and/or the editor(s) disclaim responsibility for any injury to people or property resulting from any ideas, methods, instructions or products referred to in the content.