Article

Biochar Addition with Water and Fertilization Reduction Increases Soil Aggregate Stability of 0–60 cm Soil Layer on Greenhouse Eggplant in Mollisols

1
College of Modern Agriculture and Ecological Environment, Heilongjiang University, Harbin 150080, China
2
State Key Laboratory of Black Soils Conservation and Utilization, Northeast Institute of Geography and Agroecology, Chinese Academy of Sciences, Harbin 150081, China
*
Author to whom correspondence should be addressed.
These authors contributed equally to this work.
Agronomy 2023, 13(6), 1532; https://doi.org/10.3390/agronomy13061532
Submission received: 21 April 2023 / Revised: 27 May 2023 / Accepted: 29 May 2023 / Published: 31 May 2023
(This article belongs to the Special Issue Biochar for Sustainable Farming and Recultivation)

Abstract

:
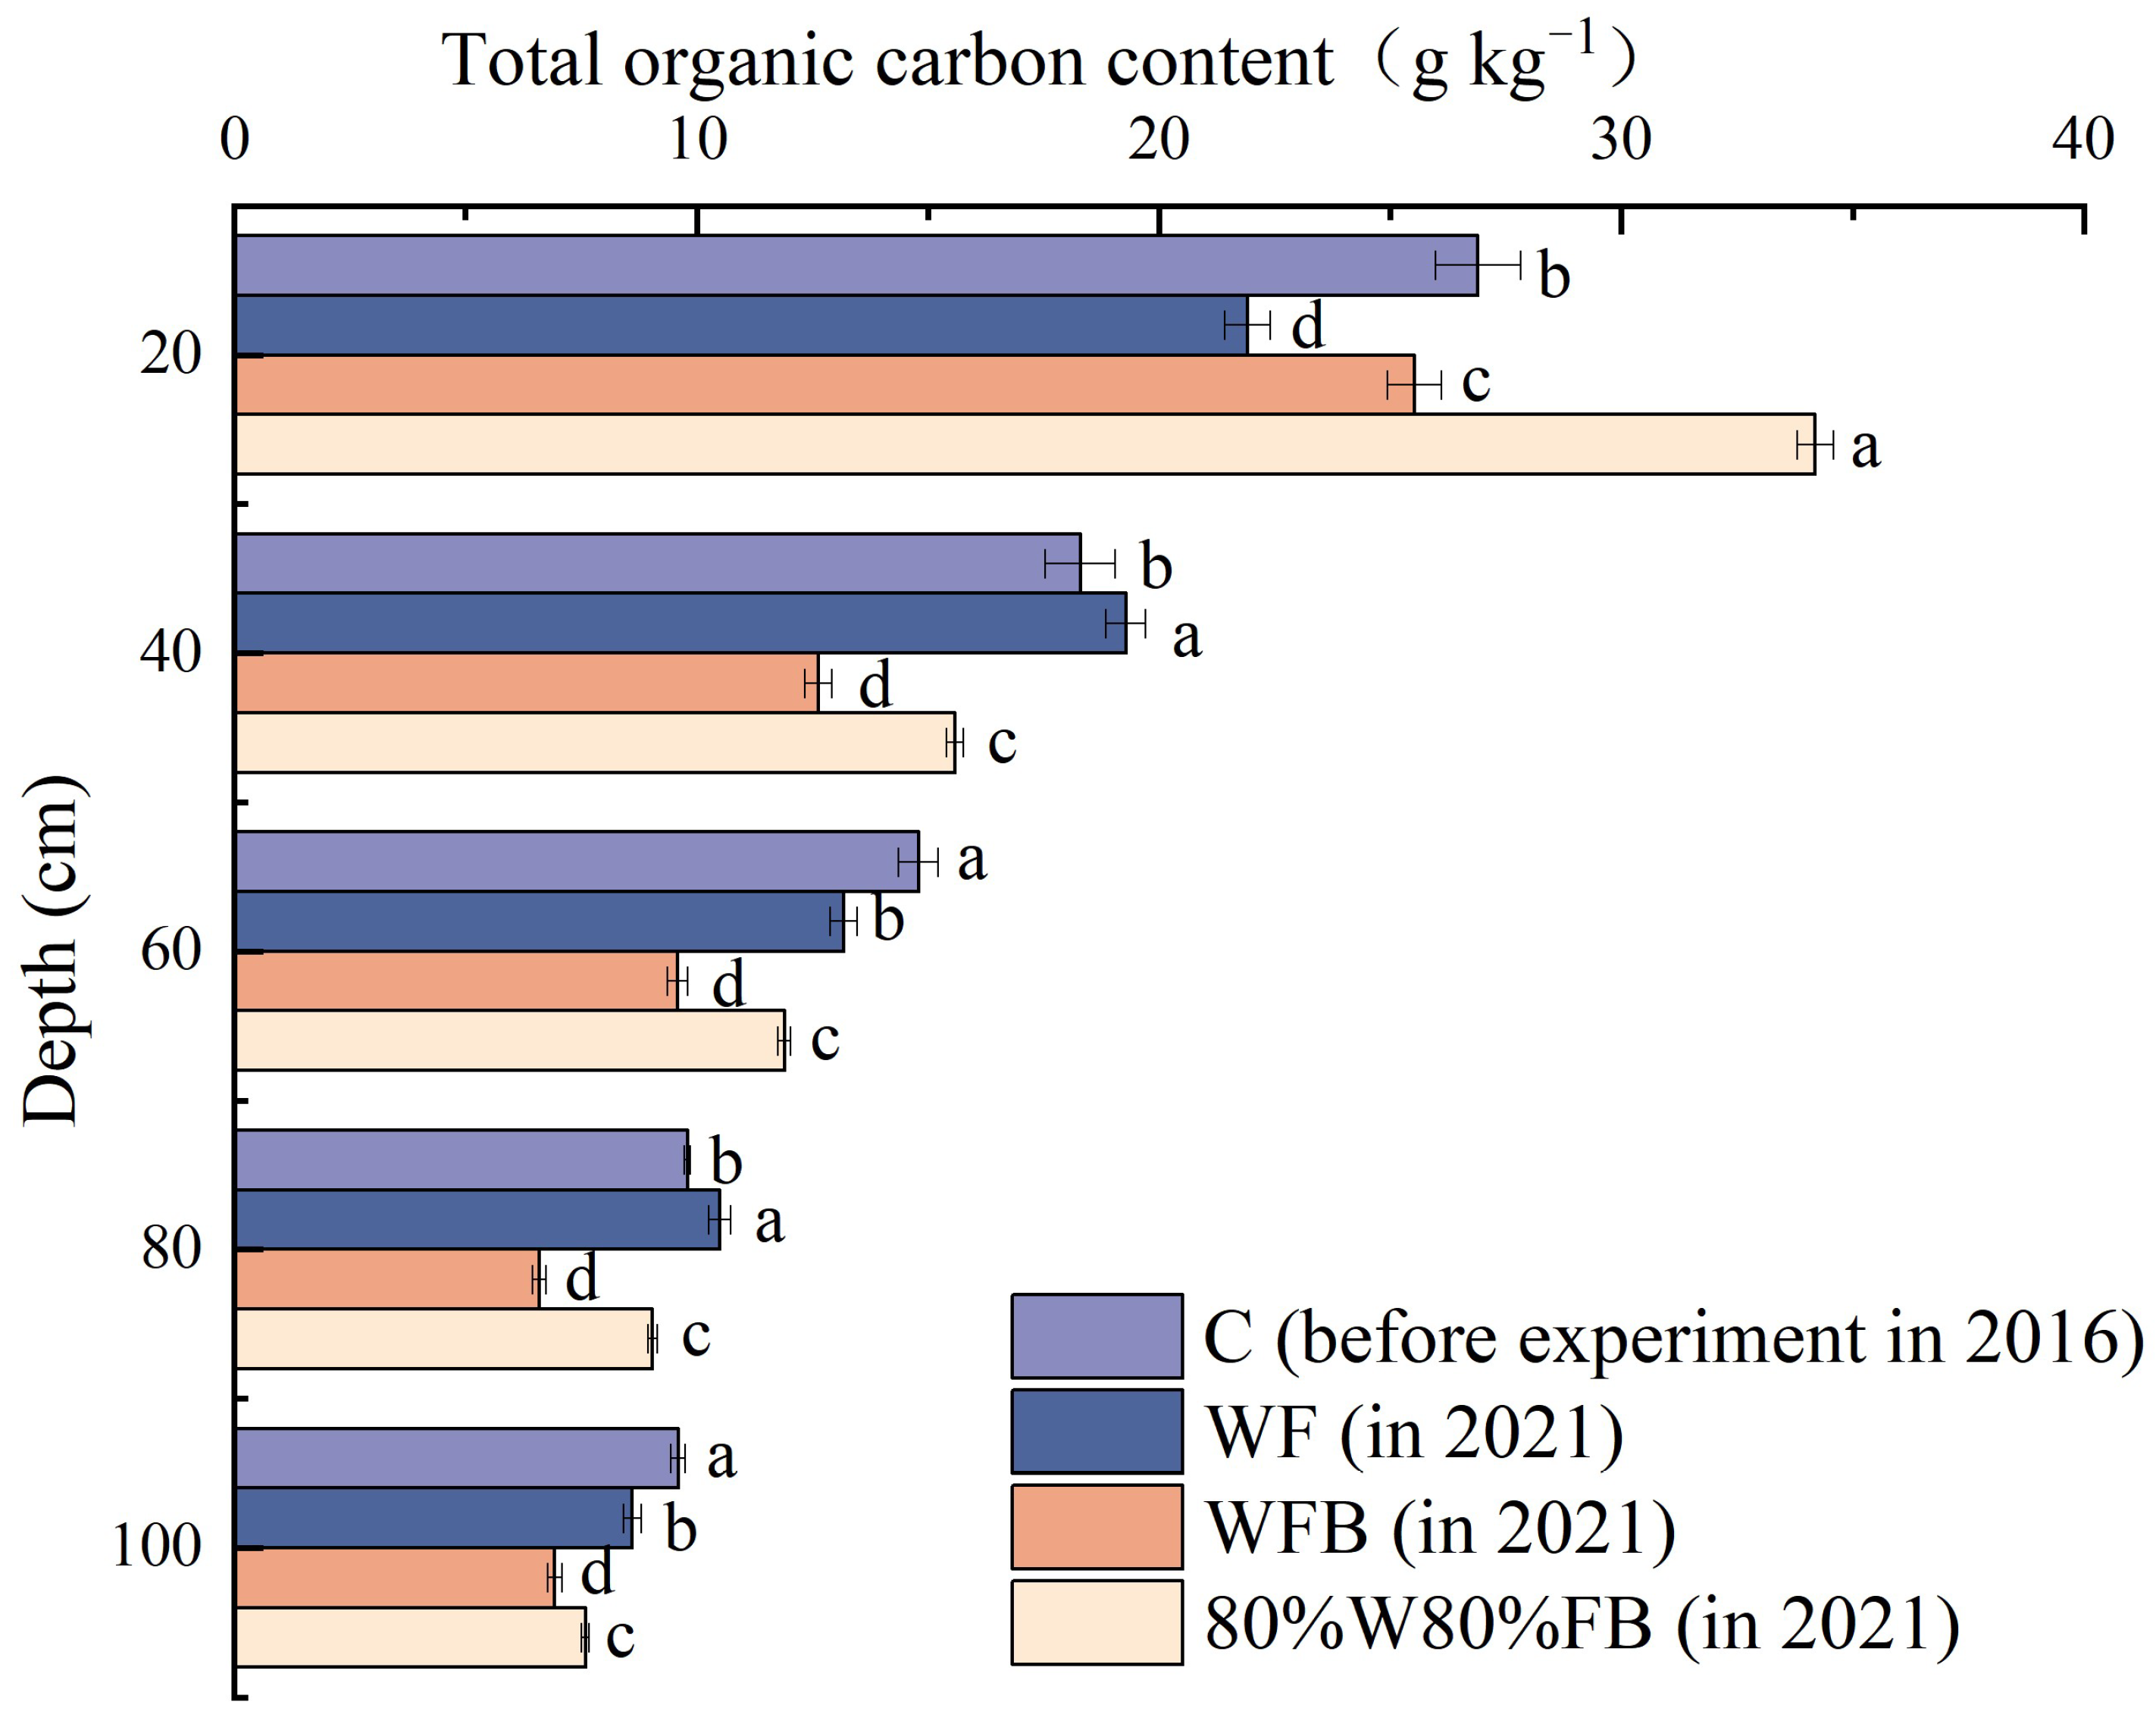
Biochar application affects the soil organic carbon (SOC) content and distribution, which is relevant to facility agriculture and soil aggregates. However, how the fertilization management of facility agriculture affects the SOC content and aggregate stability at different soil depths in Mollisols is unclear. Intended to provide a basis for developing a reasonable fertilizer amount when adding biochar, the facility vegetable eggplant in Northeast China was used to explore the effects of biochar addition on the distribution and SOC content of whole soils and the organic carbon (OC) content of aggregates of each size in the profile (0–100 cm) of Mollisols. Three treatments were set up: WF (conventional application amounts of water and fertilizer), WFB (conventional application amounts of water and fertilizer and added biochar), and 80%W80%FB (20% water reduction and 20% fertilizer reduction and added biochar). The results demonstrated that the 80%W80%FB treatment significantly increased the SOC content by 56.1% and 34.0% in whole soils at a 0–20 cm soil depth compared to WF and WFB treatments, respectively. Simultaneously, compared with WF and WFB treatments, the significant increase in the OC content of 1–0.25 mm sized aggregates of 81.4–130.2% and 4.3–10.1% and the enhanced proportion of >2 mm sized aggregates of 0.22–16.15- and 0.33–0.83-fold both improved aggregate stability in the 0–20 cm soil layer under the 80%W80%FB treatment, which was proven to result in 32.6% and 30.6% increments in the weight diameter (MWD) value. Therefore, biochar addition with water and fertilizer reductions increases surface soil aggregate stability for greenhouse eggplants in Mollisols.

1. Introduction

In the past 30 years, the facility vegetable process (a production process that improves and creates a suitable local climate environment that is conducive to vegetable growth) has developed rapidly in China. In addition, the production value of the yield of facility vegetables was more than 0.98 trillion yuan in 2019 for the whole country [1]. However, with the rapid development of facility vegetables, the quality of cultivated land has dropped, which has caused serious damage to Mollisols, especially in Northeast China [2]. Many problems have consistently emerged: for instance, soil organic matter has decreased, the aggregate structure of soil has been sabotaged, and soil fertility has diminished [3]. Therefore, it is necessary to protect the quality of Mollisols immediately. As one of the soil conditioners, biochar will sequestrate the carbon element in soil for hundreds of years, reduce the soil bulk density, and promote the formation of soil aggregates at the same time [4,5].
Soil aggregates, a foundation of the soil structure, can give rise to a number of impacts on various physico-chemical properties of the soil [6]. Aggregates of different particle sizes work in cooperation with a division of labor in terms of soil nutrient maintenance, supply, and accommodation ability [7,8,9]. As is known, soil aggregates can mainly be divided into two categories: one is called macroaggregates, and the other is known as microaggregates. The two soil types of aggregates have different characteristics: there is much more unstable organic matter in soil macroaggregates, which contain a large number of available nutrients and have a high fertilizer capacity. As the main component that can store organic carbon in the soil for a long time, microaggregates combine carbonaceous organisms with higher chemical stability [10]. Walters and White [11] and Stephen et al. [12] confirmed that when biochar was added to soil, it improved the structure of soil aggregates and increased the efficiency principle in the plow layer. Zhang et al. [13] added biochar to calcareous soil, and they found that biochar could dramatically improve the proportion of macroaggregates and the stability of soil aggregates. Other studies showed that biochar accelerated the formation of aggregates in sandy loam but had a significant impact on clay [14]. These studies demonstrated that the impact of biochar on soil aggregates was related to the soil type.
Soil organic carbon (SOC) is an important indicator for measuring soil fertility, and it plays an important role in promoting the circulation and availability of soil nutrients [15]. SOC and soil aggregates interact with each other; on the one hand, SOC is used as a cement to promote the formation of soil aggregates, and on the other hand, soil aggregates are important storage sites for SOC [16]. A study showed that biochar could effectively decrease the mineralization rate of SOC while raising the ability to store soil carbon [17]. Wang et al. [18] found that different amounts of biochar made from apple branches could dramatically enhance the content of soil total organic carbon (SOC). However, a few studies demonstrated that biochar could increase the mineralization rate of SOC over the years [19].
Biochar has become a research hot spot, and it is widely applied in agriculture and the environment at home and abroad. In the last 10 to 20 years, many researchers have studied biochar properties [20,21,22], the effects of biochar on soil chemical properties [23,24], biological properties [25,26], crop growth and development [27], and carbon sequestration and emission reduction [28,29]. There have also been many studies on the impact of biochar on soil organic carbon and soil aggregates [30,31,32,33,34], but most of them have focused on studying changes in surface soil organic carbon and aggregates under the conditions of biochar addition. There are barely any studies with regard to the effects of applying biochar on SOC and soil aggregates in different soil layers. Our research took facility vegetables growing in Mollisols as the test object to explore the influences of applying biochar on SOC and soil aggregates in the soil profile. We rationally hypothesized that biochar addition would promote soil aggregate stability and increase the SOC content of macroaggregates in different soil layers. This research attempted to comprehend the interaction between the soil structure and SOC content in deeper soil layers, which will provide basic information for protecting and utilizing facility vegetables in Mollisols.

2. Materials and Methods

2.1. Experimental Site

The study was conducted in a facility vegetable field at the Horticultural Branch of the Heilongjiang Academy of Agricultural Sciences (45°37.836′ N, 126°39.050′ E). The experimental site, which is in a moderate temperate zone, has a semihumid continental monsoon climate with an annual effective cumulative temperature of 2700 °C, a mean annual temperature of 4.25 °C [35], and a mean annual precipitation of 423 mm. The soil type is meadow Mollisol [36] and mainly composed of coarse silt and clay, accounting for 33.2% and 35.4%, respectively. The experimental site had been planting facility eggplants before the beginning of the experiment in 2016. Before the start of the experiment in 2016, we randomly selected 6 points at the experimental site and conducted soil sampling using soil drills. Soil samples were collected from 0–100 cm soil layers (once every 20 cm soil layer) and brought back to the laboratory for the determination of basic nutrients in the sample plot. The basic nutrients of the soil profile measured before the start of the experiment in 2016 are shown in Figure 1.

2.2. Experimental Design

The experiment was initiated in the autumn of 2016 and involved three different treatments. First, an area was selected in the vegetable field for the construction of a greenhouse. The greenhouse used for the facility vegetable plot had an area of 324 square meters (27 m long from north to south and 12 m wide from east to west). Then, we randomly selected a complete block in the greenhouse, set up three replicates, and processed a total of 9 soil points in three treatments. Each point had an area of 15 m2 (5 m × 3 m). The eggplant variety was longza 201, and continuous eggplant cultivation was applied. The eggplant row spacing, plant spacing, and row spacing were 100 cm, 50 cm, and 50 cm, respectively. In addition, the experimental site was plowed twice before transplanting eggplants in late April and after harvesting eggplants in late October, with a depth of about 30 cm.
The three treatments were as follows:
WF: Eggplants were planted with the conventional application amounts of water and fertilizer.
WFB: Eggplants were planted with the conventional application amounts of water and fertilizer, and biochar was added in the first fertilization stage.
80%W80%FB: Eggplants were planted with a 20% water reduction and a 20% fertilizer reduction, and biochar was added in the first fertilization stage.
The fertilizers used were urea (N), phosphate fertilizer (calcium superphosphate) (P2O5), and potassium fertilizer (potassium sulfate) (K2O). The organic fertilizer was a granular organic fertilizer (organic matter content was 40%), which was made by mixing chicken manure and sheep manure from Shengtian Feiye. The irrigation method was drip irrigation. The specific fertilization method and irrigation amount are shown in Table 1. After the completion of seedling raising, artificial planting and film mulching cultivation were adopted. During the entire experimental period, except for the use of drip irrigation equipment during irrigation, field management was carried out manually.

2.3. Sample Collection

Three points from each of the three experimental plots were randomly selected for soil sample collection, and soil samples were collected using soil drills at depths of 0–20 cm, 20–40 cm, 40–60 cm, 60–80 cm, and 80–100 cm on 2 October 2021 after eggplants were harvested. The soil samples were sealed and taken back to the laboratory in plastic bags and dried indoors.

2.4. Soil Aggregate Classification Method

The aggregates were screened by using the wet-sieving method [37]. A soil aggregate analyzer (TTF–100 type) was used to separate aggregates of different particle sizes. Some of the air-dried soil samples were prepared as a 50 g composite soil sample according to the proportion of each particle size of the soil aggregate, and they were placed evenly on a set of sieves, arranged from top to bottom (the diameters of the sieves were 5 mm, 2 mm, 1 mm, 0.5 mm, and 0.25 mm). Then, the soil samples were placed in a dropper to soak each sieve. The sieves were put on an oscillating frame, and they were slowly put into the wet sieve cylinder and left to stand for 10 min. Distilled water was slowly added along the cylinder wall until the topsoil samples were just submerged in water, the motor was started, and the wet-sieving method was conducted. The diameter, height, and amplitude of the sieves were 10 cm, 5 cm, and 4 cm, respectively, and the sieving frequency and time were 30 times/min and 10 min. After sieving, the sieves were slowly taken out of the distilled water, and they were left standing and dried slightly. Next, aggregates of each particle size were transferred into a beaker for drying and weighing for further analysis.

2.5. Method for Determining Organic Carbon Contents of Whole Soils and Aggregates

An element analyzer (Vario EL III, Shanghai, China) was used to determine the organic carbon (OC) content of aggregates of each particle size and soil organic carbon (SOC).

2.6. Calculation of Soil Aggregate Stability Indicators

The calculation formulas of the soil aggregate stability indexes, namely, the mean weight diameter (MWD), geometric weight diameter (GMD), >0.25 mm sized aggregates (R > 0.25), and fractal dimension (D), are as follows (1)–(4):
MWD = i n x i w i / i n w i
GMD = exp i n w i ln x i / i n w i
R > 0.25 = M r > 0.25 M T
M r < x i M T = x i x max 3 D
where n is the number of soil aggregate particle size groups, xi is the average value of the soil aggregate of particle size i (mm), xmax is the maximum particle size of the soil aggregate, wi is the percentage (%) of the i-sized aggregate in the total aggregate;  M r < x i  is the weight of soil aggregates with particle sizes less than xi, and  M T  is the total weight of soil aggregates.

2.7. Statistical Analysis

The preliminary calculations and analysis of the data were conducted using Microsoft Excel 2016. Significant differences in the measured soil parameters were determined by variance analysis in conjunction with Duncan’s multiple range test (p < 0.05, n = 3) in SPSS 22.0 (Armonk, NY, USA). The graphs were drawn by OriginPro 2021 (Northampton, MA, USA), and data processing for the correlation analysis graph was also carried out in OriginPro 2021.

3. Results

3.1. Effects of Biochar Addition on the Distribution of Soil Aggregates

Overall, while the proportions of >5 mm, 5–2 mm, 2–1 mm, and 1–0.5 mm sized aggregates increased with the depth of the soil layer, those of 0.5–0.25 mm and <0.25 mm decreased with the depth of the soil layer in the three treatments (Table 2 and Figure 2). Compared with the WF treatment, the significant impact of WFB on the aggregate distribution was mainly concentrated in the 0–80 cm soil layer. The proportions of >5 mm and <0.25 mm sized aggregates under the WFB treatment were significantly increased by 837.3% and 25.2% in the 0–20 cm soil layer. Meanwhile, we were surprised to find that compared with the WF treatment, the proportions of >5 mm, 5–2 mm, and 2–1 mm sized aggregates under the WFB treatment were significantly increased by 1074.0%, 177.7%, and 37.7% in the 20–40 cm soil layer. In the 40–60 cm and 60–80 cm soil layers, the proportions of the 2–1 mm sized aggregates were significantly increased by 18.3% and 54.2% under the WFB treatment.
Simultaneously, the significant impact of 80%W80%FB on the aggregate distribution was mainly concentrated in the 0–60 cm soil layer compared to the WF treatment. It was observed that, compared with the WF treatment, the proportions of >5 mm and 5–2 mm sized aggregates under the 80%W80%FB treatment were significantly increased by 1615.9% and 21.6% in the 0–20 cm soil layer and significantly increased by 852.7% and 172.0% in the 20–40 cm layer at the same time. In addition, the proportions of 2–1 mm and 0.5–0.25 mm sized aggregates were significantly increased by 20.1% and 11.7% in the 40–60 cm soil layer.

3.2. Effects of Biochar Addition on Soil Aggregate Stability

The stability indexes of soil aggregates in different treatments were analyzed and are shown in Table 3. Compared with WF, the significant impact of WFB on the stability indexes of aggregates was mainly concentrated in the 20–40 and 60–100 cm soil layers. The MWD, GMD, and R > 0.25 values under the WFB treatment were significantly improved by 95.2%, 68.8%, and 23.8%, while the D value was significantly reduced by 8.1% in the 20–40 cm soil layer. In addition, the GMD and R > 0.25 value significantly increased in the 60–80 cm layer by 32.2% and 10.2% under the WFB treatment, and the D value was significantly reduced by 7.8%. With respect to the 80–100 cm soil layer, the MWD, GMD, and R > 0.25 values were significantly improved by 39.6%, 41.5%, and 9.7%, and the D value was significantly reduced by 9.0%.
The situation was somewhat different for the 80%W80%FB treatment. However, the significant impact of 80%W80%FB on the stability indexes of aggregates was mainly concentrated in the 20–40 cm soil layer. While the MWD, GMD, and R > 0.25 values significantly increased by 78.6%, 51.9%, and 18.6%, the D value significantly decreased by 5.9%.

3.3. Effects of Biochar Addition on Organic Carbon Contents of Whole Soils and Aggregates

In terms of whole soils, the organic carbon (SOC) contents of five soil layers in the different treatments are presented in Figure 3. It was observed that the SOC content decreased with the depth of the soil layer for all three treatments. Compared with the WF treatment, the SOC content in the same soil layer in WFB and 80%W80%FB treatments had the same change rule. WFB and 80%W80%FB both significantly enhanced the SOC content in the plow layer (0–20 cm) by 16.5% and 56.1%, but they significantly reduced the SOC contents in the 20–40 cm, 40–60 cm, 60–80 cm, and 80–100 cm layers, ranging from 9.7% to 37.2%. The maximum decrease in amplitude for both WFB and 80%W80%FB was in the 0–20 cm soil layer, and the minimum decrease in amplitude was in the 80–100 cm and 40–60 cm soil layers, respectively. Furthermore, the SOC content under 80%W80%FB was significantly higher than under the WFB treatment across all five soil layers, ranging from 9.5% to 37.2%. It is worth noting that compared to before the experiment, WF and WFB treatments significantly reduced the surface soil SOC content by 18.5% and 5.1%, but 80%W80%FB significantly increased it by 27.1%. Both WFB and 80%W80%FB treatments significantly reduced the soil SOC content in the 20–100 cm soil layer by 27.8–35.2% and 7.7–20.9%.
The OC contents of aggregates of different sizes in the different soil layers under the three treatments are exhibited in Figure 4. In general, the OC content of aggregates of each size in the three treatments decreased with the depth of the soil layer. In the 0–20 cm soil layer, the OC content of aggregates of each size in WFB and 80%W80%FB treatments was significantly higher than that in WF. The increase in the amplitude of aggregates of six sizes (>5 mm, 5–2 mm, 2–1 mm, 1–0.5 mm, 0.5–0.25 mm, and <0.25 mm) in the 0–20 cm soil layer was 43.9% and 18.8%, 111.7% and 81.2%, 129.3% and 118.4%, 109.1% and 130.2%, 73.8% and 81.4%, and 39.4% and 52.6%, respectively. In the 20–100 cm soil layer, the OC contents in 5–2 mm, 2–1 mm, 1–0.5 mm, 0.5–0.25 mm, and <0.25 mm sized aggregates under WFB and 80%W80%FB treatments were lower than those in WF. Compared to the WFB treatment, the 80%W80%FB treatment increased the OC content of >5 mm and 5–2 mm sized aggregates by 13.3–80.3% and 7.0–49.3% in the 20-100 cm soil layer.

3.4. Correlation Analysis

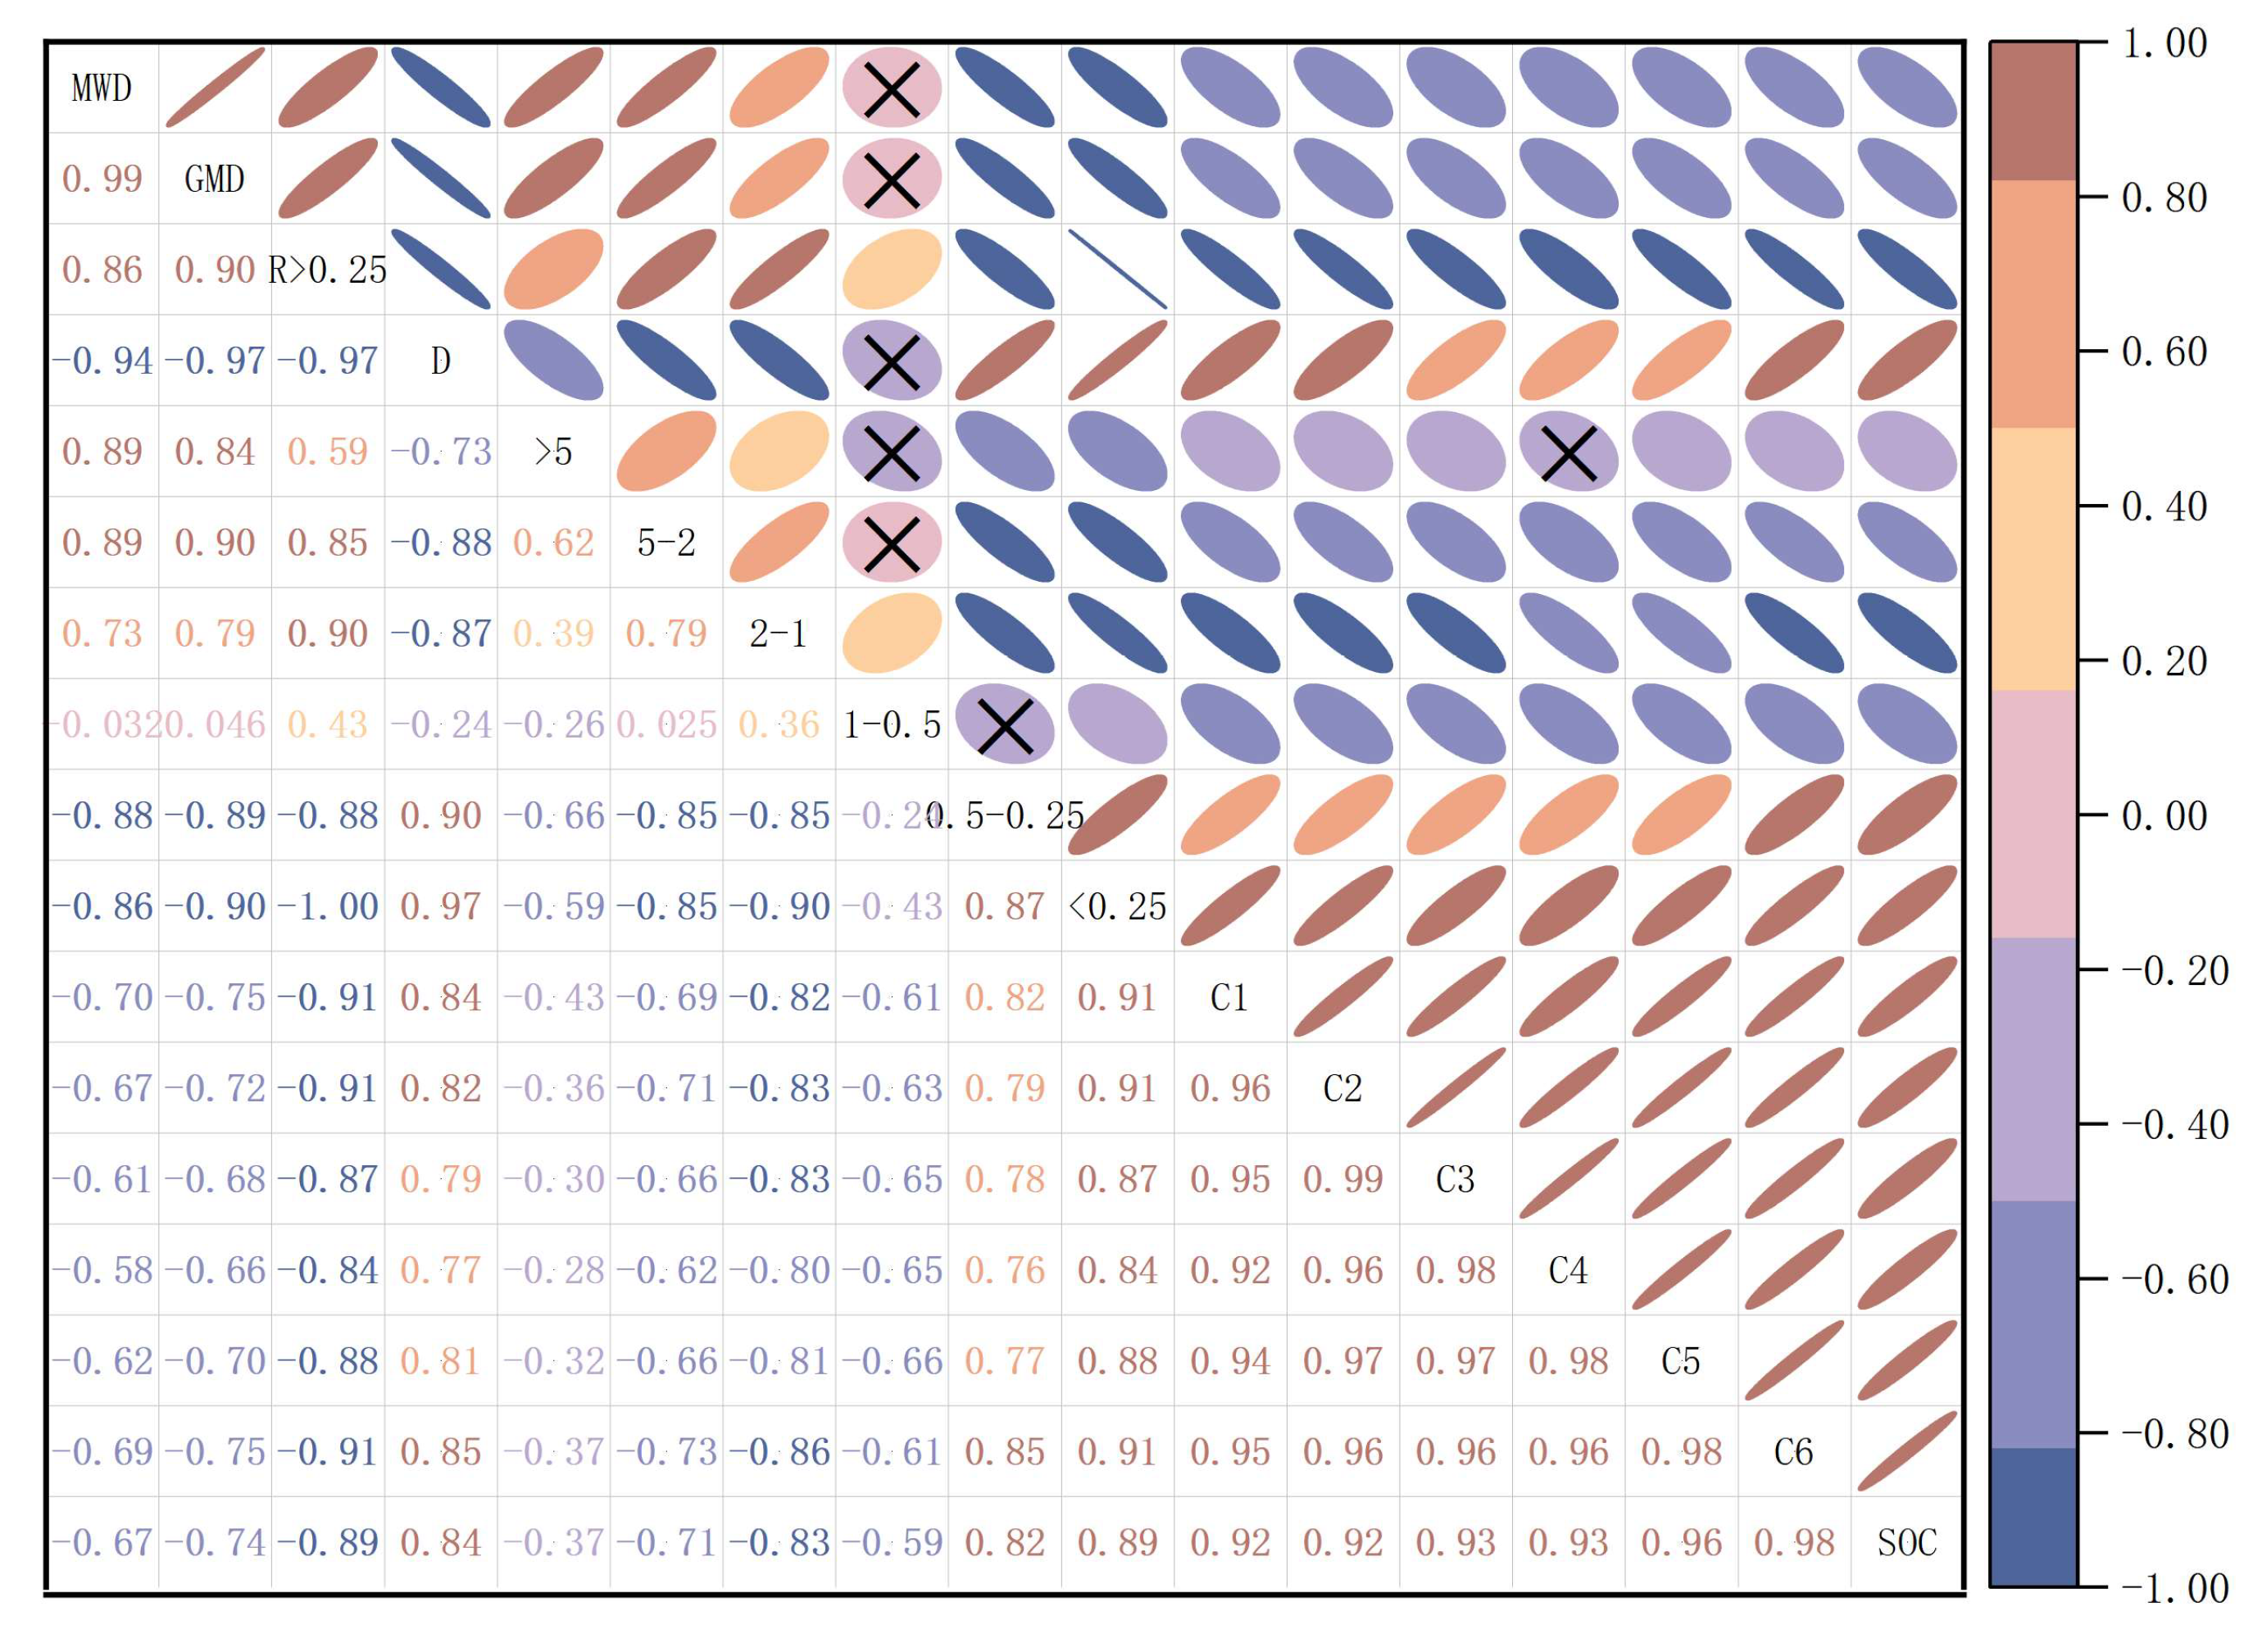
The correlation analyses of the aggregate stability indexes, proportions, and OC contents of whole soils and aggregates of each size are demonstrated in Figure 5. The soil aggregate stability indexes MWD, GMD, and R > 0.25 were positively (p < 0.05) correlated with each other, but they were significantly negatively correlated with D (p < 0.05). Macroaggregates (>5–1 mm) were positively correlated with MWD, GMD, and R > 0.25. Similarly, significant and positive correlations were obtained between the SOC contents of whole soils and the OC content of aggregates of each size (p < 0.05). However, the correlation between different aggregate sizes was slightly complex. There were significant positive correlations between >5 mm, 5–2 mm, and 2–1 mm aggregate sizes, between 2–1 mm and 1–0.5 mm aggregate sizes, and between 0.5–0.25 mm and <0.25 mm aggregate sizes (p < 0.05). However, the 0.5–0.25 mm aggregate size was significantly and negatively related to >5 mm, 5–2 mm, and 2–1 mm (p < 0.05), and the <0.25 mm aggregate size was significantly and negatively correlated with > 5 mm, 5–2 mm, 2–1 mm, and 0.5–0.25 mm (p < 0.05).

3.5. Principal Component Factor Analysis

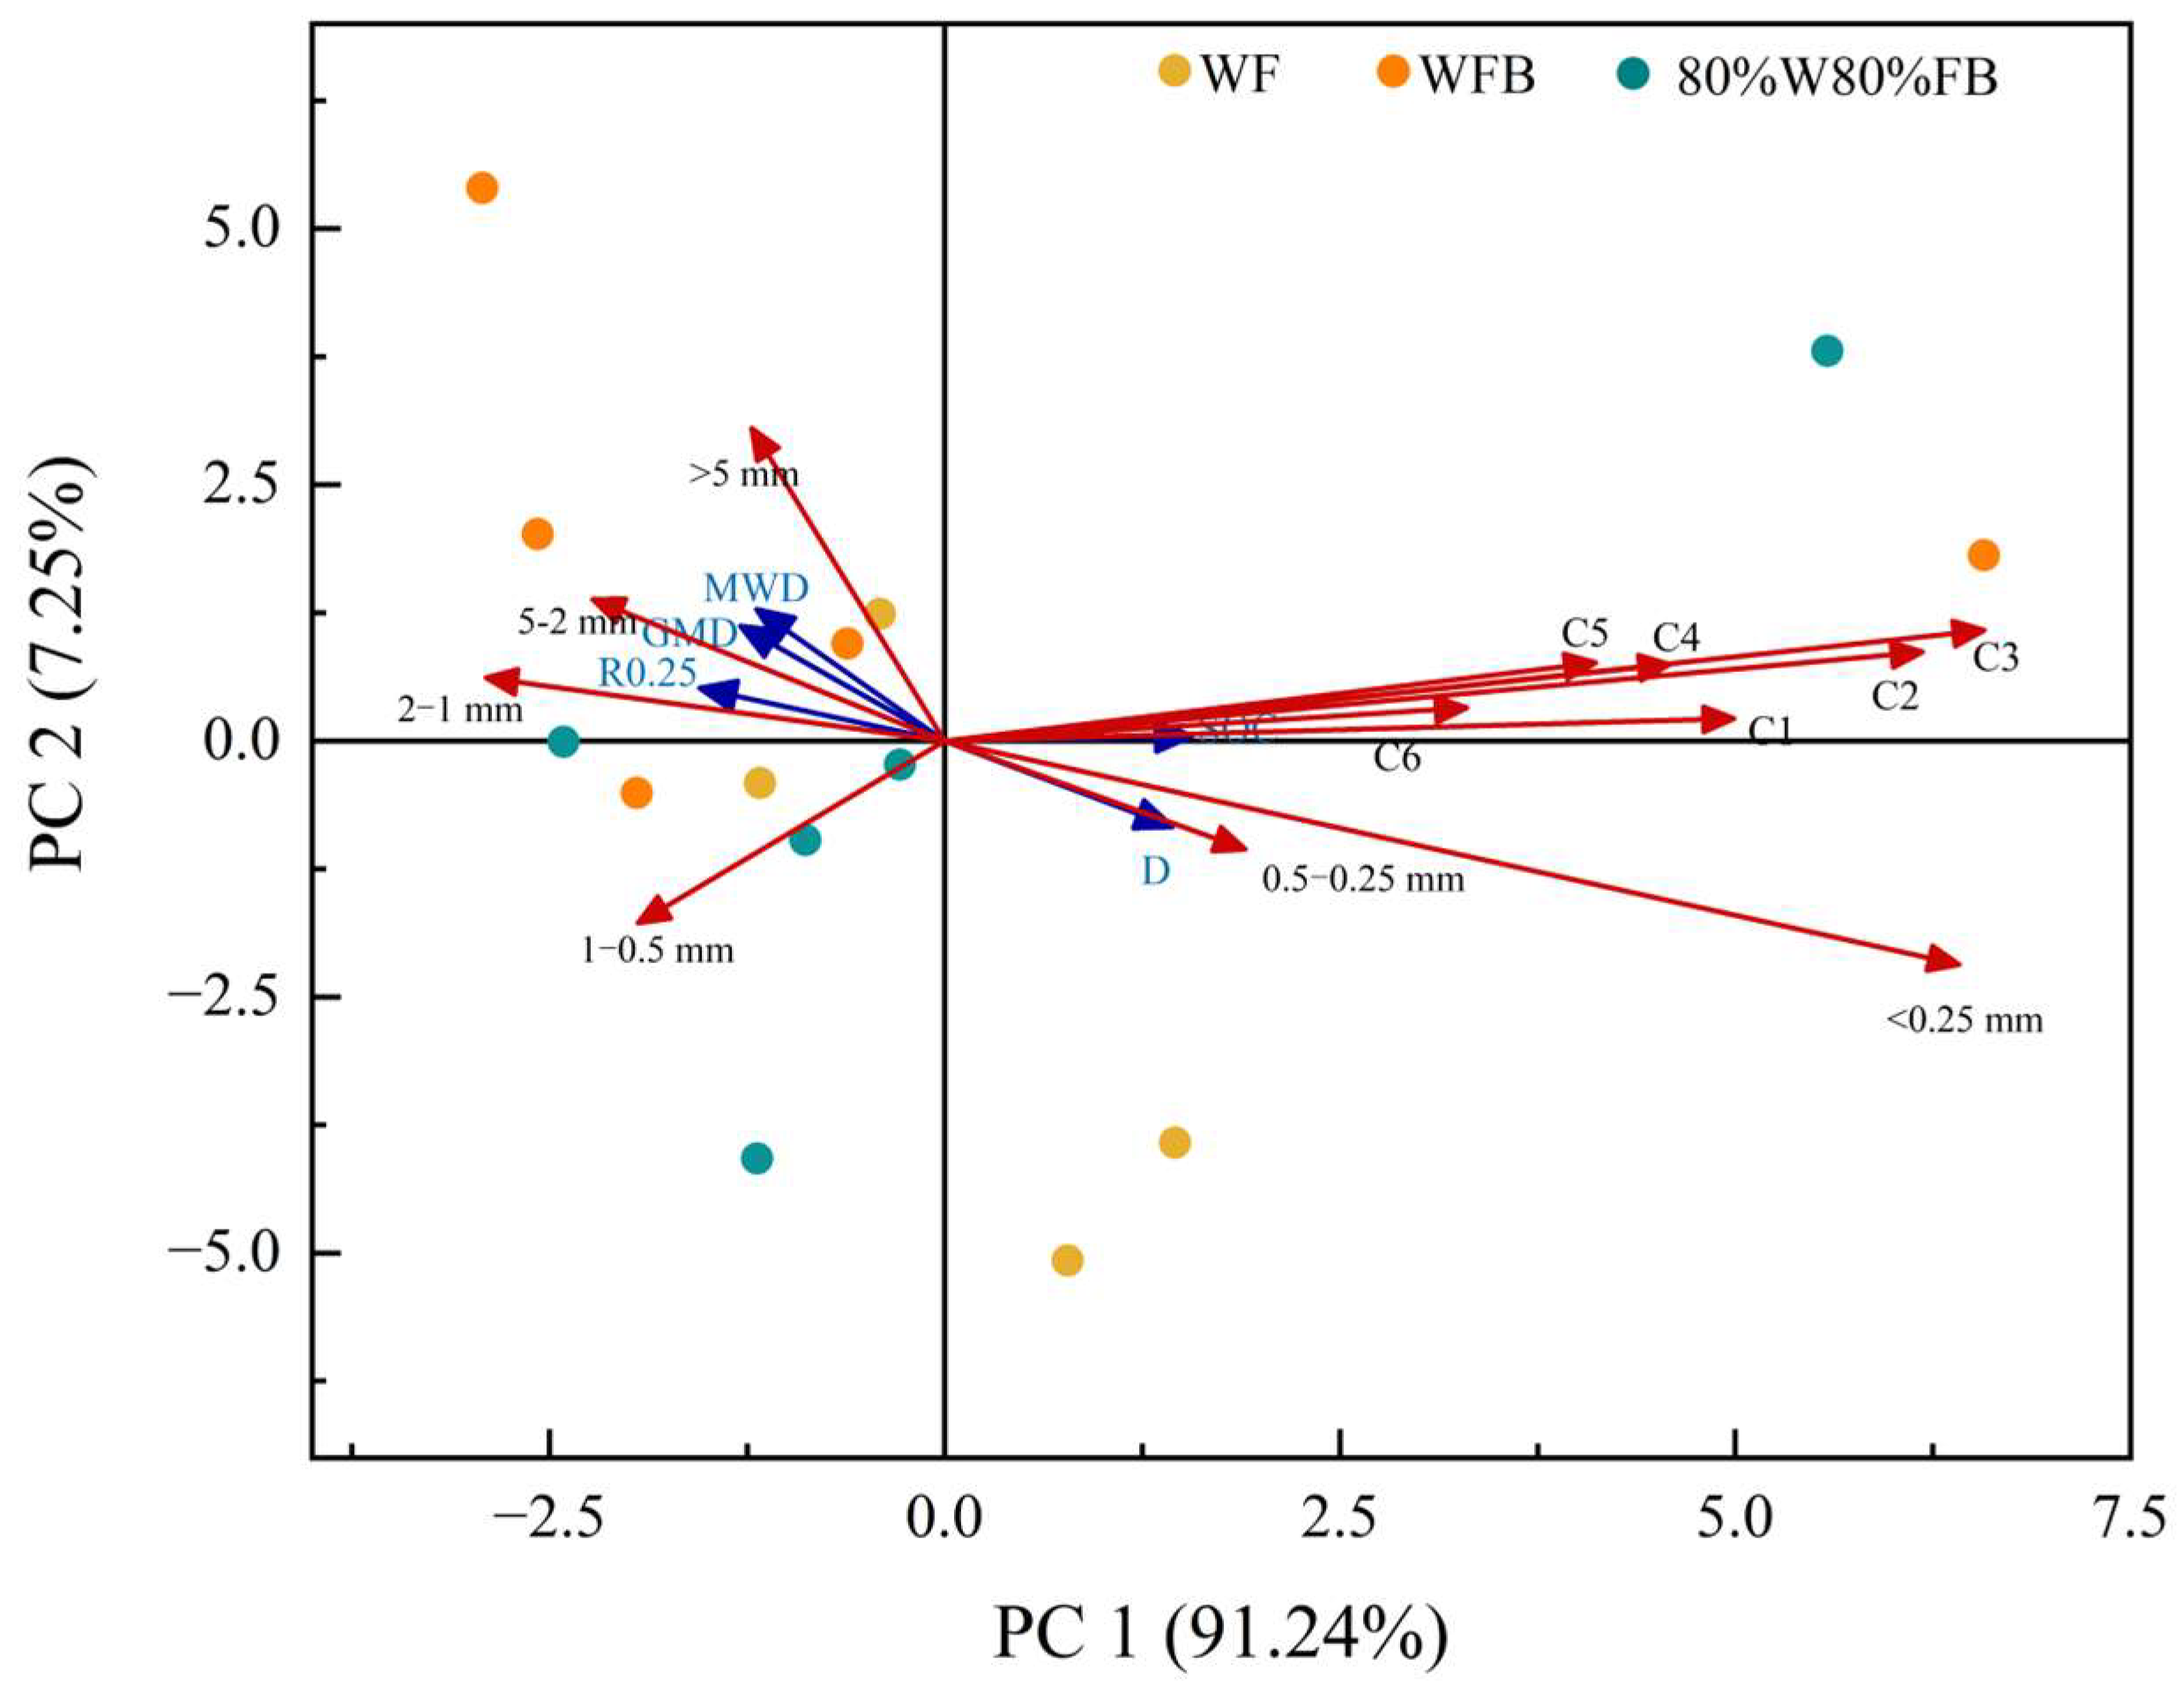
In Figure 6, it can be seen that among the three treatments, the contents of R > 0.25, 2–1 mm, and 1–0.5 sized aggregates in WF are higher, GMD, MWD, and D are at average levels, and the content of other factors are lower. The contents of MWD, GMD, R > 0.25, 5–2 mm, 2–1 mm, and 1–0.5 sized aggregates in WFB are relatively high, with >5 mm being at an average level, while the contents of other factors are relatively low. The contents of R > 0.25, GMD, MWD, >5 mm, 5–2 mm, and 2–1 mm sized aggregates in 80%W80% FB are relatively high, with 1–0.5 being at the average level, while the contents of other factors are relatively low. The consistent direction of the relationships of SOC and D with carbon in aggregates of different particle sizes indicates that SOC and D are important factors affecting the distribution of the carbon content among soil aggregates of different particle sizes.

4. Discussion

It is generally known that the size distribution and stability of soil aggregates are decisive factors for soil nutrient cycling [38]. In addition, the higher the proportion of macroaggregates (>0.25 mm) in the soil, the more stable the soil structure. Soil aggregate stability is one of the important reference indicators for measuring soil quality. In addition, soil aggregate stability is usually represented by MWD, GMD, D, and R > 0.25 [39]. Many previous studies have found that biochar could increase the content of macroaggregates and enhance the stability of soil aggregates in the top layers [40,41,42] (Table 4). In our study, we found that WFB could significantly reduce the content of macroaggregates (R > 0.25) and increase the value of D in the top layer compared to WF. However, at a soil depth of 20–100 cm, the proportion of macroaggregates was significantly increased, the value of D was significantly reduced, and the values of MWD and GMD were increased to varying degrees. There may be two reasons for this phenomenon. On the one hand, our study was conducted for 6 years, and the biochar would gradually migrate to deeper layers over the years and enhance the effect on the subsoil. On the other hand, the soil aggregates in the top layer would gradually migrate to deeper layers with the annual manual tillage. In our study, 80%W80%FB reduced the content of macroaggregates (R > 0.25) in the topsoil, but the difference was not significant. In addition, 80%W80%FB significantly increased the value of MWD in the topsoil, significantly increased the proportion of macroaggregates (R > 0.25) in the 20–60 cm soil layer, and significantly increased the values of MWD and GMD in the 20–40 cm soil layer. These results demonstrate that compared with WFB, 80%W80%FB might slow down the downward migration rate of biochar with age. This might be because the addition of biochar is beneficial for increasing the soil moisture content, which poses a risk of reducing soil cohesion and making the soil more dispersed, and 80%W80%FB could reduce this risk.
SOC determines soil fertility, and it is the basis for the formation of the soil aggregate structure [37], while soil aggregates are important sites for storing SOC. Soil aggregates of different particle sizes have different protective effects on organic carbon. Large aggregates contain more unstable organic matter, more available nutrients, and a higher fertilizer capacity, while the carbon combined with microaggregates has high biochemical stability, and they are the main components of the long-term storage of soil organic carbon [43]. Both SOC and soil aggregates interact with each other and are indispensable [44]. Han et al. found that biochar can significantly increase the SOC content of the topsoil, which is basically consistent with the results of our study [45]. Yue et al. demonstrated that biochar could increase the OC content of aggregates of different sizes in different soil layers [40], which is not exactly the same as in our study. In our study, we found that WFB and 80%W80%FB could significantly increase the SOC content of whole soils and the OC content of aggregates in the top layer. On the one hand, biochar itself is rich in OC, and biochar was mainly added to the topsoil in the current research. On the other hand, the soil type that we studied was Mollisols, which originally had a high carbon content. However, we found that WFB could decrease the SOC content of whole soils and the OC content of aggregates in the 20–100 cm soil layer. This may be because a small amount of biochar was transferred to deeper soils, and this will increase the biomass of deeper soil microorganisms, resulting in the acceleration of the transformation of SOC [46]. Simultaneously, compared with WF, the OC content of the 80%W80%FB treatment in the 20–100 cm soil layer and the OC content of aggregates of each size also decreased (except for the OC content of >5 mm sized aggregates in the 40–80 cm soil layer), but the reduction range was smaller than that of WFB. This might be because 80%W80%FB could reduce the part of biochar that moved to deeper soil with water.

5. Conclusions

Compared with WF, the WFB treatment significantly reduced the content of surface soil macroaggregates by 16.7% but promoted the accumulation of macroaggregates by 7.8–23.8% and enhanced soil aggregate stability in the 20–100 cm soil layer. Meanwhile, 80%W80%FB promoted the accumulation of macroaggregates (by 4.8–18.6%) in the 20–60 cm soil layer and enhanced soil aggregate stability in the 0–60 cm layer compared to the WF treatment. However, compared with the WF treatment, WFB and 80%W80%FB both promoted the accumulation of SOC content in the topsoil (by 16.5% and 56.1%) and reduced the SOC content in the 20–100 cm soil layer (by 19.5–37.2% and 9.7–19.2%). Furthermore, WFB and 80%W80%FB treatments promoted the accumulation of the OC content of aggregates of different particle sizes in the topsoil. It can be seen that when adding biochar, proper water reduction and weight loss can increase the content of soil total organic carbon while maintaining the content of surface soil macroaggregates and reducing the downward transfer of surface soil macroaggregates. However, further experiments are needed to determine the specific amounts of water loss and weight loss.

Author Contributions

Conceptualization, M.Z. and Y.S.; methodology, Y.C. and Y.S.; software, X.J.; validation, S.X.; formal analysis, M.Z. and Y.C.; investigation, S.X., Y.C. and Y.S.; resources, Y.C. and Y.S.; data curation, S.X., Y.C. and Y.S.; writing—original draft preparation, S.X.; writing—review and editing, M.Z. and X.J.; visualization, S.X.; supervision, M.Z. and X.J.; project administration, M.Z., Y.S. and X.J.; funding acquisition, Y.S. and X.J. All authors have read and agreed to the published version of the manuscript.

Funding

This research was supported by the National Natural Science Foundation of China (Grant Number/Award: 42077081) and Strategic Priority Research Program of the Chinese Academy of Sciences (Grant Number/Award: XDA28070302).

Data Availability Statement

The data that support the findings of this study are available from the corresponding author upon reasonable request.

Conflicts of Interest

The authors all declare no conflict of interest.

References

  1. Zhou, J.; Xia, X.J.; Hu, Z.J.; Fan, P.X.; Shi, K.; Zhou, Y.H.; Yu, J.Q. Technological development and production of protected vegetable in China during ‘The Thirteenth Five-year Plan’ and future prospect. China Veg. 2021, 10, 20–34. [Google Scholar] [CrossRef]
  2. Ouyang, W.; Wu, Y.; Hao, Z.; Zhang, Q.; Bu, Q.; Gao, X. Combined impacts of land use and soil property changes on soil erosion in a mollisol area under long-term agricultural development. Sci. Total Environ. 2022, 36, 1203–1215. [Google Scholar] [CrossRef]
  3. Yan, Y.; Ji, W.; Li, B.; Wang, G.; Hu, B.; Zhang, C.; Mouazen, A.M. Effects of long-term straw return and environmental factors on the spatiotemporal variability of soil organic matter in the black soil region: A case study. Agronomy 2022, 12, 2532. [Google Scholar] [CrossRef]
  4. Bis, Z.; Kobyłecki, R.; Ścisłowska, M.; Zarzycki, R. Biochar—Potential tool to combat climate change and drought. Ecohydrol. Hydrobiol. 2018, 18, 441–453. [Google Scholar] [CrossRef]
  5. Lei, O.; Zhang, R. Effects of biochars derived from different feedstocks and pyrolysis temperatures on soil physical and hydraulic properties. J. Soils Sediments 2013, 13, 1561–1572. [Google Scholar] [CrossRef]
  6. Zhou, M.; Xiao, Y.; Zhang, X.; Xiao, L.; Ding, G.; Cruse, R.M.; Liu, X. Fifteen years of conservation tillage increases soil aggregate stability by altering the contents and chemical composition of organic carbon fractions in Mollisols. Land Degrad. Dev. 2022, 33, 2932–2944. [Google Scholar] [CrossRef]
  7. Zhou, M.; Xiao, Y.; Xiao, L.; Li, Y.; Zhang, X.; Richard, M.; Cruse, R.M.; Liu, X. Increased soil aggregate stability by altering contents and chemical composition of organic carbon fractions via seven years of manure addition in Mollisols. Agriculture 2023, 13, 88. [Google Scholar] [CrossRef]
  8. Paul, B.K.; Vanlauwe, B.; Ayuke, F.; Hoogmoed, M.; Hurisso, T.T.; Koala, S.; Lelei, D.; Ndabamenye, T.; Six, J.; Pulleman, M.M. Medium-term impact of tillage and residue management on soil aggregate stability, soil carbon and crop productivity. Agric. Ecosyst. Environ. 2013, 164, 14–22. [Google Scholar] [CrossRef]
  9. Wang, J.; Dai, W.; Fang, K.; Gao, H.; Sha, Z.; Cao, L. Nutrient Characterization in Soil Aggregate Fractions with Different Fertilizer Treatments in Greenhouse Vegetable Cultivation. Agriculture 2022, 12, 440. [Google Scholar] [CrossRef]
  10. Wu, M.; Pang, D.; Chen, L.; Li, X.; Liu, L.; Liu, B.; Li, J.; Wang, J.; Ma, L. Chemical composition of soil organic carbon and aggregate stability along an elevation gradient in Helan Mountains, northwest China. Ecol. Indic. 2021, 131, 108228. [Google Scholar] [CrossRef]
  11. Walters, R.D.; White, J.G. Biochar in situ decreased bulk density and improved soil-water relations and indicators in southeastern US coastal plain ultisols. Soil Sci. 2018, 183, 99–111. [Google Scholar] [CrossRef]
  12. Joseph, S.; Cowie, A.L.; Van Zwieten, L.; Bolan, N.; Budai, A.; Buss, W.; Cayuela, M.L.; Graber, E.R.; Ippolito, J.A.; Kuzyakov, Y.; et al. How biochar works, and when it doesn’t: A review of mechanisms controlling soil and plant responses to biochar. GCB Bioenergy 2021, 13, 1731–1764. [Google Scholar] [CrossRef]
  13. Zhang, S.; Cui, J.; Wu, H.; Zheng, Q.; Zhang, S. Organic carbon, total nitrogen, and microbial community distributions within aggregates of calcareous soil treated with biochar. Agric. Ecosyst. Environ. 2021, 314, 107408. [Google Scholar] [CrossRef]
  14. Ouyang, L.; Wang, F.; Tang, J.; Yu, L.; Zhang, R. Effects of biochar amendment on soil aggregates and hydraulic properties. J. Soil Sci. Plant Nutr. 2013, 13, 991–1002. [Google Scholar] [CrossRef]
  15. Fan, Z.; Chao, L. Significance of microbial asynchronous anabolism to soil carbon dynamics driven by litter inputs. Sci. Rep. 2015, 5, 9575. [Google Scholar] [CrossRef]
  16. Liu, S.; Six, J.; Zhang, H.X.; Zhang, Z.B.; Peng, X.H. Integrated aggregate turnover and soil organic carbon sequestration using rare earth oxides and 13C isotope as dual tracers. Geoderma 2023, 430, 116313. [Google Scholar] [CrossRef]
  17. Sun, J.N.; Wang, B.C.; Xu, G.; Shao, H.B. Effects of wheat straw biochar on carbon mineralization and guidance for large-scale soil quality improvement in the coastal wetland. Ecol. Eng. 2014, 62, 43–47. [Google Scholar] [CrossRef]
  18. Wang, Y.L.; Zhou, F.; Zhang, F.; Ma, W.G.; Wang, Q.; Cao, S.L.; Geng, Z.C. Influence of biochar on soil respiration and soil organic carbon fractions. Res. J. Environ. Sci. 2017, 30, 920–928. [Google Scholar]
  19. Singh, R.; Babu, J.N.; Kumar, R.; Srivastava, P.; Singh, P.; Raghubanshi, A.S. Multifaceted application of crop residue biochar as a tool for sustainable agriculture: An ecological perspective. Ecol. Eng. 2015, 77, 324–347. [Google Scholar] [CrossRef]
  20. Sohi, S.P.; Krull, E.; Lopez-Capel, E.; Bol, R. A review of biochar and its use and function in soil. Adv. Agron. 2010, 105, 47–82. [Google Scholar] [CrossRef]
  21. Weber, K.; Quicker, P. Properties of biochar. Fuel 2018, 217, 240–261. [Google Scholar] [CrossRef]
  22. Mark, G.; Tu, N.; Marissa, M.; Kandis Leslie, G. Physiochemical properties of biochar and activated carbon from biomass residue: Influence of process conditions to adsorbent properties. ACS Omega 2021, 6, 10224–10233. [Google Scholar] [CrossRef]
  23. Brassard, P.; Godbout, S.; Raghavan, V. Soil biochar amendment as a climate change mitigation tool: Key parameters and mechanisms involved. J. Environ. Manag. 2016, 181, 484–497. [Google Scholar] [CrossRef]
  24. Shane, M.T.; Peadar, G.L.; Cornelius, J.O.; Mark, G.H. The impact of biochar addition on nutrient leaching and soil properties from tillage soil amended with pig manure. Water Air Soil Pollut. 2014, 225, 1900. [Google Scholar] [CrossRef]
  25. Lehmann, J.; Rillig, M.C.; Thies, J.; Masiello, C.A.; Hockaday, W.C.; Crowley, D. Biochar effects on soil biota—A review. Soil Biol. Biochem. 2011, 43, 1812–1836. [Google Scholar] [CrossRef]
  26. Jeffery, S.; Verheijen, F.G.; van der Velde, M.; Bastos, A.C. A quantitative review of the effects of biochar application to soils on crop productivity using meta-analysis. Agric. Ecosyst. Environ. 2011, 144, 175–187. [Google Scholar] [CrossRef]
  27. Biederman, L.A.; Harpole, W.S. Biochar and its effects on plant productivity and nutrient cycling: A meta-analysis. Glob. Change Biol. Bioenergy 2013, 5, 202–214. [Google Scholar] [CrossRef]
  28. Lehmann, J.; Cowie, A.; Masiello, C.; Kammann, C.; Woolf, D.; Amonette, J.; Cayuela, M.; Camps-Arbestain, M.; Whitman, T. Biochar in climate change mitigation. Nat. Geosci. 2021, 14, 883–892. [Google Scholar] [CrossRef]
  29. Lehmann, J.; Gaunt, J.; Rondon, M. Bio-char sequestration in terrestrial ecosystems—A review. Mitig. Adapt. Strateg. Glob. Chang. 2006, 11, 403–427. [Google Scholar] [CrossRef]
  30. Sun, Z.; Zhang, Z.; Zhu, K.; Wang, Z.; Zhao, X.; Lin, Q.; Li, G. Biochar altered native soil organic carbon by changing soil aggregate size distribution and native SOC in aggregates based on an 8-year field experiment. Sci. Total Environ. 2020, 708, 134829. [Google Scholar] [CrossRef]
  31. Lee, M.-H.; Chang, E.-H.; Lee, C.-H.; Chen, J.-Y.; Jien, S.-H. Effects of Biochar on Soil Aggregation and Distribution of Organic Carbon Fractions in Aggregates. Processes 2021, 9, 1431. [Google Scholar] [CrossRef]
  32. Du, Z.L.; Zhao, J.K.; Wang, Y.D.; Zhang, Q.Z. Biochar addition drives soil aggregation and carbon sequestration in aggregate fractions from an intensive agricultural system. J. Soil. Sediment. 2017, 17, 581–589. [Google Scholar] [CrossRef]
  33. Yang, Y.; Sun, K.; Han, L.F.; Chen, Y.L.; Liu, J.; Xing, B.S. Biochar stability and impact on soil organic carbon mineralization depend on biochar processing, aging and soil clay content. Soil Biol. Biochem. 2022, 169, 108657. [Google Scholar] [CrossRef]
  34. Jing, Y.; Zhang, Y.; Han, I.; Wang, P.; Mei, Q.; Huang, Y. Efects of diferent straw biochars on soil organic carbon, nitrogen, available phosphorus, and enzyme activity in paddy soil. Sci. Rep. 2020, 10, 8837. [Google Scholar] [CrossRef] [PubMed]
  35. Wang, Y.; Zhou, M.; Hou, M.; Chen, Y.M.; Sui, Y.Y.; Jiao, X.G. Regulation of nitrogen balance and yield on greenhouse eggplant under biochar addition in Mollisol. Plant Soil Environ. 2022, 68, 36–48. [Google Scholar] [CrossRef]
  36. Colombo, J.I.; Wilches, J.; Leon, R. Seismic fragility of legged liquid storage tanks based on soil type classifications. J. Constr. Steel Res. 2022, 192, 107212. [Google Scholar] [CrossRef]
  37. Zhou, M.; Liu, C.; Wang, J.; Meng, Q.; Yuan, Y.; Ma, X.; Liu, X.; Zhu, Y.; Ding, G.; Zhang, J.; et al. Soil aggregates stability and storage of soil organic carbon respond to cropping systems on black soils of Northeast China. Sci. Rep. 2020, 10, 265. [Google Scholar] [CrossRef]
  38. Peth, S.; Horn, R.; Beckmann, F.; Donath, T.; Fischer, J.; Smucker, A.J.M. Three-dimensional quantification of intra-aggregate pore-space features using synchrotron-radiation-based microtomography. Soil Sci. Soc. Am. J. 2008, 72, 897–907. [Google Scholar] [CrossRef]
  39. Kong, T.W.; Liu, B.H.; Henderson, M.; Zhou, W.Y.; Su, Y.H.; Wang, S.; Wang, L.G.; Wang, G.B. Effects of shelterbelt transformation on soil aggregates characterization and erodibility in China black soil farmland. Agriculture 2022, 14, 1917. [Google Scholar] [CrossRef]
  40. Yue, F.X.; Li, J.W.; Qiao, X.X.; Jiao, N.Y.; Yin, F.; Guo, D.Y.; Wang, Y.F.; Liu, L. Effects of biochar application on soil aggregates stability and organic carbon and total nitrogen distribution in the Hilly Area of Western Henan province, China. J. Soil Water Conserv. 2019, 33, 265–272. [Google Scholar] [CrossRef]
  41. Han, L.F.; Sun, K.; Yang, Y.; Xia, X.H.; Li, F.B.; Yang, Z.F.; Xing, B.S. Biochar’s stability and effect on the content, composition and turnover of soil organic carbon. Geoderma 2020, 364, 114184. [Google Scholar] [CrossRef]
  42. Hua, L.; Lu, Z.Q.; Ma, H.R.; Jin, S.S. Effect of biochar on carbon dioxide release, organic carbon accumulation, and aggregation of soil. Environ. Prog. Sustain. Energy 2014, 33, 941–946. [Google Scholar] [CrossRef]
  43. Zhang, Z.H.; Nie, J.; Liang, H.; Wei, C.L.; Wang, Y.; Liao, Y.L.; Lu, Y.H.; Zhou, G.P.; Gao, W.D. The effects of co-utilizing green manure and rice straw on soil aggregates and soil carbon stability in a paddy soil in southern China. J. Integr. Agric. 2023, 22, 1529–1545. [Google Scholar] [CrossRef]
  44. Nascimento, M.D.; Barreto-Garcia, P.; Monroe, P.; Scoriza, R.; Gomes, V. Interaction between edaphic mesofauna and organic carbon within water-stable aggregates in forestry systems: A case study in northeastern Brazil. Catena 2021, 202, 105269. [Google Scholar] [CrossRef]
  45. Weng, Z.; Van Zwieten, L.; Singh, B.P.; Tavakkoli, E.; Joseph, S.; Macdonald, L.M.; Rose, T.J.; Rose, M.T.; Kimber, S.W.; Morris, S.; et al. Biochar built soil carbon over a decade by stabilizing rhizodeposits. Nat. Clim. Chang. 2017, 7, 371–376. [Google Scholar] [CrossRef]
  46. Pokharel, P.; Ma, Z.; Chang, S.X. Biochar increases soil microbial biomass with changes in extra- and intracellular enzyme activities: A global meta-analysis. Biochar 2021, 2, 65–79. [Google Scholar] [CrossRef]
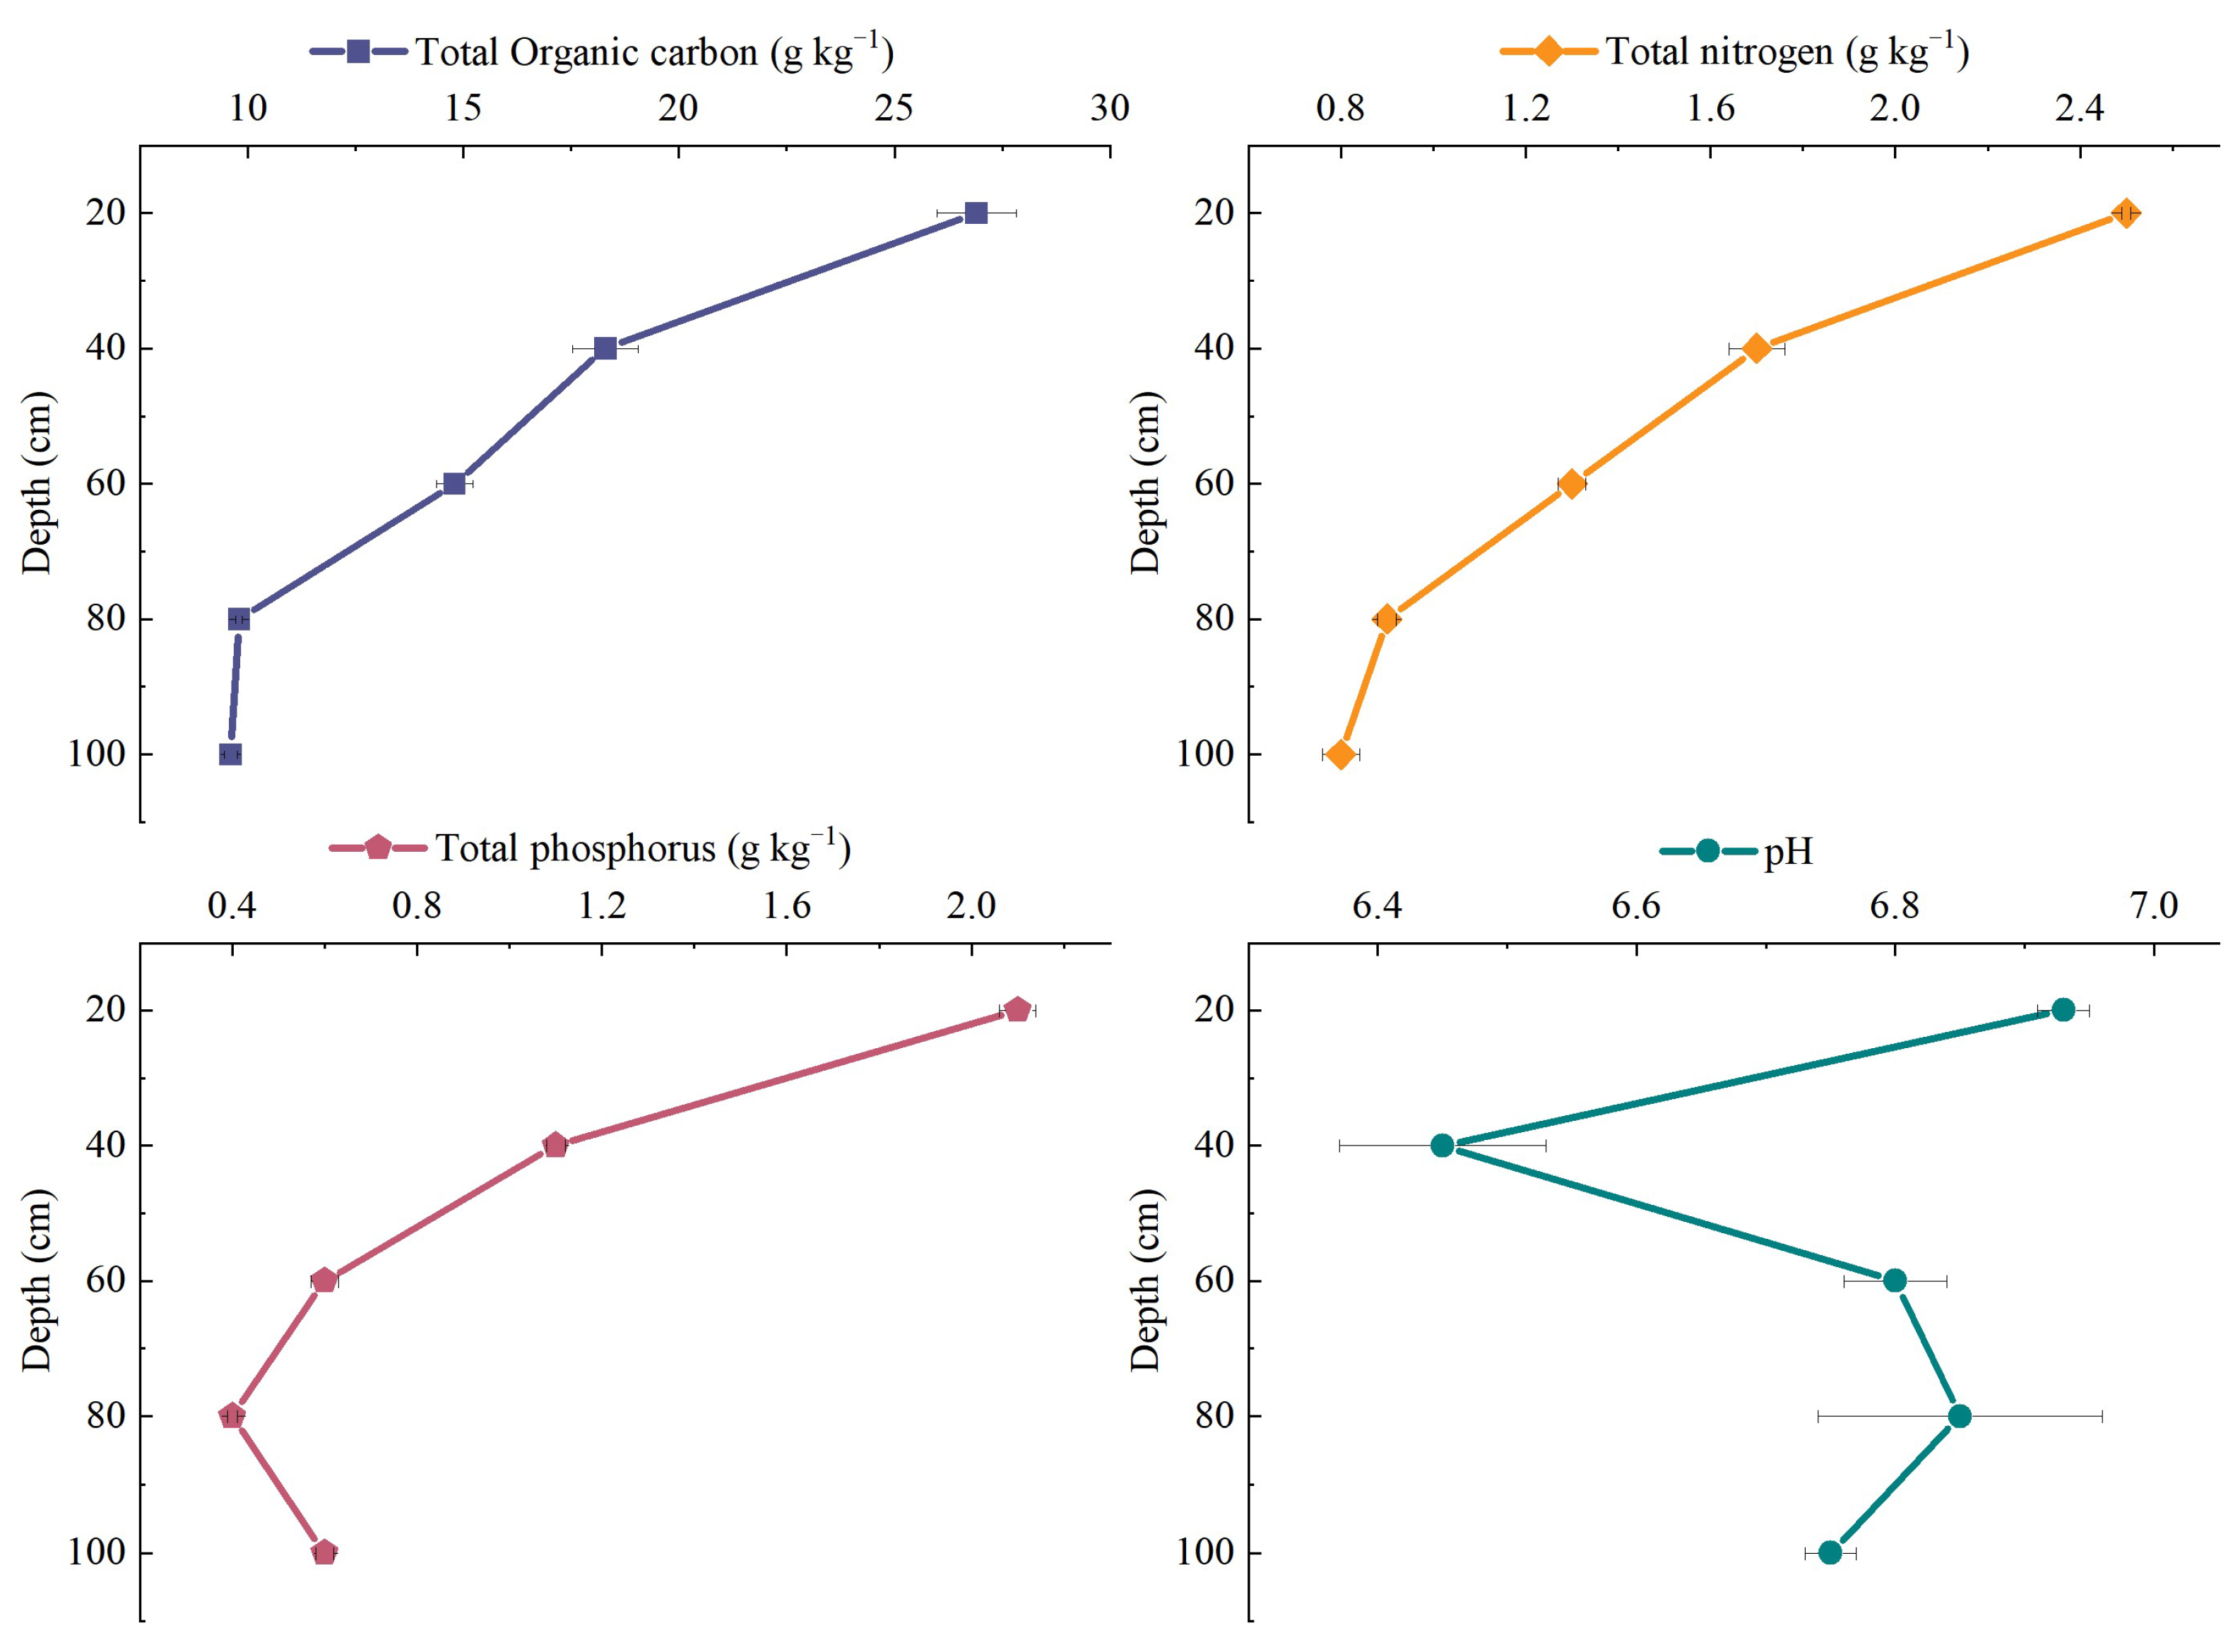
Figure 1. Basic soil nutrients of facility vegetable field in 2016.
Agronomy 13 01532 g001
Figure 2. The distribution of soil aggregates in the different treatments. Different lowercase letters in each soil layer represent significant differences at p < 0.05 level.
Agronomy 13 01532 g002
Figure 3. The total organic carbon content in the different soil layers under the three treatments. Different lowercase letters in each soil layer represent significant differences at the p < 0.05 level.
Agronomy 13 01532 g003
Figure 4. The total organic carbon contents of soil aggregates of different sizes in different soil layers under the three treatments. Different lowercase letters in each soil layer represent significant differences at the p < 0.05 level.
Agronomy 13 01532 g004
Figure 5. Correlation analyses of aggregate stability indexes and organic carbon contents of aggregates of each size and the soil. C1, C2, C3, C4, C5, and C6, respectively, represent the OC contents of aggregates with particle sizes >5 mm, 2–5 mm, 1–2 mm, 0.5–1 mm, 0.25–0.5 mm, and <0.25 mm; × indicates no significant difference at the p < 0.05 level.
Agronomy 13 01532 g005
Figure 6. RDA ranking chart of carbon content and soil factors for different soil particle sizes. C1, C2, C3, C4, C5, and C6, respectively, represent the OC contents of aggregates with particle sizes of 5 mm, 2–5 mm, 1–2 mm, 0.5–1 mm, 0.25–0.5 mm, and <0.25 mm; × indicates no significant difference at the p < 0.05 level.
Agronomy 13 01532 g006
Table 1. Specific fertilization and irrigation amounts in different treatments in 2016.
FertilizationIrrigation
31 May16 July13 August31 MayJune–
September
Biochar
(kg hm−2)
Basal Fertilizer
(kg hm−2)
Topdressing (kg hm−2)Topdressing (kg hm−2)Irrigation Volume
(m3 hm−2)
Organic FertilizerNP2O5K2ONNK2O
-5000727211070231132745
30,0005000727211070231132745
30,000500057.657.6885618.490.421.636
Table 2. The distribution of soil aggregates in the different treatments (%).
Soil LayerTreatmentAggregate Sizes (mm)
>55–22–11–0.50.5–0.25<0.25
0–20 (cm)WF0.35 ± 0.22 c5.24 ± 0.11 b12.35 ± 1.44 a23.08 ± 0.46 a19.11 ± 1.10 a39.88 ± 0.90 b
WFB3.27 ± 0.11 b4.79 ± 0.05 c6.19 ± 0.42 c15.58 ± 1.34 b20.23 ± 3.42 a49.94 ± 5.01 a
80%W80%FB5.99 ± 2.21 a6.37 ± 0.30 a9.55 ± 0.35 b16.34 ± 0.40 b20.77 ± 0.38 a40.97 ± 2.88 b
20–40 (cm)WF0.76 ± 0.59 b4.46 ± 2.47 b12.86 ± 1.67 b24.61 ± 1.29 a18.85 ± 2.81 a38.46 ± 2.03 a
WFB8.94 ± 5.21 a12.39 ± 2.82 a17.71 ± 1.45 a25.80 ± 2.72 a11.39 ± 0.02 b23.79 ± 3.84 b
80%W80%FB7.25 ± 1.13 a12.13 ± 0.01 a15.25 ± 0.21 ab24.48 ± 1.75 a13.86 ± 0.09 b27.03 ± 0.73 b
40–60 (cm)WF7.89 ± 3.08 a14.07 ± 0.16 a18.34 ± 0.26 b21.62 ± 0.50 a13.27 ± 0.54 b24.80 ± 2.13 a
WFB6.38 ± 1.89 a12.99 ± 1.64 a21.70 ± 1.40 a28.30 ± 2.28 a11.71 ± 0.39 c18.92 ± 0.54 b
80%W80%FB0.59 ± 0.24 b14.77 ± 4.96 a22.02 ± 1.77 a26.59 ± 5.67 a14.82 ± 1.12 a21.21 ± 0.31 b
60–80 (cm)WF6.34 ± 4.21 ab11.32 ± 3.30 a17.12 ± 1.13 b25.73 ± 3.67 b13.56 ± 1.77 a20.77 ± 3.25 a
WFB11.16 ± 3.40 a13.19 ± 0.14 a26.40 ± 1.78 a25.36 ± 2.79 b9.94 ± 0.71 b13.96 ± 1.54 b
80%W80%FB0.91 ± 0.41 b10.41 ± 1.22 a15.25 ± 1.76 b32.34 ± 0.24 a16.10 ± 0.79 a24.99 ± 1.54 a
80–100 (cm)WF6.44 ± 0.80 b17.72 ± 6.61 a24.02 ± 4.11 a22.10 ± 7.01 a11.00 ± 1.82 b18.72 ± 2.69 a
WFB19.14 ± 0.28 a19.74 ± 0.83 a20.62 ± 0.38 a20.42 ± 0.32 a9.22 ± 0.04 b10.86 ± 0.57 b
80%W80%FB7.02 ± 1.79 b15.15 ± 1.82 a21.50 ± 1.66 a27.26 ± 0.02 a13.17 ± 0.06 a15.90 ± 1.88 a
Note: Values are given as the mean ± standard error. Different lowercase letters in each soil layer represent significant differences at the p < 0.05 level. WF: Eggplant was planted with conventional application amounts of water and fertilizer; WFB: eggplant was planted with conventional application amounts of water and fertilizer, and biochar was added in the first fertilization stage; 80%W80%FB: eggplant was planted with 20% water reduction and 20% fertilizer reduction, and biochar was added in the first fertilization stage.
Table 3. The stability indexes of soil aggregates in the different treatments.
Soil LayerTreatmentStability Index
MWDGMDR > 0.25D
0–20
(cm)
WF0.73 ± 0.03 b0.50 ± 0.02 ab60.12 ± 0.90 a2.69 ± 0.01 b
WFB0.74 ± 0.01 b0.45 ± 0.01 b50.06 ± 5.01 b2.77 ± 0.03 a
80%W80%FB0.97 ± 0.12 a0.55 ± 0.05 a59.03 ± 2.88 a2.70 ± 0.03 b
20–40
(cm)
WF0.74 ± 0.08 b0.51 ± 0.04 b61.54 ± 2.03 b2.68 ± 0.03 a
WFB1.44 ± 0.31 a0.87 ± 0.15 a76.21 ± 3.84 a2.46 ± 0.07 b
80%W80%FB1.32 ± 0.04 a0.78 ± 0.01 a72.97 ± 0.73 a2.52 ±0.01 b
40–60
(cm)
WF1.44 ± 0.14 a0.85 ± 0.07 a75.20 ± 2.13 b2.48 ± 0.04 a
WFB1.40 ± 0.11 a0.90 ± 0.04 a81.08 ± 0.54 a2.39 ± 0.00 b
80%W80%FB1.18 ± 0.14 a0.79 ± 0.07 a78.79 ± 0.31 a2.45 ±0.01 a
60–80
(cm)
WF1.33 ± 0.30 ab0.83 ± 0.15 b78.10 ± 3.18 b2.45 ± 0.07 a
WFB1.68 ± 0.16 a1.09 ± 0.11 a86.04 ± 1.54 a2.26 ± 0.05 b
80%W80%FB1.00 ± 0.04 b0.68 ± 0.03 b75.01 ± 1.54 b2.52 ± 0.03 a
80–100
(cm)
WF1.56 ± 0.27 b0.99 ± 0.19 b81.28 ± 2.69 b2.37 ± 0.08 a
WFB2.17 ± 0.02 a1.40 ± 0.02 a89.14 ± 0.57 a2.15 ± 0.02 b
80%W80%FB1.50 ± 0.12 b0.96 ± 0.07 b84.10 ± 1.88 b2.34 ± 0.04 a
Note: Values are given as the mean ± standard error. Different lowercase letters in each soil layer represent significant differences at the p < 0.05 level. WF: Eggplant was planted with conventional application amounts of water and fertilizer; WFB: eggplant was planted with conventional application amounts of water and fertilizer, and biochar was added in the first fertilization stage; 80%W80%FB: eggplant was planted with 20% water reduction and 20% fertilizer reduction, and biochar was added in the first fertilization stage. MWD: mean weight diameter; GMD: geometric weight diameter; R > 0.25: >0.25 mm sized aggregates; D: fractal dimension.
Table 4. Comparison of the results of this study with previous studies.
Literature SourcesStudy AreaSoil TypeMain Research Results
Effect of biochar addition on soil aggregates
Walters et al., 2018 [11]Williamsdale FarmBiofuels Extension and Research Center in Wallace, NorthCarolinaSoil is a mix of Noboco and Goldsboro series sandy loamsBiochar can improve soil aggregate structure
Sun et al., 2014 [17]Shenyang Agricultural UniversityBrown earthAll biochar treatments increased small macroaggregates (0.25–2 mm) and the soil aggregate stability
Du et al., 2017 [32]Huantai Experimental Station for Ecological and Sustainability and locates in Shandong Province, ChinaNo-tillage soil in farmlandBiochar can interact with soil organic matter to increase soil aggregation, as well as increase microbial activity and the number of mycorrhizal fungi to promote aggregate formation and stability
Yue et al., 2019 [40] Hilly Area of Western Henan Province, ChinaPaddy soilBiochar could increase the content of macroaggregates and enhance the stability of soil aggregates in top layers
Our studyHorticultural Branch of the Heilongjiang Academy of Agricultural SciencesMollisolsWFB could significantly reduce the content of macroaggregates and decrease the stability of soil aggregates in the top layer, but they increased in 20–100 cm layers; 80%W80%FB significantly increased the stability of soil aggregates in 0–60 cm layers
Effect of biochar addition on soil organic carbon and aggregate organic carbon
Yang et al., 2022 [33]Shaoguan, Guangdong Province, and Shenyang, Liaoning Province, ChinaSandy clay loam and sandy loamAt the end of the incubation, the total carbon loss of biochar-amended soil was 16–53% lower than that of unamended soil, and the lowest carbon loss was found in soils amended with 600 °C biochar
Jing et al., 2020 [34]Changzhou, Jiangsu Province, ChinaSoil of rice fieldsThe addition of biochar increased the soil organic carbon content.
Yue et al., 2019 [40] Hilly Area of Western Henan Province, ChinaPaddy soilBiochar could increase the OC content of aggregates of different sizes in the different soil layers
Our studyHorticultural Branch of the Heilongjiang Academy of Agricultural SciencesMollisolsWFB and 80%W80%FB could significantly increase the SOC content of whole soils and the OC content of aggregates in the top layer;
WFB could decrease the SOC content of whole soils and the OC content of aggregates in the 20–100 cm soil layer
Disclaimer/Publisher’s Note: The statements, opinions and data contained in all publications are solely those of the individual author(s) and contributor(s) and not of MDPI and/or the editor(s). MDPI and/or the editor(s) disclaim responsibility for any injury to people or property resulting from any ideas, methods, instructions or products referred to in the content.