Article

Genome-Wide Identification and Expression Analysis of the Chalcone Synthase (CHS) Gene Family in Dendrobium catenatum

1
Key Laboratory for Quality Regulation of Tropical Horticultural Crops of Hainan Province, School of Horticulture, Hainan University, Haikou 570228, China
2
Xiangyang Academy of Agricultural Sciences, Xiangyang 441057, China
3
Anhui Engineering Laboratory for Conservation and Sustainable Utilization of Traditional Chinese Medicine Resources, West Anhui University, Lu’an 237012, China
4
Hainan Sheng Rong Biotechnology Co., Ltd., Haikou 571157, China
*
Authors to whom correspondence should be addressed.
These authors contributed equally to this work.
Agronomy 2023, 13(6), 1488; https://doi.org/10.3390/agronomy13061488
Submission received: 15 April 2023 / Revised: 21 May 2023 / Accepted: 26 May 2023 / Published: 28 May 2023
(This article belongs to the Section Horticultural and Floricultural Crops)

Abstract

:
Flavonoids are considered to be critical metabolites in regulating plant responses to abiotic stress. Chalcone synthase (CHS) catalyzes the first key step in the flavonoid biosynthesis pathway. However, there is no in-depth information on the sequence and functional analysis of CHS genes in Dendrobium catenatum. In this study, a total of 14 DcCHS genes were identified, encoding proteins of 349–504 amino acids in length, a protein molecular weight ranging between 39.08 and 56.56 kDa, and isoelectric points from 5.64 to 9.63. The DcCHS proteins were then divided into three groups according to their phylogenetic relationships. The members of each group had similar conserved motifs and gene structures. Quantitative real-time RT-PCR (RT-qPCR) analysis revealed that the DcCHS genes exhibited variable expression patterns in the different plant tissues evaluated. Furthermore, six genes were differentially expressed following exposure to abiotic stresses: DcCHS-6, DcCHS-5/-6, DcCHS-13/-14, and DcCHS-6/-8/-9/-13, which were specifically expressed in response to drought, heat, cold, and salt stress, respectively. This is the first genome-wide analysis of the CHS genes in D. catenatum, and our findings can provide essential information for a better understanding of the function of DcCHS genes, thus facilitating further research on D. catenatum stress tolerance.

1. Introduction

Flower color is a highly economically important characteristic in ornamental plants and depends on the content of different pigments, such as carotenoids, betalains, and flavonoids [1,2]. Carotenoids are essential pigments in the photosynthetic apparatus and result in flower pigmentation with colors ranging from yellow to red. At the same time, betalains are nitrogenous compounds derived from tyrosine, resulting in flower colors ranging from purple to red and yellow to orange [3]. Flavonoids are important secondary metabolites and include compounds such as chalcone, flavone, flavonol, and anthocyanin [4], which enhance color diversity (e.g., pink, purple, and blue) [5]. Additionally, flavonoids have a variety of biological functions, such as roles in plant growth and development, pigmentation, disease and stress resistance, and ultraviolet (UV) resistance [6,7]. In addition, flavonoids can benefit human health through various functions and properties, including promoting antioxidant and anti-inflammatory activities [8].
During the last few decades, the flavonoid biosynthesis enzymes have been studied in a number of plants, including snapdragon (Antirrhinum majus) [9], petunia (Petunia hybrida) [10], Eupatorium adenophorum [11], and Arabidopsis thaliana [12]. Chalcone synthase (CHS, EC 2.3.1.74) is an enzyme that plays a key role in flavonoid biosynthesis (Figure 1). Specifically, it catalyzes three malonyl-CoA molecules and one p-coumaroyl-CoA molecule (from the phenylpropane pathway) to synthesize naringin chalcone [13,14]. Naringin chalcone is subsequently converted to colored anthocyanins by the catalytic functions of a methyltransferase (MTs), anthocyanidin synthase (ANS), chalcone isomerase (CHI), dihydroflavonol 4-reductase (DFR), flavonoid 3′-hydroxylase (F3′H), and flavonoid 3-O-glucosyltransferase (3GT) [15]. Flavonol synthase (FLS) and anthocyanin reductase (ANR) mediate the branching of the flavonoid pathway for the distinct formation of flavonols and procyanidins [16,17] (Figure 1).
The CHS proteins belong to the polyketide synthases type III family, which have been isolated and identified in many plants of the Solanaceae, Convolvulaceae, Gramineae, Leguminous, Pinaceae, and Cruciferous families [18,19,20,21,22]. In Petunia hybrida, 12 CHS genes have been identified, including 8 CHS full-length sequences and 4 CHS fragment sequences [23]. Only three CHS genes have been identified in citrus, where the expression levels of CitCHS2 and CitCHS3 were positively correlated with total flavonoids [24]. CHS enzymes were shown to be responsible for the stripe-type bicolor in Japanese gentian, affecting anthocyanin biosynthesis in corolla lobes [25]. Both flavonoid content and flower color were altered in transgenic Petunia hybrida plants overexpressing the Freesia hybrida CHS gene [13]. Moreover, Wu et al. [26] found that the peel color of eggplant was directly affected by its anthocyanin content. Additionally, the anthocyanin content was also associated with heat stress intensity, as the expression levels of SmCHS4, SmCHS5, SmCHS6, and SmCHS7 were all induced by heat stress and correlated with anthocyanin content. Using RNA-Seq technology, the flower color variation of Rhododendron sanguineum was shown to be associated with the expression of anthocyanin biosynthesis-related genes such as RsCHS and RsCHI [27]. Studies have shown that CHS expression is significantly affected by environmental stress conditions [28]. Notably, tobacco plants overexpressing the Eupatorium adenophorum EaCHS1 gene showed enhanced salt tolerance [11].
Orchids are the largest family of monocotyledonous plants and have important ornamental value. Dendrobium catenatum belongs to the Dendrobium genus of the Orchidaceae family and is increasingly threatened by adverse environmental conditions [29]. Researchers have often focused on the medicinal properties of D. catenatum [30,31,32], but little is known about its stress resistance [33,34]. In this study, the D. catenatum CHS genes were identified, and their full-length genomic sequence was obtained [35]. The phylogenetic relationships, physicochemical properties, gene structure and promoter cis-acting elements, and conserved protein motifs of the CHS family were then investigated using bioinformatics analyses. In addition, the expression patterns of the CHS genes in different plant organs and under different abiotic stresses were assessed using quantitative real-time RT-PCR. This study provides important insights into secondary metabolism expression regulation for further improving the abiotic stress resistance of D. catenatum.

2. Materials and Methods

2.1. Identification of the CHS Genes

The annotated genomic sequence of D. catenatum (PRJNA262478) was obtained from GenBank from NCBI (https://www.ncbi.nlm.nih.gov/, assessed on 4 April 2020). To identify the CHS family protein sequences, the Hidden Markov Model of CHS proteins (PF00195 and PF02797) was downloaded from the Pfam database (http://pfam.xfam.org/, assessed on 19 October 2021) and was used to search and identify the CHS proteins using the Biolinux bioinformatics documentation system. According to the ID of the candidate proteins, CHS protein sequences were extracted using TBtools [36] and further validated with the SMART, Pfam, and CDD databases [37]. The physicochemical properties of the CHS proteins were analyzed using the online tool ExPASy (https://web.expasy.org/protparam/, assessed on 25 October 2021).

2.2. Phylogenetic Analysis

To explore the phylogenetic relationships between the CHS proteins, the CHS protein sequences from Arabidopsis thaliana (TAIR, https://www.arabidopsis.org/, assessed on 7 October 2021), rice (RiceData, http://rice.plantbiology.msu.edu/, assessed on 7 October 2021), and various orchid species including Phalaenopsis equestris (NCBI, ASM126359v1) [38] and Apostasia shenzhenica (NCBI, ASM278626v1) [39] were obtained using the same screening method as D. catenatum CHS proteins. Multiple sequence alignment was conducted using MEGA X, and the phylogenetic tree was generated using the Neighbor-Joining (NJ) method with the bootstrap value set as 1000.

2.3. Conserved Motif, Gene Structure, and Cis-Regulatory Promoter Elements Analysis

The conserved motifs of the CHS proteins identified in D. catenatum were analyzed using the online tool Multiple Em for Motif Elicitation (MEME) (http://meme-suite.org/, assessed on 3 July 2022). The output value was set to 10 and the maximum motif number was set to 100. The xml file was downloaded and visualized using TBtools. Information on the CHS gene structure was extracted from the gff file of D. catenatum. TBtools was then used to analyze the CHS gene structures. The 2000 bp region upstream of the CHS genes’ coding region was extracted by TBtools and was defined as the promoter sequences. The cis-regulatory elements were then analyzed using the online software PlantCARE; the results were visualized using TBtools.

2.4. Spatial Expression Analysis of DcCHS Genes

Eight organs, including lips, petals, gynostemia, sepals, flower stalks, roots, stems, and leaves from two-year-old D. catenatum ‘Guangnan’ plants, were harvested and immediately frozen in liquid nitrogen for subsequent RNA extraction. Three biological replicates were assessed. The total RNA was extracted, and cDNA was synthesized as previously described by Zhang et al. [37]. The expression patterns of CHS genes in the different D. catenatum organs were assessed using quantitative real-time RT-PCR (RT-qPCR). The Actin housekeeping gene was used as the internal control [37]. The relative expression levels were calculated using the 2−ΔΔCT method. All data were calculated using the gene expression levels in each of the different organs divided by the expression levels in the roots. The mean expression values were visualized by TBtools. All primers used are listed in Supplementary Table S1.

2.5. Expression of DcCHS Genes under Different Abiotic Stresses Conditions

The D. catenatum ‘Guangnan’ tissue culture seedlings were grown on 1/2 MS medium and cultured under a 12 h/25 °C day and 12 h/22 °C night regime with a relative humidity of 70% in a growth chamber. Three-month-old plantlets with uniform and robust growth were then selected for further analysis [40]. The expression patterns of CHS genes in D. catenatum seedlings under four abiotic stresses, including drought (20% PEG8000), heat (42 °C), cold (4 °C), and salt (200 mM NaCl), were analyzed using RT-qPCR [40]. Three biological replicates were assessed. The relative expression levels of DcCHS genes were calculated by the 2−ΔΔCT method [37]. All data were calculated using the expression levels under different stress conditions divided by that under normal conditions at the same time points (0, 3, 6, 9, 12, 24, and 48 h).

3. Results

3.1. Identification and Physicochemical Properties Analysis of CHS Proteins

In this study, 14 CHS genes were identified in the D. catenatum genome. All were named based on their gene ID (Table 1). The number of amino acids encoded by the DcCHS genes ranged from 349 (DcCHS-1) to 504 (DcCHS-4). The molecular weights (MWs) of the DcCHS proteins ranged from 39.08 kDa (DcCHS-1) to 56.56 kDa (DcCHS-4), and their predicted isoelectric points (pI) ranged from 5.64 (DcCHS-9) to 9.63 (DcCHS-2). The Phalaenopsis equestris PeCHS and Apostasia shenzhenica AsCHS proteins were also investigated, and the results showed that the PeCHS and AsCHS family members had similar characteristics to the DcCHS proteins: the predicted protein sequences length of 11 PeCHSs ranged from 345 (PeCHS-10) to 507 (PeCHS-8) amino acids, with MWs ranging from 37.72 kDa to 57.07 kDa and the pIs ranging from 6.03 (PeCHS-2 and PeCHS-3) to 9.28 (PeCHS-10). The predicted protein sequence length of 12 AsCHSs ranged from 333 (AsCHS-4) to 513 (AsCHS-7) amino acids, with MWs ranging from 35.34 kD to 57.48 kD and pIs ranging from 5.19 (AsCHS-11) to 9.25 (AsCHS-8) (Supplementary Table S2).

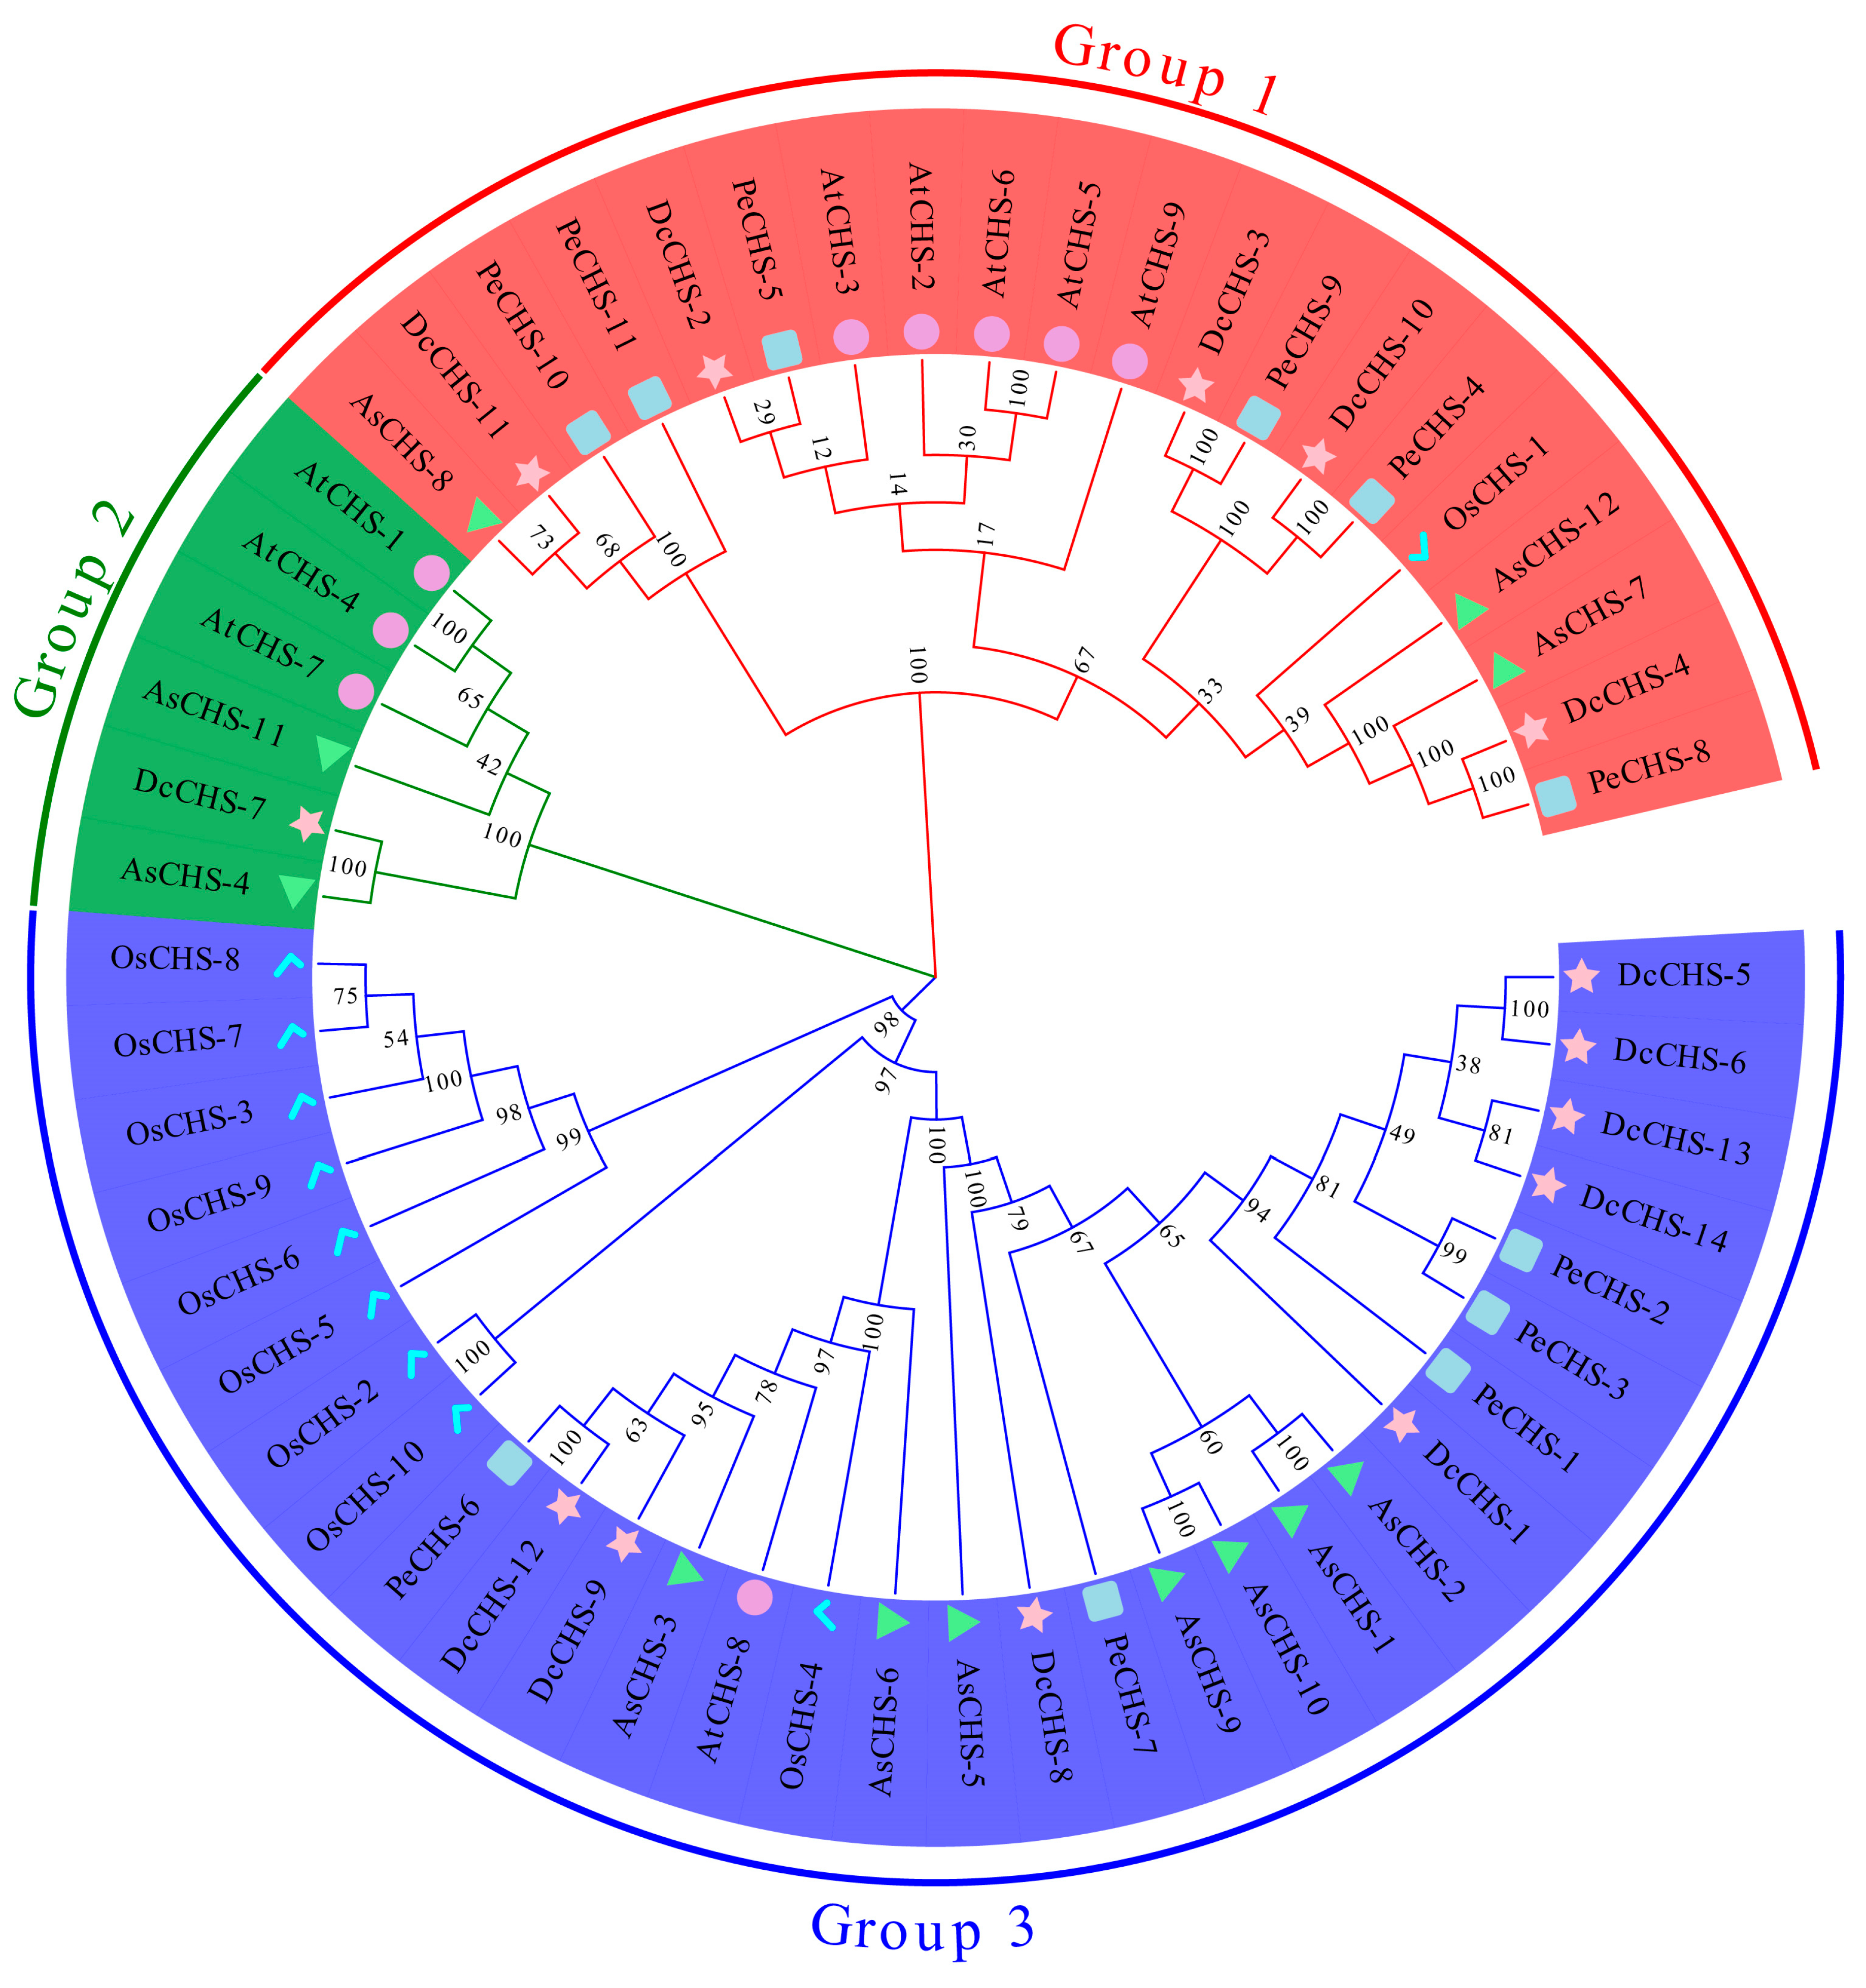
3.2. Phylogenetic Analysis of CHS Proteins

To investigate the evolutionary relationships of CHS proteins between the orchids and model plants, a phylogenetic tree was constructed amongst the CHS protein sequences of AtCHS, OsCHS, DcCHS, PeCHS, and AsCHS (Figure 2). All 56 CHS proteins could be divided into three groups—Group 1, Group 2, and Group 3. Group 1 contained five DcCHSs, six PeCHSs, and three AsCHSs; Group 2 included one DcCHS and two AsCHSs; Group 3 had the highest number of CHS proteins: eight DcCHSs, five PeCHSs, and seven AsCHSs. There were five, three, and one AtCHS proteins in Groups 1 to 3, respectively. However, the OsCHS proteins were not clustered in Group 2, while there were nine OsCHS members in Group 3 and only one OsCHS member in Group 1.

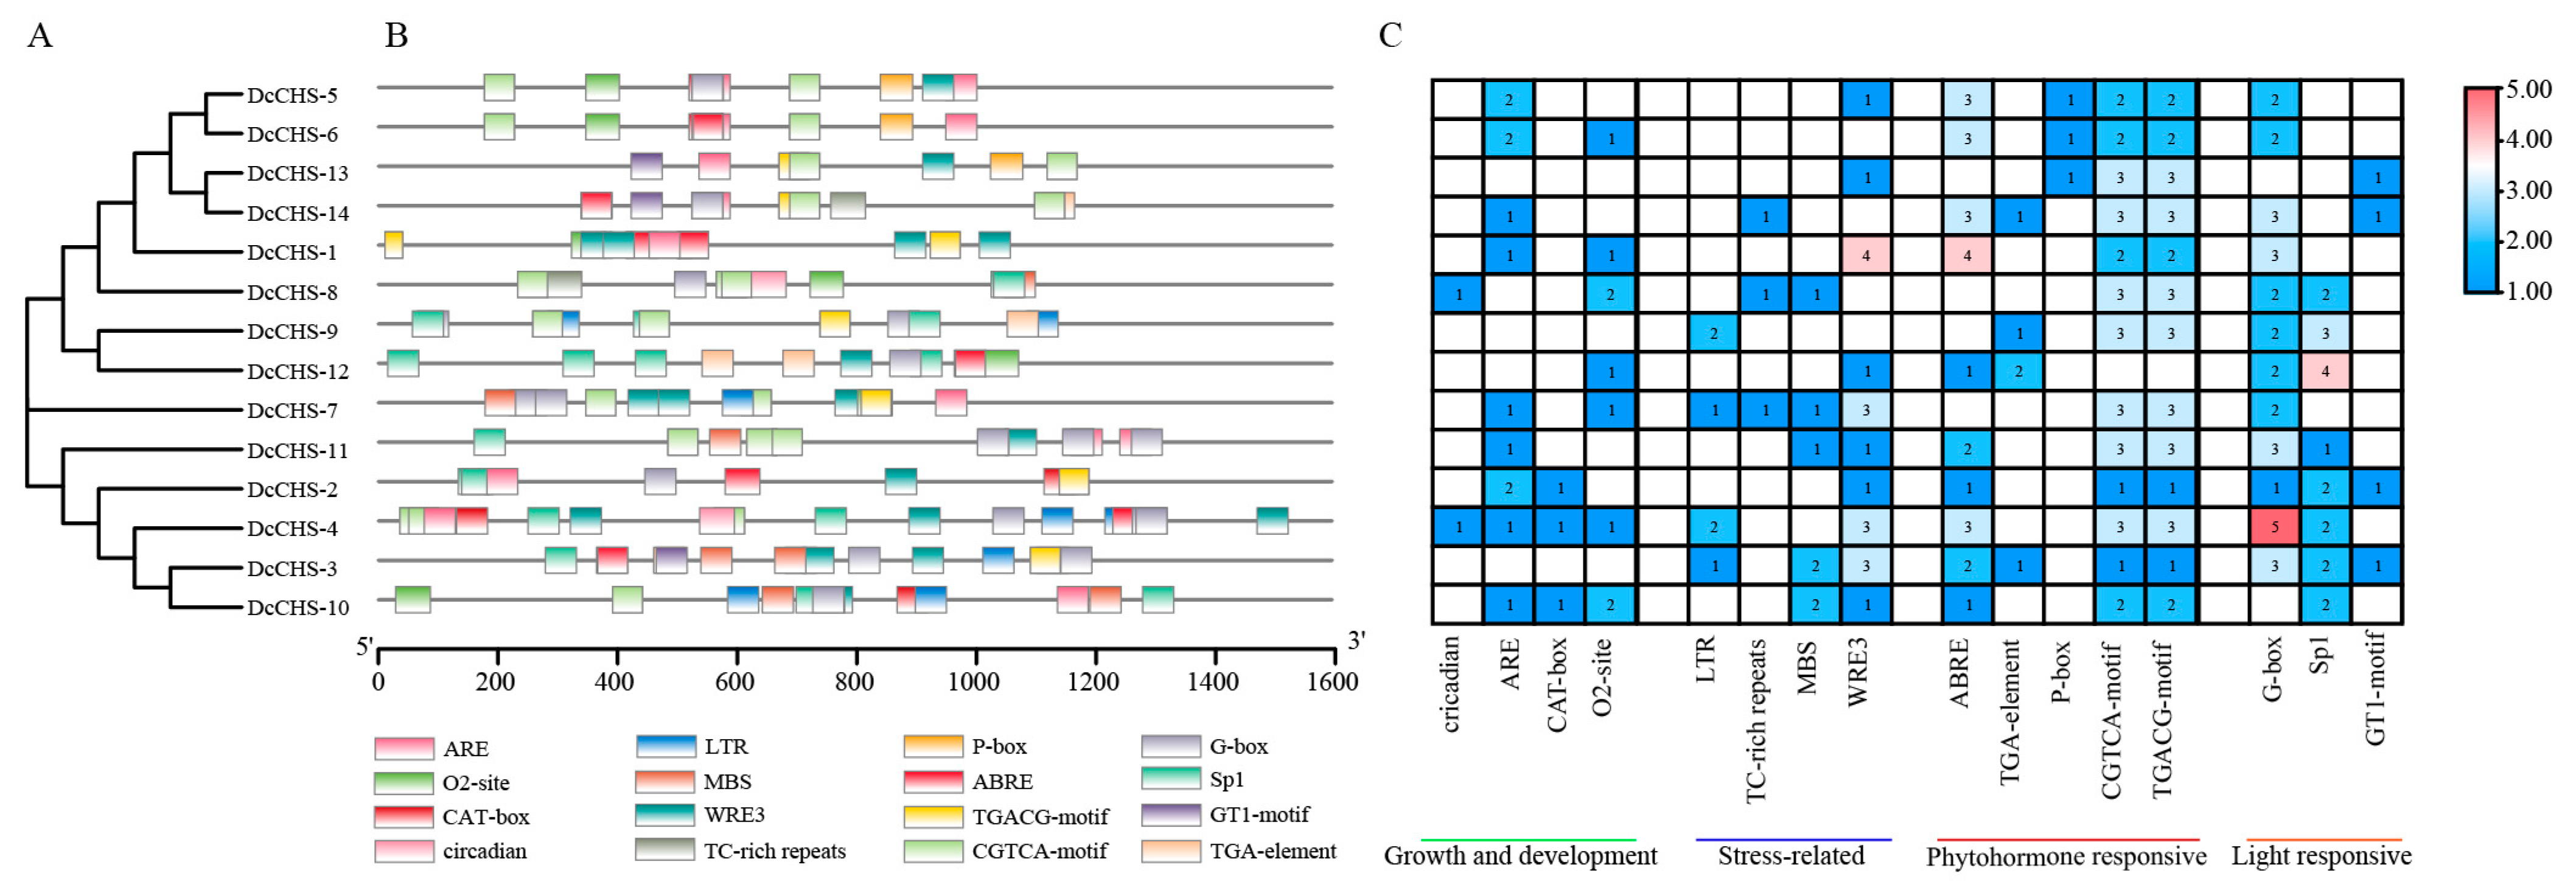
3.3. Conserved Motif and Gene Structure Analysis

Ten conserved motifs were predicted by MEME in the DcCHS proteins, and they were visualized using TBtools (Figure 3B). The length of the 10 conserved motifs ranged from 28 (motifs 6 and 7) to 100 (motif 1) amino acids. It was observed that members that were clustered in the same group had similar motif compositions and positionings (Figure 3B, Supplementary Table S4). All motifs in Group 1 were arranged in the order of motif-3, motif-10, motif-8, motif-2, and motif-9, except for DcCHS-11, which also contained motif-1 in the N-terminus. Group 2 proteins contained motifs 1, 3, 4, 5, 2, and 6. The DcCHS proteins in Group 3 all contained seven motifs in the order of motif-7, motif-1, motif-3, motif-4, motif-5, motif-2, and motif-6, except for DcCHS-1, which lacked motif-6 in the C-terminal and motif-7 in the N-terminal. Interestingly, motifs 8, 9, and 10 were only found in the CHS of Group 1, indicating that these motifs might have some specific roles in the proteins of this group. The differences of motif compositions in the same group may be due to evolutionary change. Additionally, the Chal_sti_synt_C domain included motifs 2, 5, and 6; the Chal_sti_synt_N domain included motifs 1, 3, and 7 (Figure 4, Supplementary Table S3). These two domains were highly conserved in almost all of the DcCHS protein sequences, indicating the conservation in the evolution of CHS proteins.
The exon–intron structures of the DcCHS genes were analyzed to further explore their evolutionary relationships (Figure 3C). Among the CHS genes, 85.71% (12/14) had one intron, while DcCHS-8 had two introns, and DcCHS-4 had no introns (Supplementary Table S4), indicating that the DcCHSs possess few introns overall.

3.4. Analysis of Cis-Acting Promoter Elements

Numerous cis-regulatory elements (CREs) were identified in the promoter region of the DcCHS genes (Figure 5, Supplementary Table S5). Four types of CREs included elements related to plant growth and development, light responses, and phytohormone and stress responses. Most CREs identified in the 14 DcCHS promoters included phytohormone-responsive elements, such as MeJA-responsive (CGTCA-motif and TGACG-motif) and abscisic acid-responsive (ABRE) motifs, which were found in the promoters of most genes. Light-responsive elements were also identified in the promoter region of certain DcCHS genes, indicating that the corresponding genes might be related to plant growth. The elements detected in the promoter regions that were associated with plant growth- and development contained circadian rhythm, ARE, CAT-box, and O2 sites. Of these, the elements related to circadian rhythms were only found in the promoter region of DcCHS-4 and DcCHS-8. Additionally, stress-related CREs, including abiotic stress-related (LTR, MBS, and TC-rich repeat) and biotic stress-related (WRE3) CREs, were detected in some promoters, indicating these DcCHS proteins might have roles in the responses to environmental stressors.

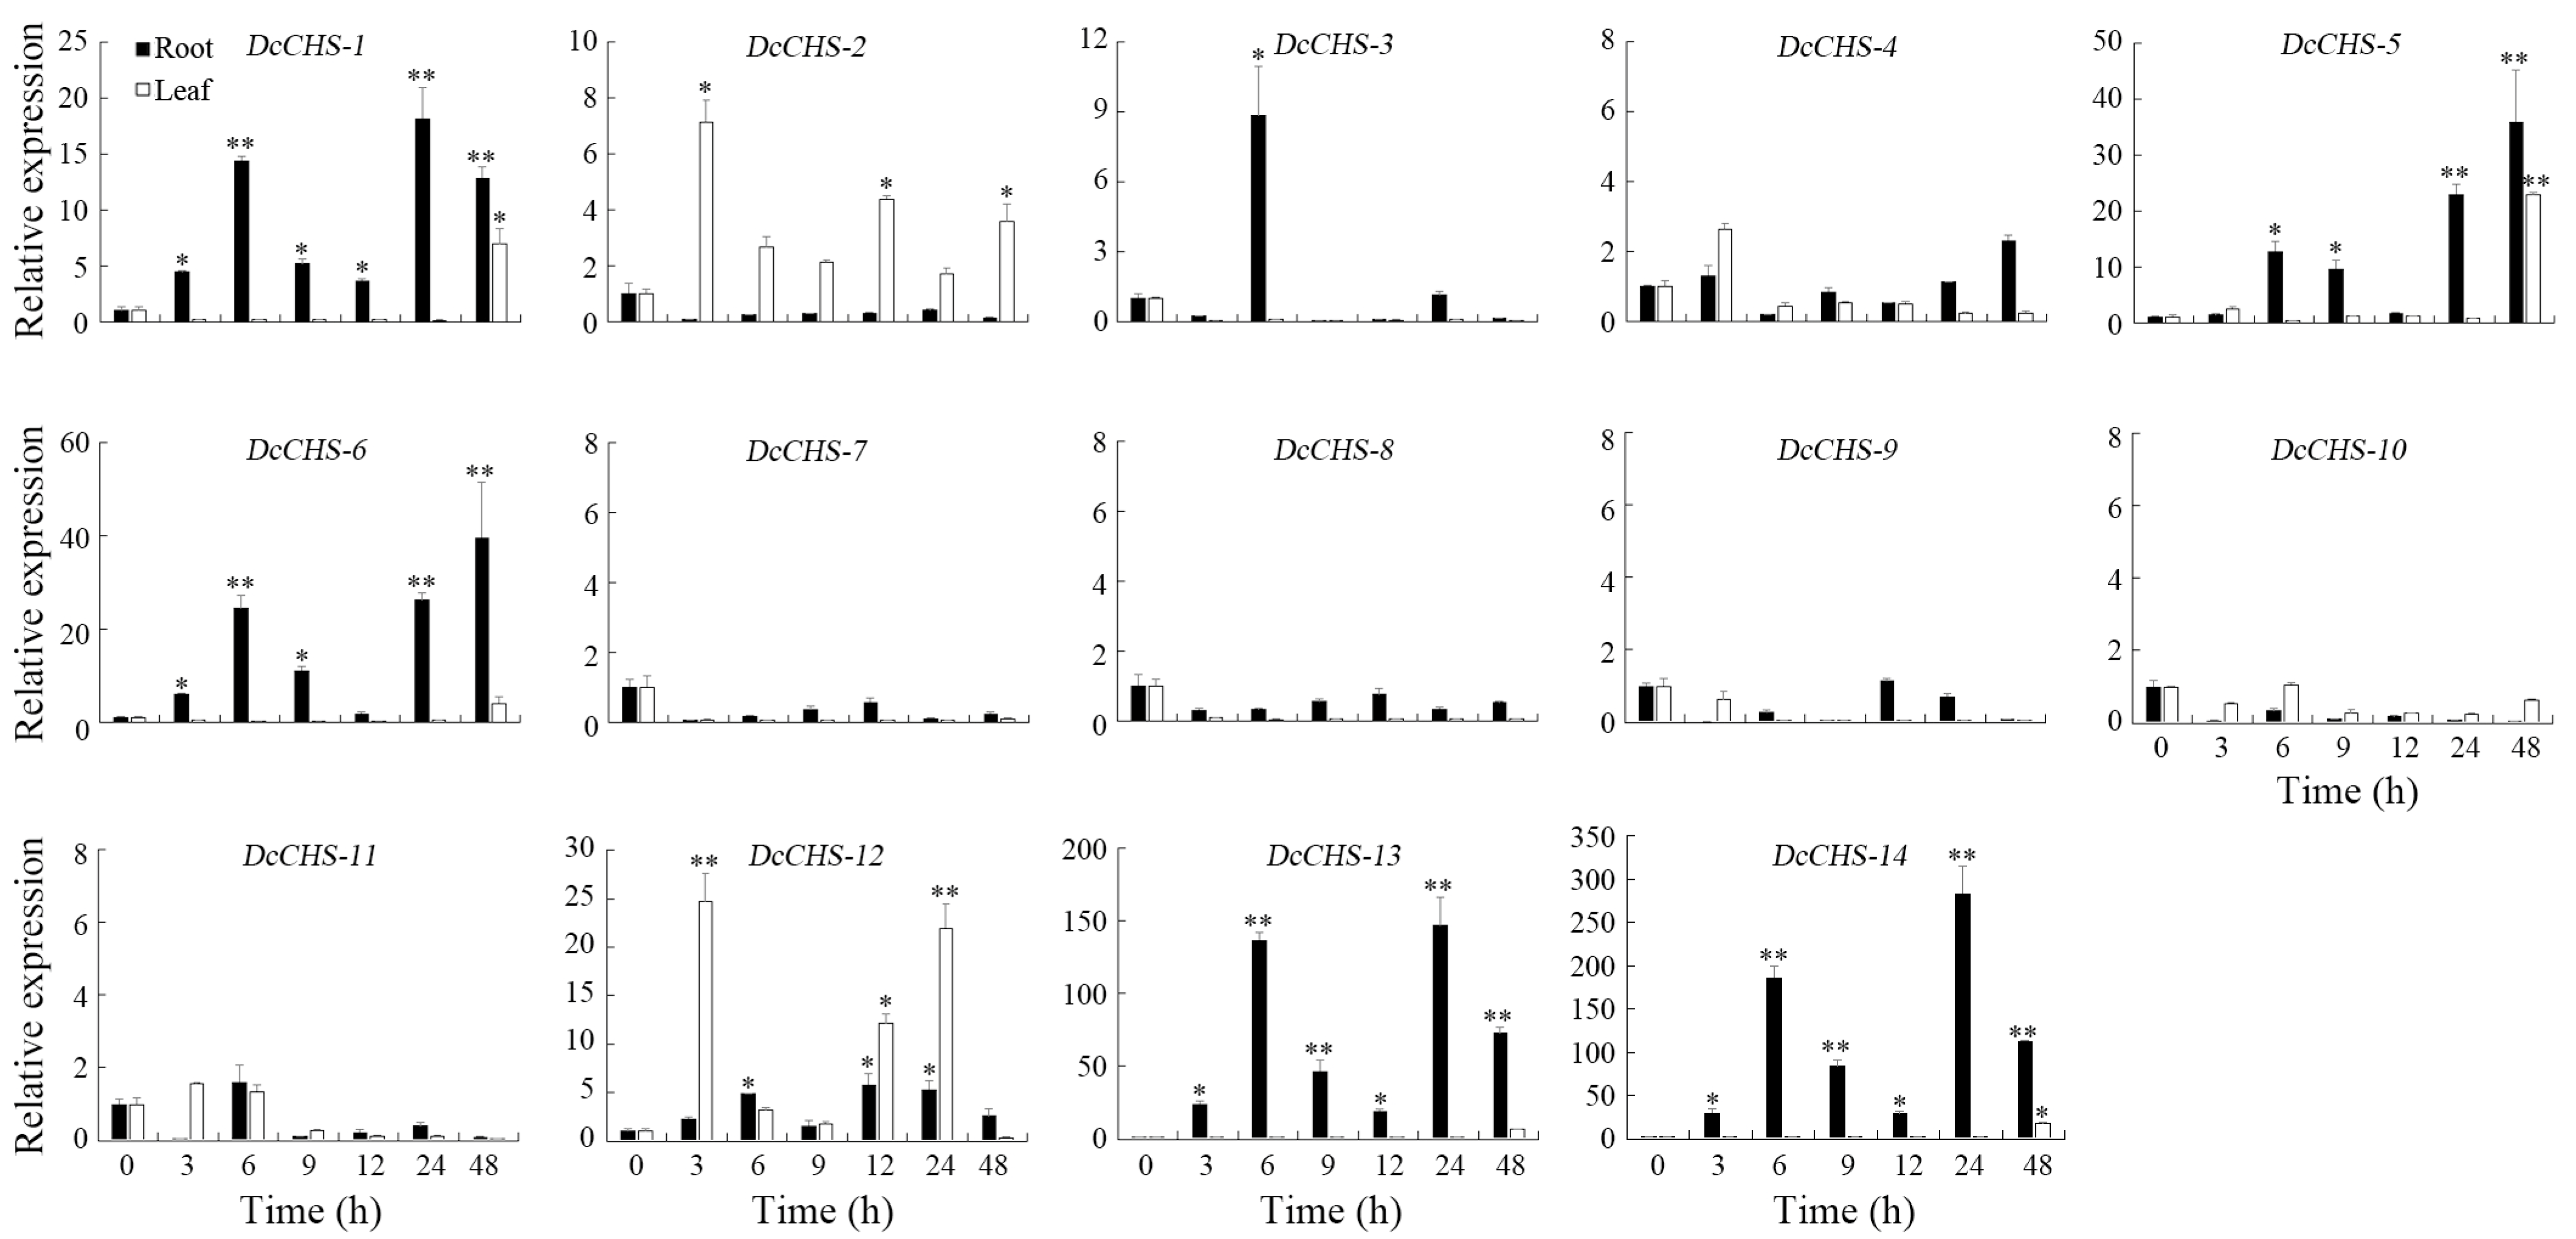
3.5. Expression of DcCHS Genes in Different Organs

To investigate the CHS genes’ expression patterns in different organs of D. catenatum, eight organs, including petals, lips, gynostemia, sepals, flower stalks, roots, stems, and leaves were harvested and the expression levels of DcCHS genes were measured. As shown in Figure 6 and Supplementary Table S6, all 14 DcCHS genes had organ-specific expression patterns. DcCHS-1, -3, -5, -6, -13, and -14 were mainly expressed in vegetative organs. Of these, the DcCHS-1 expression level was the highest in stems, and the DcCHS-3 expression was most elevated in the leaves; comparatively, the remaining three genes were highly expressed in the roots. The rest of the genes were mainly expressed in the reproductive organs. DcCHS-7, -9, -10, and -12 were primarily expressed in gynostemia, in which DcCHS-10 displayed the highest expression level, 1756-fold higher compared to the expression level in the roots. DcCHS-2 had a 196-fold higher expression in the sepals compared to the roots. Moreover, DcCHS-8 and DcCHS-11 had 119- and 16-fold higher expression in petals than in roots, respectively.

3.6. Expression Profiles of DcCHS Genes under Abiotic Stresses

To evaluate the expression of DcCHS genes under abiotic stresses conditions, the expression levels of 14 DcCHS genes under drought, heat, cold, and heat were assessed using RT-qPCR. All DcCHS genes were upregulated to some degree under drought stress. Five genes, including DcCHS-5, DcCHS-6, DcCHS-12, DcCHS-13, and DcCHS-14, displayed the most significant induction after drought stress. Among these, DcCHS-6 reached the highest expression level in the roots, 1249-fold higher compared to the control after 3 h of drought treatment (Figure 7). Under heat stress, DcCHS-5, DcCHS-6, DcCHS-13, and DcCHS-14 were all significantly upregulated in the roots, but showed no obvious expression changes in the leaves. The expression of DcCHS-5 and DcCHS-6 in the roots reached the highest levels after a 6 h and 3 h high-temperature treatment, 171- and 221-fold higher compared to the control, respectively (Figure 8). Only DcCHS-1, DcCHS-5, DcCHS-6, DcCHS-12, DcCHS-13, and DcCHS-14 were upregulated when exposed to cold stress. The expression of DcCHS-13 and DcCHS-14 in the roots reached its highest levels after 24 h low-temperature treatment, 147- and 283-fold higher compared to the control, respectively (Figure 9). Interestingly, after salt treatment, almost all of the DcCHS genes were induced significantly in both roots and leaves. The expression of the DcCHS-8 and DcCHS-9 genes in the roots reached its highest level after the 12 h salt treatment, which were 79- and 102-fold higher compared to the control, respectively, while the DcCHS-6 and DcCHS-13 genes in the leaves reached their highest expression levels after a 48 h salt treatment, 185- and 224-fold higher compared to the control, respectively (Figure 10).

4. Discussion

The functions of flavonoids are associated with UV protection, plant hormone regulation, and the color formation of flowers, fruits, and leaves [41,42], as well as signal transduction and abiotic and biotic stress responses in plants [43]. Chalcone synthase (CHS) catalyzes the key rate-limiting step in the flavonoid biosynthetic pathway [24]. The accumulation of flavonoids in plants is directly associated with the activity and expression of chalcone synthase [42].
The CHS genes have been isolated and characterized in many plants, such as peas [44], maize [45], tobacco [46], and soybean [47]. Typically, these CHS family members are involved in anthocyanin synthesis pathways [46]. For instance, the corolla and anther of the petunia chs mutant are pale and the flowers are male-sterile. The CHS overexpression can rescue this phenotype in transgenic petunia plants [48]. The CHSs comprise a multi-gene family, and the number of gene family members varies among plant species. For example, there are 14 CHS coding genes in soybean [47], 8 in pea [44], and 14 in maize [45]. However, previous studies have not explored the CHS family gene sequence features and their respective functions in orchid plants in depth. In this study, 14 CHS genes were identified in D. catenatum, 11 members in P. equestris, and 12 in A. shenzhenica (Figure 2). There was a high similarity in the physicochemical properties of the CHS proteins of D. catenatum, P. equestris, and A. shenzhenica. The amino acid (AA) number of DcCHS proteins ranged from 349 to 504, with an average number of 420 AAs. The MWs of DcCHSs ranged between 39.08 kDa and 56.56 kDa, with an average of 46.45 kDa. The pI values of DcCHSs ranged from 5.64 to 9.63, with an average of 7.53 (Table 1). In P. equestris, the average protein sequence length of the PeCHSs was 422 amino acids, with an average MW of 46.73 kDa and an average pI of 7.80. In A. shenzhenica, the average protein sequence length of the AsCHSs was 411 amino acids, with an average MW of 44.85 kDa and an average pI of 6.85 (Supplementary Table S2). Collectively, these results indicated that there is a high conservation among the CHS gene family members in orchids.
Phylogenetic tree analysis showed that all of the CHS proteins could be broadly classified into three major groups—Groups 1, 2, or 3—according to their phylogenetic relationships. Group 3 contained the most members, while Group 2 contained the fewest (Figure 2). The motif distribution, as analyzed by MEME, was consistent with the phylogenetic classification. In D. catenatum, all Group 1 proteins contained motifs 3-10-8-2-9, Group 2 proteins contained motifs 1-3-4-5-2-6, and all Group 3 proteins contained motifs 1-3-4-5-2 (Figure 3). Therefore, the members in the same group usually shared group-specific conserved motifs, which supported their close evolutionary relationship and clustering in each group. In P. equestris, all of the PeCHS proteins in Group 1 contained motifs 9-8-3-4-2-6-10, except for PeCHS-10, which did not contain motif 9. All of the PeCHS proteins in Group 3 contained motifs 1-3-7-5-2-6 (Supplementary Figure S1A). Similarly, all of the AsCHS proteins in Group 1 contained motifs 10-7-9-2-8, except for AsCHS-8, which did not contain motif 7. All proteins in Group 2 contained motifs 1-7-6-3-2-5, and all Group 3 proteins contained motifs 4-1-7-6-3-2-5 (Supplementary Figure S1B). The conserved domains of DcCHS proteins were also analyzed. The two domains Chal_sti_synt_N (consisting of motifs 1, 3, and 7) and Chal_sti_synt_C (consisting of motifs 2, 5, and 6), defined by certain motif presence and distribution, were highly conserved in almost all DcCHS proteins (Figure 4, Supplementary Table S3), suggesting a conserved evolution of CHS proteins. Gene structure analysis also indicated that the DcCHS genes remained highly conserved during the evolutionary process. Most of the DcCHS genes (12 of 14) contained only one intron (Figure 3C), consistent with previous results for SoCHS [49] and CoCHS [50].
Information on gene expression patterns is very important, as genes with similar expression patterns might have similar characteristics, share similar regulatory genes, and/or have the same origin [51,52]. The DcCHS genes could be classified into four clusters based on their spatial expression patterns. The first cluster was mainly expressed in roots and included DcCHS-5, -6, -13, and -14, which all belonged to Group 3 (Figure 2) and had a high degree of sequence similarity. The second cluster was mainly expressed in gynostemia and included DcCHS-7, -9, -10, -12. The third cluster consisting of DcCHS-2, -8, and -11 was expressed in flower tissues such as sepals or petals. The fourth cluster consisting of DcCHS-1, -3, and -4 was expressed in vegetative organs such as stems or leaves (Figure 6). The different expression patterns in the different organs suggested that the DcCHS proteins might have diverse functions in the regulation of plant organ development.
During its life cycle, the growth and development of D. catenatum are frequently threatened by environmental conditions, such as temperature and drought stress [37,40]. A lot of stress-related genes or transcription factors were induced to adapt to these environmental stresses [29,33,34,37,40,53]. CHS is a key enzyme in plant secondary metabolic pathways and is associated with many physiological regulations and abiotic stress resistance in plants [54]. However, no CHS genes responding to abiotic stresses have been reported in D. catenatum. In this study, the expression patterns of the 14 DcCHS genes under abiotic stresses were investigated. The results found that DcCHS-6 was highly induced by drought (Figure 7), DcCHS-5 and DcCHS-6 were induced by heat stress (Figure 8), DcCHS-13 and DcCHS-14 were induced by cold stress (Figure 9), and DcCHS-6, DcCHS-8, DcCHS-9, and DcCHS-13 were responsive to salt stress (Figure 10), suggesting that these genes might function in response to environmental stresses in D. catenatum. Previous studies showed that the cis-acting elements in promoter regions could bind to target genes and induce their expression under abiotic stresses [55,56]. The MYB binding site, low-temperature-responsive (LTR), and drought-inducibility (MBS) cis-elements were detected in certain gene promoter regions (Supplementary Table S5). In addition, many cis-acting elements were identified in the DcCHS genes’ promoters involved in growth, development, and light and stress responses. It has shown that plant hormones (e.g., SA, ABA, and MeJA) can induce CHS expression and enhance CHS activity [24,57,58]. Herein, the ABA-responsive element (ABRE) and MeJA-responsive elements (TGACG-motif and CGTCA-motif) were identified in the DcCHS promoter regions (Supplementary Table S5), indicating that the DcCHS genes might function in an ABA- or MeJA-dependent manner.

5. Conclusions

In this study, 14 CHS genes—DcCHS-1 to DcCHS-14—were identified in D. catenatum. The DcCHS proteins contained conserved domains in the N- and C-terminus. All of the proteins could be divided into three groups according to their phylogenetic relatedness. The members of each group had similar motif compositions and intron–exon structures. RT-qPCR analyses revealed that the DcCHS genes had organ-specific expression patterns. Furthermore, six DcCHS genes (DcCHS-5, DcCHS-6, DcCHS-8, DcCHS-9, DcCHS-13, and DcCHS-14) were significantly induced in response to abiotic stresses, including drought, heat, cold, and salinity. These results provide a basis for identifying agronomically important candidate DcCHS genes involved in response to abiotic stresses that can help improve the environmental resilience of D. catenatum.

Supplementary Materials

The following supporting information can be downloaded at: https://www.mdpi.com/article/10.3390/agronomy13061488/s1, Figure S1: Motifs, gene structures, and phylogenetic relationships of PeCHS (A) and AsCHS (B) family members; Table S1: Primers used in this study; Table S2: Physical and chemical properties of CHS gene family in P. equestris and A. shenzhenica; Table S3: Detailed information of the 10 motifs in the putative D. catenatum CHS proteins; Table S4: Motifs and the number of introns of each DcCHS gene; Table S5: Information on cis-elements of DcCHS gene promoters; Table S6: Expression data of DcCHS genes in the different organs of D. catenatum.

Author Contributions

Conceptualization, J.D. and Y.Z.; formal analysis, T.Y., T.Z., Y.L., Y.K., P.W., W.L., Y.W., L.T. and Y.Z.; funding acquisition, L.T., J.D. and Y.Z.; investigation, T.Y., T.Z., Y.L. and Y.Z.; methodology, T.Y. and T.Z; supervision, Y.Z.; writing—original draft preparation, T.Y., T.Z. and Y.Z.; writing—review and editing, J.D. and Y.Z. All authors have read and agreed to the published version of the manuscript.

Funding

This research was funded by Hainan Province Science and Technology Special Fund (ZDYF2023SHFZ122 by J.D.), Haikou Science and Technology Planning Project (2022-008 by J.D., 2022-011 by J.D.), Hainan Provincial Natural Science Foundation of China (319MS009 by Y.Z., 2019RC045 by L.T., 2019RC150 by L.T.), the Education Department of Hainan Province (Hnky2021-19 by Y.Z., Hys2020-242 by T.Z., Qhys2021-248 by Y.L.), the Open Project of Key Laboratory for Quality Regulation of Tropical Horticultural Crops of Hainan Province (HNZDSYS(YY)-06 by Y.Z.), and the Key Project of Scientific Research in Higher Education of Anhui Province (2022AH051677 by Y.W.).

Data Availability Statement

Not applicable.

Conflicts of Interest

The authors declare no conflict of interest.

References

  1. Zhu, C.; Bai, C.; Sanahuja, G.; Yuan, D.; Farré, G.; Naqvi, S.; Shi, L.; Capell, T.; Christou, P. The regulation of carotenoid pigmentation in flowers. Arch. Biochem. Biophys. 2010, 504, 132–141. [Google Scholar] [CrossRef] [PubMed]
  2. Maleka, M.F.; Albertyn, J.; Spies, J.J. The floriculture industry and flower pigmentation—A review. Philos. Trans. Genet. 2017, 29, 55–110. [Google Scholar]
  3. Zhou, X.-W.; Fan, Z.-Q.; Chen, Y.; Zhu, Y.-L.; Li, J.-Y.; Yin, H.-F. Functional analyses of a flavonol synthase–like gene from Camellia nitidissima reveal its roles in flavonoid metabolism during floral pigmentation. J. Biosci. 2013, 38, 593–604. [Google Scholar] [CrossRef] [PubMed]
  4. Tripoli, E.; La Guardia, M.; Giammanco, S.; Di Majo, D.; Giammanco, M. Citrus flavonoids: Molecular structure, biological activity and nutritional properties: A review. Food Chem. 2007, 104, 466–479. [Google Scholar] [CrossRef]
  5. Grotewold, E.; He, J.; Giusti, M.M.; Cunningham, J.F.X.; Gantt, E.; Paech, K.; Lepiniec, L.; Debeaujon, I.; Routaboul, J.-M.; Baudry, A.; et al. The genetics and biochemistry of floral pigments. Annu. Rev. Plant Biol. 2006, 57, 761–780. [Google Scholar] [CrossRef]
  6. Zhou, L.; Wang, Y.; Peng, Z. Molecular characterization and expression analysis of chalcone synthase gene during flower development in tree peony (Paeonia suffruticosa). Afr. J. Biotechnol. 2010, 10, 1275–1284. [Google Scholar] [CrossRef]
  7. Ferreyra, M.L.F.; Rius, S.P.; Casati, P. Flavonoids: Biosynthesis, biological functions, and biotechnological applications. Front. Plant Sci. 2012, 3, 279–286. [Google Scholar] [CrossRef]
  8. Knekt, P.; Kumpulainen, J.; Järvinen, R.; Rissanen, H.; Heliövaara, M.; Reunanen, A.; Hakulinen, T.; Aromaa, A. Flavonoid intake and risk of chronic diseases. Am. J. Clin. Nutr. 2002, 76, 560–568. [Google Scholar] [CrossRef]
  9. Hatayama, M.; Unno, H.; Kusunoki, M.; Takahashi, S.; Nishino, T.; Nakayama, T. Production of tetraketide lactones by mutated Antirrhinum majus chalcone synthases (AmCHS1). J. Biosci. Bioeng. 2010, 110, 158–164. [Google Scholar] [CrossRef]
  10. Hosokawa, M.; Yamauchi, T.; Takahama, M.; Goto, M.; Mikano, S.; Yamaguchi, Y.; Tanaka, Y.; Ohno, S.; Koeda, S.; Doi, M.; et al. Phosphorus starvation induces post-transcriptional CHS gene silencing in Petunia corolla. Plant Cell Rep. 2013, 32, 601–609. [Google Scholar] [CrossRef]
  11. Chen, L.; Guo, H.; Lin, Y.; Cheng, H. Chalcone synthase EaCHS1 from Eupatorium adenophorum functions in salt stress tolerance in tobacco. Plant Cell Rep. 2015, 34, 885–894. [Google Scholar] [CrossRef]
  12. Zhang, X.; Abrahan, C.; Colquhoun, T.A.; Liu, C.-J. A proteolytic regulator controlling chalcone synthase stability and flavonoid biosynthesis in Arabidopsis. Plant Cell 2017, 29, 1157–1174. [Google Scholar] [CrossRef] [PubMed]
  13. Sun, W.; Meng, X.; Liang, L.; Jiang, W.; Huang, Y.; He, J.; Hu, H.; Almqvist, J.; Gao, X.; Wang, L. Molecular and biochemical analysis of chalcone synthase from Freesia hybrid in flavonoid biosynthetic pathway. PLoS ONE 2015, 10, e0119054. [Google Scholar] [CrossRef] [PubMed]
  14. Tai, D.; Tian, J.; Zhang, J.; Song, T.; Yao, Y. A Malus crabapple chalcone synthase gene, McCHS, regulates red petal color and flavonoid biosynthesis. PLoS ONE 2014, 9, e110570. [Google Scholar] [CrossRef] [PubMed]
  15. Forkmann, G.; Martens, S. Metabolic engineering and applications of flavonoids. Curr. Opin. Biotechnol. 2001, 12, 155–160. [Google Scholar] [CrossRef]
  16. Martens, S.; Mithöfer, A. Flavones and flavone synthases. Phytochemistry 2005, 66, 2399–2407. [Google Scholar] [CrossRef]
  17. Wu, J.; Wang, X.C.; Liu, Y.; Du, H.; Shu, Q.Y.; Su, S.; Wang, L.J.; Li, S.S.; Wang, L.S. Flavone synthases from Lonicera japonica and L. macranthoides reveal differential flavone accumulation. Sci. Rep. 2016, 6, 19245. [Google Scholar] [CrossRef]
  18. Li, L.; Cheng, H.; Peng, J.; Cheng, S. Construction of a plant expression vector of chalcone synthase gene of Ginkgo biloba L. and its genetic transformation into tobacco. Front. Agric. China 2010, 4, 456–462. [Google Scholar] [CrossRef]
  19. Rahman, R.N.Z.R.A.; Zakaria, I.I.; Salleh, A.B.; Basri, M. Enzymatic properties and mutational studies of chalcone synthase from Physcomitrella patens. Int. J. Mol. Sci. 2012, 13, 9673–9691. [Google Scholar] [CrossRef]
  20. Berenschot, A.S.; Quecini, V. A reverse genetics approach identifies novel mutants in light responses and anthocyanin metabolism in petunia. Physiol. Mol. Biol. Plants 2014, 20, 1–13. [Google Scholar] [CrossRef]
  21. España, L.; Heredia-Guerrero, J.A.; Reina-Pinto, J.J.; Fernández-Muñoz, R.; Heredia, A.; Domínguez, E. Transient silencing of chalcone synthase during fruit ripening modifies tomato epidermal cells and cuticle properties. Plant Physiol. 2014, 166, 1371–1386. [Google Scholar] [CrossRef] [PubMed]
  22. Wang, L.; Albert, N.W.; Zhang, H.; Arathoon, S.; Boase, M.R.; Ngo, H.; Schwinn, K.E.; Davies, K.M.; Lewis, D.H. Temporal and spatial regulation of anthocyanin biosynthesis provide diverse flower color intensities and patterning in Cymbidium orchid. Planta 2014, 240, 983–1002. [Google Scholar] [CrossRef]
  23. Koes, R.E.; Spelt, C.E.; van den Elzen, P.J.; Mol, J.N. Cloning and molecular characterization of the chalcone synthase multigene family of Petunia hybrida. Gene 1989, 81, 245–257. [Google Scholar] [CrossRef] [PubMed]
  24. Wang, Z.; Yu, Q.; Shen, W.; El Mohtar, C.A.; Zhao, X.; Gmitter, F.G., Jr. Functional study of CHS gene family members in citrus revealed a novel CHS gene affecting the production of flavonoids. BMC Plant Biol. 2018, 18, 189. [Google Scholar] [CrossRef] [PubMed]
  25. Ohta, Y.; Atsumi, G.; Yoshida, C.; Takahashi, S.; Shimizu, M.; Nishihara, M.; Nakatsuka, T. Post-transcriptional gene silencing of the chalcone synthase gene CHS causes corolla lobe-specific whiting of Japanese gentian. Planta 2021, 255, 29. [Google Scholar] [CrossRef]
  26. Wu, X.; Zhang, S.; Liu, X.; Shang, J.; Zhang, A.; Zhu, Z.; Zha, D. Chalcone synthase (CHS) family members analysis from eggplant (Solanum melongena L.) in the flavonoid biosynthetic pathway and expression patterns in response to heat stress. PLoS ONE 2020, 15, e0226537. [Google Scholar] [CrossRef]
  27. Ye, L.-J.; Möller, M.; Luo, Y.-H.; Zou, J.-Y.; Zheng, W.; Wang, Y.-H.; Liu, J.; Zhu, A.-D.; Hu, J.-Y.; Li, D.-Z.; et al. Differential expressions of anthocyanin synthesis genes underlie flower color divergence in a sympatric Rhododendron sanguineum complex. BMC Plant Biol. 2021, 21, 204. [Google Scholar] [CrossRef]
  28. Wang, Y.; Zhou, B.; Sun, M.; Li, Y.; Kawabata, S. UV-A Light induces anthocyanin biosynthesis in a manner distinct from synergistic blue + UV-B light and UV-A/blue light responses in different parts of the hypocotyls in turnip seedlings. Plant Cell Physiol. 2012, 53, 1470–1480. [Google Scholar] [CrossRef]
  29. Zhang, T.T.; Li, Y.X.; Wang, P.; Luo, Q.; Fu, S.; Kang, Y.; Zhou, Y. Characterization of Dendrobium catenatum CBL-CIPK signaling networks and their response to abiotic stress. Int. J. Biol. Macromol. 2023, 236, 124010. [Google Scholar] [CrossRef]
  30. Niu, Z.; Zhu, F.; Fan, Y.; Li, C.; Zhang, B.; Zhu, S.; Hou, Z.; Wang, M.; Yang, J.; Xue, Q.; et al. The chromosome-level reference genome assembly for Dendrobium officinale and its utility of functional genomics research and molecular breeding study. Acta Pharm. Sin. B 2021, 11, 2080–2092. [Google Scholar] [CrossRef]
  31. Yu, Z.; Dong, W.G.; da Silva, J.A.T.; He, C.; Si, C.; Duan, J. Ectopic expression of DoFLS1 from Dendrobium officinale enhances flavonol accumulation and abiotic stress tolerance in Arabidopsis thaliana. Protoplasma 2021, 258, 803–815. [Google Scholar] [CrossRef]
  32. Yu, Z.; Zhang, G.; da Silva, J.A.T.; Li, M.; Zhao, C.; He, C.; Si, C.; Zhang, M.; Duan, J. Genome-wide identification and analysis of DNA methyltransferase and demethylase gene families in Dendrobium officinale reveal their potential functions in polysaccharide accumulation. BMC Plant Biol. 2021, 21, 21. [Google Scholar] [CrossRef] [PubMed]
  33. Wang, P.; Li, Y.X.; Zhang, T.T.; Kang, Y.Q.; Li, W.; Wang, J.; Yu, W.; Zhou, Y. Identification of the bZIP gene family and investigation of their response to drought stress in Dendrobium catenatum. Agronomy 2023, 13, 236. [Google Scholar] [CrossRef]
  34. Li, Y.; Zhang, T.T.; Xing, W.; Wang, J.; Yu, W.; Zhou, Y. Comprehensive genomic characterization of the NAC transcription factors and their response to drought stress in Dendrobium catenatum. Agronomy 2022, 12, 2753. [Google Scholar] [CrossRef]
  35. Zhang, G.-Q.; Xu, Q.; Bian, C.; Tsai, W.-C.; Yeh, C.-M.; Liu, K.-W.; Yoshida, K.; Zhang, L.-S.; Chang, S.-B.; Chen, F.; et al. The Dendrobium catenatum Lindl. genome sequence provides insights into polysaccharide synthase, floral development and adaptive evolution. Sci. Rep. 2016, 6, 19029. [Google Scholar] [CrossRef]
  36. Chen, C.; Chen, H.; Zhang, Y.; Thomas, H.R.; Frank, M.H.; He, Y.H.; Xia, R. TBtools: An integrative toolkit developed for interactive analyses of big biological data. Mol. Plant 2020, 13, 1194–1202. [Google Scholar] [CrossRef] [PubMed]
  37. Zhang, T.T.; Cui, Z.; Li, Y.; Kang, Y.; Song, X.; Wang, J.; Zhou, Y. Genome-wide identification and expression analysis of MYB transcription factor superfamily in Dendrobium catenatum. Front. Genet. 2021, 12, 714696. [Google Scholar] [CrossRef] [PubMed]
  38. Cai, J.; Liu, X.; Vanneste, K.; Proost, S.; Tsai, W.-C.; Liu, K.-W.; Chen, L.-J.; He, Y.; Xu, Q.; Bian, C.; et al. The genome sequence of the orchid Phalaenopsis equestris. Nat. Genet. 2015, 47, 65–72. [Google Scholar] [CrossRef]
  39. Zhang, G.-Q.; Liu, K.-W.; Li, Z.; Lohaus, R.; Hsiao, Y.-Y.; Niu, S.-C.; Wang, J.-Y.; Lin, Y.-C.; Xu, Q.; Chen, L.-J.; et al. The Apostasia genome and the evolution of orchids. Nature 2017, 549, 379–383. [Google Scholar] [CrossRef]
  40. Zhang, T.T.; Xu, Y.; Ding, Y.; Yu, W.; Wang, J.; Lai, H.; Zhou, Y. Identification and expression analysis of WRKY gene family in response to abiotic stress in Dendrobium catenatum. Front. Genet. 2022, 13, 800019. [Google Scholar] [CrossRef]
  41. Lepiniec, L.; Debeaujon, I.; Routaboul, J.-M.; Baudry, A.; Pourcel, L.; Nesi, N.; Caboche, M. Genetics and biochemistry of seed flavonoids. Annu. Rev. Plant Biol. 2006, 57, 405–430. [Google Scholar] [CrossRef]
  42. Winkel-Shirley, B. Flavonoid Biosynthesis. A colorful model for genetics, biochemistry, cell biology, and biotechnology. Plant Physiol. 2001, 126, 485–493. [Google Scholar] [CrossRef] [PubMed]
  43. Singh, P.; Arif, Y.; Bajguz, A.; Hayat, S. The role of quercetin in plants. Plant Physiol. Biochem. 2021, 166, 10–19. [Google Scholar] [CrossRef]
  44. Ito, M.; Ichinose, Y.; Kato, H.; Shiraishi, T.; Yamada, T. Molecular evolution and functional relevance of the chalcone synthase genes of pea. Mol. Gen. Genet. 1997, 255, 28–37. [Google Scholar] [CrossRef]
  45. Han, Y.; Ding, T.; Su, B.; Jiang, H. Genome-wide identification, characterization and expression analysis of the chalcone synthase family in maize. Int. J. Mol. Sci. 2016, 17, 161. [Google Scholar] [CrossRef] [PubMed]
  46. Chen, S.; Pan, X.H.; Li, Y.T.; Cui, L.J.; Zhang, Y.C.; Zhang, Z.M.; Pan, G.T.; Yang, J.; Cao, P.J.; Yang, A.G. Identification and characterization of chalcone synthase gene family members in Nicotiana tabacum. J. Plant Growth Regul. 2017, 36, 374–384. [Google Scholar] [CrossRef]
  47. Vadivel, A.K.A.; Krysiak, K.; Tian, G.; Dhaubhadel, S. Genome-wide identification and localization of chalcone synthase family in soybean (Glycine max [L.] Merr). BMC Plant Biol. 2018, 18, 325. [Google Scholar] [CrossRef]
  48. Napoli, C.A.; Fahy, D.; Wang, H.-Y.; Taylor, L.P. White anther: A Petunia mutant that abolishes pollen flavonol accumulation, induces male sterility, and is complemented by a chalcone synthase transgene 1. Plant Physiol. 1999, 120, 615–622. [Google Scholar] [CrossRef]
  49. Wang, Y.; Dou, Y.; Wang, R.; Guan, X.; Hu, Z.; Zheng, J. Molecular characterization and functional analysis of chalcone synthase from Syringa oblata Lindl. in the flavonoid biosynthetic pathway. Gene 2017, 635, 16–23. [Google Scholar] [CrossRef]
  50. Singh, N.; Kumaria, S. Molecular cloning and characterization of chalcone synthase gene from Coelogyne ovalis Lindl. and its stress-dependent expression. Gene 2020, 762, 145104. [Google Scholar] [CrossRef]
  51. Gu, X. Statistical framework for phylogenomic analysis of gene family expression profiles. Genetics 2004, 167, 531–542. [Google Scholar] [CrossRef] [PubMed]
  52. Oakley, T.H.; Østman, B.; Wilson, A.C.V. Repression and loss of gene expression outpaces activation and gain in recently duplicated fly genes. Proc. Natl. Acad. Sci. USA 2006, 103, 11637–11641. [Google Scholar] [CrossRef] [PubMed]
  53. Zhang, T.T.; Li, Y.; Kang, Y.; Wang, P.; Li, W.; Yu, W.; Wang, J.; Wang, J.; Song, X.; Jiang, X.Y.; et al. The Dendrobium catenatum DcCIPK24 increases drought and salt tolerance of transgenic Arabidopsis. Ind. Crop. Prod. 2022, 187, 115375. [Google Scholar] [CrossRef]
  54. Chennupati, P.; Seguin, P.; Chamoun, R.; Jabaji, S. Effects of high-temperature stress on soybean isoflavone concentration and expression of key genes involved in isoflavone synthesis. J. Agric. Food Chem. 2012, 60, 12421–12427. [Google Scholar] [CrossRef] [PubMed]
  55. Sornaraj, P.; Luang, S.; Lopato, S.; Hrmova, M. Basic leucine zipper (bZIP) transcription factors involved in abiotic stresses: A molecular model of a wheat bZIP factor and implications of its structure in function. Biochim. Biophys. Acta 2016, 1860, 46–56. [Google Scholar] [CrossRef] [PubMed]
  56. Fujita, Y.; Yoshida, T.; Yamaguchi-Shinozaki, K. Pivotal role of the AREB/ABF-SnRK2 pathway in ABRE-mediated transcription in response to osmotic stress in plants. Physiol. Plant. 2013, 147, 15–27. [Google Scholar] [CrossRef]
  57. Awasthi, P.; Mahajan, V.; Jamwal, V.L.; Kapoor, N.; Rasool, S.; Bedi, Y.S.; Gandhi, S.G. Cloning and expression analysis of chalcone synthase gene from Coleus forskohlii. J. Genet. 2016, 95, 647–657. [Google Scholar] [CrossRef]
  58. A Creelman, R.; Tierney, M.L.; E Mullet, J. Jasmonic acid/methyl jasmonate accumulate in wounded soybean hypocotyls and modulate wound gene expression. Proc. Natl. Acad. Sci. USA 1992, 89, 4938–4941. [Google Scholar] [CrossRef]
Figure 1. Flavonoid biosynthetic pathway. Enzymatic reactions: CHS: chalcone synthase; CHI: chalcone isomerase; F3′H: flavonoid 3′-hydroxylase; ANR: anthocyanin reductase; FLS: flavonol synthase; DFR: dihydroflavonol 4-reductase; ANS: anthocyanidin synthase.
Agronomy 13 01488 g001
Figure 2. Phylogenetic analyses of CHS proteins. MEGA-X with default parameters was used to construct a phylogenetic tree of CHS proteins. The three groups are shown in different colors. Pink stars indicate Dendrobium catenatum CHSs (DcCHSs); light blue squares indicate Phalaenopsis equestris CHSs (PeCHSs); green triangles represent Apostasia shenzhenica CHSs (AsCHSs); purple circles represent Arabidopsis thaliana CHSs (AtCHSs); blue checkmarks represent Oryza sativa CHSs (OsCHSs).
Agronomy 13 01488 g002
Figure 3. Motifs, gene structures, and phylogenetic relationships of DcCHS family members. (A) Phylogenetic tree of 14 DcCHS proteins generated using Neighbor-Joining (NJ) method. (B) Conserved motifs of DcCHS proteins. (C) Exon/intron structures of DcCHS genes. UTR(s), exon(s), and intron(s) are indicated with green boxes, yellow boxes, and black lines, respectively.
Agronomy 13 01488 g003
Figure 4. Alignments of the conserved domains of DcCHS proteins. (A) Alignments of the Chal_sti_synt_C and Chal_sti_synt_N domains from the MEME results for DcCHS. Motifs 1, 3, and 7 formed the putative Chal_sti_synt_N domain; motifs 2, 5, and 6 formed the putative Chal_sti_synt_C domain. (B) Alignment of the conserved domains of CHS proteins from A. thaliana and D. catenatum. The conserved amino acids are shown in the red box.
Agronomy 13 01488 g004
Figure 5. Analysis of cis-elements in the DcCHS genes’ promoter regions. (A) Phylogenetic tree of 14 DcCHS proteins was generated using the NJ method. (B) Different types of cis-elements and their locations in each DcCHS gene are indicated by different colored blocks. (C) Numbers of different promoter elements in the DcCHS genes indicated by different numbers and colors in the grid. The number of cis-elements varies from few (blue) to many (red).
Agronomy 13 01488 g005
Figure 6. Expression of DcCHS genes in different organs of D. catenatum using RT-qPCR. Mean expression values were obtained using TBtools; green and red indicate low and high levels of expression, respectively. RO: root; ST: stem; LE: leaf; SE: sepal; GY: gynostemia; PE: petal; LI: lip; FS: flower stalk.
Agronomy 13 01488 g006
Figure 7. Expression analysis of the DcCHS genes under drought stress using RT-qPCR. The data are expressed as mean ± standard deviation (n = 3). Vertical bars represent means of fold change in expression and standard deviations calculated from replicates. Values of 0, 3, 6, 9, 12, 24, and 48 indicate hours after treatment. Asterisks (* or **) indicate a significant difference at p < 0.05 or 0.01, respectively.
Agronomy 13 01488 g007
Figure 8. Expression analysis of the DcCHS genes under heat stress using RT-qPCR. The data are expressed as mean ± standard deviation (n = 3). Vertical bars represent means of fold change in expression and standard deviations calculated from replicates. Values of 0, 3, 6, 9, 12, 24, and 48 indicate hours after treatment. Asterisks (* or **) indicate a significant difference at p < 0.05 or 0.01, respectively.
Agronomy 13 01488 g008
Figure 9. Expression analysis of the DcCHS genes under cold stress using RT-qPCR. The data are expressed as mean ± standard deviation (n = 3). Vertical bars represent means of fold change in expression and standard deviations calculated from replicates. Values of 0, 3, 6, 9, 12, 24, and 48 indicate hours after treatment. Asterisks (* or **) indicate a significant difference at p < 0.05 or 0.01, respectively.
Agronomy 13 01488 g009
Figure 10. Expression analysis of the DcCHS genes under salt stress using RT-qPCR. The data are expressed as mean ± standard deviation (n = 3). Vertical bars represent means of fold change in expression and standard deviations calculated from replicates. Values of 0, 3, 6, 9, 12, 24, and 48 indicate hours after treatment. Asterisks (* or **) indicate a significant difference at p < 0.05 or 0.01, respectively.
Agronomy 13 01488 g010
Table 1. Predicted properties of CHS gene family in D. catenatum.
Gene NameGene IDGenome LocationNumber of AAMolecular Weight (kDa)Isoelectric Point
DcCHS-1LOC110093469NW_021319518.1:463108..46426834939.088.17
DcCHS-2LOC110095943NW_021319113.1:1380296..138332247553.019.63
DcCHS-3LOC110097994NW_021319038.1:172372..17534545950.878.99
DcCHS-4LOC110102409NW_021319579.1:20604..2252050456.569.23
DcCHS-5LOC110105072NW_021319486.1:2280082..228147239042.926.47
DcCHS-6LOC110105073NW_021319486.1:2289000..229056439042.806.03
DcCHS-7LOC110105128NW_021318754.1:408439..41023141445.285.77
DcCHS-8LOC110105791NW_021320118.1:417120..42208143748.239.41
DcCHS-9LOC110107833NW_021320045.1:188807..19195339042.695.64
DcCHS-10LOC110111736NW_021319037.1:14010..1845644749.618.94
DcCHS-11LOC110113718NW_021319694.1:1133825..113724545950.868.90
DcCHS-12LOC110113809NW_021318618.1:10804662..1080837839543.166.05
DcCHS-13LOC110115249NW_021319113.1:1410080..141165639042.555.86
DcCHS-14LOC110115253NW_021319113.1:1427672..142922038842.656.28
Disclaimer/Publisher’s Note: The statements, opinions and data contained in all publications are solely those of the individual author(s) and contributor(s) and not of MDPI and/or the editor(s). MDPI and/or the editor(s) disclaim responsibility for any injury to people or property resulting from any ideas, methods, instructions or products referred to in the content.

