Article

Parameter Calibration and Systematic Test of a Discrete Element Model (DEM) for Compound Fertilizer Particles in a Mechanized Variable-Rate Application

1
College of Engineering, Nanjing Agricultural University, Nanjing 210031, China
2
School of Automation, Nanjing University of Information Science & Technology, Nanjing 210044, China
3
State Key Laboratory of Power System of Tractor, Luoyang 471039, China
*
Author to whom correspondence should be addressed.
These authors contributed equally to this work.
Agronomy 2023, 13(3), 706; https://doi.org/10.3390/agronomy13030706
Submission received: 4 February 2023 / Revised: 26 February 2023 / Accepted: 26 February 2023 / Published: 27 February 2023
(This article belongs to the Section Agricultural Biosystem and Biological Engineering)

Abstract

:
In order to obtain accurate discrete element simulation model (DEM) parameters of compound fertilizer and solve the problem of challenging measurement of contact parameters of compound fertilizer particle, simulation calibration test was carried out by using EDEM simulation soft-ware. This study measured the intrinsic parameters and contact parameters of compound fertilizer particles through physical tests and established a simulation model that corresponds with the actual situation to calibrate the contact parameters of compound fertilizer particles. By using the Blackett-Burman test, the parameters that had a significant impact on the compound fertilizer’s resting angle were determined by the fertilizer-fertilizer collision recovery coefficient, fertilizer-fertilizer rolling friction coefficient, and fertilizer-steel static friction coefficient. Utilizing the steepest ascent test, the ideal value intervals for the three key parameters were identified. Box-Burman response surface analysis was used to establish and optimize the regression model of the rest angle and significant parameters. With the actual rest angle as the target value, the best combination of significant parameters was found, which was used for the simulation verification test. The simulated rest angle was 20.61°, whereas the real rest angle was 19.95°, with a relative error of 3.31%. The results demonstrate that the calibration parameters are essentially accurate representations of the real characteristics, which can serve as a reference point for simulation research and optimization design of variable fertilizer spreader.

1. Introduction

The excessive use of chemical fertilizers and low utilization rates in China not only squander resources and pollute the environment, but also frequently result in overabundances of dangerous compounds in crops and compromise food safety [1,2]. Mechanized variable fertilizer spreading technology has drawn a lot of interest from related academics to carry out effective and rational fertilizer application and nutrient management, increase fertilizer utilization rate, guarantee the safety of food production, and promote sustainable agricultural development [3,4,5,6]. The trajectory of fertilizer particles is significantly influenced by intrinsic parameters (density, moisture content, diameter, Poisson’s ratio, and elasticity modulus), as well as contact parameters (collision recovery coefficient, static friction coefficient, and rolling friction coefficient) [7,8]. The static and rolling friction coefficients primarily control the movement of the particles, while the collision recovery coefficient describes the stability of the particulates [9]. In this study, the intrinsic parameters of compound fertilizer particles were directly measured by physical tests, and the contact parameters difficult to be accurately measured by physical tests were calibrated through discrete element simulation tests to obtain accurate contact parameters.
The discrete element technique has undergone continual study and improvement since it was first put forth by Gundall et al. [10], and has been extensively employed in the study of agricultural products. Hao et al. [11] established a discrete element simulation model of yam and sandy loam, and calibrated the mechanical properties of yam and the contact parameters between sandy loam substrates. Zhang et al. [12] employed ball particles of various radii to fill the rice seed contour and were able to determine the filling particle radius that provided the best simulation accuracy and speed. Wang et al. [13] modeled the sunflower seed model with different numbers of spherical particles and obtained the simulated angle of repost and packing density closest to the physical test results. Lu et al. [14] conducted simulation comparison tests between the ellipsoidal modeling method and multi-sphere modeling, which showed that ellipsoidal modeling could accurately simulate the motion process of wheat seeds, providing a new discrete element method for wheat seed simulation. In order to reduce the computing time of the computer, the particle size of the discrete element model can be properly enlarged, so that the problem of the original model can be solved in a reasonable time. Ren et al. [15] used the similarity theory and dimensional analysis to scale up the pulverized iron coal particles, calibrate the contact parameters of the enlarged particles, and verify the accuracy of the particle scaling method. Zou et al. [16] calibrated the contact parameters of discrete element simulation of quicklime powder based on particle scaling theory, and the simulation experimental results obtained were highly consistent with the physical experimental results.
In order to obtain accurate contact parameters of fertilizer particles, parameter calibration of discrete element model of fertilizer particles is needed. Based on the Hertz-Mindlin with Johnson-Kendall-Roberts (JKR) model, and combined with physical tests, Yuan et al. [17] calibrated parameters of the discrete element model of organic fertilizer bulk particles, and the error between the actual rest angle and the simulated rest angle obtained under the calibrated parameters was only 0.42%. To calibrate the discrete element parameters of large granular urea, Wen et al. [18] proposed a calibration method of friction factors based on the general characteristics of granular materials. Du et al. [19] conducted a uniaxial compression test to determine the ultimate crushing displacement and ultimate crushing displacement of wrapped fertilizer and found the best combination of simulation parameters for the Bonding model of wrapped fertilizer.
In this study, (1) physical tests were run to assess the intrinsic and contact parameters of the compound fertilizer particles; (2) Blackett-Burman tests were carried out with the actual measured contact parameter ranges at low and high levels; (3) the steepest ascent test and Box-Behnken test were combined with the actual rest angle to calibrate the parameters of the discrete element simulation of compound fertilizer and obtain accurate parameters. This will provide a reference basis for the research of accurate and uniform fertilizer spreading performance of the variable fertilizer spreader.

2. Materials and Methods

2.1. Materials

In this study, Huachang 15-15-15 compound fertilizer was used as the fertilizer for the experiment, and the particle density of compound fertilizer was 1585 kg/m3. Since stainless steel makes up the majority of the spreading components, it is chosen for the test’s materials, including the cylinders and plates that came into touch with the compound fertilizer particles. The test materials are shown in Figure 1.

2.2. Methods

The flow and frictional characteristics of fertilizer particles, which are connected to the physical and mechanical characteristics of fertilizer particles and contact materials, are reflected in the resting angle [20]. In this study, parameters of the discrete element of compound fertilizer were calibrated using a mix of physical and simulation experiments [21,22].
The parameters needed for the simulation were first determined through physical experiments. A fertilizer particle pile was created using the cylinder lifting method, and images were taken of it in four mutually perpendicular directions. The resting angle of the pile was measured unilaterally by MATLAB image processing techniques, and the average value was regarded as the actual rest angle. Following that, the Plackett-Burman test was carried out using Design-Expert 13 software, the simulation test was completed using EDEM 2021.2 software, and the rest angle of the fertilizer pile was measured once it had stabilized. The ANOVA (analysis of variance) of Plackett-Burman was used to find the significant parameters that affected the resting angle. The steepest climb test was then used to reduce the range of significant parameters, and the ANOVA of Box-Benhnken was used to determine the regression model and regression equation of the fertilizer’s resting angle with the significant parameter. The items in the regression equation that were not significant for the rest angle were removed to optimize the regression model. The regression equation was solved with the actual rest angle as the target value to obtain the optimal combination of significant parameters. Finally, simulation tests were conducted under an optimal combination of the calibrated parameters to compare the simulated rest angle with the actual rest angle and verify the accuracy of the calibrated parameters.

3. Determination of Actual Angle of Repose

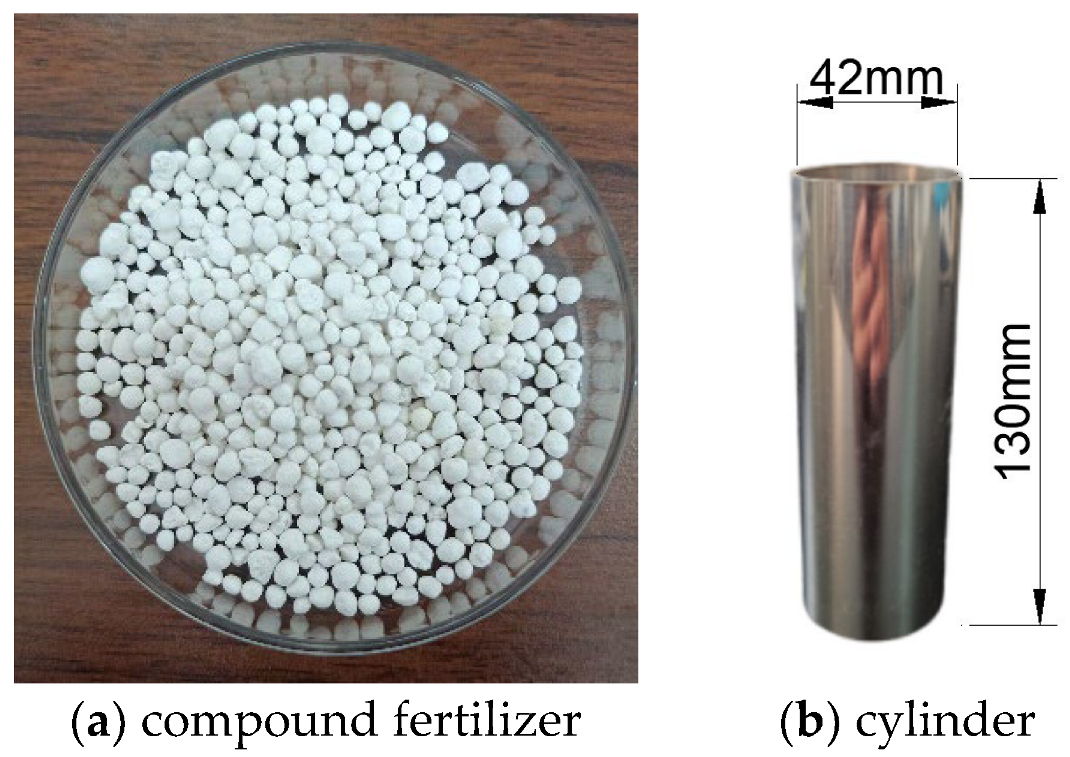
The study used the cylinder lifting method to assess the resting angle of compound fertilizer particles. According to reference [
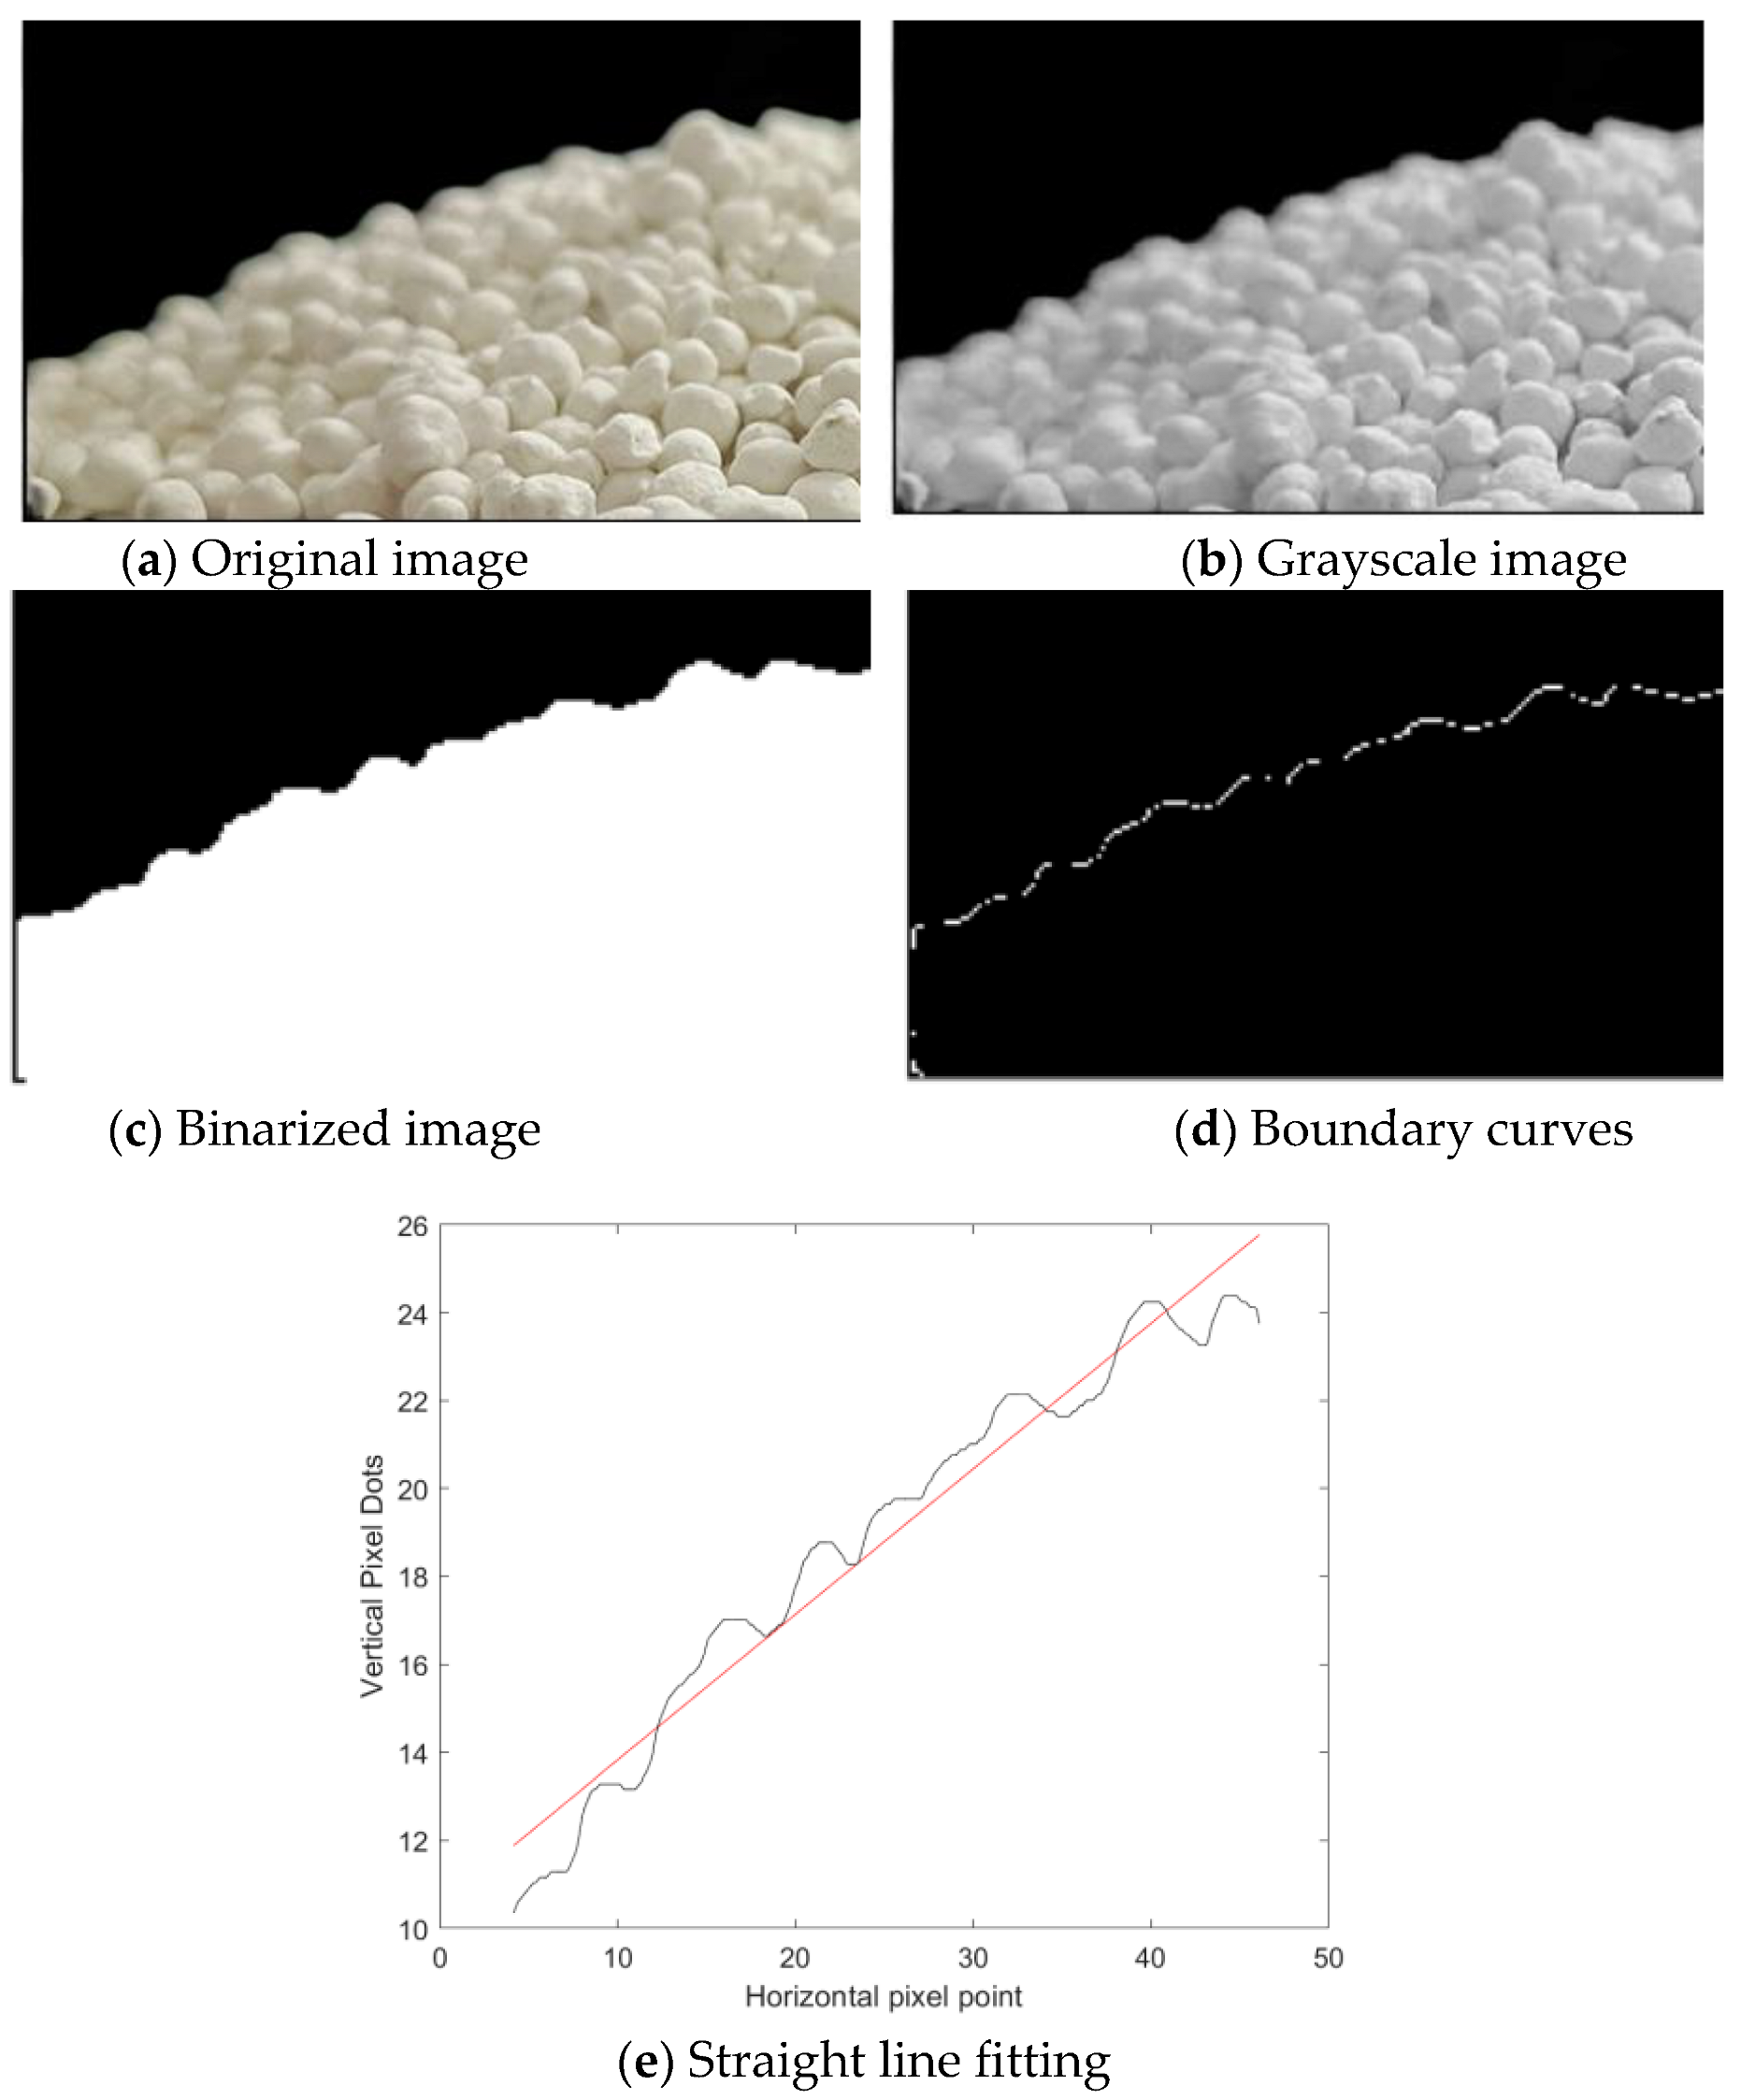
23], the diameter of the cylinder is 4–5 times larger than the maximum diameter of the fertilizer particle, and the ratio of the diameter to the height is 1:3. Therefore, the inner diameter of the cylinder used in this study was 42 mm and the height is 130 mm. During the test, the steel cylinder was lifted upright at a speed of 0.02 m/s, and the fertilizer particles naturally fell to form a pile of particles. Images of the pile of fertilizer particles were taken along the four mutually perpendicular directions. As shown in Figure 2, using grayscale, binarization, and other image processing algorithms, the unilateral boundary curve of the pile of fertilizer particles was extracted for linear fitting, and the average value was taken as the actual resting angle of the pile of compound fertilizer particles. The test was carried out three times, with an average of 19.95° as the actual angle of repose of compound fertilizer particles.

4. Physical Tests and Simulation Models

The intrinsic parameters of the compound fertilizer in this study were established directly through physical tests, with a focus on the collision recovery coefficient, static friction coefficient, and rolling friction coefficient of the fertilizer for the calibration of the simulation tests. This was done because the intrinsic parameters of the particles are relatively simple to measure and have a small impact on the resting angle [24].

4.1. Determination of Poisson’s Ratio, Modulus of Elasticity and Shear Modulus

To measure Poisson’s ratio, elastic modulus, and shear modulus of the compound fertilizer granules, an extrusion test was conducted by a TMS-Pro texture analyzer (maximum test force of 1000 N) made by FTC, USA, as shown in Figure 3. The displacement sensor and force sensor on the TMS-Pro texture analyzer can determine the Poisson’s ratio, elastic modulus, and shear modulus of fertilizer granules. The calculation formula is as follows [25,26,27].
{ v = | W 1 W 2 H 1 H 2 | E = F H 1 A ( H 1 H 2 ) G = E 2 ( 1 + v )
where, v , E and G are the Poisson’s ratio, modulus of elasticity and shear modulus of fertilizer granules, respectively; W 1 and W 2 are the width of fertilizer granules before and after loading, respectively; H 1 and H 2 are the thickness of fertilizer granules before and after loading, respectively; F is the lead load on fertilizer granules, and A is the cross-sectional area of fertilizer granules.
For the test, 30 intact fertilizer particle samples were randomly chosen for the extrusion test using TMS-Pro texture analyzer. The test results were averaged, and the Poisson’s ratio (0.24), elastic modulus (2.85 × 10⁷ Pa) and shear modulus (1.15 × 10⁷ Pa) of the compound fertilizer were obtained.

4.2. Determination of Collision Recovery Coefficient

According to the kinematic theory behind the inclined plate collision test, which is illustrated in Figure 4, the collision recovery coefficient of compound fertilizer particles was calculated.
Fertilizer pellets fall freely from a fixed height H 0 , strike the inclined plate at an inclination of θ , then make an oblique projectile motion before falling onto the receiving plate. In order to determine the collision recovery coefficient of compound fertilizer particles, the distance from the inclined plate to the receiving plate was changed in this test, and the test was repeated twice to measure the horizontal displacement S 1 , S 2 and vertical displacement H 1 , H 2 of fertilizer particles. The inclined plate could be used to install various collision materials (stainless steel plate or fertilizer particle bed), allowing for the measurement of the collision recovery coefficient between fertilizer particles and various collision materials. The kinematic formula estimates that the speed of fertilizer particles as they approach the slanted plate is
v 0 = 2 g H 0
When compound fertilizer particles have an oblique throwing motion, Equation3 can be obtained according to the oblique throwing motion principle.
{ S i = v x t H i = v y t + 1 2 g t 2 ( i = 1 , 2 )
where S 1 , and H i   ( i = 1 , 2 ) are the horizontal displacement and vertical displacement of the oblique throwing motion of compound fertilizer particles.
From Equation (3), the horizontal partial velocity v x and horizontal partial velocity v y of the compound fertilizer particles after collision with the inclined plate can be obtained.
{ v x = g S 1 S 2 ( S 1 S 2 ) 2 ( H 1 S 2 H 2 S 1 ) v y = H 1 v x S 1 g S 1 2 v x
The collision recovery coefficient is defined as the ratio of the post-collision separation velocity to the pre-collision approach velocity, and is calculated as follows.
e = | v n v n | = | v x 2 + v y 2 sin ( θ + arctan v y v x ) v 0 cos θ |
where v n is the post-collision separation velocity, v n is the pre-collision approach velocity, and θ is the inclination angle of steel plate.
Following multiple iterations, the collision recovery coefficients between compound fertilizer particles and steel plate were determined to be 0.05–0.47 and 0.04–0.4, respectively.

4.3. Determination of Friction Coefficient

4.3.1. Static Friction Coefficient

The static friction coefficient was determined by the slant method. Using the fertilizer-steel static friction coefficient as an example, the fertilizer particles were adhered to the adhesive tape before the test to prevent them from rolling down on the inclined surface rather than slipping. The test procedure was as follows: the fertilizer particles covered with adhesive tape on the steel inclined surface, the inclined angle raised slowly, and when the fertilizer particles began to slide, the inclined angle of the inclined surface was recorded. The measurement diagram is shown in Figure 5.
In order to reduce the impact of the irregularity of fertilizer particles on the static friction coefficient between fertilizer particles, the larger, flat fertilizer particles were chosen and glued to the sloping surface to form a granular bed. The aforementioned experimental steps were repeated, and the schematic diagram of the measurement device is shown in the following paragraphs. According to the inclined angle of the inclined surface, fertilizer-steel and fertilizer-fertilizer static friction coefficient may be calculated, as shown in Equation (6).
μ = tan θ
where μ is the coefficient of static friction; θ is the inclination angle of the slope when the fertilizer particles start to slide.
Following numerous tests, the ranges of fertilizer-fertilizer and fertilizer-steel static friction coefficient were determined to be 0.62–0.93 and 0.27–0.49, respectively.

4.3.2. Rolling Friction Coefficient

According to the trial results of Section 4.3.1, a steel plate inclined angle of 23° was used to ensure that the fertilizer particles can roll down freely on the inclined surface. During the test, the sample pellet was released from the starting point at rest and rolled across the horizontal steel plate, which was measured with a tape measure.
In this test, fertilizer particles were pasted onto the horizontal steel plate, the surface of the particle bed was kept flat, and the above experimental steps were repeated to measure the rolling friction coefficient of compound fertilizer. The measuring device schematic diagram is shown in Figure 6.
According to the law of conservation of energy, the formula for calculating the fertilizer-fertilizer and fertilizer-steel rolling friction coefficient can be obtained, as shown in Equation (7). After conducting the experiment several times, it was discovered that the fertilizer-fertilizer and fertilizer-steel rolling friction coefficient have respective ranges of 0.39–0.91 and 0.1–0.22.
{ m g H = μ 1 m g ( H cot α + S 1 ) m g H = μ 1 m g H cot α + μ 2 m g S 2
where H is the height from the starting point to the lowest end of the slope, α is the inclination angle of the slope, μ 1 , μ 2 are the fertilizer-fertilizer and fertilizer-steel rolling friction coefficient, respectively, and S 1 , S 2 are the distances of the fertilizer particles rolling over the horizontal steel plate and particle bed, respectively.

4.4. Simulation Model

The size, moisture content, and presence of adhesion on the surface of the particles are the key factors considered when choosing the contact model for fertilizer particles [28,29]. The adhesive force can be disregarded when the clay moisture content does not result in plastic deformation, according to the literature [30,31]. An electronic balance (accuracy of 0.01 g) and an electric blast drier with a maximum adjustable temperature of 255 °C were employed as the measuring devices to determine the water content of the fertilizer. In the test, the fertilizer’s moisture content was found to be 5.6%. It was assumed there was no adhesion force on the surface of compound fertilizer particles, and the movement characteristics of compound fertilizer particles depended on the small elastic deformation between particles. Therefore, the Hertz-Mindlin non-slip contact model was adopted in the simulation to calculate the mechanical behavior of compound fertilizer particles.
Vernier calipers (accuracy 0.02 mm) were used to measure the length, width, and thickness of the fertilizer granule samples after 200 randomly chosen portions of the fertilizer were chosen. The length, width and thickness of the actual model of compound fertilizer particles are defined as the size of particles on the X axis, Y axis and Z axis respectively, as shown in Figure 7a. Equation (8) was used to get the equivalent diameter of the compound fertilizer particles [32].
D = L W H 3
where D is the equivalent diameter of the compound fertilizer particles, and L , W , H , are the length, width and thickness of the compound fertilizer particles, respectively.
Further, the sphericity of the compound fertilizer particles can be derived from Equation (9) [33].
ϕ = D L
Experimental measurements revealed that the average equivalent diameter of compound fertilizer particles was 3.55 mm, with an average sphericity of 90.9%, a particle size range of 2.52–5.17 mm, and with a frequency distribution histogram as displayed in Figure 8. Compound fertilizer particles fall into the sphere class since their average sphericity is 90.9% higher than 85%, and one sphere can be used to directly fill the model [34,35]. Figure 7b illustrates how to build a discrete element model using a diameter of 3.55 mm. According to the particle size distribution of fertilizer particles obtained from physical tests, the particle generation method of the particle plant was set to generate by random distribution, the minimum size limit was set to 0.7 times the average diameter, and the maximum size limit was 1.45 times the average diameter.
By reviewing the literature [36], the intrinsic properties of stainless steel were discovered. Table 1 provides an overview of the intrinsic and contact characteristics of the composite fertilizer and stainless steel.

5. Results

5.1. Plackett-Burman Test

Some of the simulation parameters do not have a significant effect on the rest angle, which cannot be calibrated using the rest angle [37]. To improve the accuracy of the simulation calibration parameters, contact parameters were screened to identify those that significantly affect the rest angle by Design-Expert 13 (Stat-ease Ins). The parameter levels of the simulation test were set as shown in Table 2.
Table 3 displays the Plackett-Burman test protocol and outcomes. ANOVA was performed on the results of Plackett-Burman test, and the effect and significance of the six parameters on the resting angle were obtained as shown in Table 4. According to Table 4, the effects of A, C, and E on the resting angle are highly significant, and the effects of D are significant.

5.2. Steepest Ascent Test

To quickly approximate the optimal value interval of each significant parameter, the steepest ascent test was conducted based on the significance parameters screened by the Plackett-Burman test. According to references [17] and [36], if the p-value of a significant parameter is less than 0.05 and greater than 0.01, and the p-value of other significant parameters is less than 0.01, the parameter can be ignored in the steepest ascent test. According to the results in Table 4, although D is a significant parameter, it is far less significant than A, C and E. Therefore, only A, C and E were selected for the steepest ascent test in this study. The values of A, C, and E were increased from small to large in specific steps and the remaining parameters were taken as intermediate levels.
According to Table 5, as A, C, and E increase, the relative error between the simulated rest angle and the actual rest angle increased first and then decreased, and the compound fertilizer simulated rest angle increased continuously. As a result, the ideal interval should be close to the value of No. 4.

5.3. Box-Behnken Test

According to Table 5, the levels of parameter in No. 4 were used for the center point, and the levels of No. 3 and No. 5 were used for the low and high levels for the Box-Behnken test, respectively. This was done in accordance with the findings of the steepest ascent test, which revealed that the rest angle obtained from No. 4 had the smallest relative error with the rest angle. Table 6 displays the test procedure and outcomes, a total of 17 trials, including five replications of the center point.
ANOVA of the quadratic regression model was obtained as shown in Table 7. From Table 7, it can be seen that the effects of A, C, E, AC, A2, C2 on the rest angle were highly significant, indicating that the model is valid. p-value for the quadratic regression model is less than 0.0001 and p-value for the misfit term is 0.0842, which is greater than 0.05, indicating a good model fit. The test results show that the reliability of the type of model regression, with the coefficient of determination R2 = 0.9830, the corrected coefficient of determination R2adj = 0.9612, coefficient of variation CV = 1.45%, and the accuracy Adeq Precision = 27.5977, indicated a high level of model accuracy. According to the above analysis, the second order regression equation of angle of repose and significance parameter is as follows.
α = 19.52 + 0.6325 A + 0.6975 C + 1.5775 E + 0.5975 AC 0.0125 AE + 0.1325 CE 0.80875 A 2 + 0.53625 C 2 + 0.10125 E 2
The p-value of AE, CE and E2 in the regression model were greater than 0.05, which have no significant effect on the angle of repose, so they should be removed to optimize the regression model and improve the reliability and accuracy of the model. In Table 8, ANOVA of the modified regression model is presented. The p-value for the misfit term is 0.1554, this for the quadratic regression model is less than 0.0001, R2 = 0.9796, R2adj = 0.9673, Adeq Precision = 35.0525, and CV = 1.33%. It can be seen that the validity, reliability and accuracy of the model have been improved to some extent compared with that before optimization. The optimized regression equation is
α = 19.56 + 0.6325 A + 0.6975 C + 1.5775 E + 0.5975 AC 0.8034 A 2 + 0.5416 C 2

5.4. Discussion

To find the optimal solution for the above three significant parameters with the actual rest angle as the target value, the ideal set of parameters with the smallest error between the simulated rest angle and the actual rest angle was determined by the optimization module of Design-Expert 13, in which the fertilizer-fertilizer collision recovery coefficient was 0.44, the fertilizer-fertilizer rolling friction coefficient was 0.62, and the fertilizer-steel static friction coefficient was 0.43. A simulation verification experiment was carried out in the EDEM 2021.2 (Altair) utilizing the significant parameters as the ideal solution and the remaining parameters as the middle level. A comparison between the simulation test and the actual test is shown in Figure 9. The actual rest angle was 19.95°, whereas the simulated rest angle with optimal parameter solution was 20.61°, and the relative error between the two was 3.31%, which was not significantly different and shows that the three significant parameters’ optimal solutions are accurate and efficient.

6. Conclusions

In this study, Huachang 15-15-15 compound fertilizer was taken as the research object, the angle of repose was taken as the response value, and the contact parameters of compound fertilizer particles were calibrated by a combination of physical tests and simulation tests. Plackett-Burman, steepest ascent, and Box-Behnken tests were carried out successively to determine the simulation angle of repose that is most similar to the results of the physical tests. The specific findings are as follows.
(1)
The Huachang 15-15-15 compound fertilizer has a Poisson’s ratio of 0.24, an elastic modulus of 2.85 × 10⁷ Pa, a shear modulus of 1.15 × 10⁷ Pa, and a moisture content of 5.6%, which serve as the foundational information for the simulation calibration.
(2)
The Plackett-Burman test indicates that the fertilizer-fertilizer collision recovery coefficient, the fertilizer-fertilizer rolling friction coefficient, and the fertilizer-steel static friction coefficient are the variables that significantly affect the compound fertilizer’s resting angle. The steepest climb test revealed that the ideal value intervals for the three significant parameters were 0.25–0.45, 0.55–0.75, and 0.35–0.45. A regression model was created and optimized by Box-Behnken ANOVA, which revealed that in addition to the three significant parameters, the quadratic and interaction terms of the fertilizer-fertilizer collision recovery coefficient and fertilizer-fertilizer rolling friction coefficient also have significant effects on the rest angle.
(3)
A fertilizer-fertilizer collision recovery coefficient of 0.42, fertilizer-fertilizer rolling friction coefficient of 0.66, and fertilizer-steel static friction coefficient of 0.41 are the three optimal values obtained after solving the optimal equation with actual rest angle as the target value. The simulation test was conducted with the ideal parameter combination, and the simulated rest angle was measured to be 20.61°. The relative error to the actual rest angle of 19.95° was 3.31%, with no significant error, indicating that the discrete unit model of compound fertilizer’s parameters obtained from the calibration of the study were accurate.
The process of integrating physical experiments with simulation experiments can increase the precision of discrete element model parameter calibration and produce precise contact parameters. The simulation test results in this study are very consistent with the actual test results, demonstrating the accuracy and dependability of the calibrated parameters. These calibrated parameters can provide the necessary fundamental data for subsequent discrete system modeling and particle kinematics and dynamic characteristics of the variable fertilizer speller, thereby enhancing its accuracy and uniformity.

Author Contributions

Conceptualization, Y.S. and X.W.; methodology and software, L.W. and H.Y.; experiment, L.W. and Y.S.; data collation, H.Y. and H.L.; funding acquisition, Y.S. and X.W.; supervision, Y.S. and L.W.; writing-original draft, F.Y. and H.Y.; writing—review and editing, L.W. and H.L. All authors have read and agreed to the published version of the manuscript.

Funding

This work was supported financially by N Natural Science Foundation of Jiangsu Province (Grant No. BK20210410), and Project of State Key Laboratory of Power System of Tractor (Grant No. SKT2022005).

Acknowledgments

The authors would like to thank the teacher’s and supervisor’s technical support. We also appreciate the assistance provided by brothers and sisters during the tests. We are also grateful to the editor and anonymous reviewers for providing helpful suggestions to improve the quality of the present paper.

Conflicts of Interest

The authors declared no potential conflict of interest.

References

  1. Zeng, S.; Tang, H.; Luo, X.; Ma, G.; Wang, Z.; Zang, Y.; Zhang, M. Design and experiments of synchronous trenching, starting and fertilizing rice precision dry hole direct seeding machine. J. Agric. Eng. 2012, 28, 12–19. [Google Scholar]
  2. Liu, Y.; Warren, M.; Zhang, H. Conserving fertilizer in China’s rural-agricultural development: The reversal shifts and the county-specific. Clean. Environ. Syst. 2021, 3, 100050. [Google Scholar] [CrossRef]
  3. Chen, C.; Zhang, S.; Sun, X.; Li, Y. Design and experiment of a self-propelled variable fertilizer spreader for upland gaps in paddy fields. J. Agric. Eng. 2012, 28, 16–21. [Google Scholar]
  4. Hu, Y.; Yang, Y.; Xiao, H.; Li, P. Simulation and parameter optimization of centrifugal fertilizer spreading process of tea garden fertilizer applicator. J. Agric. Mach. 2016, 47, 77–82. [Google Scholar]
  5. Gou, Y.; Li, H.; Wang, D.; He, H. Design and simulation optimization of a small variable fertilizer spreader based on EDEM. J. Agric. Mech. Res. 2022, 44, 65–71, 76. [Google Scholar]
  6. Yang, L.; Chen, L.; Zhang, J.; Liu, H.; Sun, Z.; Sun, S.; Zheng, L. Fertilizer sowing simulation of a variable-rate fertilizer applicator based on EDEM. IFAC-Pap. Line 2018, 51, 418–423. [Google Scholar] [CrossRef]
  7. Kweon, G.; Grift, T.E.; Miclet, D.; Virin, T.; Piron, E. Analysis and control of uniformity by the feed gate adaptation of a granular spreader. J. Biosyst. Eng. 2009, 34, 95–105. [Google Scholar]
  8. Cool, S.; Pieters, J.; Mertens, K.C.; Hijazi, B.; Vangeyte, J. A simulation of the influence of spinning on the ballistic flight of spherical fertiliser grains. Comput. Electron. Agric. 2014, 105, 121–131. [Google Scholar] [CrossRef]
  9. Zhong, W.; He, K.; Zhou, Z.; Xia, W.; Li, Y. Calibration of damping coefficients in discrete element simulation of particles. J. Phys. 2009, 58, 5155–5161. [Google Scholar]
  10. Cundall, P.A.; Strack, O.D.L. A Discrete Numerical Mode for Granular Assemblies. Geotechnique 1979, 29, 47–65. [Google Scholar] [CrossRef]
  11. Hao, J.; Long, S.; Li, H.; Zhao, J.; Yin, B.; Yang, X. Discrete element model construction and parameter calibration of cultivated Yam. Trans. Chin. Soc. Agric. Eng. 2019, 35, 34–42. [Google Scholar]
  12. Zhang, R.; Jiao, W.; Zhou, J.; Qi, B.; Liu, H.; Xia, Q. Parameter calibration of rice seed discrete element model with different filling particle radius. Chin. J. Agric. Mach. 2020, 51, 227–235. [Google Scholar]
  13. Wang, S.; Yu, Z.; Aorigele; Zhang, W. Study on the modeling method of sunflower seed particles based on the discrete element method. Comput. Electron. Agric. 2022, 198, 107012. [Google Scholar] [CrossRef]
  14. Lu, C.; Gao, Z.; Li, H.; He, J.; Wang, Q.; Wei, X.; Wang, X.; Jiang, S.; Xu, J.; He, D.; et al. An ellipsoid modelling method for discrete element simulation of wheat seeds. Biosyst. Eng. 2023, 226, 1–15. [Google Scholar] [CrossRef]
  15. Ren, J.; Zhou, L.; Han, L.; Li, J.; Mao, B. Discrete Simulation of Vertical Spiral Transportation Based on particle Scaling Theory. Chin. J. Process Eng. 2017, 17, 936–943. [Google Scholar]
  16. Yang, Z.; Tong, T.; Zicheng, G.; Shi, Y.; Davis, N. Quick lime powder discrete element parameters based on the theory of particle scale calibration. China Powder Technol. 2023, 29, 278. [Google Scholar]
  17. Yuan, Q.; Xu, L.; Xing, J.; Duan, Z.; Ma, S.; Yu, C.; Chen, C. Parameter calibration of discrete element model for mechanically applied organic fertilizer bulk particles. J. Agric. Eng. 2018, 34, 21–27. [Google Scholar]
  18. Wen, X.; Yuan, H.; Wang, G.; Jia, H. Research on discrete element simulation friction factor calibration method for granular fertilizer. J. Agric. Mach. 2020, 51, 115–122, 142. [Google Scholar]
  19. Du, X.; Liu, C.; Jiang, M.; Yuan, H.; Dai, L.; Li, F. Parameter calibration of Bonding model for wrapper fertilizer based on discrete elements. J. Agric. Mach. 2022, 53, 141–149. [Google Scholar]
  20. Wang, Y.; Liang, Z.; Zhang, D.; Cui, T.; Shi, S.; Li, K.; Yang, L. Calibration of interspecific contact parameters for discrete element-based maize seed particle model. J. Agric. Eng. 2016, 32, 36–42. [Google Scholar]
  21. Yan, D.; Yu, J.; Wang, Y.; Zhou, L.; Yu, Y. A general modelling method for soybean seeds based on the discrete element method. Powder Technol. 2020, 372, 212–226. [Google Scholar] [CrossRef]
  22. Zhong, J.; Tao, L.; Li, S.; Zhang, B.; Wang, J.; He, Y. Determination and interpretation of parameters of double-bud sugarcane model based on discrete element. Comput. Electron. Agric. 2022, 203, 107428. [Google Scholar] [CrossRef]
  23. Jia, F.; Han, Y.; Liu, Y.; Cao, Y.; Shi, Y.; Yao, L.; Wang, H. Simulation and prediction method for pile-up angle of rice granular material. J. Agric. Eng. 2014, 30, 254–260. [Google Scholar]
  24. Zhou, Y.C.; Xu, B.H.; Yu, A.B.; Zulli, P. An experimental and numerical study of the angle of repose of coarse spheres. Powder Technol. 2002, 125, 45–54. [Google Scholar] [CrossRef]
  25. Song, X.; Dai, F.; Zhang, F.; Wang, D.; Liu, Y. Calibration of DEM models for fertilizer particles based on numerical simulations and granular experiments. Comput. Electron. Agric. 2023, 204, 107507. [Google Scholar] [CrossRef]
  26. Li, X.; Liao, M.; Yang, J.; Lu, M.; Liu, X.; Chen, P. Discrete element parameter calibration and seed scheduling verification of Qiang live grain and perlite. Chin. J. Agric. Mech. 2022, 43, 7. [Google Scholar] [CrossRef]
  27. Shi, L.; Ma, Z.; Zhao, W.; Li, J.; Liu, F.; Guo, Y. Discrete element simulation parameter calibration and seed row test verification of flax flax. Trans. Chin. Soc. Agric. Eng. 2019, 35, 25–33. [Google Scholar]
  28. Shi, L.; Zhao, W.; Sun, W. Discrete element-based particle contact model and parameter calibration for agricultural soils in dry areas of Northwest China. J. Agric. Eng. 2017, 33, 181–187. [Google Scholar]
  29. Liu, C.; Wei, D.; Song, J.; Li, Y.; Du, X.; Zhang, F. Systematization of boundary parameters for discrete element simulation of granular fertilizer. J. Agric. Mach. 2018, 49, 82–89. [Google Scholar]
  30. Qiu, C.; Zhang, Q.; Yan, S.; Ji, Y. Clay bioadhesion experimental study. Rock Soil Mech. 2017, 42, 1267–1272. [Google Scholar]
  31. Ren, L.; Chen, D.; Chen, B. Overview of soil adhesion research. Trans. Chin. Soc. Agric. Eng. 1990, 01, 1–7. [Google Scholar]
  32. Xing, X.; Ma, X.; Chen, L.; Li, H.; Wen, Z.; Zeng, G. Physical characteristics of solid particle fertilizer experiment study. J. Agric. Mech. Res. 2020, 9, 125–130. [Google Scholar]
  33. Cui, T.; Liu, J.; Yang, L.; Zhang, D.; Zhang, R.; Wei, L. Experiment and simulation of rolling friction characteristics of maize seeds based on high-speed imaging. Trans. Chin. Soc. Agric. Eng. 2013, 29, 34–41. [Google Scholar]
  34. Wu, M.; Cong, J.; Yan, Q.; Zhu, T.; Peng, X.; Wang, Y. Calibration and experiment of discrete element simulation parameters of peanut seed particles. Trans. Chin. Soc. Agric. Eng. 2020, 36, 30–38. [Google Scholar]
  35. Liu, W.; He, J.; Li, H. Simulation Parameter calibration of miniature potato based on discrete element. Trans. Chin. Soc. Agric. Mach. 2018, 49, 125–135, 142. [Google Scholar]
  36. Li, Y.; Li, F.; Xue, M.; Chang, P.S.; Kun, P.M.; Jing, C.; Chang, D. Discrete element parameter calibration of wheat flour based on particle scaling. J. Agric. Eng. 2019, 35, 320–327. [Google Scholar]
  37. Han, Y.; Jia, F.; Tang, Y.; Liu, Y.; Zhang, Q. Effect of particle rolling friction coefficient on stacking characteristics. J. Phys. 2014, 63, 173–179. [Google Scholar]
Figure 1. Test materials (a,b).
Agronomy 13 00706 g001
Figure 2. Measurement of actual angle of repose (ae).
Agronomy 13 00706 g002
Figure 3. TMS-Pro texture analyzer.
Agronomy 13 00706 g003
Figure 4. Schematic diagram of inclined plate collision test.
Agronomy 13 00706 g004
Figure 5. Schematic diagram of measuring device for static friction coefficient of fertilizer-fertilizer.
Agronomy 13 00706 g005
Figure 6. Schematic diagram of measuring device for rolling friction coefficient of fertilizer-fertilizer.
Agronomy 13 00706 g006
Figure 7. Actual model and discrete element model of compound fertilizer particles (a,b).
Agronomy 13 00706 g007
Figure 8. Particle size distribution of compound fertilizer.
Agronomy 13 00706 g008
Figure 9. Comparison between simulation test and real test (a,b).
Agronomy 13 00706 g009
Table 1. Simulation parameters of discrete element.
MaterialsParametersNumerical Value
fertilizerDensity (kg/m3)1585
Poisson’s ratio0.24
Shear modulus (Pa)1.15 × 10⁷
steelDensity (kg/m3)7800
Poisson’s ratio0.3
Shear modulus (Pa)7 × 10¹⁰
fertilizer-fertilizerCollision recovery coefficient0.05–0.47
Static friction coefficient0.62–0.93
Rolling friction coefficient0.39–0.91
fertilizer-steelCollision recovery coefficient0.04–0.4
Static friction coefficient0.27–0.49
Rolling friction coefficient0.1–0.22
Table 2. Parameter levels of Plackett-Burman test.
ParametersLow LevelHigh Level
A (fertilizer-fertilizer collision recovery coefficient)0.050.47
B (fertilizer-fertilizer static friction coefficient)0.620.93
C (fertilizer-fertilizer rolling friction coefficient)0.390.91
D (fertilizer-steel collision recovery coefficient)0.040.4
E (fertilizer-steel static friction coefficient)0.270.49
F (fertilizer-steel rolling friction coefficient)0.10.22
Table 3. Protocol and results of Plackett-Burman test.
No.Test FactorsResting Angle (°)
ABCDEF
1−1111−1−114.9
2−1−1−1−1−1−116.12
31−1111−118.83
4−1−11−11114.09
511−1−1−1119.46
611−111125.25
7111−1−1−117.35
8−11−111−119.63
9−111−11115.56
101−1−1−11−121.61
11−1−1−11−1117.38
121−111−1116.55
Table 4. ANOVA of Plackett-Burman test results.
Source of VarianceMean Square andF-Valuep-Value
Models17.3620.770.0022
A38.0645.540.0011
B4.785.710.0623
C40.9649.020.0009
D5.816.950.0461
E14.5417.400.0087
F0.00190.00220.9641
Note: p-value < 0.05 indicates significant difference; p-value < 0.01 indicates highly significant difference, the same below.
Table 5. Scheme and results of steepest ascent test.
No.FactorsResting Angle (°)Relative Error (%)
ACE
10.050.350.2515.4322.67
20.150.450.3017.8210.67
30.250.550.3518.716.23
40.350.650.4019.064.48
50.450.750.4521.045.46
60.550.850.5022.2811.69
Table 6. Scheme and results of Box-Behnken test.
No.Test FactorsResting Angle (°)
ACE
110121.06
2−10−116.54
300019.36
401−119.39
500019.7
600019.43
711020.91
81−1018.78
90−1120.66
1000019.72
11−10119.75
1201122.78
130−1−117.8
14−11018.52
1500019.39
1610−117.9
17−1−1018.78
Table 7. ANOVA of Box-Behnken test quadratic model.
SourceSum of SquaresdfF-Valuep-Value
Model32.31945.06<0.0001
A3.2140.160.0004
C3.89148.840.0002
E19.911249.83<0.0001
AC1.43117.920.0039
AE0.000610.00780.9319
CE0.070210.88130.3791
A22.75134.560.0006
C21.21115.190.0059
E20.043210.54170.4857
Residual0.55787
Lack of Fit0.434834.710.0842
Pure Error0.1234
Cor Total32.8716
Table 8. ANOVA of modified model of Box-Behnken test.
SourceSum of SquaresdfF-Valuep-Value
Model32.2679.88<0.0001
A3.2147.64<0.0001
C3.89157.93<0.0001
E19.911296.33<0.0001
AC1.43121.260.001
A22.73140.57<0.0001
C21.24118.430.0016
Residual0.671810
Lack of Fit items0.548862.970.1554
Pure Error0.1234
Cor Total32.8716
Disclaimer/Publisher’s Note: The statements, opinions and data contained in all publications are solely those of the individual author(s) and contributor(s) and not of MDPI and/or the editor(s). MDPI and/or the editor(s) disclaim responsibility for any injury to people or property resulting from any ideas, methods, instructions or products referred to in the content.

