Article

Chlorophyll Fluorescence Imaging Combined with Active Oxygen Metabolism for Classification of Similar Diseases in Cucumber Plants

1
College of Food Science and Light Industry, Nanjing Technology University, Nanjing, 211816, China
2
College of Engineering, Nanjing Agricultural University, Nanjing 210095, China
*
Author to whom correspondence should be addressed.
Agronomy 2023, 13(3), 700; https://doi.org/10.3390/agronomy13030700
Submission received: 31 January 2023 / Revised: 21 February 2023 / Accepted: 23 February 2023 / Published: 27 February 2023

Abstract

:
It is a great challenge to identify different cucumber diseases at early stages based on conventional methods due to complex and similar symptoms. By contrast, chlorophyll fluorescence is an early indicator of membrane changes or disturbances during plant growth. This research aimed to propose an effective method for the identification of brown spot (BS) and anthracnose (AN) in cucumbers based on chlorophyll fluorescence imaging, and to interpret the relationship between fluorescence response and different diseases coupled with active oxygen metabolism analysis. Support vector machine (SVM) and eXtreme Gradient Boosting (XGBoost) were used to classify the different disease degrees of brown spot and anthracnose in cucumber plants. XGBoost is more effective for this study, with a classification accuracy greater than 90% for diseased cucumbers. Additionally, the XGBoost classification model was validated by the different disease degrees of cucumber plants, and the five-class classification accuracies were 88.2%, 85.0%, 75.0%, 65.0% and 75.0% for Healthy, BS-slight, BS-severe, AN-slight, and AN-severe, respectively. The diseased cucumbers had a higher level of reactive oxygen species (ROS) accumulation than the healthy cucumbers, and the activity levels of the ROS-scavenging enzymes of anthracnose were higher than those of brown spot. The analysis of fluorescence parameters and the discrimination model for different diseases were well linked to the active oxygen metabolism analysis. These results demonstrate the potential of chlorophyll fluorescence imaging combined with active oxygen metabolism analysis for the detection of cucumber diseases, regarding different disease types and disease degrees.

1. Introduction

Cucumber (Cucumis sativus Linn.) is widely cultivated around the world. However, cucumber diseases have occurred all over the world and mainly harm cucumber leaves, which has become one of the most important losses in cucumber production [1,2]. The timely detection and identification of plant diseases is essential to cure and control them. However, the types of disease symptoms are complex and similar, such as downy mildew, brown spot and anthracnose, and therefore the process of recognizing diseases is often time-consuming, laborious and subjective. What is more, in the early stages of plant diseases, it is difficult to observe and discriminate the disease with the naked eye, resulting in incorrect diagnosis and economic losses. Therefore, there is an urgent need for a timely and accurate method for identifying cucumber diseases.
With the development of computer vision and machine learning, several studies have developed various sensor systems for providing timely and accurate information on plant diseases, such as hyperspectral images [3], computer vision [4], spectroscopy [5], and thermography [6]. A number of research groups have demonstrated the potential of the pipelined procedures of image segmentation, feature extraction, and pattern recognition for recognition and diagnosis methods [7,8]. However, the accuracy of these methods greatly depends on the features of visible disease symptoms, including the extraction and selection of the visible disease features. In early infection, plants have slightly or not-sensitive changes in leaf appearance in the short term [9,10]. Moreover, some different diseases have similar symptoms, especially in the early stages of the disease, which can severely decrease the quality of the features and affect the results of recognition.
Chlorophyll fluorescence imaging is a well-established sensing technique that is mainly produced by chloroplasts in photosystem II (PS II), and chlorophyll fluorescence offers important information related to photosynthesis reaction processes and energy changes [11,12]. Plant disease damage can directly affect photosynthesis; therefore, different chlorophyll fluorescence parameters can diagnose the plant’s physiological states and environment stress in the early stages [13]. The chlorophyll fluorescence signals are exclusively from the observed plants, without noises from the background, which increases the accuracy of non-destructive detection, and the whole analysis process is mainly based around chlorophyll fluorescence. This technique has been successfully used in evaluating various plant defects. Atta et al. [14] applied fluorescence spectroscopy combined with chemometrics to detect stripe rust in wheat, and the results showed that the fluorescence emission and SFS spectral signatures could be utilized as fingerprints for early disease detection. Jushkov et al. [15] used chlorophyll fluorescence for visualization in apple and apricot breeding, which is a sensitive indicator for detecting the degree of drought-induced depression. Zhou et al. [16] utilized chlorophyll fluorescence imaging and kinetic parameters to monitor cucumber Fusarium wilt disease and achieved the rapid and early detection of Fusarium infection. Cen et al. [17] explored the use of chlorophyll fluorescence imaging combined with feature selection to characterize and detect the citrus Huanglongbing disease, and they acquired the best classification performance with an accuracy of 97%. Despite the progress in applying chlorophyll fluorescence parameters to diagnose plant diseases, little information is available on the classification of similar diseases in cucumber plants. On the other hand, active oxygen metabolism has a key role in the responses of plant–pathogen interactions [18,19]. Normally, plants maintain a balance between reactive oxygen species (ROS) generation and elimination to maintain ROS concentrations at low levels [20,21]. However, this balance can be disrupted under disease stress and ROS may accumulate rapidly to induce defense reactions, further leading to changes in PS II [22,23]. In general, photosynthetic systems can absorb a large amount of light energy and convert it into chemical energy, but at the molecular level, excessive photon energy can be destructive, especially under stress. When there are excess photons, some harmful metabolites will be produced, such as superoxide, which in turn damages the photosynthetic system. It would be interesting to interpret the difference in chlorophyll fluorescence parameters between the two diseases that are responsible for active oxygen metabolism.
Therefore, we propose to investigate the potential of the chlorophyll fluorescence imaging system coupled with active oxygen metabolism for classifying two similar diseases of cucumber plant. The aim of this research was: (1) measure the changes in chlorophyll fluorescence parameters and the ROS production-scavenging system during the infection of cucumber leaves; (2) understand the relationship between changes in antioxidant enzymatic activity, chlorophyll fluorescence parameters, and different disease stresses; (3) establish a classification model for the brown spot and anthracnose of cucumber by chlorophyll fluorescence parameters; and (4) validate the ability of chlorophyll fluorescence parameters for the early discrimination of two diseases.

2. Materials and Methods

2.1. Plant Materials and Growth Conditions

The tested cucumber was “83-16 mini-cucumber” (Shouguang Hongwei Seed Co. Ltd., Shangdong, China). It is suitable for spring, autumn extension or wintering cultivation. The work was carried out two times at Nanjing Agricultural University in early October 2018 and early April 2019 in an artificial climate incubator (SPX-235, Saifu Co. Ltd., Ningbo, China). A total of 135 datapoints of cucumber plants were collected from both experiments, and the data were used together in the processing and analysis of this paper. The seeds were first soaked and transplanted into a plastic case at 28 °C. Secondly, the germinant seeds were transplanted into a plastic box (30 × 40 cm) at 28 °C. Finally, when seedlings grew to two leaves and one heart, plants with basically the same growth were selected and transplanted into an 18 cm diameter flowerpot one by one. The flowerpots were placed into the artificial climate chamber for appropriate temperature cultivation, with an average day/night temperature of 28 °C/18 °C and relative humidity of 80%. The cucumber plants were used for diseased treatment after they grew three–five expanded euphylla leaflets (about five weeks after transplanting).

2.2. Pathogen Preparation and Plant Inoculation

Brown spot and anthracnose of cucumber are caused by Corynespora cassiicola (C. cassiicola) and Colletotrichum orbiculare (C. orbiculare), respectively. The strains of C. cassiicola and C. orbiculare were purchased from the Agricultural Culture Collection of China. Strains were cultured on potato dextrose agar (PDA) plates at 28 °C and 85% relative humidity for five days, respectively. Spores were suspended in sterile distilled water and the surface of the medium was gently washed with a sterile pipette. After the spore suspension had been filtered through four layers of sterile medical tissue, the final spore concentration was determined via a hemocytometer and adjusted to 4 × 10⁶ CFU/mL for C. cassiicola and C. orbiculare, respectively.
The inoculation of C. cassiicola and C. orbiculare was carried out following the method described by Liu, Zhang, Huang, and Jones [24]. The 50 cucumber plants were inoculated with about 1 mL of the spore suspension of C. cassiicola: the two larger leaves of each plant were artificially inoculated with about 100 μL of the spore suspension using a syringe with a stainless-steel needle, and the remaining 900 μL was spray inoculated onto the two leaves. A similar operation was performed for C. orbiculare for another 50 cucumber plants. The remaining 35 plants were inoculated with sterilized water as a control group. Thereafter, plants were placed in an artificial climate incubator with a conducive, high-humidity environment that would maximize infection. The 30 randomly selected plants (10 inoculated with C. cassiicola, 10 inoculated with C. orbiculare, and 10 from the control group) were used for the determination of active oxygen metabolism, and the diseased leaves were sampled every 24 h. They were cut, quick frozen with liquid nitrogen and then stored at –80℃ for active oxygen metabolism. The remaining 105 plants (40 inoculated with C. cassiicola, 40 inoculated with C. orbiculare, and 25 from the control group) were collected for fluorescent imaging. Before being inoculated with sterilized water, the control groups were first imaged. After infection, the 105 plants were imaged three times at 24 h intervals for the chlorophyll fluorescence system, to obtain plants at the different stages of the disease. Therefore, a total of 340 sets of chlorophyll fluorescence images of cucumber plants were obtained, including 120 for the C. cassiicola group (3 × 40 plants), 120 for the C. orbiculare group (3 × 40 plants), and 100 for the control group (4 × 25 plants).

2.3. Chlorophyll Fluorescence Imaging System and Data Acquisition

A chlorophyll fluorescence imaging system was developed by the Facility of Agriculture Intelligent Laboratory at Nanjing Agricultural University. The principle of chlorophyll fluorescence detection is based on transition energy. The captured original fluorescent image can be used to calculate the fluorescence parameters and can also be stored, processed, and displayed as a fluorescence parameter image.
The system consisted of a high-performance Charge Coupled Device camera (Infinity3-1URC, Lumenera, Ottawa, ON, Canada), a custom LED light source (Jinshi optoelectronic technology Co. LTD, Dongguan, China), a programmable DC power supply (eTM-L305SP, Tomments technology Co., Guangzhou, China), and a computer (KH770-I7-4500U, Control Technology Co. Ltd., Shengzhen, China). The excitation light source used in this system was blue LED light source with a center wavelength of 460 nm. Eight LED lights were illuminated in four directions, and the size of each LED board was 100 mm × 100 mm, with a maximum power of 5W and a rated voltage of 25 V. The camera had a resolution of 1280 × 720 and supported 30 frames/second videorecording, with a 515 nm long-pass filter (New Force Photoelectric Technology Co. Ltd., Hangzhou, China) that could filter the excitation light and collect the fluorescence excited by chlorophyll. A 55 mm polarizing plate (MC-CPL-55 mm, NiSi Co. Ltd., Zhuhai, China) wass used to remove and filter out the direct light in the beam.
To generate a modulated chlorophyll fluorescence induction curve, three excitation lights are required: measuring light, actinic light, and saturated light. The original fluorescence data Fo (the minimum fluorescence in the dark-adapted state) and Fm (the maximum fluorescence in the dark-adapted state) of the plants under dark adaptation are required. Then, the plant is put under actinic light to obtain F (the steady state level of fluorescence) and Fm’ (the maximum fluorescence in the light-adapted state) is measured. This process is cycled five times until the plant reaches a stable physiological state. The average F and Fm’ obtained at this time are finally required, indicating stable fluorescence under light adaptation and maximum fluorescence under light adaptation. Therefore, the fluorescence parameters Fo, F, Fm, Fm’, ΔF, Fv, Fv/Fm, Y (II), Y (NPQ), qN, and qP in leaves can be analyzed. The definition of chlorophyll fluorescence parameters and their calculation methods were described by Bussotti, et al. [25].
A total of 105 plants (40 inoculated with C. cassiicola, 40 inoculated with C. orbiculare, and 25 from the control group) were used for imaging, as described in Section 2.2. The samples were first placed in the shading box 15 min prior to each measurement, to provide dark adaptation. Then, each plant was scanned using the fluorescence system, and a total of 12 fluorescence images of Fo, Fm, F (*5), Fm’(*5) were obtained for each sample.

2.4. Determination of Nitrogen, Chlorophyll, MDA and H2O2 Content and Enzyme Activity in Cucumber Leaves

In order to gain a fundamental understanding of chlorophyll fluorescence changes in response to the antioxidant enzymatic activity from different diseases, the ROS production-scavenging system and leaf nutrition were analyzed after image acquisition (Figure 1).
After imaging, the 105 cucumber plants were immediately measured for nitrogen and chlorophyll content at the tip of each leaf of the plant by the portable chlorophyll meter (SPAD-502, Minolta, Japan) and portable plant nutrition tester (TYS-4N, Tuopuyun, Beijing, China). The mean of three readings from the portable chlorophyll meter and portable plant nutrition tester were obtained for each leaf disc of 170 mm2, and the average value of the top two blades was used as the final chlorophyll/nitrogen content for each cucumber plant.
A total of 30 plants (10 inoculated with C. cassiicola, 10 inoculated with C. orbiculare, and 10 from the control group) were used for the determination for active oxygen metabolism, as described in Section 2.2. The infected leaves from each group were cut and quick frozen with liquid nitrogen, and then stored at –80 °C for each sampling point. Two grams of frozen tissues was homogenized with 7.0 mL of phosphate buffered saline and centrifuged at 12,000× g at 4 °C for 10 min. The malondialdehyde (MDA) and hydrogen peroxide (H2O2) content were measured according to the method of thiobarbituric acid and molybdic acid spectrophotometry. The determination of MDA and H2O2 was performed by the assay kit (Jiancheng Bioengineering Institute, Nanjing, China). The determination of four main antioxidative enzymes, including ascorbate peroxidase (APX), catalase (CAT), peroxidase (POD), and superoxide dismutase (SOD), was performed by the assay kit (Jiancheng Bioengineering Institute, Nanjing, China). A total of 2 g of sample was homogenized with 7 mL of phosphate buffered saline for the extraction of crude enzyme solution. The next steps were performed according to the instructions of the assay kits.

2.5. Data Processing and Analyzing

A total of 12 images for each sample related to the fluorescence quenching process were obtained from kinetic chlorophyll fluorescence imaging, which provides detailed information of cucumber dynamics of PSII activities about plant growth status. The fluorescence parameters, Fv/Fm, Y (II), Y (NPQ), Y (NO), qN, and qP in leaves, important parameters associated with plant physiological states, could be easily analyzed. Analysis of variance (ANOVA) and least significant difference (LSD) tests (p < 0.05) were performed on the nutrient content at four time points during the disease, using SPSS15.0 statistics software (SPSS Inc. Chicago, IL, USA). p < 0.05 was considered significant in all analyses. In order to facilitate the observation of the distribution and change of diseased areas, the grayscale image of one-dimensional fluorescence value was mapped to the three-dimensional RGB value using a false color system, to display the cucumber plant in the form of a color image. Then, all the grayscale images were normalized based on the original image, the new value range was [0, 1], and the color transition was divided into different gradients [21].
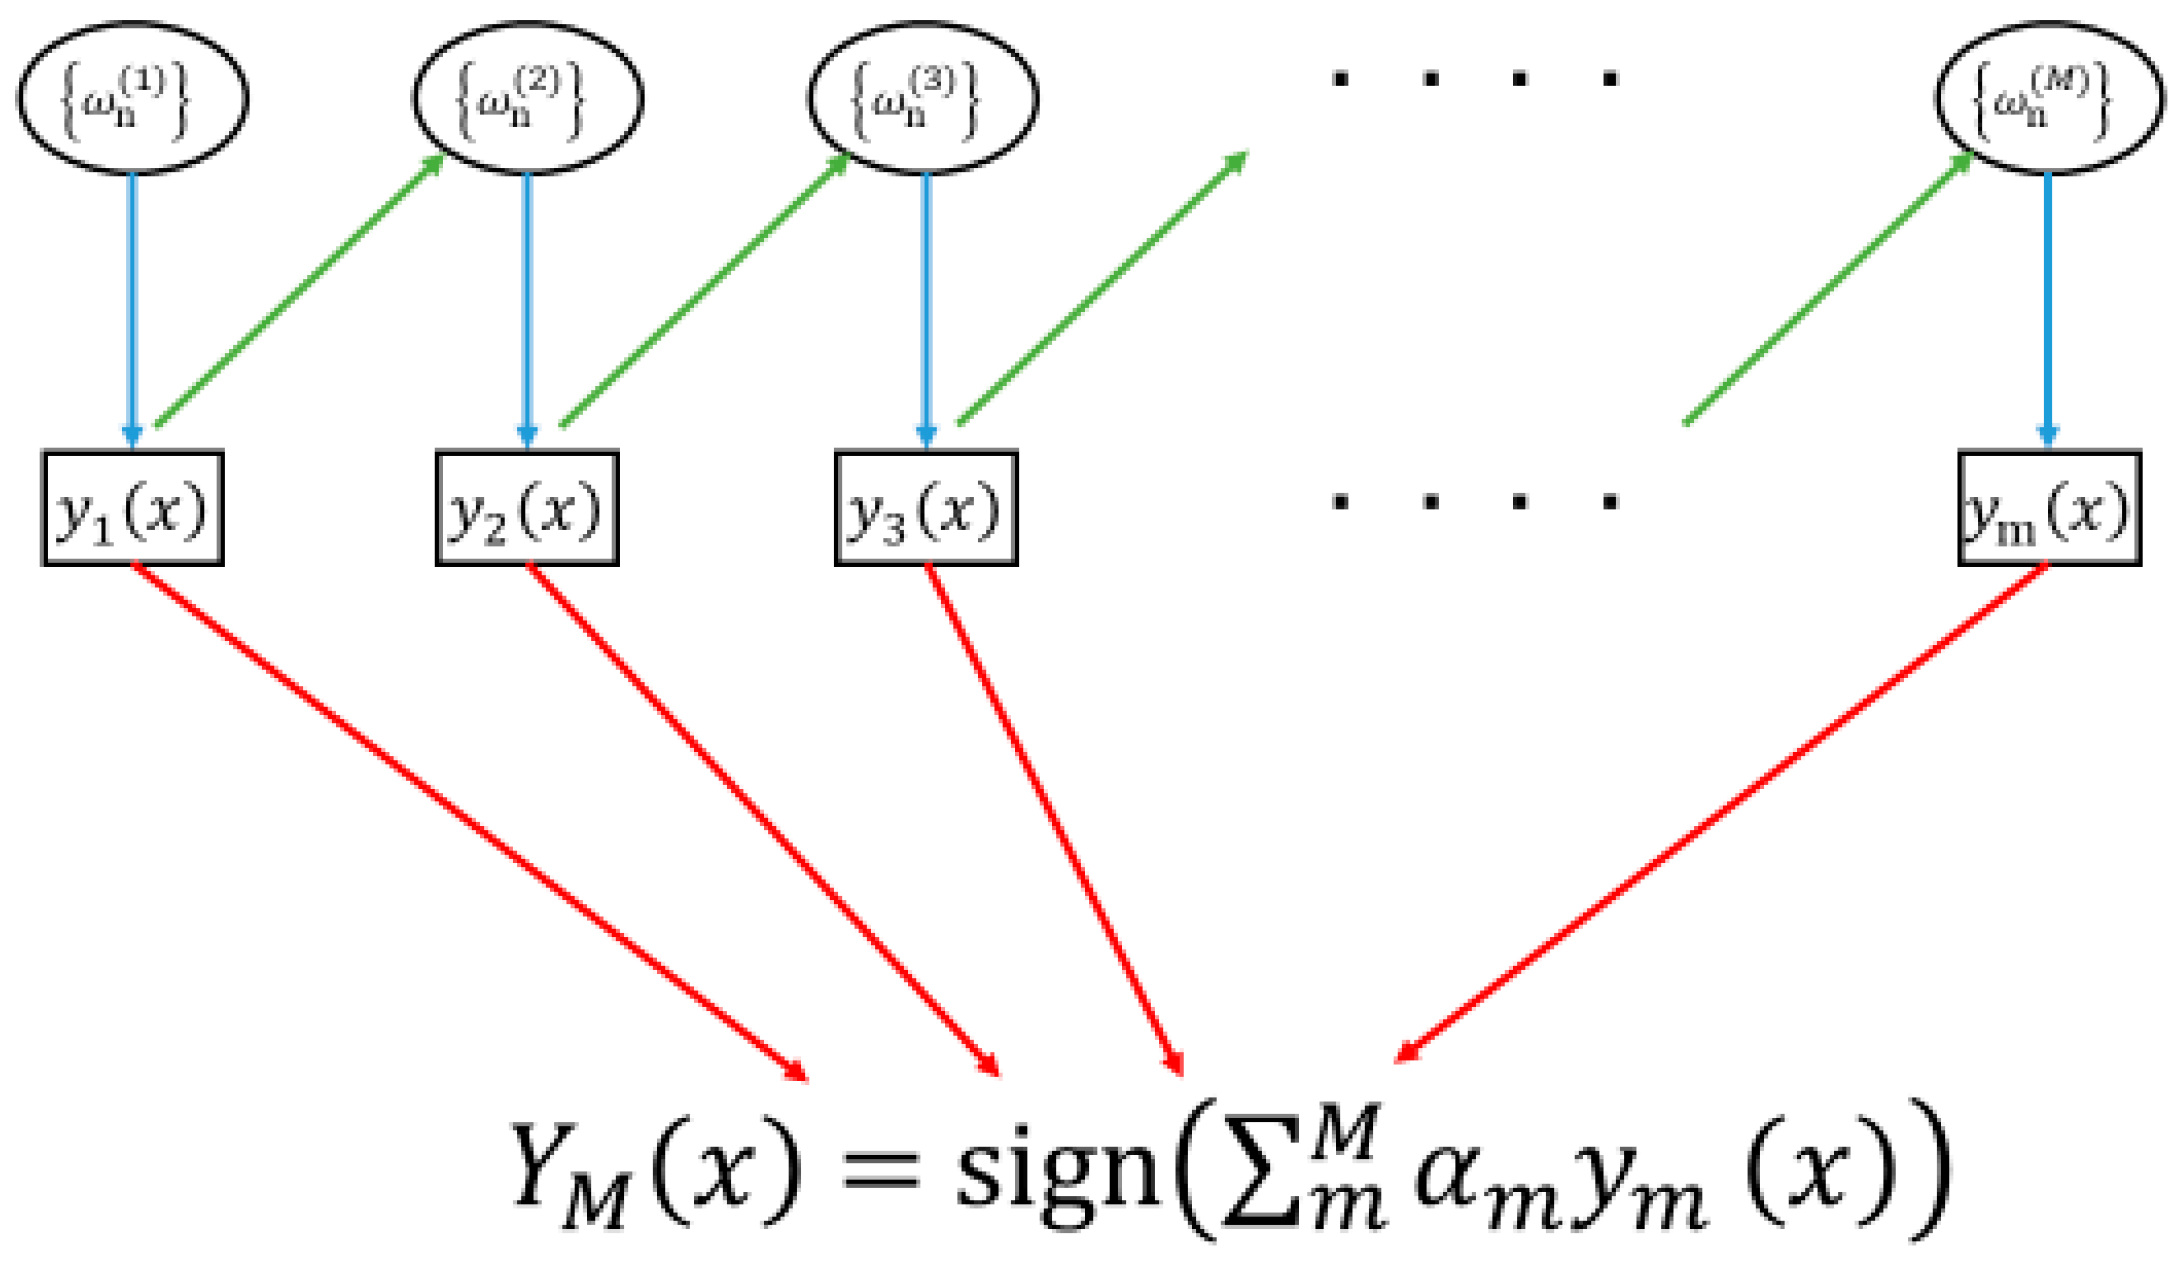
To distinguish the diseased cucumber plants, this experiment selected the support vector machine (SVM) and eXtreme Gradient Boosting (XGBoost) for building the discrimination models by Matlab 2017 (The MathWorks, Inc., Natick, MA, USA). The SVM algorithm is a supervised learning algorithm widely used in statistical classification and regression analysis. This experiment uses linear kernel as the kernel function of the support vector machine. The XGBoost algorithm is also a supervised learning algorithm that integrates multiple weak classifiers into one, forming a strong classifier algorithm, and determines the weight of each classifier by calculating the residuals of the classifier [26]. At the same time, the regularization term was added to prevent data over-fitting, and the second-order Taylor expansion of the cost function was performed when calculating the residual. The obtained result is more accurate [23,24], and the framework is illustrated in Figure 2. A total of 340 sets of images were used for the discrimination model: 100 for healthy plants, 120 for brown spot, and the other 120 for anthracnose. Two-thirds of the data were used as a calibration set, and the rest of data were used for testing.

3. Results and Discussion

3.1. Effects of Fungal Infection on Chlorophyll, Nitrogen, H2O2 and MDA Content in Cucumber Leaves

The descriptive statistics, comprising the mean and standard deviation of the leaf chlorophyll content and the nitrogen content, are summarized in Table 1. The chlorophyll and nitrogen content of the disease groups gradually decreased due to the destruction of the tissue structure by the pathogen, while the chlorophyll content and nitrogen content of the control group remained stable. At the same time, the standard deviations of nitrogen and chlorophyll content in the disease groups were larger than those in the control group, indicating that the degree of influence of different plants on pathogenic bacteria was also different. The chlorophyll and nitrogen content of diseased groups on the second/third day after inoculation showed significant differences from those of day 0, while the control group had no significant differences during the monitoring period. It can be explained that the brown spot and anthracnose have a serious impact on the growth of cucumber plants, which in turn affects the nutritional parameters. Comparing the two disease groups, the nitrogen and chlorophyll content of leaves in the two groups was not obviously different before the inoculation of fungi. After inoculation, the nitrogen and chlorophyll content of leaves in the brown spot group decreased relatively more quickly than in the anthracnose group. Therefore, brown spot and anthracnose had different effects on plant nutritional parameters, which also provided a theoretical basis for distinguishing the two diseases in the subsequent experiments.
To investigate the role of ROS in the cell membrane damage of different diseases in cucumber, the H2O2 and MDA content in the cucumber leaves of brown spot and anthracnose groups was measured. It has been demonstrated that ROS plays a vital role in the loss of disease resistance and in the disease development of plants [21,27]. In plants with normal cells, a balance is reached between the generation and removal of ROS, resulting in low levels of reactive oxygen species in plant tissues. However, once the defense system is infected by a pathogen, H2O2, O2, and OH are rapidly accumulated, and the overproduction of ROS could accelerate membrane lipid peroxidation, which could produce MDA and other peroxidative substances, thereby further damaging the integrity of the cell membrane. As shown in Figure 3, H2O2 and MDA content declined after inoculation, which was the response of the plant defense system to the early invasion of C. cassiicola and C. orbiculare. However, as the fungi further multiplied and invaded, excessive ROS production increased on the second day after inoculation. Overall, a lower amount of MDA and H2O2 formation was observed in the anthracnose group compared to the brown spot group at most time points investigated. In addition, during the entire detection, compared to anthracnose group, there was a greater rate of decline in chlorophyll and nitrogen content (Table 1), a higher H2O2 generating rate, and higher MDA content (Figure 3) in the brown spot group. These findings suggest that brown spot accelerated the loss of the disease resistance of cucumber plants more than anthracnose, and the developments of leaf nutrition were related to ROS generation and the peroxidation of cellular membrane lipids.

3.2. Effects of Fungal Infection on Activity of Antioxidative Enzymes in Cucumber Leaves

SOD, APX, CAT and POD are important ROS-scavenging enzymes that could protect plant cells from excessive ROS stress [28,29]. When ROS increased, chain reactions started in which SOD catalyzed the dismutation of superoxide radicals to O2 and H2O2, and H2O2 was then detoxified by CAT, POD and APX: CAT reduced H2O2 into water and oxygen; POD catalyzed the reaction of H2O2 to oxidize phenols to produce quinones; and APX prevented ROS accumulation by the ascorbate–glutathione cycle [27,30]. Therefore, ROS-scavenging enzymes could keep low levels of ROS to protect the membrane from peroxidation. In this study, the activities of SOD, APX, CAT and POD in the anthracnose group increased rapidly and reached peak value during the first day after inoculation (Figure 4), and the enzyme activities reached peak value on the second day after the inoculation of C. cassiicola. Many researchers have reported that pathogen early invasion could induce the increased activities of SOD, APX, CAT and POD, and the reduced accumulation of ROS in the early period resulted from an oxidative burst [27,29]. Subsequently, the reduced activities of SOD, APX, CAT and POD might break the equilibrium of the generation and removal of ROS, further resulting in an elevated H2O2 generation rate and increased MDA content, eventually leading to further membrane lipid peroxidation and membrane destruction. It can be seen that the enzyme activities at the peak values of the anthracnose group were higher than those of the brown spot group, indicating that the cucumber had a weaker resistance to brown spot. The results were consistent with the sharp decreases in nitrogen and chlorophyll content (shown in Table 1), which were accompanied by a rapid increase of H2O2 generating rate and increased MDA content (shown in Figure 3) for the anthracnose group.

3.3. Effects of Fungal Infection in Chlorophyll Fluorescence Imagines of Diseased Cucumber Plants

Table 2 shows the effects of different infection stages of two diseases on the maximal photochemical efficiency (Fv/Fm), quantum yield of PS II (Y(II)), photochemical quenching coefficient (qP), non-photochemical quenching coefficient (qN), and non-photochemical quenching coefficient (Y(NPQ)). Fv/Fm is the maximum photochemical quantum efficiency of PSII, which reflects potential maximum photosynthetic capacity. Under normal physiological conditions, most Fv/Fm values of C3 plants and green algae are between 0.8 and 0.84; when plants are under stress, the values of Fv/Fm will be significantly reduced. The values of Fv/Fm of the diseased cucumbers showed an overall downward trend during the infection, but the difference between infection times was not significant and the Fv/Fm parameter of the brown spot group decreased slightly compared to that of the anthracnose group. However, Y(NPQ) showed an exactly opposite trend to Fv/Fm. Y(NPQ) indicates the ratio of the energy absorbed by the Photosystem II to the amount of heat dissipated, that is, the energy used for the heat increase, leading to a reduction in the ratio for the photochemical reaction. In addition, Y(II) and qP had a consistent trend of first decreasing and then increasing, while qN showed a trend of first increasing and then decreasing.
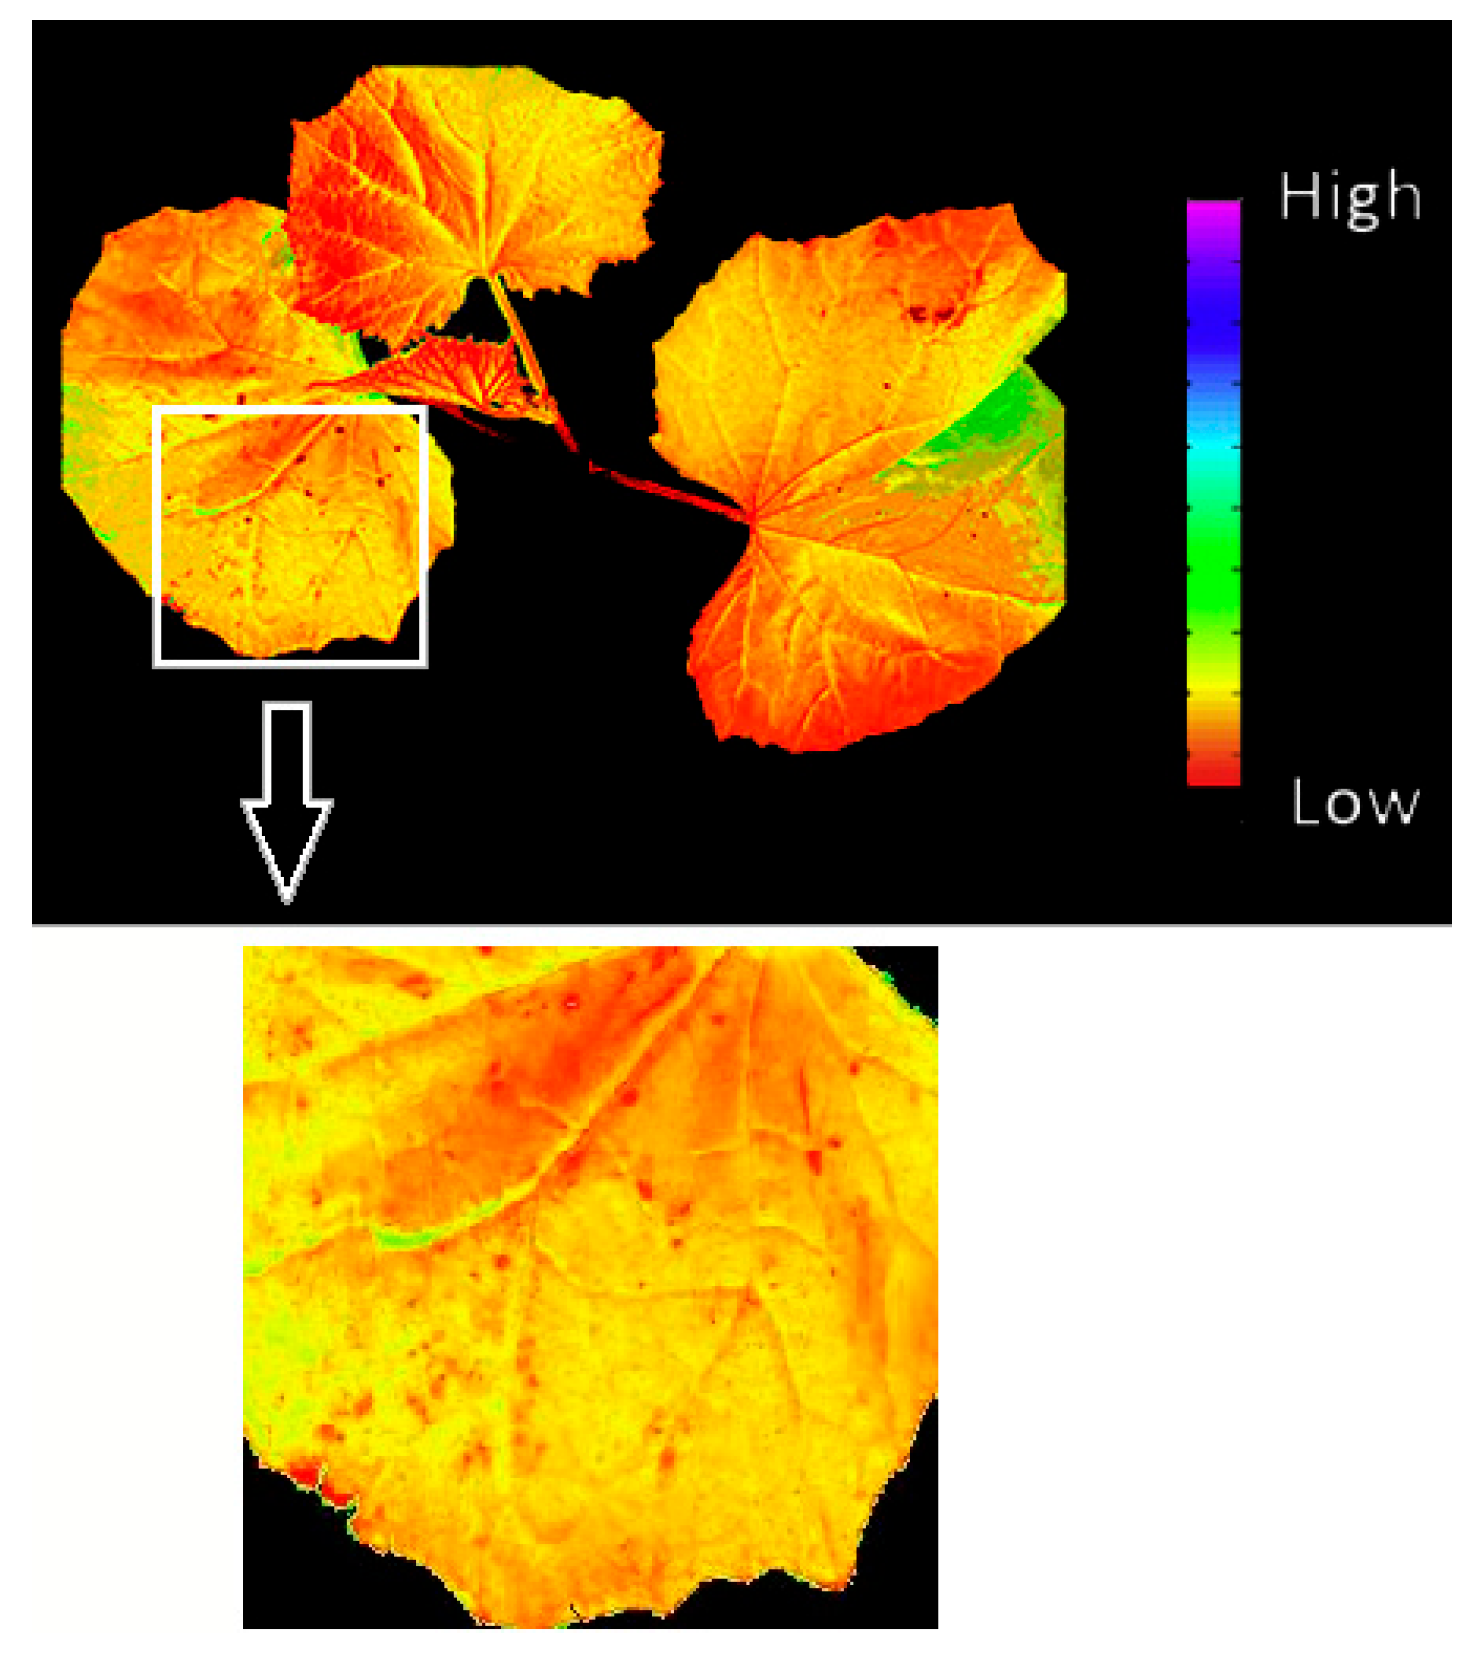
Although Table 2 shows the average values of chlorophyll fluorescence parameters for the whole plant, the valid information is limited. During the growth of cucumber, the cotyledons were gradually senescent with the new leaves were growing, resulting in a large difference in fluorescence parameters between the leaves. Therefore, it is unreasonable using the average value to indicate the changes in the fluorescence parameters of the whole plant. The spatial heterogeneity of the fluorescence parameters image was analyzed in this part, the grayscale image was colored by the false color system program for visual observation, and the fluorescence parameter map of the cucumber was visually represented by different colors. Y (II) was selected as a representative of the fluorescence parameters to show the photosynthesis ability of a cucumber with C. cassiicola infection at 48h (Figure 5). The color of the old leaves was more yellow than the new ones, which means the value of Y (II) was higher in the old leaves. The sprouted new leaves were showing dark red, which indicated that the photosynthesis ability of new leaf was weak. The same results were reported by Ghosh, Barman, Khatun, and Mandal [31], who found that the low photosynthetic efficiency of leaves is due to the immaturity of the leaf. In addition, the diseased area has obvious differences in the fluorescence parameter map. It can be seen, in the enlarged part in Figure 5, that there is a distinct red spot in the diseased area that is significantly different from the surrounding area. The green plaque on the right side of the diseased plant is due to data errors caused by leaf folding. The results were similar to the research conducted by Dong et al. [32], who used chlorophyll fluorescence parameters for analyzing the effects of chilling injury, in which Y (II) showed good spatial heterogeneity during low temperature stress on tomato leaves.
According to the analysis of the spatial heterogeneity of fluorescence images in this study, the false color images clearly indicated the distribution of photosynthetic efficiency and the diseased area. However, the image methods have weak effects on distinguishing different diseases.

3.4. Discriminant Results for Different Diseases in Cucumber Plants based on Multiple Chlorophyll Fluorescence Parameters

Cucumber brown spot and anthracnose plants were classified by SVM and XGBoost classification models via 12 fluorescence intensities (Fo, Fm, F (*5), Fm’ (*5)) and 7 fluorescence parameters (Fv, ΔF, Fv/Fm, Y (II), Y (NPQ), qP, qN).
For the two-class classification, the samples were considered as either healthy or diseased plants, as shown in Table 3. The SVM model achieves overall classification accuracies of 91.9% and 89.2% for brown spot and anthracnose, respectively. The misclassification rates of healthy cucumbers of the SVM models for the two diseases were both 8.8%, and the misclassification rate for the anthracnose was slightly higher than that of the brown spot. Table 3 (B) shows the results of the two-class classification of two diseases based on the XGBoost algorithm, respectively. The classification accuracy of the model between brown spot and healthy cucumbers was 94.6%, and the classification accuracy between anthracnose and healthy cucumbers was 89.2%. In the classification of brown spot, the misclassification rates for the healthy and brown spot cucumbers were 8.8% and 2.5%, respectively. For the classification of anthracnose, the misclassification rates of healthy and anthracnose cucumbers were 11.8% and 10.0%, respectively. The above results are similar to the SVM classification results. Both algorithms achieved satisfactory results. In addition, the classification results were consistent with the active oxygen metabolism analysis: the cucumber had a weaker resistance to brown spot than anthracnose, and therefore for the same infection time, the brown spot group had more obvious disease symptoms, leading to a slightly higher misclassification rate for the anthracnose than the brown spot.
Table 4 further shows the results of the three-class classification; the samples were considered as healthy, brown spot and anthracnose cucumbers using the SVM and XGBoost algorithm. The overall classification accuracy rate was 85.1% for SVM (Table 4 (A)). Compared with Table 3 (A), the misclassification rates of the healthy and the anthracnose cucumbers were significantly increased, at 23.6% and 17.5%, respectively. The classification accuracy of brown spot still reached 95%. The fluorescence parameter Fv⁄Fm of cucumber plants with brown spot (mentioned above (Table 2)) obviously changed more than that of anthracnose cucumbers, which explained that the effect of brown spot on cucumbers is greater than that of anthracnose. These changes are often difficult to observe directly using the naked eye. Therefore, the use of chlorophyll fluorescence parameters has high research value for judging the types of cucumber plant diseases. Table 4 (B) shows the classification results of different cucumber diseases based on the XGBoost algorithm. The misclassification rates of the healthy and anthracnose were significantly improved compared to those detailed in Table 3 (B), while the classification accuracy of brown spot was still 97.5%. The accuracy of these classifications was slightly improved compared with the SVM model, and the overall classification accuracy rate was also improved from 85.1% to 88.6%, indicating that the XGBoost algorithm was more effective in this research. Ma et al. [33] achieved similar results when using a discriminant analysis model based on computer vision to classify the downy mildew and powdery mildew of cucumbers. Their convolutional neural networks model produced a testing set accuracy of 95.7%, which was higher than the classification of this research. However, the two cucumber diseases of their research had significant appearance differences, which are easy to classify.

3.5. Discriminant Results for Early Diseased Cucumbers Based on Multiple Chlorophyll Fluorescence Parameters

Figure 6 shows the RGB images of different degrees of two cucumbers diseases. It can be seen that there was no significant change in the early diseased leaves. Usually, there were no obvious symptoms on the leaves 24 h after inoculation; diseased spots appeared on some leaves 48 h after inoculation; and 72 h after inoculation, obvious diseased spots appeared. Therefore, this research defined the sample at 0 and 24 h after inoculation without significant changes as early disease (30 × 2 samples), and the samples at 48 and 72 h after inoculation were defined as severe diseased samples (30 × 2 samples). The slight and severe diseased cucumber leaves are shown in Figure 6.
Table 5 shows the classification results of the diseased cucumbers in the slight and severe stages of infection. The overall classification accuracy of healthy, slight and severe diseased cucumbers with brown spot were 82.4% and 87.8% for SVM and XGBoost. The discriminant model based on the XGBoost was greater than the recognition accuracies obtained by SVM in the identification of two cucumber diseases. The more-detailed classification model was validated by different disease severity for five-class classification (healthy, slight and severe diseased stages of brown spot, and anthracnose, respectively) based on SVM and XGBoost (Table 6). It can be seen that there is a significant decrease in classification accuracy for five-class classification, with overall accuracies of 74.6% and 78.9% for SVM and XGBoost, respectively. Further analysis showed that misclassification is mainly concentrated in the slight and severe stages of the same disease, there is no misjudgment between different diseases for SVM, and the distinguishing effect for the two diseases was good. This can be explained by the fact that due to individual differences, there is no strict standard between slight and severe diseases. We propose the concept of slight and severe stages mainly to show that in the early stage, the two diseases still have a good distinction based on the multiple chlorophyll fluorescence parameters.

4. Conclusions

This study demonstrated the feasibility of a chlorophyll fluorescence imaging system for the identification of different cucumber diseases and analyzed the difference responses to two diseases by active oxygen metabolism. This method can also be extended to other plants, providing technology for plant disease detection. The brown spot and anthracnose diseases of cucumber plants were collected to obtain the fluorescence parameters, ROS generation, and elimination metabolism during the infection. The values of Fv/Fm of the diseased cucumbers showed an overall downward trend during the infection, and the Fv/Fm of the brown spot group decreased slightly compared to the anthracnose group. The accumulation of ROS tends to decrease first and then increase during the infection, and the activity levels of the ROS-scavenging enzymes (SOD, APX, CAT and POD) of the anthracnose group were higher than those of the brown spot group, which indicated that the cucumber had a weaker resistance to brown spot than anthracnose. The SVM and XGBoost were used to classify brown spot and anthracnose of different degrees in cucumber plants. The three-class classification models for the healthy, brown spot, and anthracnose cucumber plants achieved 82.4%, 97.5% and 85.0% accuracy using the XGBoost classifier. For early disease identification, the discrimination accuracy for brown spot was higher than the discrimination accuracy for anthracnose, which was consistent with the active oxygen metabolism analysis. However, these results are insufficient to assess the performance of the chlorophyll fluorescence imaging system in practical applications. In contrast to the single disease, co-infection in cucumber plants is more common in practice. Further research will increase the number of cucumber diseases and inoculate multiple diseases. In addition, the corresponding relationship between plant physiology and chlorophyll fluorescence response will be further explored to provide a more reliable mechanism for chlorophyll fluorescence detection technology.

Author Contributions

Conceptualization, Y.S.; methodology, Y.S.; software, Y.S.; validation, Y.S.; formal analysis, Y.S.; investigation, Y.S.; data curation, Y.S.; writing—original draft preparation, Y.S.; writing—review and editing, T.L.; visualization, Y.S.; supervision, Y.H.; project administration, X.W.; funding acquisition, X.W. All authors have read and agreed to the published version of the manuscript.

Funding

This research was funded by The National Key R&D Program of China 2019YFD1001900, and National Key Research and Development Plan Project, grant number 2019YFE0125200.

Data Availability Statement

The data presented in this study are available on request from the corresponding author.

Conflicts of Interest

The authors declare no conflict of interest.

References

  1. Ma, T.; Yang, C.; Cai, F.; Cui, L.; Wang, Y. Optimizing fermentation of Bacillus amyloliquefaciens 3–5 and determining disease suppression and growth in cucumber (Cucumis sativus). Biol. Control 2022, 176, 105070. [Google Scholar] [CrossRef]
  2. Zhang, S.; Zhang, S.; Zhang, C.; Wang, X.; Shi, Y. Cucumber leaf disease identification with global pooling dilated convolutional neural network. Comput. Electron. Agric. 2019, 162, 422–430. [Google Scholar] [CrossRef]
  3. Zhao, X.; Zhang, J.; Huang, Y.; Tian, Y.; Yuan, L. Detection and discrimination of disease and insect stress of tea plants using hyperspectral imaging combined with wavelet analysis. Comput. Electron. Agric. 2022, 193, 106717. [Google Scholar] [CrossRef]
  4. Chouhan, S.S.; Singh, U.P.; Sharma, U.; Jain, S. Leaf disease segmentation and classification of Jatropha curcas L. and Pongamia PINNATA L. biofuel plants using computer vision based approaches. Measurement 2021, 171, 108796. [Google Scholar] [CrossRef]
  5. Ghanei Ghooshkhaneh, N.; Golzarian, M.R.; Mollazade, K. VIS-NIR spectroscopy for detection of citrus core rot caused by Alternaria alternata. Food Control 2023, 144, 109320. [Google Scholar] [CrossRef]
  6. Mastrodimos, N.; Lentzou, D.; Templalexis, C.; Tsitsigiannis, D.I.; Xanthopoulos, G. Development of thermography methodology for early diagnosis of fungal infection in table grapes: The case of Aspergillus carbonarius. Comput. Electron. Agric. 2019, 165, 104972. [Google Scholar] [CrossRef]
  7. Thakur, P.S.; Khanna, P.; Sheorey, T.; Ojha, A. Trends in vision-based machine learning techniques for plant disease identification: A systematic review. Expert Syst. Appl. 2022, 208, 118117. [Google Scholar] [CrossRef]
  8. Singh, V.; Sharma, N.; Singh, S. A review of imaging techniques for plant disease detection. Artif. Intell. Agric. 2020, 4, 229–242. [Google Scholar] [CrossRef]
  9. Feng, W.; He, L.; Zhang, H.; Guo, B.; Zhu, Y.; Wang, C.; Guo, T. Assessment of plant nitrogen status using chlorophyll fluorescence parameters of the upper leaves in winter wheat. Eur. J. Agron. 2015, 64, 78–87. [Google Scholar] [CrossRef]
  10. Zhou, C.; Le, J.; Hua, D.; He, T.; Mao, J. Imaging analysis of chlorophyll fluorescence induction for monitoring plant water and nitrogen treatments. Measurement 2019, 136, 478–486. [Google Scholar] [CrossRef]
  11. Ashrostaghi, T.; Aliniaeifard, S.; Shomali, A.; Azizinia, S.; Abbasi Koohpalekani, J.; Moosavi-Nezhad, M.; Gruda, N.S. Light intensity: The role player in cucumber response to cold stress. Agronomy 2022, 12, 201. [Google Scholar] [CrossRef]
  12. Schlie, T.; Dierend, W.; Köpcke, D.; Rath, T. Detecting low-oxygen stress of stored apples using chlorophyll fluorescence imaging and histogram division. Postharvest Biol. Technol. 2022, 189, 111901. [Google Scholar] [CrossRef]
  13. Chiu, Y.; Hsu, W.; Chang, Y. Detecting cabbage seedling diseases by using chlorophyll fluorescence. Eng. Agric. Environ. Food 2015, 8, 95–100. [Google Scholar] [CrossRef]
  14. Atta, B.M.; Saleem, M.; Ali, H.; Bilal, M.; Fayyaz, M. Application of fluorescence spectroscopy in wheat crop: Early disease detection and associated molecular changes. J. Fluoresc. 2020, 30, 801–810. [Google Scholar] [CrossRef] [PubMed]
  15. Jushkov, A.N.; Borzykh, N.V.; Savelieva, N.N.; Zemisov, A.S. Chlorophyll fluorescence imaging in fruit plant breeding for resistance to dehydration and hyperthermia. J. Appl. Spectrosc. 2021, 87, 1087–1093. [Google Scholar] [CrossRef]
  16. Zhou, C.; Mao, J.; Zhao, H.; Rao, Z.; Zhang, B. Monitoring and predicting Fusarium wilt disease in cucumbers based on quantitative analysis of kinetic imaging of chlorophyll fluorescence. Appl. Opt. 2020, 59, 9118–9125. [Google Scholar] [CrossRef]
  17. Cen, H.; Weng, H.; Yao, J.; He, M.; Lv, J.; Hua, S.; Li, H.; He, Y. Chlorophyll fluorescence imaging uncovers photosynthetic fingerprint of citrus huanglongbing. Front. Plant Sci. 2017, 8, 1509. [Google Scholar] [CrossRef] [Green Version]
  18. Song, Y.; Liu, H.; Yang, Y.; He, J.; Yang, B.; Yang, L.; Zhou, X.; Liu, L.; Wang, P.; Yang, S. Novel 18β-glycyrrhetinic acid amide derivatives show dual-acting capabilities for control of plant bacterial diseases through ROS-mediated antibacterial efficiency and activation of plant defense responses. J. Integr. Agric. 2022. [Google Scholar] [CrossRef]
  19. Sun, J.; Lin, H.; Zhang, S.; Lin, Y.; Wang, H.; Lin, M.; Hung, Y.; Chen, Y. The roles of ROS production-scavenging system in Lasiodiplodia theobromae (Pat.) Griff. & Maubl.-induced pericarp browning and disease development of harvested longan fruit. Food Chem. 2018, 247, 16–22. [Google Scholar] [CrossRef]
  20. Segal, L.M.; Wilson, R.A. Reactive oxygen species metabolism and plant-fungal interactions. Fungal Genet. Biol. 2018, 110, 1–9. [Google Scholar] [CrossRef] [PubMed] [Green Version]
  21. Zhang, X.; Zhou, Y.; Li, J.; Gu, X.; Zhao, L.; Li, B.; Wang, K.; Yang, Q.; Zhang, H. Pichia caribbica improves disease resistance of cherry tomatoes by regulating ROS metabolism. Biol. Control 2022, 169, 104870. [Google Scholar] [CrossRef]
  22. Zhao, L.; Xie, J.; Zhang, H.; Wang, Z.; Jiang, H.; Gao, S. Enzymatic activity and chlorophyll fluorescence imaging of maize seedlings (Zea mays L.) after exposure to low doses of chlorsulfuron and cadmium. J. Integr. Agric. 2018, 17, 826–836. [Google Scholar] [CrossRef] [Green Version]
  23. Tang, Q.; Zheng, X.; Guo, J.; Yu, T. Tomato SlPti5 plays a regulative role in the plant immune response against Botrytis cinerea through modulation of ROS system and hormone pathways. J. Integr. Agric. 2022, 21, 697–709. [Google Scholar] [CrossRef]
  24. Liu, Q.; Zhang, S.; Huang, Y.; Jones, J.B. Evaluation of a small molecule compound 3-indolylacetonitrile for control of bacterial spot on tomato. Crop Prot. 2019, 120, 7–12. [Google Scholar] [CrossRef]
  25. Bussotti, F.; Gerosa, G.; Digrado, A.; Pollastrini, M. Selection of chlorophyll fluorescence parameters as indicators of photosynthetic efficiency in large scale plant ecological studies. Ecol. Indic. 2020, 108, 105686. [Google Scholar] [CrossRef]
  26. Ye, M.; Zhu, L.; Li, X.; Ke, Y.; Huang, Y.; Chen, B.; Yu, H.; Li, H.; Feng, H. Estimation of the soil arsenic concentration using a geographically weighted XGBoost model based on hyperspectral data. Sci. Total Environ. 2023, 858, 159798. [Google Scholar] [CrossRef]
  27. Lin, Y.; Chen, M.; Lin, H.; Hung, Y.; Lin, Y.; Chen, Y.; Wang, H.; Shi, J. DNP and ATP induced alteration in disease development of Phomopsis longanae Chi-inoculated longan fruit by acting on energy status and reactive oxygen species production-scavenging system. Food Chem. 2017, 228, 497–505. [Google Scholar] [CrossRef]
  28. Lin, Y.; Lin, Y.; Lin, H.; Zhang, S.; Chen, Y.; Shi, J. Inhibitory effects of propyl gallate on browning and its relationship to active oxygen metabolism in pericarp of harvested longan fruit. LWT Food Sci. Technol. 2015, 60, 1122–1128. [Google Scholar] [CrossRef]
  29. Lanza, M.G.D.B.; Reis, A.R.D. Roles of selenium in mineral plant nutrition: ROS scavenging responses against abiotic stresses. Plant Physiol. Bioch. 2021, 164, 27–43. [Google Scholar] [CrossRef]
  30. Lin, Y.; Lin, H.; Zhang, S.; Chen, Y.; Chen, M.; Lin, Y. The role of active oxygen metabolism in hydrogen peroxide-induced pericarp browning of harvested longan fruit. Postharvest Biol. Technol. 2014, 96, 42–48. [Google Scholar] [CrossRef]
  31. Ghosh, R.; Barman, S.; Khatun, J.; Mandal, N.C. Biological control of Alternaria alternata causing leaf spot disease of Aloe vera using two strains of rhizobacteria. Biol. Control 2016, 97, 102–108. [Google Scholar] [CrossRef]
  32. Dong, Z.; Men, Y.; Li, Z.; Zou, Q.; Ji, J. Chlorophyll fluorescence imaging as a tool for analyzing the effects of chilling injury on tomato seedlings. Sci. Hortic. 2019, 246, 490–497. [Google Scholar] [CrossRef]
  33. Ma, J.; Du, K.; Zheng, F.; Zhang, L.; Sun, Z. Disease recognition system for greenhouse cucumbers based on deep convolutional neural network. Trans. Chin. Soc. Agric. Eng. 2018, 34, 186–192. [Google Scholar]
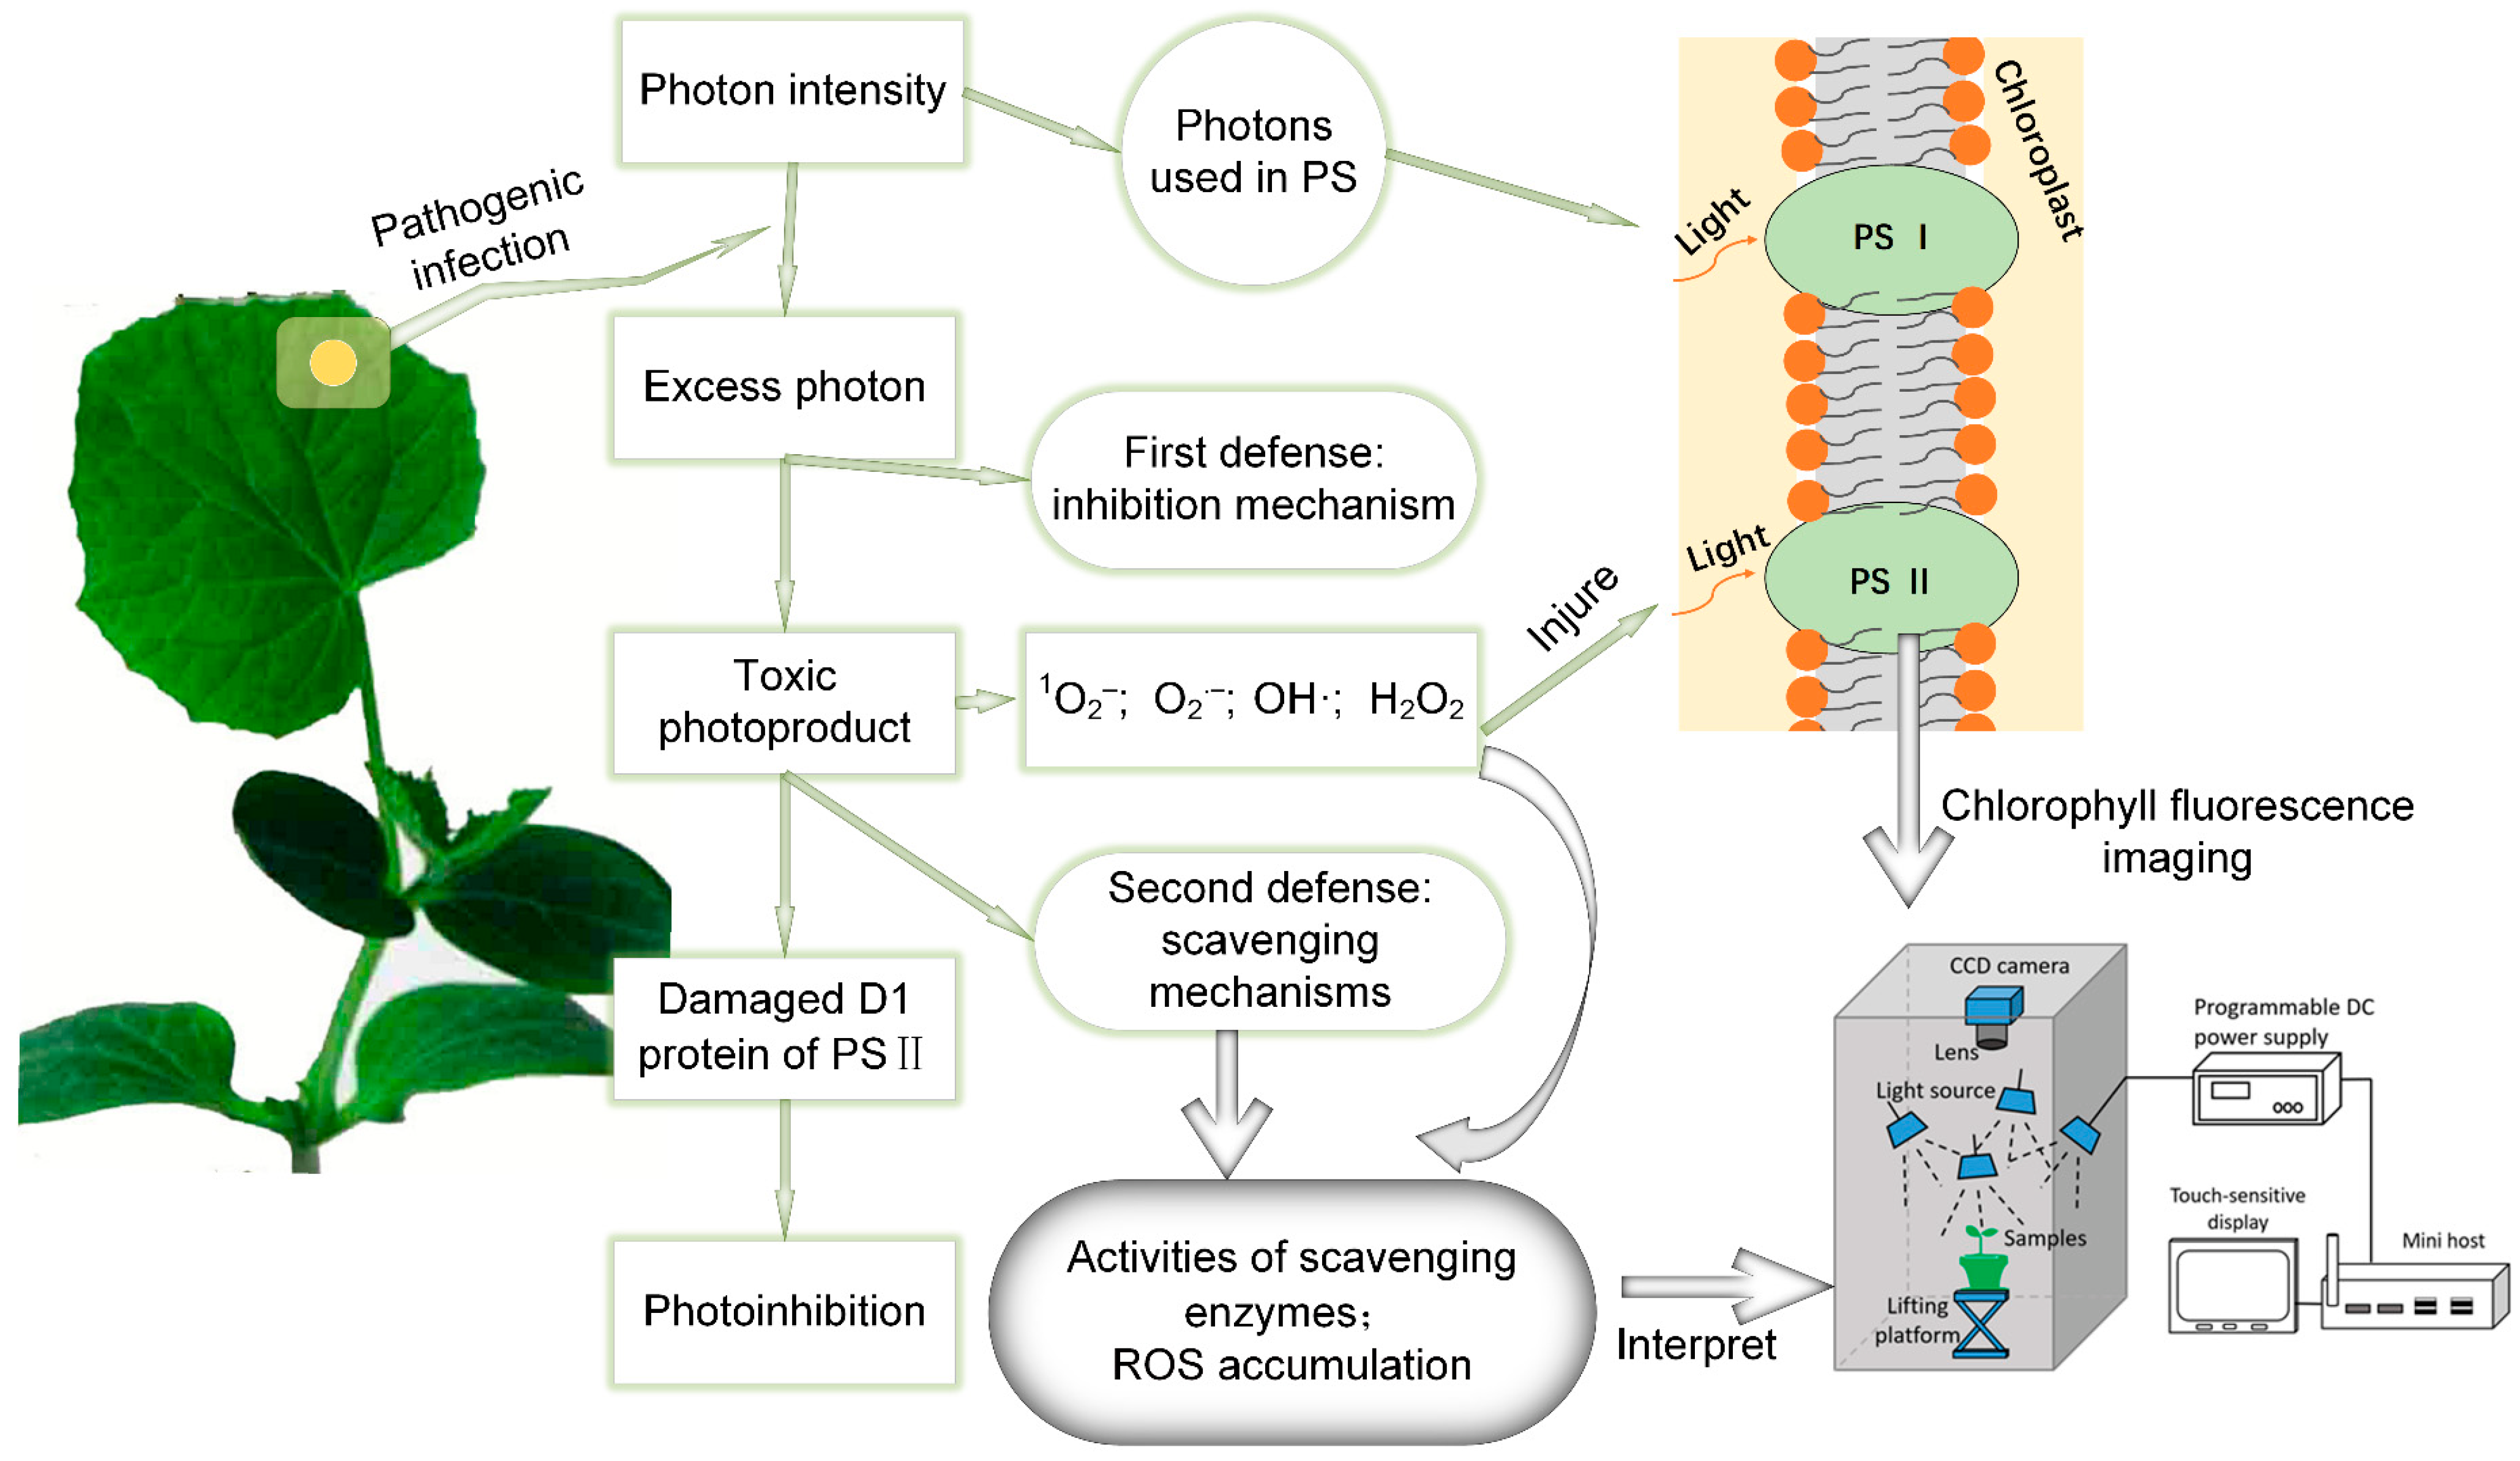
Figure 1. Reactive oxygen species production scavenging system and schematic overview of the analytical procedure for disease detection. (Singlet oxygen: 1O2, Superoxide: O2, Hydroxyl: OH·, Hydrogen peroxide: H2O2, Photosystem: PS, ROS: Reactive oxygen species).
Agronomy 13 00700 g001
Figure 2. A schematic diagram of the XGBoost algorithm, where {ωn(3)} is the regularization term, ym(x) is the newly generated tree model, YM(x) is the final tree model, and m is the total number of base tree models.
Agronomy 13 00700 g002
Figure 3. Effects of fungal infection on contents of H2O2 (a) and MDA (b) in cucumber leaves. Data were expressed as the mean of three replicates ± standard deviation.
Agronomy 13 00700 g003
Figure 4. Effects of fungal infection on activities of SOD (a), APX (b), CAT (c) and POD (d) in cucumber leaves. Data were expressed as the mean of three replicates ± standard deviation.
Agronomy 13 00700 g004
Figure 5. False color image of fluorescence parameter Y(II) on different planting days.
Agronomy 13 00700 g005
Figure 6. RGB imagines of slight and severe diseased cucumber plant diseases (BS and AN represent the brown spot and anthracnose).
Agronomy 13 00700 g006
Table 1. Effects of fungal infection on mean and standard error of the nitrogen and chlorophyll content for the cucumber’s leaves.
Infection TimeBrown Spot GroupAnthracnose GroupControl Group
NitrogenChlorophyllNitrogenChlorophyllNitrogenChlorophyll
0 h3.57 ± 0.06 a50.26 ± 2.86 a3.57 ± 0.15 a49.92 ± 2.97 a3.58 ± 0.13 ab49.72 ± 2.76 a
24 h3.42 ± 0.23 ab45.24 ± 5.05 b3.50 ± 0.18 a48.38 ± 3.35 a3.56 ± 0.13 ab48.81 ± 3.72 a
48 h3.31 ± 0.22 bc44.07 ± 4.36 bc3.48 ± 0.16 ab48.18 ± 4.06 a3.64 ± 0.16 a48.29 ± 2.92 a
72 h3.25 ± 0.24 cd43.31 ± 4.95 bc3.40 ± 0.28 bc46.12 ± 2.98 b3.49 ± 0.14 b47.71 ± 3.73 a
Values with different letters in the same column are significantly different at the 95% confidence interval (p < 0.05). The units of chlorophyll and nitrogen content are mg/g and SPAD, respectively.
Table 2. Effects of fungal infection on mean and standard error of the chlorophyll fluorescence parameters for the cucumber’s leaves.
GroupsParametersInfection Time
Healthy24 h48 h72 h
Brown spotFv/Fm0.840 ± 0.020 a0.828 ± 0.017 a0.825 ± 0.019 a0.819 ± 0.020 a
Y(II)0.214 ± 0.013 a0.200 ± 0.016 a0.211 ± 0.022 a0.217 ± 0.023 a
qP0.366 ± 0.040 ab0.339 ± 0.030 a0.394 ± 0.050 b0.446 ± 0.039 c
qN0.713 ± 0.047 a0.795 ± 0.015 b0.745 ± 0.017 a0.712 ± 0.020 a
Y(NPQ)1.386 ± 0.140 a1.513 ± 0.060 a1.871 ± 0.091 b1.873 ± 0.163 b
AnthracnoseFv/Fm0.840 ± 0.020 a0.834 ± 0.024 a0.829 ± 0.025 a0.822 ± 0.026 a
Y(II)0.214 ± 0.013 a0.195 ± 0.017 b0.196 ± 0.016 ab0.207 ± 0.014 ab
qP0.366 ± 0.040 ab0.345 ± 0.035 a0.396 ± 0.047 b0.438 ± 0.032 c
qN0.713 ± 0.047 ab0.783 ± 0.023 c0.755 ± 0.037 bc0.708 ± 0.021 a
Y(NPQ)1.386 ± 0.140 a1.506 ± 0.049 a1.772 ± 0.101 b1.801 ± 0.158 b
Fv/Fm: the maximal photochemical efficiency, Y(II): quantum yield of PS II, qP: photo-chemical quenching coefficient, qN: non-photochemical quenching coefficient, Y(NPQ): non-photochemical quenching coefficient. Values with different letters in the same row are significantly different at the 95% confidence interval (p < 0.05).
Table 3. Classification results of healthy and brown spot cucumber, healthy and anthracnose cucumber based on SVM and XGBoost algorithms *.
ModelClassCalibration (%)PredictionClassCalibration (%)Prediction
HealthyANAccuracy (%)HealthyANAccuracy (%)
(A)
SVM
Healthy98.531391.2Healthy100.031391.2
BS95.033792.5AN96.353587.5
Overall96.6344091.9Overall97.9363889.2
(B)
XG-Boost
Healthy100.031391.2Healthy100.030488.2
BS98.713997.5AN96.343690.0
Overall99.3324294.6Overall97.9344089.2
* BS and AN represent the brown spot and anthracnose, respectively.
Table 4. Classification results of different diseased (brown spot and anthracnose) cucumbers based on SVM and XGBoost algorithms *.
ModelClassCalibration (%)Prediction
HealthyANBSAccuracy (%)
(A)
SVM
Healthy90.1264476.4
AN95.0138195.0
BS92.5523382.5
Overall92.932443885.1
(B)
XGBoost
Healthy89.4283382.4
AN98.8139097.5
BS90.0603485.0
Overall92.935423788.6
* BS and AN represent the brown spot and anthracnose, respectively.
Table 5. Classification results of different degrees (slight and severe) of diseased cucumbers based on SVM and XGBoost algorithms *.
ModelClassCalibration (%)Prediction (%)ClassCalibration (%)Prediction (%)
(A)
SVM
Healthy98.579.4Healthy97.585.3
BS-slight85.085.0AN-slight9075.0
BS-severe92.585.0AN-severe92.585.0
Overall93.282.4Overall93.382.4
(B)
XGBoost
Healthy97.091.2Healthy93.982.4
BS-slight92.590.0AN-slight87.580.0
BS-severe87.580.0AN-severe90.095.0
Overall93.287.8Overall90.485.1
* BS and AN represent the brown spot and anthracnose, respectively.
Table 6. Classification results of different degrees (slight and severe) and diseases (brown spot and anthrax) in cucumbers based on SVM and XGBoost algorithms *.
ModelClassCalibration (%)Prediction
HealthyBS-SlightBS-SevereAN-SlightAN-SevereAccuracy (%)
SVMHealthy87.927033179.4
BS-slight87.501550075.0
BS-severe8514150075.0
AN-slight77.540013365.0
AN-severe82.522011575.0
Overall84.1342123171974.6
XGBoostHealthy92.430003188.2
BS-slight90.001721085.0
BS-severe82.523150075.0
AN-slight77.541013265.0
AN-severe8520121575.0
Overall85.5362117211978.9
* BS and AN represent the brown spot and anthracnose, respectively.
Disclaimer/Publisher’s Note: The statements, opinions and data contained in all publications are solely those of the individual author(s) and contributor(s) and not of MDPI and/or the editor(s). MDPI and/or the editor(s) disclaim responsibility for any injury to people or property resulting from any ideas, methods, instructions or products referred to in the content.