1. Introduction
Bahiagrass (
Paspalum notatum Flüggé) is a perennial warm-season grass native to the Americas and widely used as a forage crop and as a turf grass in large regions of southeastern USA [
1], Japan [
2], and other subtropical regions [
3]. Its typical biotype is an autotetraploid (2n = 4x = 40) reproducing by pseudomagous aposporous apomixis, where embryos develop by parthenogenesis, but fertilization of the polar nuclei is necessary for seed formation [
4]. Sexual diploid forms also exist, occurring naturally only in North Eastern and Central Eastern Argentina [
5,
6]. Among the main bahiagrass attributes are its perenniality, weed competitiveness, and persistence under defiant abiotic stress conditions, while also responding to fertilizer inputs and irrigation [
1,
2,
7,
8]. Bahiagrass offers moderate to high annual forage yield and nutritive value with average seasonal dry matter digestibility above 57% and crude protein above 12% [
2,
7,
8,
9,
10].
Plant breeding efforts in bahiagrass have produced a number of cultivars, most of them apomictic tetraploids obtained by clonal selection among ecotypes or sexual diploids derived from cultivar Pensacola [
1,
9,
11]. The inefficient exploitation of genetic diversity imposed by the predominant apomictic mode of reproduction in tetraploids, and the narrow genetic base in diploids are major constraints in the generation of superior cultivars. However, hybridization among induced sexual and apomictic tetraploids can be used to exploit the genetic diversity contained within different apomictic parents by generating segregating populations from where new superior apomictic varieties can be selected [
9,
12,
13,
14].
For large-scale adoption of any forage cultivar, seed production is a key factor as it must be profitable for seed producers while at the same time reaching farmers at a competitive seed price. Bahiagrass can yield up to 700 kg ha
−1, of clean seeds depending on management and environmental factors [
15], although seed yields of 60 to 560 kg ha
−1 are reported in commercial, large-scale paddocks [
9,
16]. An understanding of how seed yield potential is determined (maximum number of fructiferous organs per unit area achieved) and how that potential is realized (final number and weight of seeds) is necessary to identify optimal growing conditions and agronomic practices. For example, nitrogen fertilization management and residue removal at the beginning of the growing season are known to affect seed production through seed-head density with variation between cultivars, while they may also affect the seed size and germination. Environmental effects such as location and year also affect seed-head density, seed size, and seed yield [
15,
17,
18,
19,
20].
Detrimental factors can limit the realization of the seed yield potential. Sterility is a generic term used to describe the failure of a floret to set a seed, which could be the consequence of different underlying processes happening between anthesis and seed development: abnormal or underdeveloped organs and gametes, lack of pollination or fertilization, zygote or embryo abortion, undeveloped endosperm, or premature desiccation of seeds [
21,
22,
23,
24,
25]. As a consequence, seed set in bahiagrass varies between 5% and 50% depending on genotypes, management, and environment [
12,
19,
20,
26,
27,
28]. Ergot is a fungal disease caused by
Clavicep spp. and affects several grass species [
29,
30]. The pathogen infects the ovary and causes the floret to produce a sclerotia instead of a caryopsis. The life cycle of
Claviceps spp. begins in spring when wind-released ascospores fall on the stigmas of susceptible grasses. The hyphae invade and colonize the ovary exclusively where conidia are produced and exuded a honeydew-like secretion until sclerotia formation begins. Sclerotia mature in four to five weeks, replacing the seed [
29,
30,
31,
32]. Up to 15% of caryopses replaced by protruded sclerotia were reported in bahiagrass [
27]. Sterility and ergot have been mostly analyzed as seed quality issues but have been largely overlooked as factors limiting the realization of the seed yield potential, and there is a lack of information regarding seed yield reduction due to these two factors.
Seed yield component analyses have been performed showing that seed-head density, seeds per seed-head, and weight of 1000 seeds are the most important traits for seed yield but their degree of genetic determination has not been elucidated [
20,
33]. Cultivar differences in ergot susceptibility are known, and resistant germplasm has been identified, although it has been barely exploited in plant breeding [
27]. Genetic parameters for seed yield components, sterility, ergot resistance, and the relationship between them are not available but are crucial to understanding to what extent these traits can be manipulated through genetic improvement, management, or environmental conditions.
An experiment was established to determine the magnitude of reduction in seed yield potential caused by ergot disease and sterility, as well as seed yield components, and to what extent the differences were caused by genotype, environment, and their interactions. We hypothesized that ergot and sterility are significant detrimental factors, and that genotype is a major contributor to variation in ergot levels and seed yield.
2. Materials and Methods
From a collection of 417 apomictic and tetraploid bahiagrass clones collected in Uruguay [
34], 15 clones were randomly selected, while cultivars Argentine (PI148996) and Paraguay 22 (PI158822) were used as controls. Clones were vegetatively propagated, and individual plants were transplanted to the field in December 2009 in a spaced plant grid (1 m × 1 m) using a randomized complete block design with three replicates. The experiment was replicated in three different research stations of the National Institute of Agricultural Research of Uruguay (INIA): Palo-a-Pique (Lat. −33.25° S; Long. −54.49° W), Glencoe (Lat. −32.02° S; Long. −57.16° W), and Tacuarembó (Lat. −31.74° S; Long. −55.98° W) (see
Table S1 for soil description and climatic variables).
During February and March of 2010 and 2011 (end of summer season, first and second year), plants were screened for ergot severity of infection. A subset of 16 seed-heads per plant was screened for the presence of the honeydew-like secretion produced by ergot-infected spikelets. The percentage of infected spikelets on every seed-head was determined and the average per seed-head was used as an estimate of the severity of infection. At maturity, in all three locations, the number of seed-heads was counted for each plant, and seeds were harvested and threshed. Total seed yield per plant was assessed which includes seeds filled with a caryopsis (full seeds), ergot sclerotia, and empty seeds. Except for large protruded sclerotia that eventually occur, these three components of the total seed yield have the same aspect and are not distinguishable with the naked eye. Seed-head weight was estimated by dividing the total seed yield per plant by the number of seed-heads per plant.
Seeds harvested in the second year in Palo-a-Pique and Tacuarembó were subject to further analysis to determine the proportion of full seeds, ergot sclerotia, and empty seeds per plant. Separation of these three fractions was done by flotation followed by visual separation [
35,
36]. Briefly, a sample of 1.5 g of the harvested seeds was chemically scarified by submersion in a sulfuric acid solution at 80% and gently whirling in a 250 mL Erlenmeyer flask for 10 min. Seeds were immediately sieved and rinsed with abundant tap water to remove any remnant of the sulfuric acid before being transferred to a 150 mL beaker filled with soapy water. The scarification step was required to remove the external seed coats (glumes II and lemma I) eliminating the air contained within them, which would make most of the seeds float. By flotation, two categories were separated: full seeds and heavy ergot sclerotia submerged, while empty seeds and lighter ergot sclerotia floated. Both seed categories were recovered and dried by spreading them on paper towels followed by observation in a diaphanoscope to manually separate ergot sclerotia. Full seeds are light-colored and non-translucent, empty seeds are translucent and ergot sclerotia are opaque.
Full seeds, ergot sclerotia, and empty seeds were counted and weighed. The proportion in number and weight and the 1000 seeds weight (TSW) of each seed category were estimated. Pure seed yield per plant was estimated as the product of total seed yield and the proportion of full seeds in weight. The number of spikelets per seed-head was estimated from seed-head weight and the TSW of total seed.
A split-plot in time and space model repeated over three locations was used for the analysis of variance [
37,
38]. Each factor of the split-plot model (block, genotype, and year) was cross-classified with location (split-plot in space), which represented three experimental locations. Years were treated as sub-plots in the split-plot design because measurements were taken from the same plots each year (split-plot in time) [
39]. For seed fractions analysis, the model was reduced to a randomized complete block design repeated in two locations. All factors, including genotype, location and age were considered random. An analysis of variance (ANOVA) was performed using the MIXED procedure in SAS, first with type III estimation method for the covariance parameters (
method = type 3 option) to test the significance of main effects and interactions, and then with the restricted maximum likelihood (REML) estimation method to obtain the covariance parameter estimates.
In all cases, residuals were plotted and visually inspected for deviances in normality assumptions and homogeneity of variances, and data were transformed when violations of these assumptions were detected. Seed-heads per plant and Severity of infection were square-root transformed, Seed-head weight and Total seed yield were transformed to the logarithm base, while Pure seed yield was transformed to the cubic root. The seed fraction variable percentage of full seeds on a number basis was transformed to the arcsine-square-root. The Pearson correlation coefficients among variables were estimated to better understand the associations between them.
Variance components estimates obtained with the REML method were used to estimate broad-sense heritability as follows [
40]:
For seed fractions analysis, broad-sense Heritability was reduced to:
where
is the genotypic variance,
is the variance of the genotype by location interaction,
is the variance of the genotype by year interaction,
error 1 (genotype by block within locations) variance, and
is the error 2 variance (residual). Note that
in [
2] is the genotype by block interaction within locations (
). Letters
l,
y, and
r stand for location, year, and repetitions within locations, respectively.
3. Results
Climatic conditions were characterized by excessive rainy conditions during February of year 1, followed by moderate deficits in March for Tacuarembó and Glencoe, and in March of year 2 for Glencoe. Temperature regimes were very similar in the different locations with a tendency to lower minimums in Palo-a-pique in year 2, and higher maximums at Glencoe during the whole period (
Table S1).
The number of seed-heads per plant varied from 29 in
year 1 to 134 in
year 2 (
Table 1). Except for genotypes
TB233,
TB325, and
TB55 in
Tacuarembó, all genotypes greatly increased the number of seed-heads in all three locations (
p < 0.05). Effects of genotype and year were significant as well as the interactions genotype by year and location by year (
Table 2; analysis of variance for all traits are provided in
Table S2). The interaction between location and year was marked by a crossover in location rankings where
Tacuarembó had the largest number of seed-heads in
year 1 but the lowest in
year 2 (
Table 1). The magnitude of the differences between years explained most of the genotype-by-year interaction, although some changes in ranking order were noticed. The large year effect was also evidenced by the percentage of the variance explained by this effect, reaching 73.3%, followed by genotype with 12.5% (
Table 2; variance estimates for all traits are provided in
Table S2). Broad-sense heritability was estimated at 0.76.
Average seed-head weight varied from 144 mg in
year 1 to 86 mg in
year 2, genotypes ranged from 80 mg in
TB55 to 195 mg in
TB42, and locations varied from 86 mg in
Glencoe to 139 mg in
Tacuarembó (
Table 1). Despite the large differences, none of these main effects were significant (
Table 2). Significant interactions were observed among location by year and genotype by year.
Tacuarembó was the only location to increase seed-head weight from
year 1 to
year 2, and while the other two locations had a decrease in seed-head weight,
Palo-a-Pique did in a larger magnitude (
Table 1). Although some crossovers occurred between genotypes in different years, a change in the magnitude of the differences was evident, with a larger variation between genotypes in
year 1 than in
year 2. The location-by-year interaction explained 68.1% of the observed variation in this trait, followed by year, accounting for an additional 18% (
Table 2). Seed-head weight was the trait with the lowest broad-sense heritability with an estimate of 0.58.
The severity of infection observed in the different years across genotypes and locations averaged 16.4% and 12.7% in
year 1 and
year 2 respectively (
Table 1). Variation across locations was larger with an average of 7.7% in
Glencoe to 19.2% in
Palo-a-Pique, while
Tacuarembó was intermediate with 15.7%. However, neither year nor location effects were significant (
Table 2). The largest variation in the severity of infection was observed between genotypes with averages ranging from 1.7% in
TB167 to 24.7% in
TB336, although changes in rankings and magnitude of differences were observed among genotypes in different years (
Table 1). Also, large interactions were observed in location by year, leveraged by a very low severity registered in
Glencoe during
year 2, which averaged 1.6%. All other locations by year ranged from 13.8% in
Glencoe in year 1, to 19.8% in
Palo-a-Pique also in
year 1. The effects of genotype and the interactions location by year, were highly significant, while genotype by year and the triple interaction were also significant (
Table 2). No significant location by genotype interaction was observed. Nevertheless, 41.6% of the total variance was explained by the genotype variance, and 32.1% was due to the location-by-year interaction. Broad-sense heritability estimation reached 0.86 indicating that the degree of severity of infection is largely determined by the individual’s genetic background (
Table 2).
Total seed yield across genotypes and locations varied from 4.3 g per plant in
year 1 to 11.8 g in
year 2 (
Table 1). Location averages across genotypes and years ranged between 5.2 per plant in Glencoe to 12.8 g in
Tacuarembó. However, year and location effects were not significant (
Table 2). A larger range of variation was observed among genotypes with values as low as 1.6 g per plant in
TB55, to 23.7 g in
TB42 (
Table 1). Although the genotype effect was highly significant, there was no significant genotype by location and genotype by year interactions (
Table 2). Location-by-year interaction was highly significant, particularly observed in the large response of
Tacuarembó to conditions in
year 2 (
Table 1). Interestingly, year accounted for 37% of the total variance, while genotype explained an additional 33.9% of the total variance, and for the remaining, 14.9% was due to the location-by-year interaction. Overall, the phenotype of any individual was largely explained by its genotype as denoted by the large estimate of broad-sense heritability (H
2 = 0.92) (
Table 2).
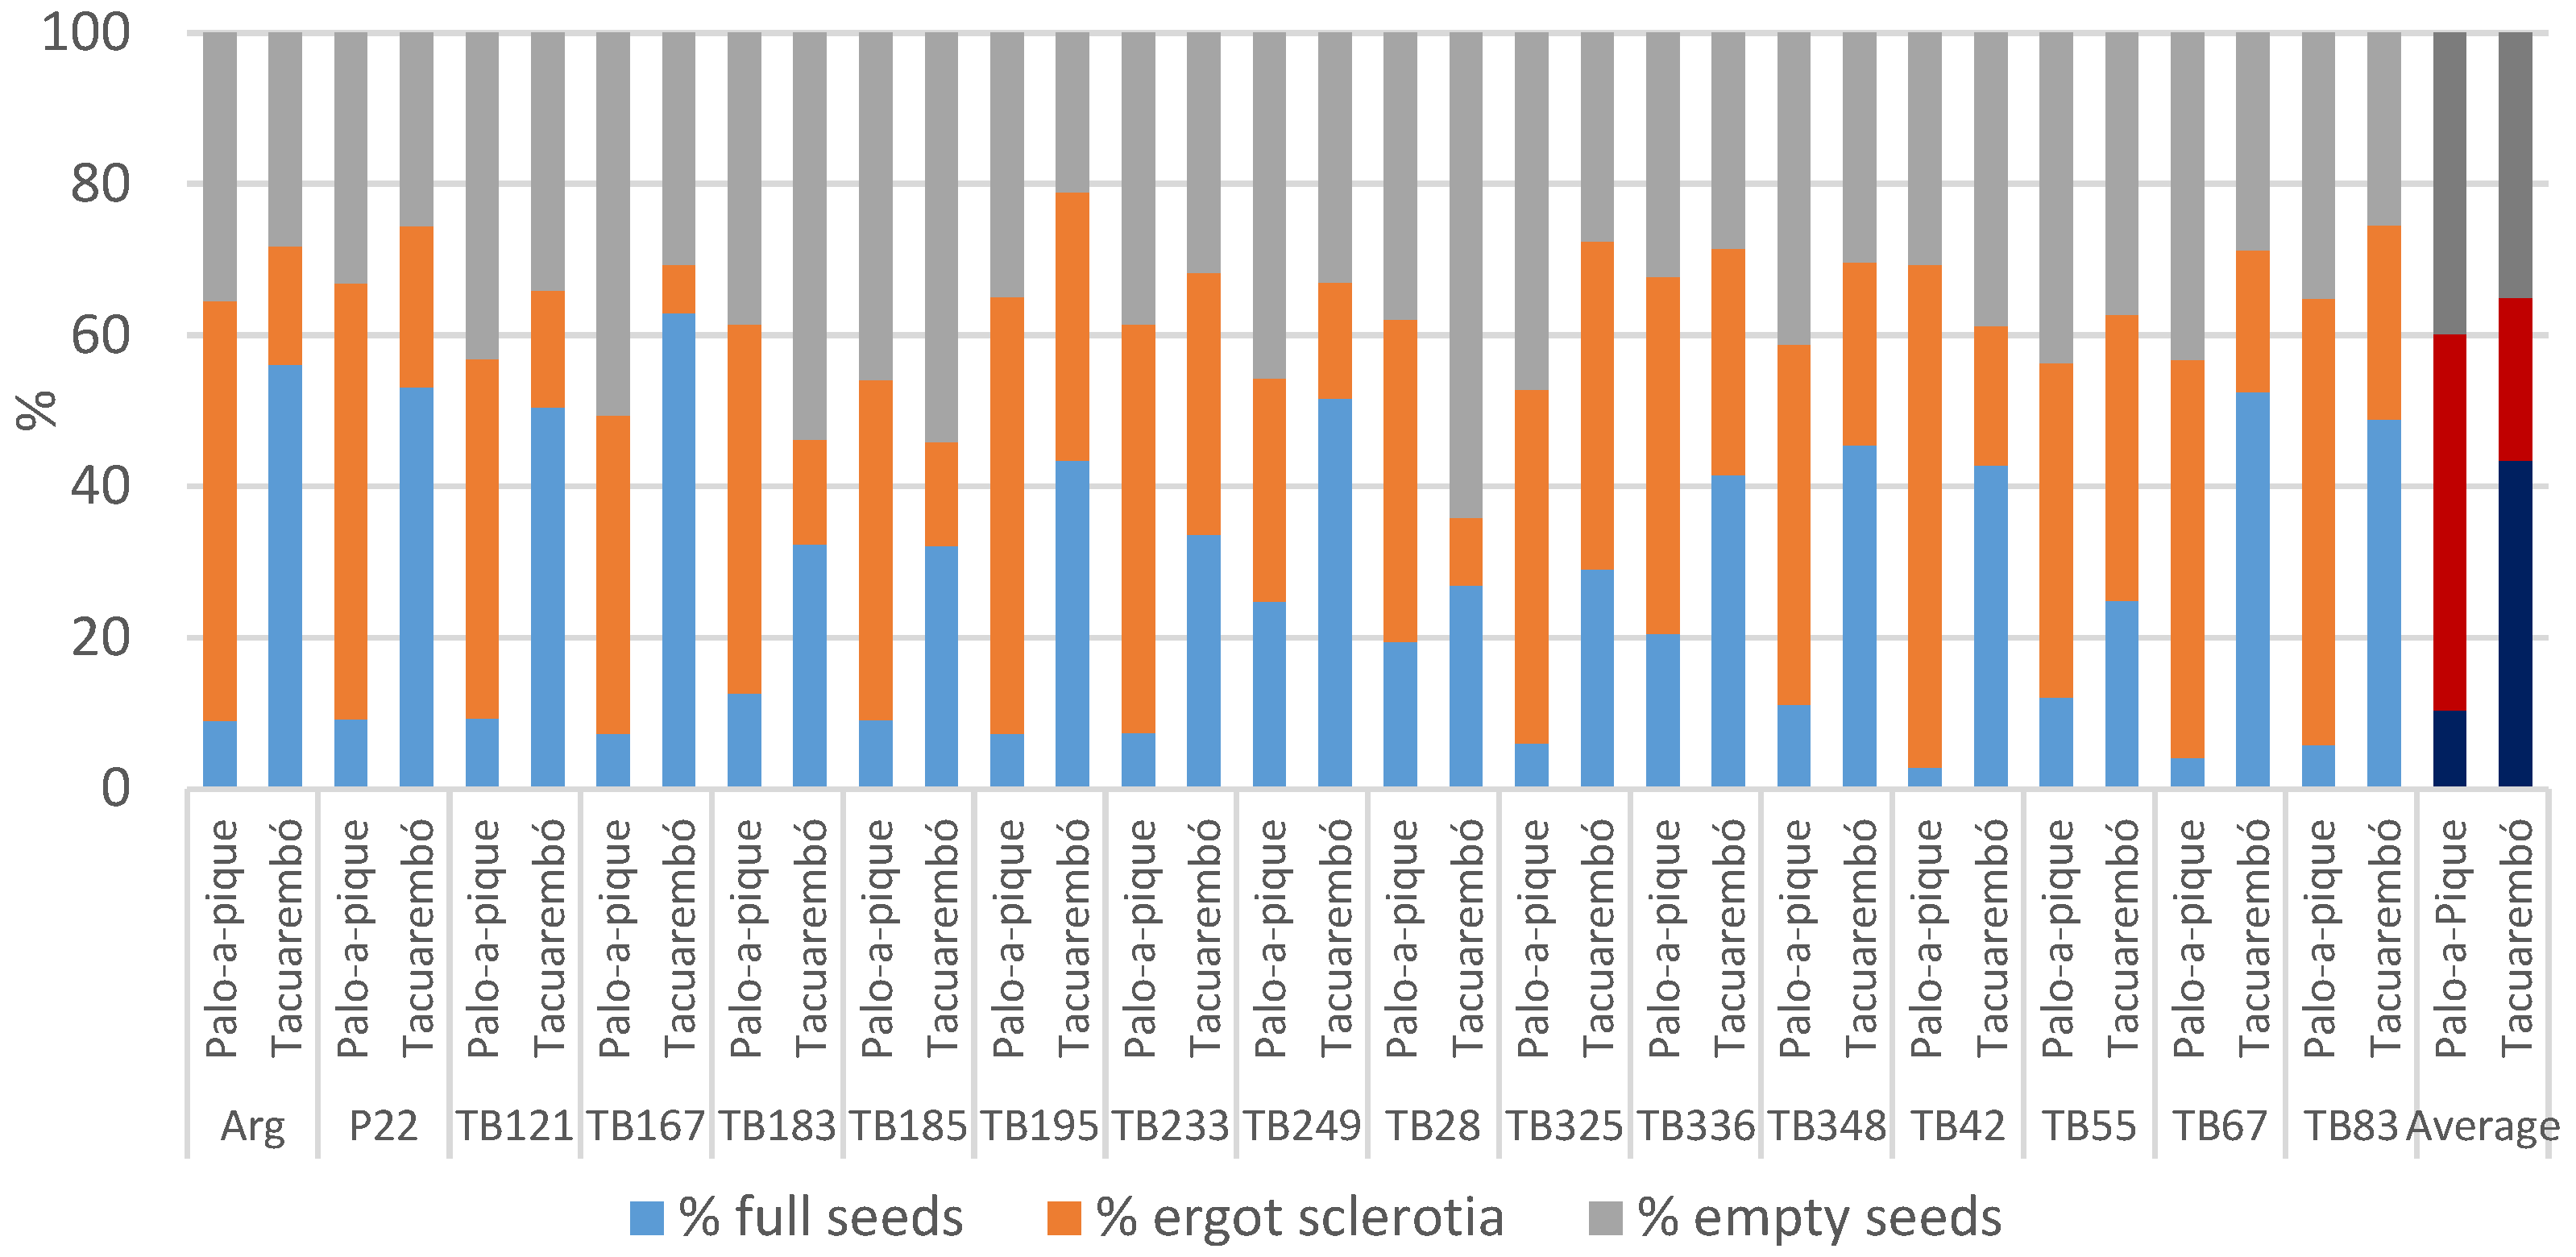
For year 2, the percentage of full seeds was significantly greater in
Tacuarembó than in
Palo-a-Pique: 43% vs. 10% (
Figure 1), with location explaining most of the variance (
Table 3). The genotype effect was not significant and did not contribute to the observed variance. However, the genotype-by-location interaction was significant, with both cross-overs and changes in magnitude, and most genotypes responded positively to the better conditions present in
Tacuarembó (
Figure 1). Percentages of full seeds were as low as 3% in genotype
TB42 in
Palo-a-Pique and as high as 63% in genotype
TB167 in
Tacuarembó. A maximum of 25% was achieved by genotype
TB249 in
Palo-a-Pique, which also held the maximum average across locations, and such value was similar to the minimum achieved in
Tacuarembó by genotype
TB55. In addition to such differences, the interaction only explained a small portion of the variance (
Table 3). Genotypes performed the same at
Palo-a-Pique, and significant differences only occurred in
Tacuarembó (
p = 0.0006), where except for 5 genotypes (
TB55,
TB28,
TB249,
TB325, and
TB336), all other genotypes significantly increased the percentage of full seeds at
Tacuarembó (
p < 0.05).
The percentage of empty seeds was not different between locations with an average of 37%. There were no significant differences between genotypes either, with both effects explaining a small portion of the variance (
Table 3). However, genotypes responded differently to the different locations. In this regard, four genotypes had a higher percentage of empty seeds in
Tacuarembó while the rest had a reduction in this location; nonetheless, there were changes in ranking order in both groups (
Figure 1). Empty seeds were as large as 64% in genotype
TB28 and as low as 21% in genotype
TB195, both at
Tacuarembó. The split analysis showed that genotypic differences occurred only in
Tacuarembó (
p < 0.0001), and only two genotypes were different across locations:
TB167 had more empty seeds in
Palo-a-Pique and
TB28 in
Tacuarembó. In this case, most of the variance was explained by the interaction, although genotype contributed 11%, and the broad-sense heritability estimate reached 0.19 (
Table 3).
The percentage of ergot sclerotia in the seed averaged 50% in
Palo-a-Pique and 22% in
Tacuarembó, with location explaining most of the observed variance (
Table 3). The effect of genotype was not significant, but there was a significant location by genotype interaction. The split analysis of the interaction showed that the effect of genotype was significant within both locations (
p = 0.0250 and
p < 0.0001), and while 5 genotypes did not differ across locations (
TB55,
TB195,
TB233,
TB249, and
TB325; (
p > 0.05)), the other 12 genotypes were less affected in
Tacuarembó (
p < 0.05) (
Figure 1). On average, genotype
TB195 had the largest proportion of ergot with 47%, although the absolute maximum was 67% in genotype
TB42 in
Palo-a-Pique. In contrast, the lowest in average was genotype
TB249 with 22%, but the absolute minimum was 6% in genotype
TB167 in
Tacuarembó. The degree of genetic determination of this trait was 0.39 (
Table 3).
The TSW of full seeds was affected by location and genotype, and by their interaction (
Table 3). Overall, genotype differences were detected within both locations (
p = 0.0386 and
p < 0.0001). Full seeds weighed on average 2.73 g in
Palo-a-Pique and 3.55 g in
Tacuarembó (+30%), and except for
TB249, all genotypes had heavier seeds at
Tacuarembó (
Figure 2). Genotypes
TB249 and
TB167 had lighter seeds at both locations, ranging between 1.75 and 2.49 g. Aside from these two, the heaviest value observed at
Palo-a-Pique was lower than the lowest value at
Tacuarembó (3.05 g in genotype
TB121 vs. 3.43 g in ‘
Argentine’). Values as high as 4.97 g were obtained from genotype
TB121 in
Tacuarembó. The largest portion of the variance was explained by location although genotype explained an additional 26%, and the broad-sense heritability reached 0.93 (
Table 3).
The TSW of empty seeds was also affected by location and genotype, with no interactions (
Table 3). Location explained a larger portion of the variance than genotype, but the degree of genetic determination of the phenotype was still high.
Palo-a-Pique produced lighter empty seeds with an average weight of 1.20 g, while
Tacuarembó averaged 1.56 g (+30%). Again, genotypes
TB249 and
TB167 showed lighter empty seeds averaging 0.93 and 0.95 g. The heaviest empty seeds were observed in genotype
TB42 averaging 1.61 g (
Figure 2).
The TSW of ergot-sclerotia was also affected by location and genotype, and by their interaction (
Table 3), with genotypic differences at both locations (
p = 0.0074 and
p < 0.0001) and with nine genotypes showing heavier ergot-sclerotia at
Tacuarembó (
p < 0.05). On average, the TSW of ergot-sclerotia weighed 1.36 g in
Palo-a-Pique and 2.50 g in
Tacuarembó (+84%). Genotype
TB249 had the lowest average weight at 1.31 g while
TB336 was the heaviest at 2.31 g. The absolute minimum was registered by
TB167 in
Palo-a-Pique at 0.81 g, while the absolute maximum was reached by
TB42 at 3.07 g in
Tacuarembó (
Figure 2). Most of the variance was explained by location, and the broad-sense heritability of this trait was estimated at 0.63 (
Table 3).
Pure seed yield was significantly affected by location, which explained a major part of the total variance (
Table 3). Genotype as a main effect was responsible for only 10% of the variance but without significant differences. However, the genotype effect was different depending on the location, with genotypic differences within both locations (
p < 0.05), while 10 out of the 17 genotypes showed higher pure seed yield at
Tacuarembó (
p < 0.05). A medium level of 0.46 broad-sense heritability was estimated.
Comparing total and pure seed yields, the magnitude of reduction in seed yield due to ergot and sterility was larger in
Palo-a-Pique (
p < 0.0001) reaching on average 81%, ranging from 61% in genotypes
TB249 and
TB336 to over 90% in genotypes
TB42 and
TB67 (
Figure 3). Such losses were lower in
Tacuarembó reaching 36% ranging from 22% in genotype
TB167 to 50% in genotype
TB28. Genotype was not significant (
p = 0.63) but the interaction with location was (
p = 0.0022). Ergot and sterility contributed equally to seed yield reduction in
Tacuarembó, but ergot was responsible for a larger portion of the reduction in
Palo-a-Pique. However, the contribution of both detrimental factors to the reduction in seed yield varied with the different genotype and location combinations.
The correlation analysis among total seed yield components showed that total seed yield was strongly and positively associated with the number of seed-heads per plant. Similarly, seed-head weight was positively associated with total seed yield, although the correlation was moderate. In contrast, a general negative correlation between the number of seed-heads and seed-head weight was observed (
Table 4). Seed-head weight components, spikelets per seed-head, and total seed TSW showed intermediate correlation levels with total seed yield, were highly correlated with seed-head weight, and showed a positive association between them while showing no correlation with seed-head number.
Full seeds and ergot sclerotia fractions had a large and negative correlation (
Table 5). Similarly, empty seeds showed a negative correlation with full seeds although at a lower magnitude. The overall correlation between empty seeds and ergot sclerotia was not significant. Similar trends were observed when the correlations of the different fractions were analyzed on a by-weight basis.
Variation in TSW of total seed showed a positive association with the percentage of full seeds and a negative association with ergot sclerotia and empty seeds (
Table 5). The TSW of all three fractions were highly correlated among them and with the TSW of total seed independently of location.
Variations in both total and pure seed yield showed similar tendencies although for pure seeds correlations were stronger. A positive association with the percentage of full seeds was observed, and a negative association of the same magnitude with the percentage of ergot sclerotia (
Table 6). Interestingly, the negative correlation with the percentage of empty seeds was not significant, although the TSW of the three fractions were positively correlated with both total and pure seed yield. Overall, there was no significant correlation between the severity of infection and total seed yield.
4. Discussion
High seed production is essential for a cultivar to be commercially viable. In this article, we addressed genotypic and environmental effects on seed yield and its components, together with two main factors that are limiting for bahiagrass seed production: sterility and ergot susceptibility. The hypotheses that ergot and sterility are significant detrimental factors, and that genotype is a major contributor to variation in ergot levels and seed yield were demonstrated. Our results confirmed that seed production was largely conditioned by the individual’s genotype, as denoted by the large portion of the variance explained by the genotype effect and the observed genotypic differences, and the high estimate of broad-sense heritability. Among the seed yield components, the number of seed-heads per plant varied more closely to total seed yield than seed-head weight, while these two components were negatively correlated. Consequently, the increase in floral induction from
year 1 to
year 2 did not result in a significant increase in total seed yield, due to the decrease in seed-head weight from
year 1 to
year 2. From these two components, the seed-head number showed the highest broad-sense heritability. These results are supported by previous research that identified seed-head density as the component best correlated with seed yield [
19,
41], with genotypic differences [
41] and moderately high levels of broad-sense heritability with consistent performance of genotypes at different locations [
28]. Selection for seed-head weight as an indirect trait could also be an efficient way to increase seed yield without adverse effects on vegetative production [
42]. Despite that, significant non-genotypic effects and interactions in flowering density have been reported in bahiagrass [
19], while in other forage crops, unfavorable weather conditions reduced most of the seed yield components [
21]. In our experiments, larger portions of the variance were explained by non-genetic factors like location and year, either individually or combined, meaning they can greatly modify seed yield and its components independently of the genotype. Our results suggest that both genotype and environment must be considered to have a greater impact on seed yield.
Once the seed yield potential has been determined by the number of seed-heads and spikelets, the environment represented in our experiments by the location effect, was the main determinant of the proportion of full seeds. This is supported not only by the absence of a significant genotype effect but also by the fact that no observed variation was attributed to genotype, resulting in a null broad-sense heritability, meaning that this trait is not determined by its genotype. On the contrary, previous reports found a genotype effect on the proportion of full seeds [
27,
43] and a high broad-sense heritability at individual locations [
28] but also did non-genetic factors like fungicide treatment [
27], temperature [
43], and location together with location by genotype interaction [
28]. Rios et al., 2020 [
19] reported that the genotype effect was significant but not consistently so across years, with non-genetic treatments like defoliation and nitrogen management being significant as well as some of the interactions. Specific sets of genotypes could have magnified genotypic differences in such cases as did the very different locations tested in our experiment (
Table S1), but in all these previous reports the relative magnitude of the genotypic and non-genotypic variances was not determined. Environmental factors during blooming can severely affect seed setting in forage and cereal crops [
21,
22,
43]. The pollen and anthers developmental phases are severely affected by hydric and heat stresses, which can strongly reduce the potential activity of pollination or directly cause pollen abortion [
21,
22,
23]. High temperatures, low water availability, and low relative humidity also contribute to the desiccation of floral parts, reduction in stigma receptivity time, and lack of synchrony between male and female development [
21,
22]. Normally, the ovary completes its maturation in days, and within this period, egg cells must be pollinated otherwise they abort [
21]. Although some genetical factors seem to affect the fertilization and post-zygotic phase causing high rates of abortion [
21,
44], a shortage in the supply of carbohydrates at the beginning of zygote formation and early seed formation is the main cause, and this is dependent on current photosynthesis and mobilization of assimilates from source organs, which in turn are sensitive to stress conditions [
21,
24,
25]
Seed sink potential is genetically determined, but final seed production is a function of assimilate supply and competition among sink sites for space and resources available in the environment during the early stages of seed development [
21,
24,
25]. Environmental conditions during cell division also influence development, the filling and relocation of assimilates in the cells of the endosperm, the accumulation rate, and the duration of stored products. In our study, the environment not only determined the percentage of each fraction but also their TSW, as most of the variation within these traits was explained by location. The TSW of total seed was the seed yield component most influenced by the environment while having an intermediate correlation with total seed yield. Among the seed fractions, the percentage of full seeds was the one better associated with both TSW of total seed and total seed yield, since it is the heaviest of the three fractions. Interestingly, the environment pushed the weight of all fractions in the same direction, by producing and filling larger structures in better environments independently of their percentage. In other forage crops, seeds per stem and seed weight, which are, in fact, the two determinants of seed-head weight in grasses, were the yield components most affected by environmental factors, mostly water availability [
21]. Other non-genetic factors in
Paspalum sp., like temperature [
43], and harvesting dates [
41], can also have a strong effect on TSW and floret fertility. However, genotype also influenced the realization of the seed yield potential since genotypes responded positively in terms of seed weight in the better location and with differences in genotypes at both locations. In addition to the strong location effect, these traits had a very high broad-sense heritability denoting that they have a high genetic component, especially for full seed weight, which agrees with some previous reports on genotypic effects [
19,
41,
43].
In a similar way, genotype had an indirect influence on total seed yield due to differences in ergot susceptibility. Similar to Rios et al. (2015) [
27] who found a significant genotype effect on ergot severity of infection with some genotypes considered resistant, our results indicated that the severity of infection is highly determined by the genotype, although large interactions existed. Ergot disease as a detrimental effect on total seed yield showed a high degree of genetic determination, with genotype being the single most important effect explaining the observed variation, and with significant differences between genotypes, some of them having consistently very low levels of the disease. However, the particular environmental conditions (location-by-year combination) were responsible for another considerable portion of the variance. Although the environment may affect inoculum availability, conditions for infection and development of the disease [
31], its interference with seed production was not evident since the expected negative correlation with the severity of infection was not significant. An indication of this is that the very low severity in
Glencoe in
year 2 did not result in a total seed yield increase of the same magnitude, and while
Tacuarembó slightly increased the severity in
year 2, it greatly increased the total seed yield.
Results also indicated that, like the percentage of full seeds, the proportion of spikelets filled with ergot sclerotia was mostly determined by the environment, but in this case, a medium level of broad-sense heritability was detected. As such, genotypes may increase the percentage of full seeds by reducing the percentage of ergot sclerotia. This is supported by the fact that fractions of full seeds and ergot sclerotia had a high negative correlation, and while full seeds and empty seeds also varied in opposite directions, there was no correlation between ergot sclerotia and empty seeds. These suggest that most of the variation in the proportion of each fraction is due to the substitution of full seeds by ergot sclerotia and vice versa, and that full seeds compete with both ergot sclerotia and empty seeds fractions, but ergot sclerotia come mostly at the expense of full seeds. In addition, empty seeds were less affected by the environment denoted by the lack of location significance and a low attributed percentage of the variance, while most of its variation was dependent on the specific genotype and location combination. Data suggest then that the maximum percentage of filled spikelets is conditioned by the particular combination of genotype and environment, and that full seeds and ergot sclerotia compete for these positions. In a previous report, significant year and genotype effects on the percentage of ergot sclerotia were found, but without a clear negative association between the percentage of full seeds and the percentage of ergot sclerotia, with some genotypes departing from this association [
27]. A strong negative correlation between florets setting seeds and florets producing sclerotia in bahiagrass was first presented by Burton and Lefevre in 1948, showing that infection can only occur in unfertilized ovaries [
45]. Delayed or lack of pollination causes greater ergot incidence in grasses, but not sterility
per se since a functional pistil needs to be present which serves as a portal of entry while some host cells at the base of the ovary are spared alive for nutrient translocation from the plant [
29,
30,
32]. In
P. dilatatum,
Claviceps conidia germinates, and its tubes invade the ovary within 4 h beginning ovary disintegration [
30]. In turn, in
Paspalum species, pollen grains germinate within 15 min and pollen tubes can reach the micropyle as fast as 30 min to 2 h after pollination [
46], afterward assimilates flux to stigmas are cut impeding other pollen tubes or hyphae from penetrating [
47]. Thus, the competition between the fungus and the pollen grain for the ovary is established, where differential germination times to reach their targets seem to be key [
29]. Since optimal conditions for infection [
31], mainly humidity, temperature, and light, are different from those for pollination [
46,
48,
49], one might prevail over the other favored by the weather conditions at anthesis.
Ergot susceptibility as a detrimental factor can be bred against as it has an important genetic component. The severity of infection showed a large degree of genetic determination, but it was independent of variation in total seed yield. In contrast, the percentage of ergot sclerotia was negatively correlated with total seed yield and competes against the proportion of full seeds, but it was largely affected by the environment. However, the severity of infection can be used as an indirect selection trait as it correlated positively with the percentage of ergot sclerotia and negatively with the percentage of empty seeds while showing a large broad-sense heritability and is an easier trait to observe. The genetic mechanisms behind ergot resistance in grasses are still unknown and no resistance reactions are observed in the early stages of infection in susceptible plants, suggesting that the fungus is not detected by the plant as a pathogen by using specific signal components of the pollen–stigma interaction to avoid recognition. The main mechanisms affecting susceptibility are those affecting the opportunity of rapid pollination providing an escape from the infection [
29,
32]. Following penetration of the stigma surface by pollen tubes, a series of ‘gates closing’ prevent the possibility of infections [
47].
Seed yield components in forage crops are under genetic control but are also strongly influenced by environmental conditions during vegetative and reproductive development [
21], that is, the genetic variation in traits is small in comparison to the phenotypic variation observed in environments. Nevertheless, based on the genetic parameters obtained here and considering that bahiagrass is an apomictic species, clonal selection within a diverse panel of genotypes should be an effective way to develop varieties with high seed production potential. Breeding focus should be placed on those traits that are more genetically determined, either directly by seed yield or by those components that construct the seed yield potential. However, in order for that potential to be realized, it needs to be matched with an environment of high potential as well, that is, a favorable combination of hydric balance, nutrient availability, radiation, and temperature. In this regard, non-genetic factors in our experiment were co-determinants in constructing the seed yield potential but were the main determinants in fulfilling such potential, and while individually or combined explained large portions of the variation, magnifying the genotypic differences as observed in
Tacuarembó in
year 2.
Two genotypes,
TB167 and
TB249, were consistent at showing very low levels of both severity of infection and percentage of ergot sclerotia while showing a high percentage of full seeds but had low seed size resulting in medium levels of total seed yield. Conversely, genotypes
TB42,
Argentine, and
Paraguay-22 were the most productive and the top-ranked at all seed yield components, although having important levels of ergot. Through hybridization techniques [
12,
13,
14], the advantages of both groups can be combined in a single genotype to increase seed production.


