Abstract
Understanding the spatial correlation network of inter-provincial wheat production is vital for ensuring food security and achieving sustainable agricultural development in China. However, the spatial correlation characteristics of wheat production and their determinants remain unclear. In this study, an improved gravity model was used to calculate the spatial correlation of inter-provincial wheat production in China based on available panel data from 2000 to 2020. The spatial-temporal evolution characteristics and the driving factors of the spatial correlation network of inter-provincial wheat production in China were analyzed using social network analysis (SNA) and a quadratic assignment procedure (QAP). The findings indicated that (1) the spatial correlation of inter-provincial wheat production first increased and then decreased. The network density increased from its lowest value (0.2598) in 2000 to its maximum value (0.2782) in 2016 and then continued to fluctuate. (2) The spatial correlation network of inter-provincial wheat production presented a “core-periphery” distribution pattern for the major wheat-producing areas (such as Jiangsu, Anhui, and Hubei) and non- major wheat-producing areas (such as Jilin, Qinghai, Guangxi, and Beijing), and the roles of the blocks in the network varied with time and space. (3) The implementation of grain-related policies (such as the abolition of agricultural taxes, the implementation of industry nurturing agriculture, and the minimum grain purchase price policy) positively affected the development of the spatial correlation network of wheat production. Since the implementation of the minimum purchase price policy for wheat in 2006, the network density reached its maximum value (0.2782), the network efficiency reached its minimum value (0.5985), and the stability of the network structure greatly improved. (4) The interactions between the internal natural conditions and the external socioeconomic factors promoted the construction of a spatial correlation network for wheat production. The differences in geographical adjacency, land resources, temperature, and sunlight hours were all significant at the 1% level, highlighting the substantial impact of these factors on the spatial correlation intensity of wheat production in China. This study provides a reference for the development of cooperative cross-regional wheat production and the formulation of distinct policies for the production of wheat and other grains.
1. Introduction
Wheat, the third largest grain crop in China, is crucial for grain production, circulation, and consumption, and changes in wheat production and patterns exert a direct impact on food security and social stability in China [1,2]. According to the China Statistical Yearbook data, China’s planting area showed a decreasing trend from 2000 to 2020, with planting area decreasing from 26,653.28 (1000 hm2) in 2000 to 23,379.99 (1000 hm2) in 2020. With improvements in the marketization strategies of the national economy and continuous amendments to food policies, the supply and demand for major grain crops, such as wheat, have shown an imbalance [3,4,5]. As a result of free flow and trade of production materials and agricultural products between regions, grain production has grown increasingly spatially correlated, forming a more complex spatial correlation network structure [6,7,8]. Currently, the spatial correlation network of wheat production in China remains unclear. Studying the spatial correlation network of inter-provincial wheat production can provide a reference for cooperative cross-regional production of wheat and the formulation of distinct grain production policies.
Scholars have conducted research on the spatial structure of wheat production. However, only a limited number of studies have reported spatiotemporal differences in wheat production in different climatic and ecological regions via comparative analyses of wheat yield per unit area, total yield, and sown area [9]. Since 1980s, wheat yields in the major wheat-producing areas of China have fluctuated substantially. Although the wheat planting areas in the provinces of Henan, Jiangsu, and Anhui have increased considerably, those in Sichuan and Heilongjiang have decreased. Furthermore, wheat production patterns decrease toward East, Northeast, and Southwest China, with production centers concentrated in North China and Central China [10]. A study involving specific wheat-producing regions found that the productivity levels of three high-quality wheat-producing areas, the Huang–Huai–Hai region, located in the middle and lower reaches of the Yangtze River and in the Greater Khingan Mountains, increased between 2008 and 2015.
From the perspective of the space–time method, some scholars have analyzed the dynamic change law of the wheat production gravity center since the establishment of the PRC, using the method of calculating the national wheat planting area and the yield center of gravity over the years [10,11,12]. A study comparing the advantage indices of three major grain crops in China revealed that North and Northwest China have a comparatively high aggregate advantage for wheat production [13]. The spatial distribution pattern and evolution of wheat production in Jiangsu Province were analyzed using a remote sensing grid and Moran’s I index. Wheat acreage was found to have a strong regional aggregation effect, and the degree of aggregation and contiguousness increased annually [14]. Based on the production data from China’s 15 major wheat-producing areas, some scholars have found that the production efficiencies of these areas show an overall conspicuous spatial agglomeration effect [15].
The above studies explored the effects of spatiotemporal characteristics of wheat production on different spatial and temporal scales using different spatial analytical methods. However, only a few studies have been conducted on the spatiotemporal correlation characteristics of wheat production in various regions. With improvements in the agricultural market system of China and constant advancements in production factors, such as a reduction in regional restrictions and a gradual increase in spatial mobility, the spatial network of wheat production has gradually evolved to form a matrix network of “relational data” between different regions. Understanding the spatial correlation network of inter-provincial wheat production is vital for ensuring food security and achieving sustainable agricultural development in China. However, the spatial correlation characteristics of wheat production, as well as their determinants, remain unclear. The novelty of this study is that it reveals the structural characteristics of the spatial association network of wheat production in China. This study’s aim is to identify the spatial-temporal correlation model of wheat production in China. It helps provide a reference for the development of cooperative cross-regional wheat production and the formulation of distinct policies for the production of wheat and other grains.
2. Materials and Methods
2.1. Spatial Linkages of Wheat Production: A Modified Gravity Model
In the spatial correlation network of wheat production in China, each province is a network node, the spatial relationship of wheat production between provinces is represented by a line, and the strength of the relationship reflects the strength of the correlation [16]. The determination of relation is crucial to network analysis [17,18]. Stewart [19] first proposed the gravity model, which has since been applied to analyze spatial correlations [20]. This model uses cross-sectional data to describe the evolutionary trends of spatial correlation networks [21]. Here, we introduce the gravity model into the study of the spatial correlation of wheat production [6], which is expressed as follows:
where Gij represents the gravitational value of the spatial correlation of wheat production between regions i and j; Di and Dj denote the total wheat production scales of regions i and j, respectively; k is the gravitational coefficient; Lij is the center distance between regions i and j; Kij is the geographical distance between provincial capitals; and Tij is the time cost calculated by dividing the railway mileage between cities by the average speed (200 km/h). The gravity model has been modified to enhance adaptability.
The gravity model has been modified based on previous studies and is defined as shown in Equation (4). The modified Kij is the ratio of wheat yield in a region to the sum of wheat yields in two associated regions. The scale of wheat production is measured by two indicators: wheat yield and wheat planting area.
where Ai and Aj are the wheat yields of regions i and j, respectively, and Bi and Bj are the wheat planting areas in regions i and j, respectively.
2.2. Analysis of the Characteristics of the Correlation Network of Wheat Production: SNA
The SNA research method incorporates relationship as a research unit and analyzes relationship data [22]. In recent years, SNA has been widely used in various network structural analyses [17,23,24,25,26]. The structural characteristics of a wheat production correlation network were analyzed from three perspectives: overall network characteristics, individual network characteristics, and block model analysis [27].
Generally, network density, correlation, grade, and efficiency are used to describe the characteristics of an entire network. Table 1 presents the interpretations of specific indicators [6]. Network density represents the degree of closeness of the spatial correlation of wheat production among the provinces in the network. The greater the value, the stronger the relationship. Furthermore, network correlation reflects the stability and vulnerability of the network. The network is stable if there is a direct or indirect path between any two provinces in the network. Network hierarchy expresses the degree of asymmetric accessibility between provinces, which reflects whether a province has a stricter hierarchical structure in the network. Network efficiency refers to the degree of redundancy within the network. Low network efficiency indicates an increased redundancy in the network links, whereas high network stability indicates a close spatial relationship of wheat production between provinces [16].

Table 1.
Interpretation of the main indicators of the spatial correlation network characteristics of wheat production.
According to the SNA method, the characteristics of an individual network structure can be depicted using network centrality indices, such as degree centrality, betweenness centrality, and closeness centrality, from which the position and role of each member in the network can be determined [28]. Degree centrality measures the degree of centrality of each province in a network based on the number of network connections. The greater the number of connections a province has, the higher its network status, which is reflected in the degree of control it has over others.
The primary method used in SNA for spatial clustering analysis is the block model [29]. For this, there are four types of classification criteria [16,30,31]: (1) net spillover block, where the number of outgoing relationships is much larger than the number of received relationships; (2) net benefit block, where the number of outgoing relationships is much smaller than the number of received relationships; (3) broker block, where the number of outgoing relationships is greater than the number of received relationships, and this criterion plays an intermediary role in the network; and (4) bilateral spillover block, where there is no substantial difference between the number of outgoing and received relationships.
2.3. Research Data
Because of a lack of data availability, thirty provinces (autonomous regions and municipalities directly under the central government) were selected as the network nodes (Hainan, Hong Kong, Macao, and Taiwan were excluded). The data for the gravity model, which covered the years 2000 to 2020, were obtained from the China Statistical Yearbook, the China Rural Statistical Yearbook, the statistical yearbooks of provinces and cities in the corresponding years, and the National Bureau of Statistics website (http://www.stats.gov.cn/). Provincial railway mileage data were derived from the “Odometer between the major stations of the National Railway” of the China Transportation Atlas.
China is divided into East China, South China, Central China, North China, Northwest China, Southwest China, Northeast China, Taiwan, Hong Kong, and Macao. The specific divisions are listed in Figure 1.
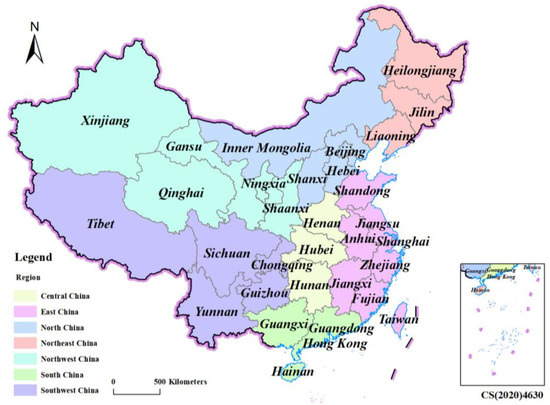
Figure 1.
Administrative and geographical divisions of China.
3. Analysis and Formation Mechanism of the Spatial Correlation Network Characteristics of Wheat Production
3.1. Overall Network Characteristics and Evolution
The spatial relationship of wheat production in China was determined using the gravity model. For example, this study combined the data from 2020 with ArcGIS software to obtain a spatial correlation network map of wheat production in China (Figure 2). The map highlights the notable network structural characteristics of China’s wheat production among the provinces. Furthermore, the correlation intensities of wheat production in Hebei, Jiangsu, Shandong, Anhui, and Hubei with other provinces were significantly greater than those in other provinces. Four indicators (network density, network correlation, network grade, and network efficiency) were selected to assess the characteristics and analyze the time series of the spatial correlation network.
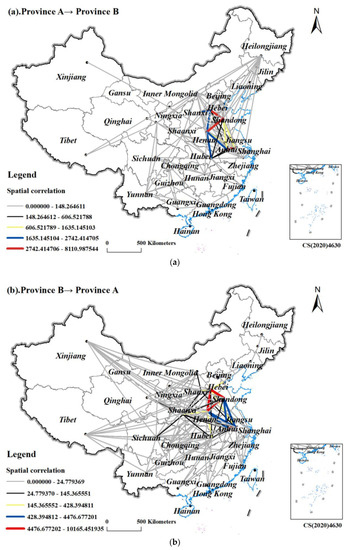
Figure 2.
Spatial correlation network of wheat production in China in 2020 ((a,b) reflect the difference in the transmission direction as well as the intensity of the relationship between provinces. (a) Province A → province B; (b) province B → province A).
3.1.1. Network Density
The spatial correlation network density and the number of network relationships for wheat production in China from 2000 to 2020 are shown in Figure 3. The results show that the network density is consistent with the change in the number of network relationships. The network density in 2000 and 2020, which first increased and then decreased, was 0.2598. During the ninth five-year plan period, grain output remained at 500 billion kg. Subsequent years of good harvest boosted food stocks, resulting in lower food prices, and the restructuring of agricultural production eventually led to a general decline in the production of food crops, such as wheat, with the lowest network density in 2000. Since 2004, the state has implemented agriculture-related policies to protect arable land, support grain purchases at the lowest purchase price, and reduce and eliminate taxes. These policies encourage farmers to grow grain, which helps achieve restorative growth in wheat production, strengthen inter-provincial trade and distribution of wheat, and promote inter-regional flow of production factors for rapid economic development. All of these factors contributed to an increase in network density. Since 2006, a minimum purchase price policy for wheat has been implemented in six major wheat-producing provinces, including Hebei and Jiangsu, with the network density reaching a maximum of 0.2782 in that year. In 2008, wheat production in China was impacted by a financial crisis, causing the network density of the spatial correlation network to decrease to 0.2644. From 2018 to 2020, the overall network density was stable; however, the overall density value was small, and considerable scope for improvement remained.
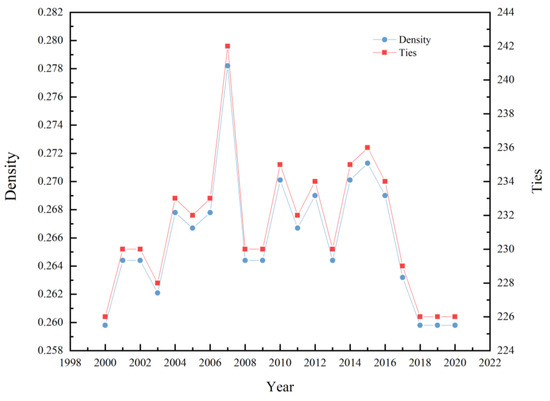
Figure 3.
Network density and network ties.
3.1.2. Network Correlation
The changes in the level and efficiency of the spatial correlation network of China’s wheat production from 2000 to 2020 are shown in Figure 4. The correlation degree of the inter-provincial wheat production correlation network is one, indicating that there are significant spatial correlations and spillover effects in China’s inter-provincial wheat production. The trend in the network grade contradicts that of the network density. The network level remained stable between 2000 and 2007. After the 2008 financial crisis, the network level began to rise rapidly, and overall network efficiency began to decline. A more stringent and/or gradually formed network level is not conducive to the coordinated development of inter-provincial wheat production. In 2004, the central government issued the No. 1 document on agriculture, rural areas, and farmers, and implemented a new agricultural policy to eliminate agricultural taxes and encourage industry nurturing agriculture [32]. In 2006, the minimum purchase price of wheat was implemented, and agricultural tax was abolished nationwide, resulting in a considerable downward trend in network efficiency. This indicated that the number of connections in the correlation network increased, the multiple superposition effect became increasingly evident, and the stability of the spatial network structure continued to increase [29]. In general, the spatial structure of wheat production with a strict network hierarchy was not disrupted; however, the number of inter-regional wheat production associations steadily increased, and the overall network structure remained stable.
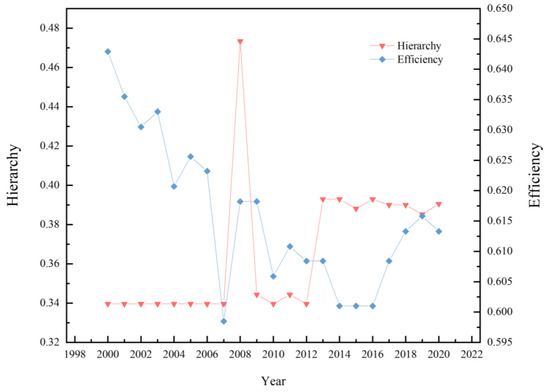
Figure 4.
Network hierarchy and network efficiency.
3.2. Individual Network Characteristics
The network diagrams regarding degree centrality, closeness centrality, and betweenness centrality in the years 2000, 2005, 2010, 2015, and 2020 are depicted in Figure 5. As an example, 2020 was selected to analyze the characteristics of each province in the spatial correlation network of wheat production (Table 2).
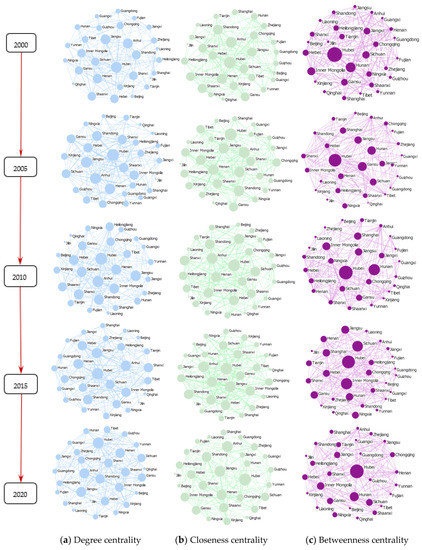
Figure 5.
Individual network characteristics.
Table 2.
Network centrality analysis of the spatial correlation network of inter-provincial wheat production in 2020.
3.2.1. Degree Centrality
The degree centralities of the networks in 2000, 2005, 2010, 2015, and 2020 are shown in Figure 5a. Hebei, Shanxi, Henan, Shandong, Anhui, Hubei, Jiangsu, Sichuan, and Shaanxi had a high degree centrality, implying that other provinces are strongly dependent on these provinces. In 2020, the average degree centrality for each province in the correlation network was 15.067, with 13 provinces exceeding the average, the majority of which, with the exception of Chongqing and Tibet, were China’s major wheat-producing areas (Table 3) [15,33]. Hubei, located in the center of the spatial network, had the highest degree centrality (22). Beijing, Liaoning, and Qinghai had low degree centralities, with a weak correlation with other provinces. The mean in-degree and out-degree values were 7.533. The out-degrees of 11 provinces, including Jiangsu, Anhui, Hubei, and Henan, were greater than the average value (7.533). The provinces with an out-degree greater than their in-degree had notable spillover effects in the network. Meanwhile, in the provinces where the in-degree was greater than the out-degree, such as Sichuan, the out-degree (12) was greater than the in-degree (9), and these provinces benefited more from the network spillover. In some provinces, when the in-degree was greater than the mean, the out-degree was greater than the in-degree, indicating a spillover effect. The provinces with high in-degrees are the beneficiaries of the associated network.
Table 3.
Important wheat-producing regions in China.
3.2.2. Closeness Centrality
The closeness centralities of the networks in 2000, 2005, 2010, 2015, and 2020 are shown in Figure 5b. Hubei, Anhui, Henan, Shandong, Jiangsu, and Shaanxi played important roles in the network, with high closeness centralities and close associations with other provinces. The average centrality in 2020 was 61.212, with 16 provinces being above the average, including Hubei, Jiangsu, Anhui, and Henan, most of which were the major wheat-producing areas in China and the central actors in the network. Hubei had the highest closeness centrality (80.556), which was the central point of the network; the other provinces in the network were closest to Hubei. Non-major wheat-producing areas, such as Beijing, Liaoning, and Qinghai, had lower closeness centralities and smaller wheat production scales, making them the marginal actors in the network.
3.2.3. Betweenness Centrality
The betweenness centralities of the networks in 2000, 2005, 2010, 2015, and 2020 are shown in Figure 5c. Hubei, Anhui, Henan, Shandong, Jiangsu, and Shaanxi were located in the central part of the network. The higher the intermediary centrality, the more evident the intermediary status of the network members. In 2020, the average intermediary centrality was 8.478, with 13 provinces, including Hebei, Shanxi, Inner Mongolia, and Heilongjiang, being above the average. The top-ranked provinces were mostly wheat-producing areas at the center of the network and had a strong control over the spatial association of other provinces. Meanwhile, Jilin, Qinghai, Guangxi, Beijing, and other provinces with low intermediary centrality had a weak control over wheat production in other provinces.
3.3. Block Model
Using the convergent correlations method in Ucinet 6.0, the maximum segmentation depth was estimated to be two, and the concentration standard was 0.2. The wheat production of the 30 provinces in China was divided into four blocks, and the spillover effect relationship of the four blocks was obtained (Table 4). In 2000, 2005, 2010, 2015, and 2020, the total number of relationships in the correlation network of China’s inter-provincial grain production was 226, 232, 235, 236, and 226, respectively. The internal relationship coefficient of each block was 132, 142, 127, 117, and 112, respectively. The number of internal relationships in each block was 94, 90, 108, 119, and 114, respectively; that is, the grain production between the blocks had evident spatial correlation and spillover effects.
Table 4.
Analysis of the spillover effect of each block in the spatial correlation network of wheat production.
The division of the blocks between 2000 and 2015 was the same. Blocks I and III belonged to the “net benefit block.” The number of outgoing relationships sent to other blocks was considerably less than the number of relationships received. Block IV received some relationships from other blocks; however, the spillover relationship was higher, corresponding to the characteristics of a “broker block.” The spillover of block II to other blocks was higher than the relationships received, and the net spillover effect within the block was evident, which was consistent with a “net spillover block.” In 2005, the role of block IV changed; it not only received spillovers from other blocks but also increased its spillovers to other blocks, corresponding to the characteristics of a “bilateral spillover.” In 2010, the roles of blocks I and II remained unchanged, whereas blocks III and IV changed to a “broker block” and a “net benefit block,” respectively. In 2020, blocks I and IV exchanged roles, whereas those of blocks II and III remained unchanged. The “broker block” was at the center of the network. Between 2000 and 2020, members of this block exhibited an upward trend, the number of relationships received from other blocks increased considerably, and the effect of spatial correlation between the blocks became increasingly evident.
The network density matrix was calculated to investigate the correlations and spillover paths of wheat production between the blocks. By comparing the network density with block density, the blocks with densities greater than the network densities were assigned one; otherwise, they were assigned zero, thus converting the density matrix into an image matrix (Table 5) [6]. For example, in 2020, the overall network density was 0.2598. If the density of a block was greater than 0.2598, the density was set to one in the image matrix; otherwise, the density was set to zero. From the image matrix, the relationships and transmission mechanisms between the wheat production blocks were observed, and a correlation diagram was drawn (Figure 6). The diagonal elements of the image matrix in 2000 and 2005 were all assigned one, indicating that wheat yield had a clear correlation in the blocks and that a club clustering effect was produced.
Table 5.
Density and image matrices of the spatial correlation network of wheat production.
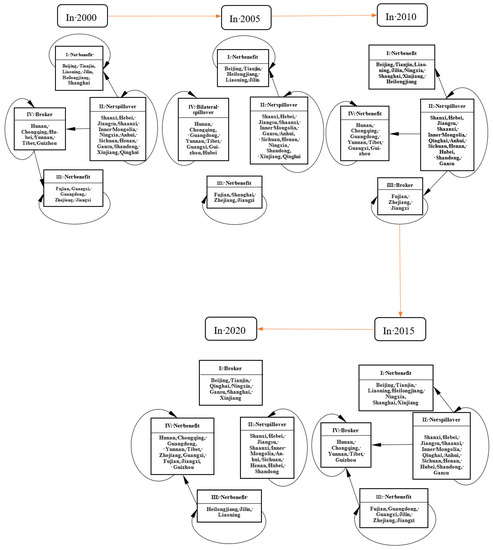
Figure 6.
Spillover relationships between the blocks.
Specifically, there was a correlation between blocks I and III in 2000. Block II had a spillover effect on blocks I and IV in addition to its correlation. Similarly, in addition to its own internal correlation, block IV received a spillover effect from block II and also had a spillover effect on block III, playing an intermediary role in the correlation network [34]. In 2005, the spillover effect of block IV on block III weakened. In 2020, the internal correlation of block I was reduced, whereas the spillover effect of block II on block III increased. In 2015, the spillover effect of block II decreased, and the spillover effect of block IV on block III increased. In 2020, in addition to the linkages between blocks II, III, and IV, block II had a spillover effect on block I. In general, the blocks in the spatial correlation network of wheat production in China have their own advantages, assume their respective roles, and demonstrate a linkage effect of the coordinated development of all provinces in the country.
3.4. Formation Mechanism of Associated Networks
3.4.1. Driving Factor Selection and Model Establishment
The formation and changes in spatial correlation networks of inter-provincial wheat production are related to the influence of natural conditions and socioeconomic factors. In this study, internal natural conditions, such as differences in population size, water resources, land resources, meteorological conditions, and external social and economic aspects, such as differences in geographical adjacency, economic development level, industrial structure level, rural labor force scale, and agricultural mechanization scale, were selected as the driving factors to explore the structure of the spatial correlation network of inter-provincial wheat production.
Specifically, we included the following driving factors:
- (1)
- Geographical adjacency (Distance), represented by an inter-provincial Rook adjacency weight matrix.
- (2)
- Economic development level (Pgdp): the difference between regional economic development levels, characterized by the difference in the provincial per capita GDP (yuan).
- (3)
- Industrial structure level (Indus): the difference in the proportion of the tertiary industry (in GDP) among provinces was used to represent the difference in the industrial structures.
- (4)
- Scale of the rural labor force (Labor) and scale of agricultural mechanization (Mech): the differences in the number of agricultural employees (Labor) and the total power of rice and wheat combine harvesters in various regions (Mech) were used to characterize the differences in the scale of rural labor forces and agricultural mechanization services.
- (5)
- Population size (Popus): the population in a region determines the food consumption in that region. As one of the main food sources, wheat production is affected by regional population size. If the wheat production in a region exceeds the basic needs of the domestic population, surplus wheat can be exported. In contrast, the wheat demand in a region can be met by imports. The difference in population size was characterized by the difference in the total population at the end of the year in each region.
- (6)
- Water resources (Water): renewable water resources are an essential natural condition. The quantity and quality of renewable water resources can ensure national food security, maintain the wheat production network pattern, and be used to characterize the differences in water resources between regions (regional per capita water resources).
- (7)
- Land resources (Land): population growth exerts great pressure on cultivated land resources, affecting wheat supply and regional differences in wheat production. The difference in the proportion of wheat sown area to the sown area of agricultural products in each region was used to characterize the differences in cultivated land resources between regions.
- (8)
- Meteorological conditions (Climate): temperature, precipitation, sunshine hours, and other indicators of regional differences are characterized by differences in meteorological conditions. Therefore, the driving force measurement model is established as follows:
F = f(Distance, Pgdp, Indus, Labor, Mech, Popus, Water, Land, Temp, Prec, Sun).
3.4.2. Correlation Analysis Based on the QAP Method
A QAP correlation analysis compares the similarities of two matrices using repeated sampling, and then it calculates and tests the correlation coefficient between the matrices [35], making it a feasible method for optimization with orthogonality constraints. For the QAP correlation analysis, the years 2000, 2004, 2008, 2012, 2016, and 2020 were selected as the typical years, and 5000 random replacements were selected (Table 6). The results indicate a strong correlation between these driving factors and the spatial correlation network of inter-provincial wheat production. However, the correlation coefficients of the spatial correlation matrix F, distance, and land use are not significant at the 1% level. This indicates that regional differences in distance and cultivated land resources do not affect the spatial correlation between fertilizer supply and demand. The correlation coefficients between the spatial correlation network of wheat production and geographical distance, land resources (Land), temperature (Temp), precipitation (Prec), and sunlight hours (Sun) all pass the significance test, indicating that these driving factors have a strong correlation with the spatial correlation network of wheat production in China. However, the correlation coefficients between the differences in economic development level (Pgdp), industrial structure level (Indus), rural labor scale (Labor), agricultural mechanization scale (Mech), population size (Popus), and water resources (Water) do not pass the significance test, indicating that these driving factors have no effect on the network correlation. Geographical adjacency, land resources, temperature, precipitation, and sunlight hours all have an impact on the spatial correlation network of wheat production in China.
Table 6.
QAP correlation analysis of the spatial correlation network and the driving factors of wheat production in China.
3.4.3. Regression Analysis Based on the QAP Method
The QAP regression analysis was used to study the regression relationship between multiple matrices and to assess the significance of the coefficient of determination (R2). The matrices of economic development level (Pgdp), industrial structure level (Indus), rural labor force scale (Labor), agricultural mechanization scale (Mech), population size (Popus), and water resources (Water) did not pass the QAP correlation analysis. Therefore, these variables were excluded from the regression analysis. The results of the analysis are presented in Table 7.
Table 7.
QAP regression analysis of the spatial correlation network and the driving factors of wheat production in China.
The results show that the adjusted R2 of the six years ranges between 0.214 and 0.253 and is significant at the 1% level. Previous studies based on the QAP method found that the R2 value ranged between 12.5% and 40.3% [31,32,33]. In this study, the R2 values are relatively moderate, and the overall fitting effect is good. Furthermore, the results show that, in addition to precipitation, the influences of geographical proximity, land resources, temperature, and sunshine hours on the spatial correlation network of wheat production in China are significant. Moreover, when comparing the regression results of the six time points, the influence direction and the degree of different driving factors on the correlation network change over time, demonstrating evident differentiation characteristics. Specifically, (1) the coefficient of geographical proximity is stable and positive, indicating that geographical proximity can strengthen the spatial correlation of inter-provincial wheat production. (2) The coefficient of land resources is significantly negative; that is, the greater the difference in land resources between the regions, the weaker the correlation intensity of wheat production, the smaller the area of wheat-cultivated land, the smaller the demand for wheat, and the larger the area of cultivated land that can meet the demand for wheat in a region. (3) The difference in meteorological conditions has a major impact on the strength of wheat production correlation. Except for precipitation, all of the other coefficients pass the significance test and are negative, reducing the strength of the wheat production correlation.
4. Discussion
4.1. Consistency of Research Results
In this study, we explored the spatial network linkages of wheat production among Chinese provinces using a modified gravity model and ArcGIS visualization tools, and we found that wheat production in China exhibited a distinct spatial network pattern. These findings suggest that food security and sustainable agricultural development must be collaborative, with an emphasis on inter-regional factor synergy, to achieve sustainable agricultural development. This result is consistent with the findings of Zuo [36]. In addition, the major wheat-producing provinces are the central actors in the network. Significant spatial correlations and spillover effects were observed among the provinces in the spatial correlation network, which was also confirmed by Feng et al. [6]. Furthermore, the free flow and trade of production materials and agricultural products across the regions steadily strengthened the connectivity and synergy of wheat production in various regions, making the spatial correlation among the regions dynamic and balanced; this result is in agreement with Turner et al. [37]. Finally, in terms of the factors influencing the spatial correlation network of wheat production, differences in geographical proximity, land resources, temperature, and sunlight hours had a considerable impact on the spatial network correlation, as highlighted by Xu et al. [38].
4.2. Differences in Research Methods
The use of both SNS and QAP research methods to reveal the spatial relationship between wheat production provides a new perspective. The panel data for wheat production from 2000 to 2020 were selected from the research data to compensate for the lack of previous research on the spatial relationship of wheat production. Zhou et al. [39] used geographic detectors to explore the spatial relationship between county distribution and spatial influencing factors. Lu and Mei [40] used Moran’s I index and panel data combined with a spatial error model to empirically analyze the causes of changes in the spatial pattern of China’s grain production. The research methods used were different and comprised the traditional ESDA method and spatial measurement technology. It is limited to the measurement of geographical spatial proximity or distance relationship between regions, making it difficult to comprehend the structural characteristics of the overall spatial correlation of inter-provincial grain production dynamically.
4.3. Agricultural Sustainable Development and Policy Implications
Based on the above research, the following conclusions are drawn: First, the characteristics of the overall network structure showed a significant spatial correlation and spillover effect on China’s wheat production. The network density first increased and then decreased, and the network level fluctuated, forming a trend that was not conducive to the coordinated development of inter-provincial wheat production. The intensification of inter-provincial spatial correlation is determined not only by the scale of wheat production in the wheat-producing areas, but also by the scale of wheat production in other regions. Therefore, the development of wheat-related policies must consider the spatial correlations between regions. It is necessary to constantly adjust and optimize the structure of the spatial correlation network of wheat production to improve the spatial allocation efficiency of wheat production between regions. Second, the spatial correlation network of China’s provincial wheat production showed a significant “core-periphery” distribution pattern. The core (major wheat-producing area) and peripheral areas (non-major wheat-producing area) were interdependent. Relevant policies should be formulated to strengthen trade exchanges between these areas and assist in the development of non-main wheat-producing areas. Third, the status of each province in the network and the function of each block were different. Therefore, it is necessary to fully consider the block characteristics of the network, formulate and implement wheat policies with different characteristics, implement classification management of wheat production space according to local conditions, and fully acknowledge the relationships between provinces. Finally, it is necessary to consider the factors that drive geographical adjacency. Geographically adjacent provinces have lower costs for wheat production exchanges and cooperation. With the gradual upgrading of the industrial structure, more transmission paths should be created for trade between provinces in the major and non-major wheat-producing areas.
4.4. Limitations and Future Directions
The data used in this study were obtained from the Statistical Yearbook because of data acquisition feasibility; thus, the data type is relatively single, and the driving factors are limited by the data year, which are the fundamental limitations of this study. The determinants affecting wheat production are limited by the data year, resulting in incomplete driving factors. Future research should explore these aspects extensively. In future research, the use of remote sensing images, observation data, land-use types, and other multivariate data combined with machine learning methods [41,42] and other updated research methods would provide a more comprehensive and in-depth understanding of the driving factors behind the spatial correlation network of wheat production.
5. Conclusions
Based on the perspective of complex networks, this study revealed the spatial relationship between inter-provincial wheat production in China. An improved gravity model was combined with ArcGIS visualization to measure the spatial correlation of inter-provincial wheat production. SNA and QAP were used to reveal the correlation characteristics of wheat production and the driving factors behind the spatial correlation networks of inter-provincial wheat production in China. The following conclusions are drawn:
- (1)
- The characteristics of the overall network structure showed a significant spatial correlation and spillover effect on China’s wheat production. The network density first increased and then decreased, and the network density increased from the lowest value (0.2598) to the highest value (0.2782) in 2000, and then it fluctuated and decreased, indicating that there is still considerable potential for promoting closer exchanges and cooperation in wheat production between provinces. The fluctuating network grade gradually developed a trend that was not conducive to the coordinated development of inter-provincial wheat production. Although the spatial correlation of wheat production with a strict network hierarchy was not broken, the relationship coefficient of interregional wheat production and the stability of the overall network gradually increased.
- (2)
- Based on the results of the individual network structure between 2000 and 2020, the average degree centrality in each province in 2020 was 15.067, with 13 provinces exceeding the average. The average centrality in 2020 was 61.212. Hubei, the major wheat-producing area, had the highest closeness centrality score (80.556). The average betweenness centrality value in 2020 was 8.478, with 13 provinces exceeding the average. The top-ranked provinces, which had substantial control over the spatial association of other provinces, were mostly wheat-producing areas at the center of the network. The spatial correlation network of China’s provincial wheat production exhibited a significant “core-periphery” distribution pattern. There was a clear spillover effect, with the major wheat-producing areas in the network functioning as the central actors, and the non- major wheat-producing areas functioning as the marginal actors.
- (3)
- The block model results for 2000, 2005, 2010, 2015, and 2020 were analyzed. In 2000 and 2015, blocks I and III belonged to the “main benefit block,” whereas block II was the “net spillover block.” In 2005, the role of block IV changed. In 2010, the roles of blocks I and II remained constant. Blocks III and IV were the “broker block” and “main beneficiary block,” respectively. In 2020, blocks I and IV exchanged roles, whereas the roles of blocks II and III remained unchanged. The provinces of Shanxi, Hebei, Jiangsu, Shaanxi, Inner Mongolia, and Anhui, which were concentrated in wheat-rich areas, acted as the “net spillover blocks” in the network, and the spillover effect on other provinces was noticeable. In addition, these provinces were correlated with other provinces, and there was a significant bilateral spillover effect. Most provinces in the major wheat-producing areas belonged to the “broker block,” which was at the center of the network and acted as a bridge. The non- major wheat-producing areas primarily played a “net benefit” role in the network and were subject to the spillover effects from other blocks.
- (4)
- The results of the QAP analysis showed that the interactions between the internal natural conditions and the external socioeconomic factors promoted the formation of a spatial correlation network of wheat production. The differences in geographical adjacency, land resources, temperature, and sunshine hours were significant at the 1% level and impacted the spatial correlation intensity of wheat production in China; however, the impact of precipitation was not significant.
Author Contributions
Writing—original draft, Visualization, Writing—review and editing, Methodology and Software, X.L.; Funding acquisition and Methodology, H.Z.; Funding acquisition, Supervision and Conceptualization, J.L.; Funding acquisition and Supervision, Y.Z. All authors have read and agreed to the published version of the manuscript.
Funding
This study was supported by the Natural Science Foundation of Anhui Province (No. 2108085MD129), the National Key R & D Program of China (No. 2018YFD1100104), and the College Student Entrepreneurship Project of Anhui Agricultural University (No. X202210364342, X202210364488).
Institutional Review Board Statement
Not applicable.
Informed Consent Statement
Not applicable.
Data Availability Statement
The data used to support the findings of this study are available from the corresponding author upon request via email.
Conflicts of Interest
The authors declare that they have no known competing financial interests or personal relationships.
References
- He, Z.H.; Zhuang, Q.S.; Cheng, S.H.; Yu, Z.W.; Zhao, Z.D.; Liu, X. Wheat Production and Technology Improvement in China. J. Agric. 2018, 8, 107–114. [Google Scholar] [CrossRef]
- Yang, B.H.; Zhu, Y.; Zhou, S.J. Accurate Wheat Lodging Extraction from Multi-Channel UAV Images Using a Lightweight Network Model. Sensors 2021, 21, 6826. [Google Scholar] [CrossRef] [PubMed]
- Hu, T.; Ju, Z.S.; Zhou, W. Regional pattern of grain supply and demand in China. Acta Geogr. Sin. 2016, 71, 1372–1383. [Google Scholar] [CrossRef]
- Yang, W.M.; Li, B.J. Prediction of grain supply and demand structural balance in China based on grey models. Grey Syst. Theory Appl. 2021, 11, 253–264. [Google Scholar] [CrossRef]
- Wang, X.; Qiang, W.L.; Niu, S.W.; Growe, A.; Yan, S.M.; Tian, N. Multi-Scenario Simulation Analysis of Grain Production and Demand in China during the Peak Population Period. Foods 2022, 11, 1566. [Google Scholar] [CrossRef]
- Feng, Y.; Hou, M.Y.; Yao, S.B. Structural characteristics and formation mechanism of spatial correlation network of grain production in China. Acta Geogr. Sin. 2020, 75, 2380–2395. [Google Scholar] [CrossRef]
- Zhang, Y.J.J.; Li, Z. Research on spatial correlation network structure of inter-provincial electronic information manufacturing industry in China. Sustainability 2019, 11, 3534. [Google Scholar] [CrossRef]
- Ma, X.; Guo, F.L.; Wang, W.B.; Gao, Y.X. Research on Spatial Network Correlation and Influencing Factors of Information Entropy of Carbon Emission Structure in China. Chin. J. Eco-Agric. 2022, 30, 543–557. [Google Scholar] [CrossRef]
- Jiang, H.F.; Pan, X.B.; Wu, W.L. Analysis of spatial and temporal variation and regional advantages of wheat production in China. Chin. J. Agric. Resour. Reg. Plan. 2005, 26, 39–42. [Google Scholar]
- Yang, C.; Lu, W.C. Empirical analysis of grain production spatial distribution changing in China. Econ. Geogr. 2008, 28, 813–816. [Google Scholar]
- Lu, B.; Ding, B.; Lv, X.T.; Yu, Z.W.; Zhao, G.C.; Wan, F.S. Arrangement Planning of Chinese Wheat Ascendant Regions. Chin. J. Agric. Resour. Reg. Plan. 2010, 31, 6–12. [Google Scholar]
- Yang, J.C.; Lei, S.L.; Ge, W. Analysis of the Track and Variation of Wheat Production Gravity Centre of China from 1949 to 2005. Chin. Agric. Sci. Bull. 2008, 24, 504–509. [Google Scholar]
- Yu, X.Z.; Wei, S.Z.; Mei, C.W.; Xing, D.A.; Fu, C.; Jian, Z.W. Spatial characteristics of production advantages of three We redrawn the table grain crops at county scale in China. J. China Agric. Univ. 2012, 17, 21–29. [Google Scholar]
- Sun, L.; Dan, J.; Qiu, L.; Wang, Z.M.; Mao, L.J.; Huang, X.J. Monitoring the dynamic changes of wheat spatial distribution in Jiangsu Province. J. Agric. Sci. Technol. 2018, 20, 55–56. [Google Scholar] [CrossRef]
- Li, H.S.; Hu, C.P.; Qu, C.H.; Wang, Z.M.; Mao, L.J.; Huang, X.J. Analysis of spatial-temporal evolution characteristics of production efficiency in main wheat producing areas in China. Chin. J. Agric. Resour. Reg. Plan. 2018, 39, 91–99. [Google Scholar]
- Qu, H.J.; Yin, Y.J.; Xing, W.W.; Wang, W.Y.; Zhou, C.; Li, J.L. Spatial-temporal characteristics and driving factors of the chemical fertilizer supply/demand correlation network in China. Environ. Sci. Pollut. Res. 2022, 29, 80532–80548. [Google Scholar] [CrossRef]
- Carrington, P.J.; Scott, J. The SAGE Handbook of Social Network Analysis; SAGE Publications Ltd: Thousand Oaks, CA, USA, 2014. [Google Scholar]
- Liu, N.N.; Liu, C.Z.; Xia, Y.F.; Da, B.W. Examining the coordination between urbanization and eco-environment using coupling and spatial analyses: A case study in China. Ecol. Indic. 2018, 93, 1163–1175. [Google Scholar] [CrossRef]
- Stewart, J.Q. Demographic gravitation: Evidence and applications. Sociometry 1948, 11, 31–58. [Google Scholar] [CrossRef]
- Tang, F.H.; Tang, H.; Sun, Q.; Tang, D.S. Analysis of the economic network structure of urban agglomerations in the middle Yangtze River. Acta Geogr. Sin. 2013, 68, 1357–1366. [Google Scholar] [CrossRef]
- Liu, H.J.; Liu, C.M.; Sun, Y.N. Study on the characteristics and effects of spatial correlation network structure of energy consumption in China. China Ind. Econ. 2015, 33, 83–95. [Google Scholar]
- Borgatti, S.P.; Mehra, A.; Brass, D.J.; Labianca, G. Network analysis in the social sciences. Science 2009, 323, 892–895. [Google Scholar] [CrossRef] [PubMed]
- Oliveira, M.; Gama, J. An overview of social network analysis. WIREs Data Min. Knowl. Discov. 2012, 2, 99–115. [Google Scholar] [CrossRef]
- Shi, C.; Li, L.; Chiu, Y.H.; Pang, Q.; Zeng, X. Spatial differentiation of agricultural water resource utilization efficiency in the Yangtze River Economic Belt under changing environment. J. Clean. Prod. 2022, 346, 131200. [Google Scholar] [CrossRef]
- Nyirahabimana, H.; Turinawe, A.; Lederer, J.; Karungi, J.; Herrnegger, M. What Influences Farmer’s Adoption Lag for Soil and Water Conservation Practices? Evidence from Sio-Malaba Malakisi River Basin of Kenya and Uganda Borders. Agronomy 2021, 11, 1985. [Google Scholar] [CrossRef]
- Sereenonchai, S.; Arunrat, N. Understanding food security behaviors during the COVID-19 pandemic in Thailand: A review. Agronomy 2021, 11, 497. [Google Scholar] [CrossRef]
- Xu, H.C.; Li, Y.L.; Zheng, Y.J.; Xu, X.B. Analysis of spatial associations in the energy–carbon emission efficiency of the transportation industry and its influencing factors: Evidence from China. Environ. Impact Assess. Rev. 2022, 97, 106905. [Google Scholar] [CrossRef]
- Freeman, L.C. Centrality in social networks conceptual clarification. Soc. Netw. 1978, 1, 215–239. [Google Scholar] [CrossRef]
- White, H.C.; Boorman, S.A.; Breiger, R.L. Social Structure from Multiple Networks. I. Blockmodels of Roles and Positions. Am. J. Sociol. 1976, 81, 730–780. [Google Scholar] [CrossRef]
- Wasserman, S.; Faust, K. Social Network Analysis: Methods and Applications; Cambridge University Press: Cambridge, UK, 1994. [Google Scholar]
- Anovitz, L.M.; Cole, D.R. Characterization and Analysis of Porosity and Pore Structures. Rev. Mineral. Geochem. 2015, 80, 61–164. [Google Scholar] [CrossRef]
- Chen, J.H. The evolution and enlightenment of agricultural policy in the 40 years of reform and opening up. China Co-Oper. Econ. 2019, 32, 51–54. [Google Scholar]
- Regional layout planning of national advantageous agricultural products (2008–2015). China Daily, 12 September 2008; 005.
- Zhao, L.; Gao, X.T.; Liu, Y.X.; Han, Z.L. Analysis of the evolution characteristics of spatial correlation network structure of inclusive green efficiency in China. Econ. Geogr. 2021, 41, 69–78+90. [Google Scholar]
- Wen, Z.W.; Yin, W.T. A feasible method for optimization with orthogonality constraints. Math. Program. 2013, 142, 397–434. [Google Scholar] [CrossRef]
- Zuo, L.J.; Wang, X.; Zhang, Z.X.; Zhao, X.L.; Liu, F.; Yi, L.; Liu, B. Developing grain production policy in terms of multiple cropping systems in China. Land Use Policy 2014, 40, 140–146. [Google Scholar] [CrossRef]
- Turner, B.L.; Menendez III, H.M.; Gates, R.; Tedeschi, L.O.; Atzori, A.S. System dynamics modeling for agricultural and natural resource management issues: Review of some past cases and forecasting future roles. Resources 2016, 5, 40. [Google Scholar] [CrossRef]
- Xu, Z.Y.; Song, Z.W.; Deng, A.X.; Chen, W.M.; Chen, F.; Zhang, W.J. Research on driving factors and spatial pattern change of main grain crops production in China in recent 30 years. J. Nanjing Agric. Univ. 2013, 36, 79–86. [Google Scholar] [CrossRef]
- Zhou, L.; Zhen, F.; Wang, Y.Q.; Xiong, L.Y. Modeling the Spatial Formation Mechanism of Poverty-Stricken Counties in China by Using Geographical Detector. Sustainability 2019, 11, 4752. [Google Scholar] [CrossRef]
- Lu, W.; Yan, M. Empirical Studies on the Variation and Contributing Factors of Regional Grain Production Strcuture in China—Based on Spatial Econometrics Models. J. China Agric. Univ. (Soc. Sci. Ed.) 2007, 9, 140–152. [Google Scholar]
- Li, Y.N.; Zheng, R.; Wu, Y.Z.; Chu, K.Q.; Xu, Q.M.; Sun, M.Z.; Smith, Z.J. A low-cost, automated parasite diagnostic system via a portable, robotic microscope and deep learning. J. Biophotonics 2019, 12, e201800410. [Google Scholar] [CrossRef]
- Wang, S.; Dong, H.; Shen, W.Z.; Yang, Y.; Li, Z.G.; Liu, Y.; Wang, C.W.; Gu, B.; Zhang, L. Rapid SERS identification of methicillin-susceptible and methicillin-resistant Staphylococcus aureus via aptamer recognition and deep learning. RSC Adv. 2021, 11, 34425–34431. [Google Scholar] [CrossRef]


Disclaimer/Publisher’s Note: The statements, opinions and data contained in all publications are solely those of the individual author(s) and contributor(s) and not of MDPI and/or the editor(s). MDPI and/or the editor(s) disclaim responsibility for any injury to people or property resulting from any ideas, methods, instructions or products referred to in the content. |
© 2023 by the authors. Licensee MDPI, Basel, Switzerland. This article is an open access article distributed under the terms and conditions of the Creative Commons Attribution (CC BY) license (https://creativecommons.org/licenses/by/4.0/).