Article

Modeling the Effects of Rice-Vegetable Cropping System Conversion and Fertilization on GHG Emissions Using the DNDC Model

College of Agronomy, Qingdao Agricultural University, Qingdao 266109, China
*
Authors to whom correspondence should be addressed.
Agronomy 2023, 13(2), 379; https://doi.org/10.3390/agronomy13020379
Submission received: 30 November 2022 / Revised: 19 January 2023 / Accepted: 26 January 2023 / Published: 28 January 2023
(This article belongs to the Special Issue Effects of Tillage, Cover Crop and Crop Rotation on Soil)

Abstract

:
The cropping system conversion, from rice to vegetable, showed various influences on the greenhouse gases (GHG) emission with conversion time and fertilizer/irrigation management. In this study, we evaluated the DeNitrification-DeComposition (DNDC) model for predicting carbon dioxide (CO2), methane (CH4), nitrous oxide (N2O) emissions and crop yields as rice converted to vegetable cropping system under conventional or no fertilization from 2012 to 2014. Then, we quantified the long-term (40 years) impacts of rice-vegetable cropping system conversions and fertilization levels (0, 50, 100 and 150% conventional fertilization rate) on GHGs emissions and global warming potentials (GWP) using the calibrated model. The DNDC model-simulated daily GHG emission dynamics were generally consistent with the measured data and showed good predictions of the seasonal CH4 emissions (coefficient of determination (R2) = 0.96), CO2 emissions (R2 = 0.75), N2O emissions (R2 = 0.75) and crop yields (R2 = 0.89) in response to the different cropping systems and fertilization levels across the two years. The overall model performance was better for rice than for vegetable cropping systems. Both simulated and measured two-year data showed higher CH4 and CO2 emissions and lower N2O emissions for rice than for vegetable cropping systems and showed positive responses of the CO2 and N2O emissions to fertilizations. The lowest GWP for vegetable without fertilization and highest the GWP for rice with fertilization were obtained. These results were consistent with the long-term simulation results. In contrast to the two-year experimental data, the simulated long-term CH4 emissions increased with fertilization for the rice-dominant cropping systems. The reasonable cropping systems and fertilization levels were recommended for the region.

1. Introduction

Agricultural systems are the main contributor to global anthropogenic non-CO2 greenhouse gases (GHGs), and account for 50 and 60% of the total global CH4 and N2O emissions, with 28 and 265 times of CO2 global warming potentials (GWP), respectively [1]. Rice production contributes approximately 11% of the total global CH4 emissions into the atmosphere [1]. China has the world’s second largest rice-growing area, most of which has been converted to vegetable production due to the urbanization and economic development of recent decades [2,3], and this has been affecting the GWP in the rice production regions.
Many studies have compared the effects of cropping system (or land use pattern) conversion from rice to other upland cropping systems on GHG emission and crop productions [4,5,6,7]. CH4 emissions are generally high in paddy soil due to the increased anaerobic digestion [4,5,8,9]. Converting rice cropping systems to other upland cropping systems, such as vegetable [4,5,6] and fruit [7], decreased CH4 emissions significantly due to the lack of soil water saturation, but usually resulted in higher N2O emissions. As a result, both increased [7] and decreased [5] GWPs have been reported in previously studies of rice cropping system that have changed to other upland cropping systems. On the other hand, the effect of cropping system conversion on GHG emissions could vary with time. For example, Wu et al. [6] found that the GWP decreased greatly in the first year of changing from a rice to a vegetable cropping system due to the higher decrease in the CH4 emission than the N2O emission increase, but in the following years, no obvious difference in the GWP was found between rice and vegetable cropping systems. In another study, fewer CH4 emissions were found from a sasanqua field that had been converted from a four year rice soil than from a 13 year rice soil [10]. Thus, the short-term field experimental results may be limited in aiding us to understand the long-term effects of cropping system conversions on GHGs emission.
Nitrogen fertilization is an important factor affecting N2O and CH4 emissions, but vary greatly between rice and vegetable cropping systems [4,5,6,11,12,13,14,15,16,17,18]. For example, N2O emissions generally increased with the application of N fertilization, but varied greatly among rice paddy soil [6,7,13,14], upland cropland [16] and vegetable land [6,17,18]. The CH4 emission from rice paddy soil could be decreased by straw decomposition [12] or increased with low electrical potential (Eh) [13] caused by organic fertilizer application. Increasing the rice management inputs (high seed and fertilizer rates, and pesticide use) would significantly increase the CH4 emissions in Brazil [18]. Nitrogen fertilization in rice fields could increase CH4 significantly [19] or little [5] in China. The cropping system conversion, along with other crop management changes, such as fertilization, showed complex and time-varied effects on GHGs emissions [6,10], which can be better explored by combing field experimental data and soil biochemical model simulations.
Many process-based soil biochemical models were used to quantify the agricultural management effect on GHG emissions, such as Daycent [20,21], S_INTAGRAL [22], IFSM [23], and RZWQM [24]. The denitrification-decomposition (DNDC) [25,26] model is one of the most widely used models to simulate carbon and nitrogen cycles in agricultural ecosystems and has been used to estimate the GHG emission from rice paddy soil [10,15,25,27,28,29,30,31,32,33] and upland cropping systems [26,27,28,34,35,36,37]. Cai et al. [27] found that the DNDC model showed a good performance in simulating seasonal N2O emissions from lowland soil in Japan and seasonal CH4 emissions from rice paddy soil in China, but worse predictions of N2O emissions from an Andisol soil type in Japan. Babu et al. [29] found good agreements between the DNDC-simulated CH4 and N2O emissions and the observed values from rice fields in India. Other simulation studies with the model showed a good performance in simulating CH4 emissions from rice fields [31] and N2O emissions from corn fields [35] in response to various fertilizations. However, only a few studies have evaluated the DNDC model for simulating GHGs emissions from different cropping systems, such as rice-corn/sorghum rotations in Thailand [25], and rice-wheat/vegetable rotations in China [28]. Upland crop rotation with rice reduced CH4 emissions significantly from rice soil in Thailand [25], while higher GHG emissions from rice soil than from rice-wheat/vegetable rotation systems were obtained with the same nitrogen loading in China [28]. There is a need to quantify the effect of cropping system conversion from paddy rice soil to upland soil on GHGs emissions for better assessing the GWP as agricultural land use patterns change.
Therefore, our objectives were to: (1) evaluate the DNDC model for predicting GHG emissions in cropping systems that have changed from a lowland rice cropping system to an upland vegetable cropping system; and (2) using the calibrated DNDC model to quantify the long-term response of GHG emissions to cropping system conversions from a monotype rice cropping system to rice-vegetable cropping systems in combination with different fertilization levels for selecting the reasonable cropping system and fertilization management.

2. Materials and Methods

2.1. Site Description and Experimental Datasets

The experimental site is located at the Qianyanzhou Ecological Research Station (QYZ, 26°44′46” N, 115°04′05” E) in Jiangxi Province, southern China. The soil type is plinthic acrisol. The climate is a subtropical monsoon climate with a mean air temperature of 18.0 °C and mean annual precipitation of 1509 mm. The air temperature and precipitation of the study site during the experiment period are shown in Figure 1. Double rice cropping in a year is the primary cropping system in this area, which has recently been converted to vegetable cultivation for economic reasons.
The experiment was conducted on a 10 yrs. double-rice field between 2012 and 2014, including the primary double rice cropping system and converted vegetable cropping system under conventional or no fertilization conditions. Thus, four treatments were designed: rice with (RF) and without (RNF) fertilization, and vegetable with (VF) and without (VNF) fertilization. The crop growth periods, fertilizer application and the other management practices are shown in Table 1, and detailed management information could be found in Yuan et al. [5,38].
The greenhouse gas fluxes were simultaneously observed using static chamber-gas chromatography method (GC System, 7890A, Agilent Technologies), and gas samples were collected at least twice each week throughout the growing season. Crop yields of rice and vegetables were measured based on a 1 m2 area at harvest. Detailed information on the experimental datasets can be found in Yuan et al. [5,38].

2.2. Model Description, Inputs and Calibrations

The DNDC model is a process-based simulation model of carbon and nitrogen biogeochemistry in agro-ecosystems [32]. Specifically, the model first simulates the soil physical environmental factors, such as soil temperature, moisture, pH, redox environment, and substrate concentrations based on ecological driving factors (i.e., soil, climate, vegetation and human activities) using the soil microclimate, crop growth and soil organic matter decomposition sub-models. The CO2 emission is simulated as the sum of the soil-derived CO2 emission (soil-heterotrophic-respiration) and plant-derived CO2 emission (sum of leaf-respiration, stem-respiration and root-respiration. The emissions of CH4 and N2O in the agro-ecosystem is simulated using the nitrification and denitrification sub-models. The key process estimations related to the GHG emissions in the models are described in the Supplemental Materials (Part A). This model has been widely used and developed to simulate GHG emission in different areas, such as Canada, China, India, Japan, Thailand, USA. [15,16,25,33,35]. In this study, the DNDC model (version 9.5; https://www.dndc.sr.unh.edu/; accessed on 27 January 2023) was used to simulate GHG emissions from different cropping systems and fertilizer treatments.
The DNDC model inputs include the daily climate data (e.g., maximum and minimum air temperatures, precipitation, etc.), soil properties (e.g., texture, pH, bulk density, microbial activities, etc.), vegetation (e.g., crop type and cultivar parameters), and management practices (e.g., tillage, fertilization, manure amendment, planting, harvest, etc.). The daily weather data were measured at the experimental station between 2012 and 2014 (Figure 1). To test the model’s ability to simulate the GHG emissions from both rice and vegetable cropping systems, the key parameters of the soil properties were determined based on the experimental measurements (such as soil texture, bulk density and soil organic carbon), as much as possible (Table 2), or kept as the default values in the model. The GHG emission data from rice soil (RF and RNF treatments) were used for calibration and the other data from, VF and VNF, were used to test the model’s response to cropping system conversions.
The crop parameters were particularly calibrated based on the measured data (Table 2). Specifically, the selected crop parameters of the maximum biomass production, biomass fraction, and thermal degree days for maturity were adjusted based on the observed growth stages (flowering and maturity date) and grain yields from the RF and VF treatments with adequate fertilizer inputs and different crops (Table 1), and the same data from the other two treatments of RNF and VNF without fertilizer were used for the model evaluation. Other crops parameters, such as the water demand, N fixation index, and optimum temperature for these crops were based on the default values in the DNDC. As no cowpea crop was available in the model, a new crop cultivate for cowpea was created based on the soybean cultivator parameters as they have similar N fixation processes.

2.3. Long-Term Simulations

To quantify the long-term effects of cropping system conversion in combination with the fertilization levels on the GHG emissions, the calibrated model was used to simulate the GHG emissions and crop yield in response to the cropping system change and fertilizer rates between 1960 and 2016 in the region. The first 17 year simulation was set as the traditional double crop rice management according to the local farmer management practices, while the remaining 40 year simulation includes 36 scenarios with 9 rice-vegetable cropping system conversions and 4 fertilization application rates.
The 9 cropping system conversions with different rice and vegetation cropping rotations were: pure double rice cropping system (R), rice and vegetable rotation from year to year (RV), three-year rotation of rice-vegetation-vegetation (RVV) or rice-rice-vegetation (RRV), four-years rotation of rice-vegetation-vegetation-vegetation (RVVV) or rice-rice-rice-vegetation (RRRV), five-year rotation of rice-vegetation-vegetation-vegetation-vegetation (RVVVV) or rice-rice-rice-rice-vegetation (RRRRV), and pure vegetable cropping system (V). The 4 fertilizer application rates were 0% (0 F), 50% (50 F), 100% (100 F) and 150% (150 F), respectively, of the conventional fertilization application rate (Table 1; R for rice crop year and V for vegetable crop year). All of the inputs for the long-term simulations were according to the experimental treatments between 2012 and 2014. The historical climate data, from between 1960 and 2016, were obtained from the China Meteorological Administration (http//www.cma.gov.cn/), including the daily maximum and minimum temperatures (°C), precipitation (mm), and sunshine hours (h). The daily solar radiation was calculated from the daily sunshine hours based on the Ångström equation [39].
The total GWP (kg CO2 eq ha−2) impact was calculated as the sum of the CO2 emissions, CH4 emissions × 28 and N2O emissions× 265. The net GWP (g CO2 eq ha) impact was calculated as the sum of the Net ecosystem C exchange rate (NEE), CH4 emissions × 28 and N2O emissions × 265) [1]. The annual GHG emissions and global warming potentials for the long-term simulations were averaged between 1976 and 2016 (40 years). The annual crop yield was calculated as the sum of the seasonal rice and vegetable yields in a civil year, e.g., early and later rice yield for the R treatment, and the sum of the pepper yield, cowpea yield and white radish yield for the V treatment.

2.4. Statistical Analysis

The DNDC-simulated results were compared against the field-observed results under different cropping systems and fertilizer application rates. The comparisons between the observations and simulations were determined by the coefficient of determination (R2), d-index (d) [40] and root mean square error (RMSE). The Wilcoxon test was used to analyze the differences in the GHGs emissions among the treatments at the p < 0.05 level.
As a result of the DNDC model simulating the crop biomass as the C content in grain, root and leaf (kg C/ha), the crop yields for pepper and cowpea used to compare the measured yield (dry matter) were estimated from the simulated grain C amounts, divided by 0.4 (1 kg dry matter contains 0.4 kg C based on the model manual: https://www.dndc.sr.unh.edu/model/GuideDNDC95.pdf; accessed on 27 January 2023). Similarly, the seasonal white radish yield was calculated from the simulated root C content divided by 0.4.

3. Results

3.1. DNDC Model Evaluations

3.1.1. Daily CH4 Emission Response to Cropping System Conversion and Fertilization

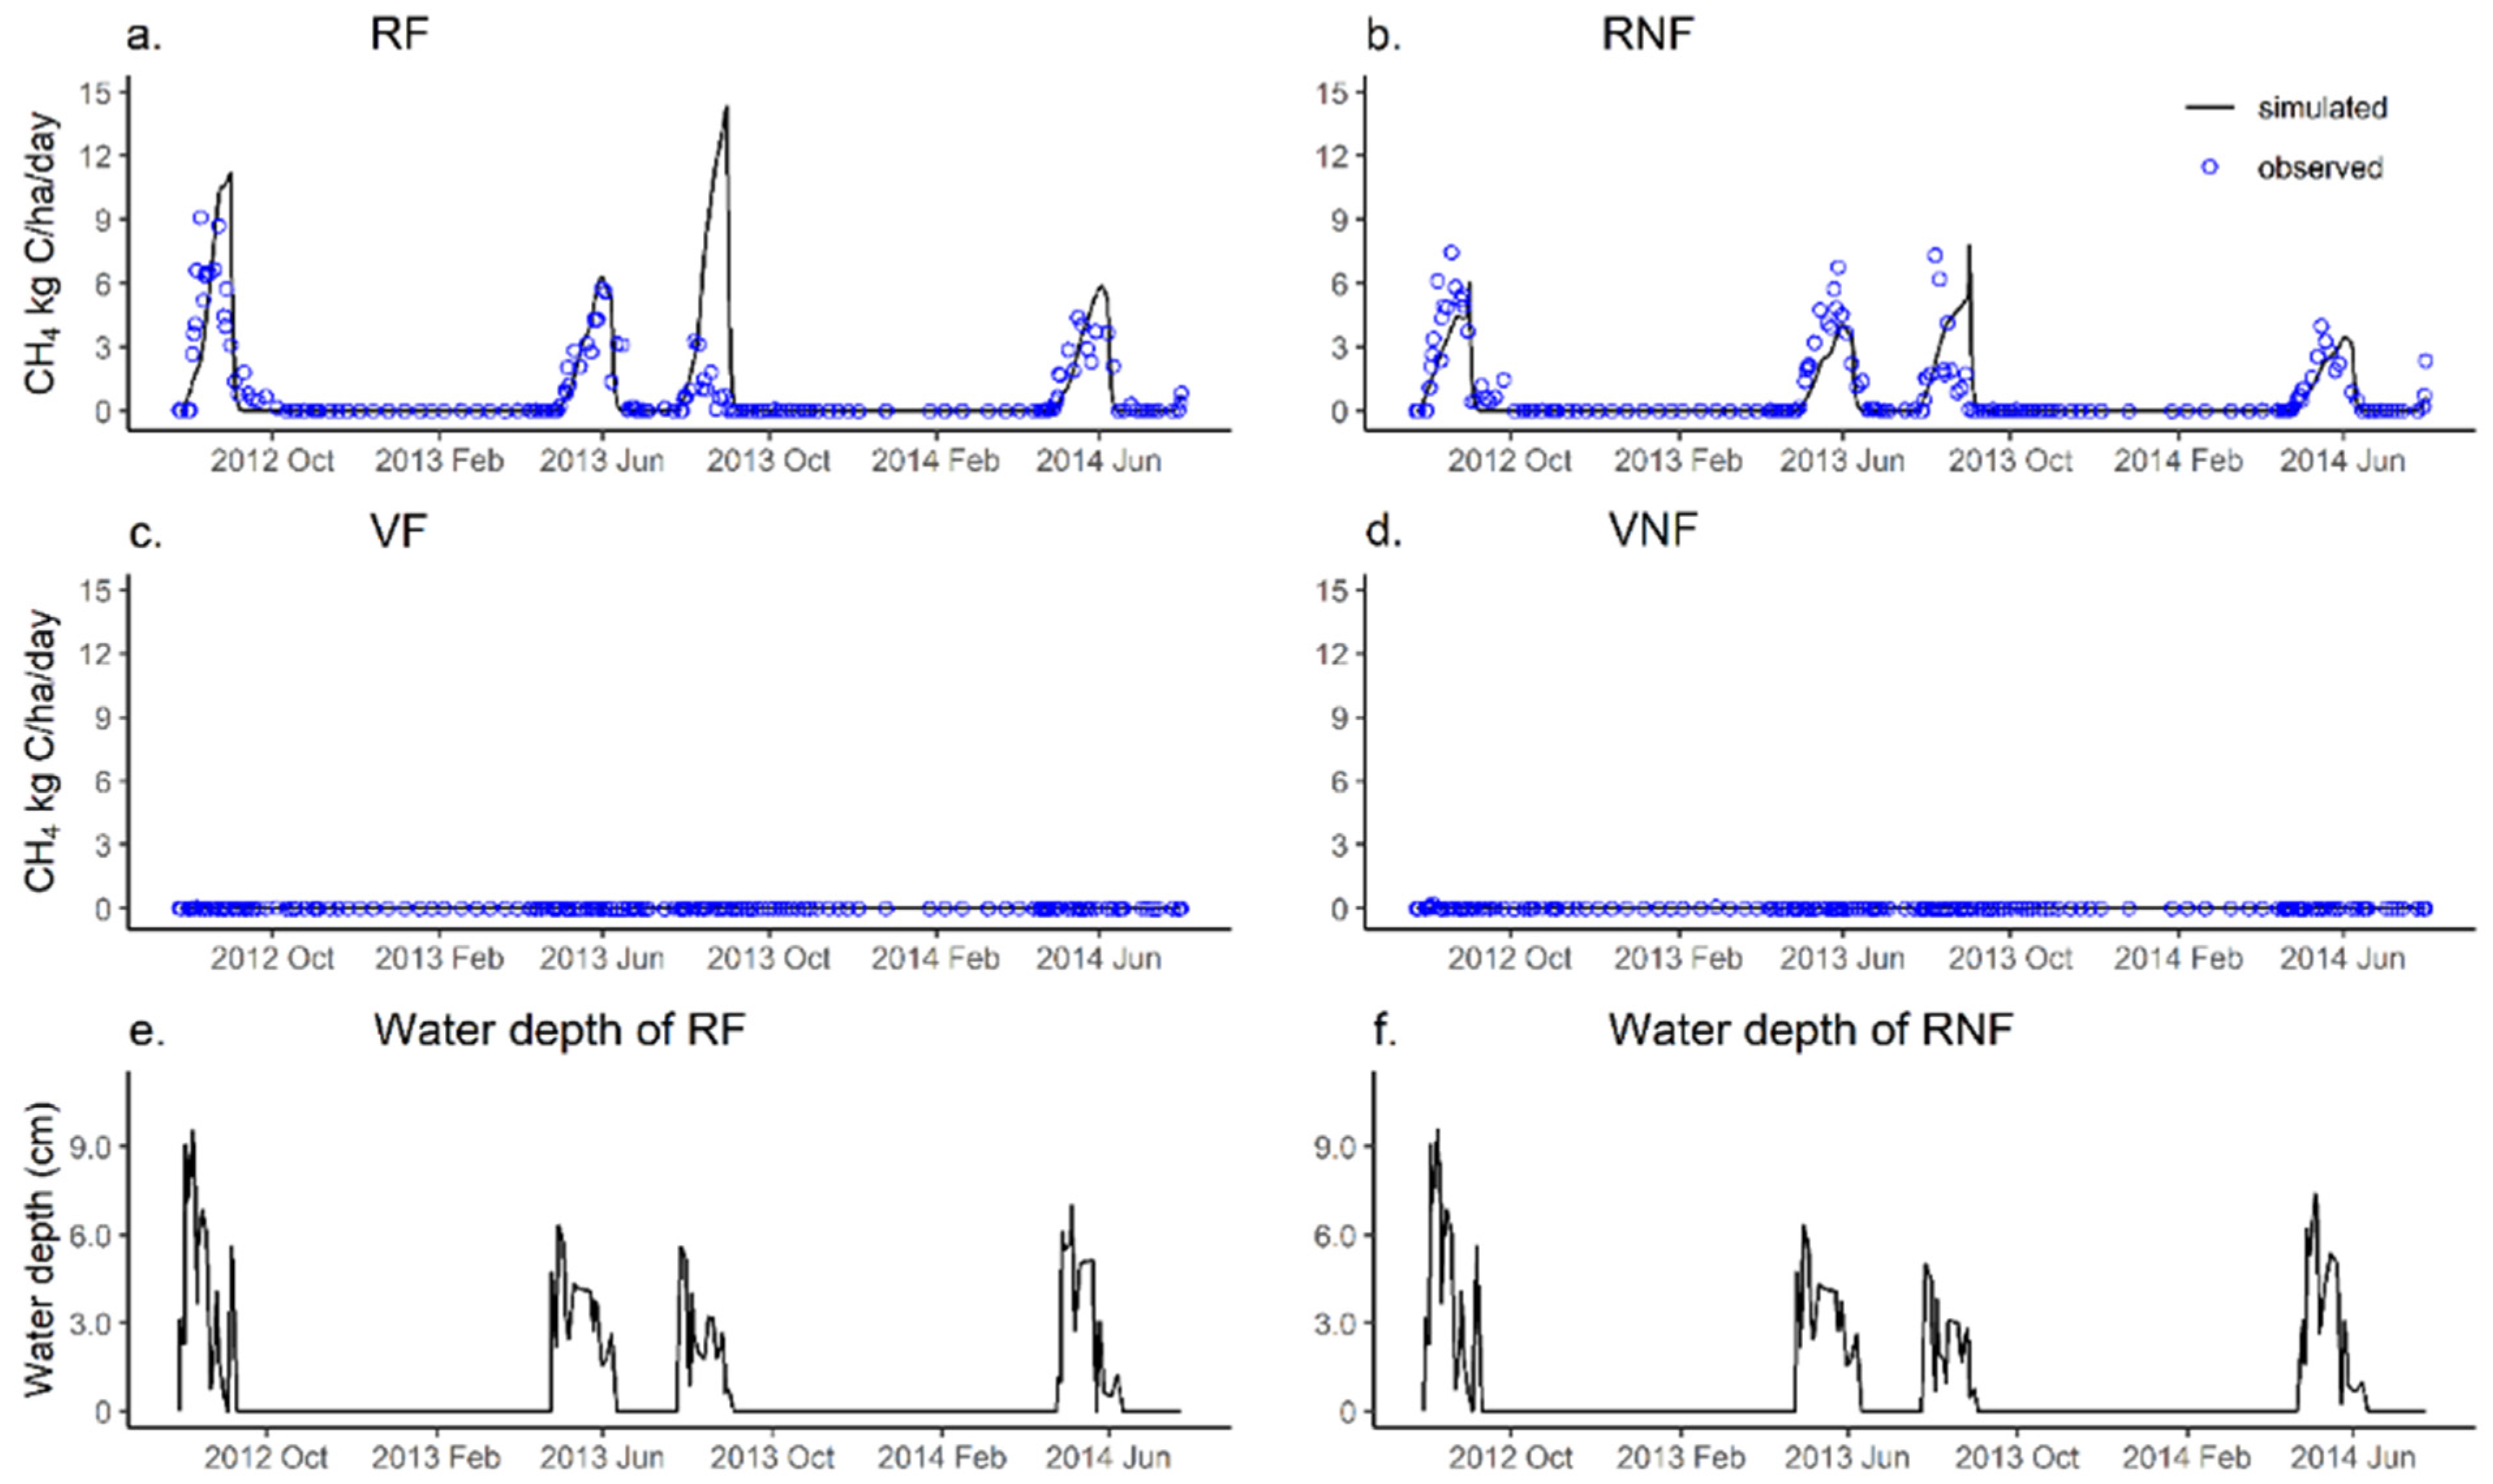
Using the measured or default soil properties (Table 2), the DNDC-simulated daily CH4 emissions were consistent with the measured data (R2 = 0.62 for RF and 0.69 for RNF) and sufficiently captured the emission peaks in August of 2012 and 2013 and between late April and early June of 2013 and 2014 during water flooding periods for the RF and RNF treatments (Figure 2a,b,e,f). Very low (near to zero) simulated and observed CH4 emissions were obtained for the vegetable soil (VF and VNF treatments without water logging; Figure 2c,d). The RMSE values for the simulated daily CH4 emissions were 1.62–2.31 and 0.01–0.02 kg C/ha/day for the rice and vegetable systems, respectively. The model slightly over-simulated the CH4 emissions for RF and RNF across the two years (Table 3). Both the observed and simulated CH4 emissions were significantly (p < 0.001) higher for the rice cropping systems than for the vegetable cropping systems, but showed no significant difference (p > 0.1) between the RF and RNF or the VF and VNF treatments (Figure 2 and Table 3).

3.1.2. Daily CO2 Emission Response to Cropping System Conversion and Fertilization

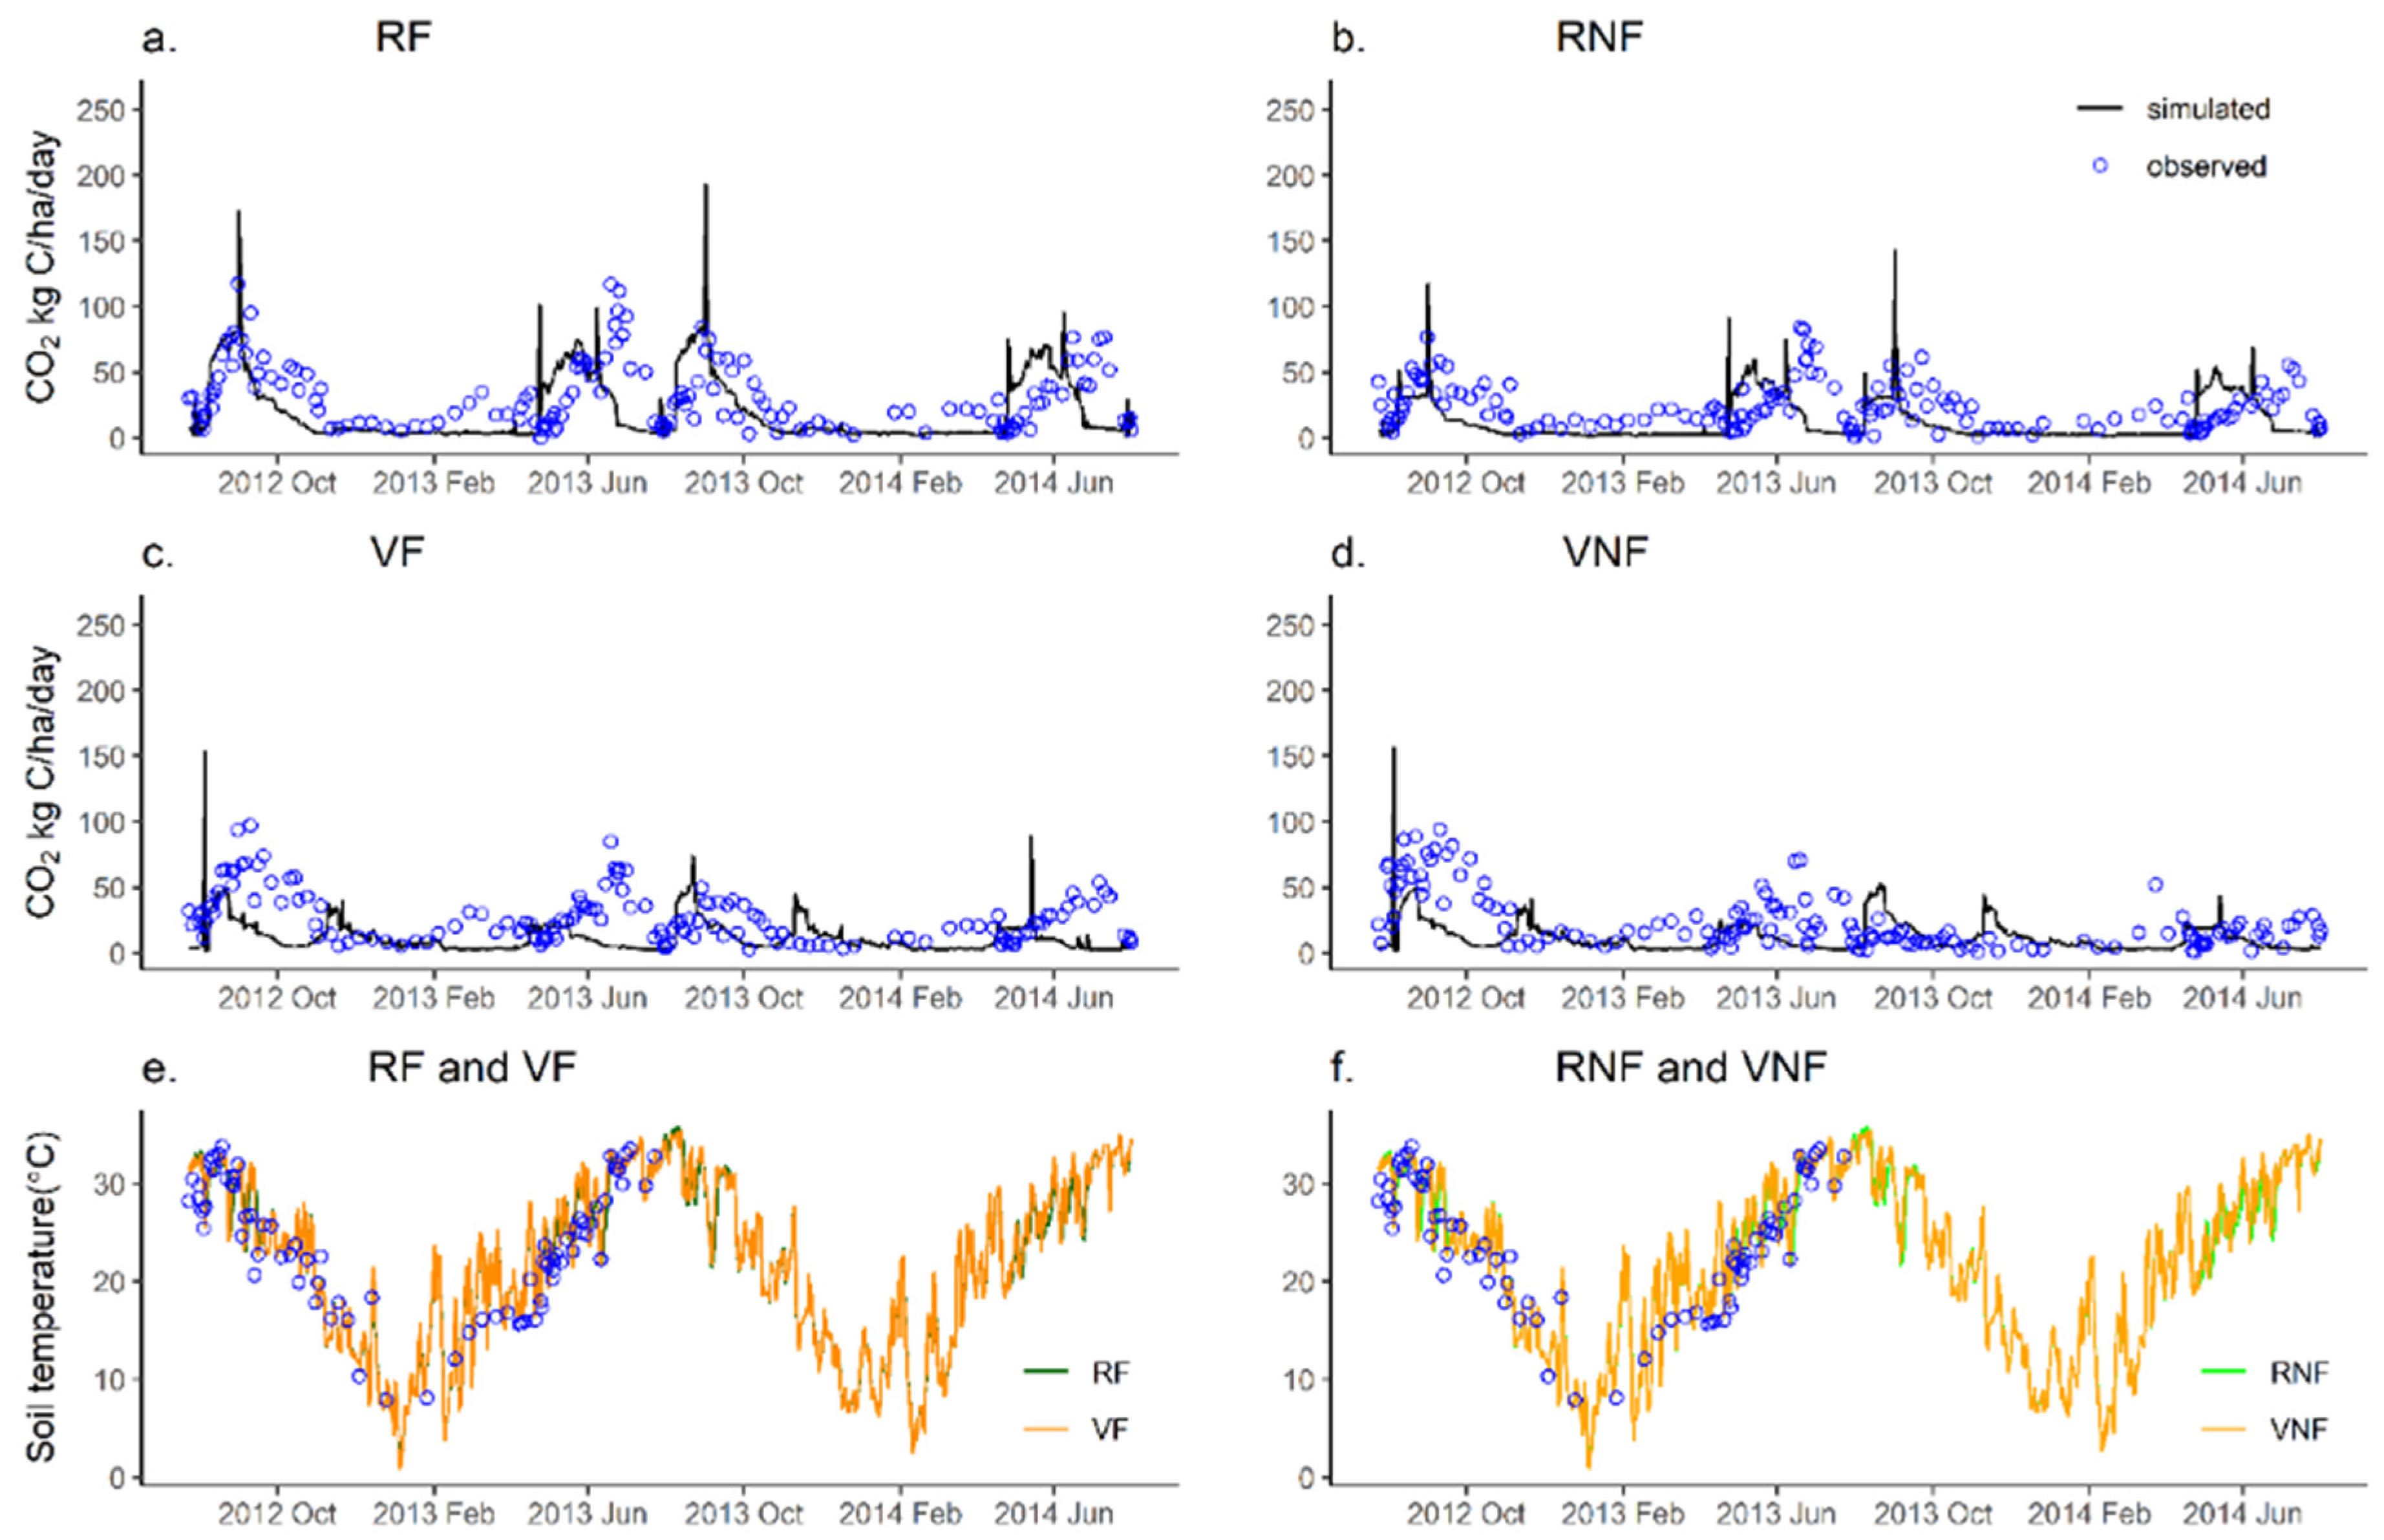
The DNDC-simulated CO2 flux dynamics across the seasons were consistent with the observed values (d = 0.39–0.51 for these treatments) and show a positive relationship with the soil surface temperature (Figure 3e,f; correlation coefficient values were 0.57 for measured data and 0.27 for simulated data, p all < 0.001). For the RF and RNF, both the measured and simulated CO2 emission peaks occurred between late April-late July (early rice season) and late July-early November (late rice season) (Figure 3a,b). However, the model simulated sharp CO2 emission peaks at the beginning or end of the flooding period in the rice seasons (Figure 3a,b) or the planting time in the vegetable system (Figure 3c,d) were not observed. Lower CO2 emissions were simulated for the pepper growth seasons (April–July) in both years and for the later cowpea growth season (September–October) in 2012. On the other hand, higher simulated CO2 emissions were obtained for the white radish growth season (October to February) (Figure 3c,d). The above-mentioned discrepancies resulted in relatively high RMSE values (16.67–33.52 kg C/ha/day) and low R2 values (0.05–0.20) for the simulated daily CO2 emissions across these treatments (Table 3).
Across the two years, the model slightly over-simulated the CO2 emission from the rice cropping system and under-simulated the CO2 emissions of the vegetable systems by about 25% (Table 3). Both the measured and simulated CO2 emissions were higher for the rice cropping system than for the vegetable cropping systems, as well as for the RF than for RNF treatments, but were close between VF and VNF treatments (Table 3).

3.1.3. Daily N2O Emission Response to Cropping System Conversion and Fertilization

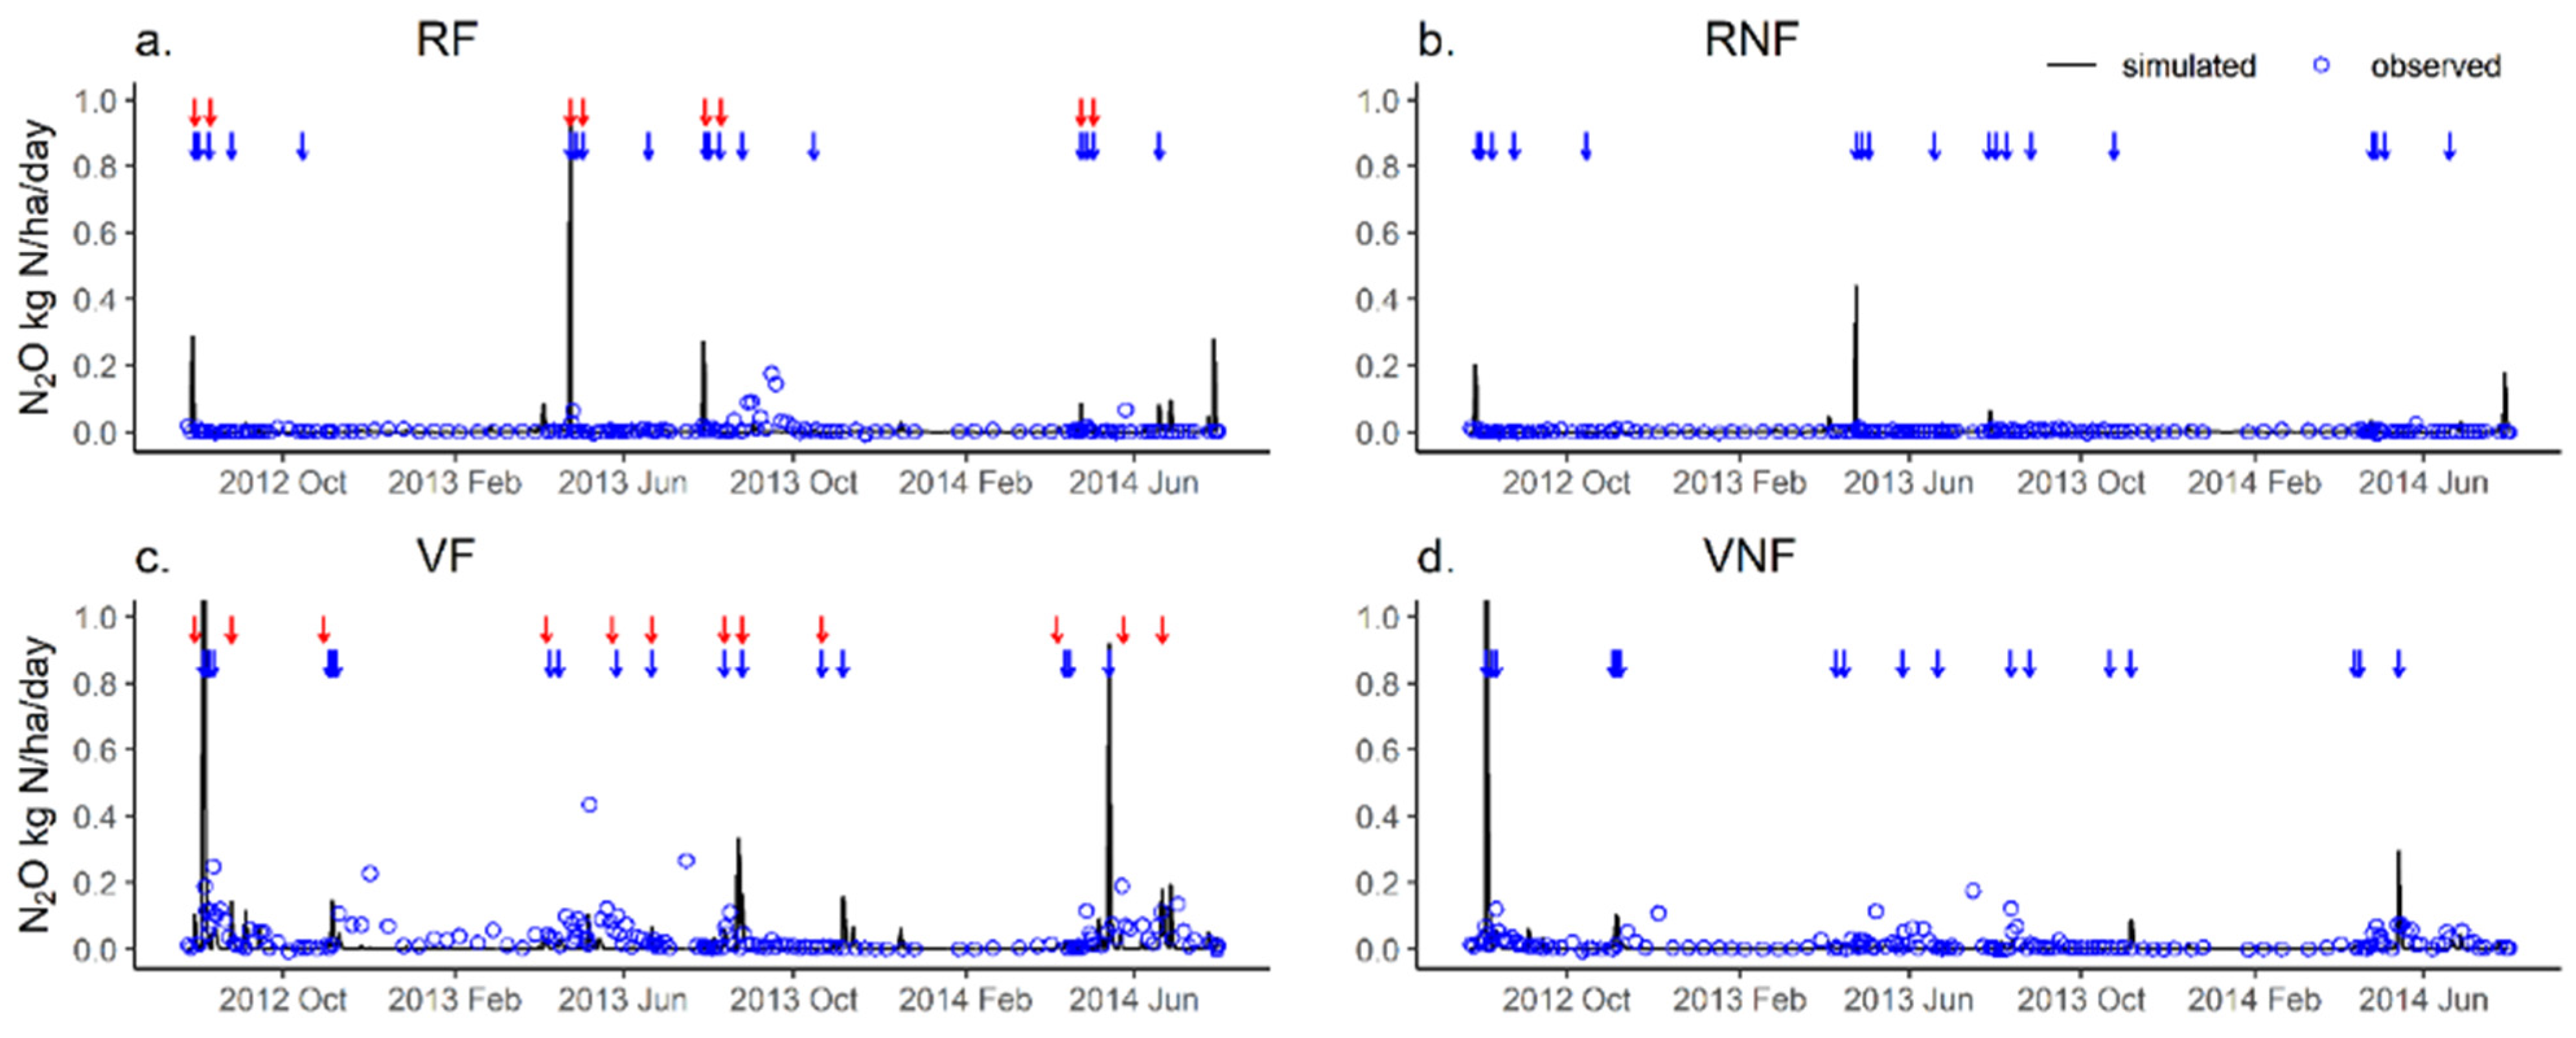
The simulated daily N2O emission showed similar trends to the measured (d = 0.11–0.40) and captured N2O emission peaks after the fertilization and irrigation (Figure 4). The other measured N2O emission peaks (e.g., December in 2012 and May in 2014 for vegetable soil) were not simulated by the model, while the model-simulated N2O emission peaks (e.g., August in 2012 and June in 2014 for vegetable soil) were generally higher than the measured peak values (Figure 4). These discrepancies resulted in relatively high RMSE values for the simulated daily N2O emissions, which were 0.01–0.03 kg N/ha/day for the rice system and 0.11 kg N/ha/day for the vegetable systems. The model under-simulated the seasonal N2O emissions for the RF treatment (0.003 vs. 0.008 kg N/ha/day), which was mainly associated with the simulated low N2O emission in September 2013 (Figure 4a), and over-simulated the seasonal N2O emissions for the VNF treatment, mainly due to the simulated low N2O emissions in August 2013 (Figure 4d). Both the observed and simulated N2O emissions were significantly higher for the vegetable cropping systems than for the rice cropping system (p < 0.001) and were significantly higher for conventional fertilization than for zero fertilization (p < 0.05, Table 3).

3.1.4. Seasonal GHG Emissions and Crop Yield Response to Cropping System Conversion and Fertilization

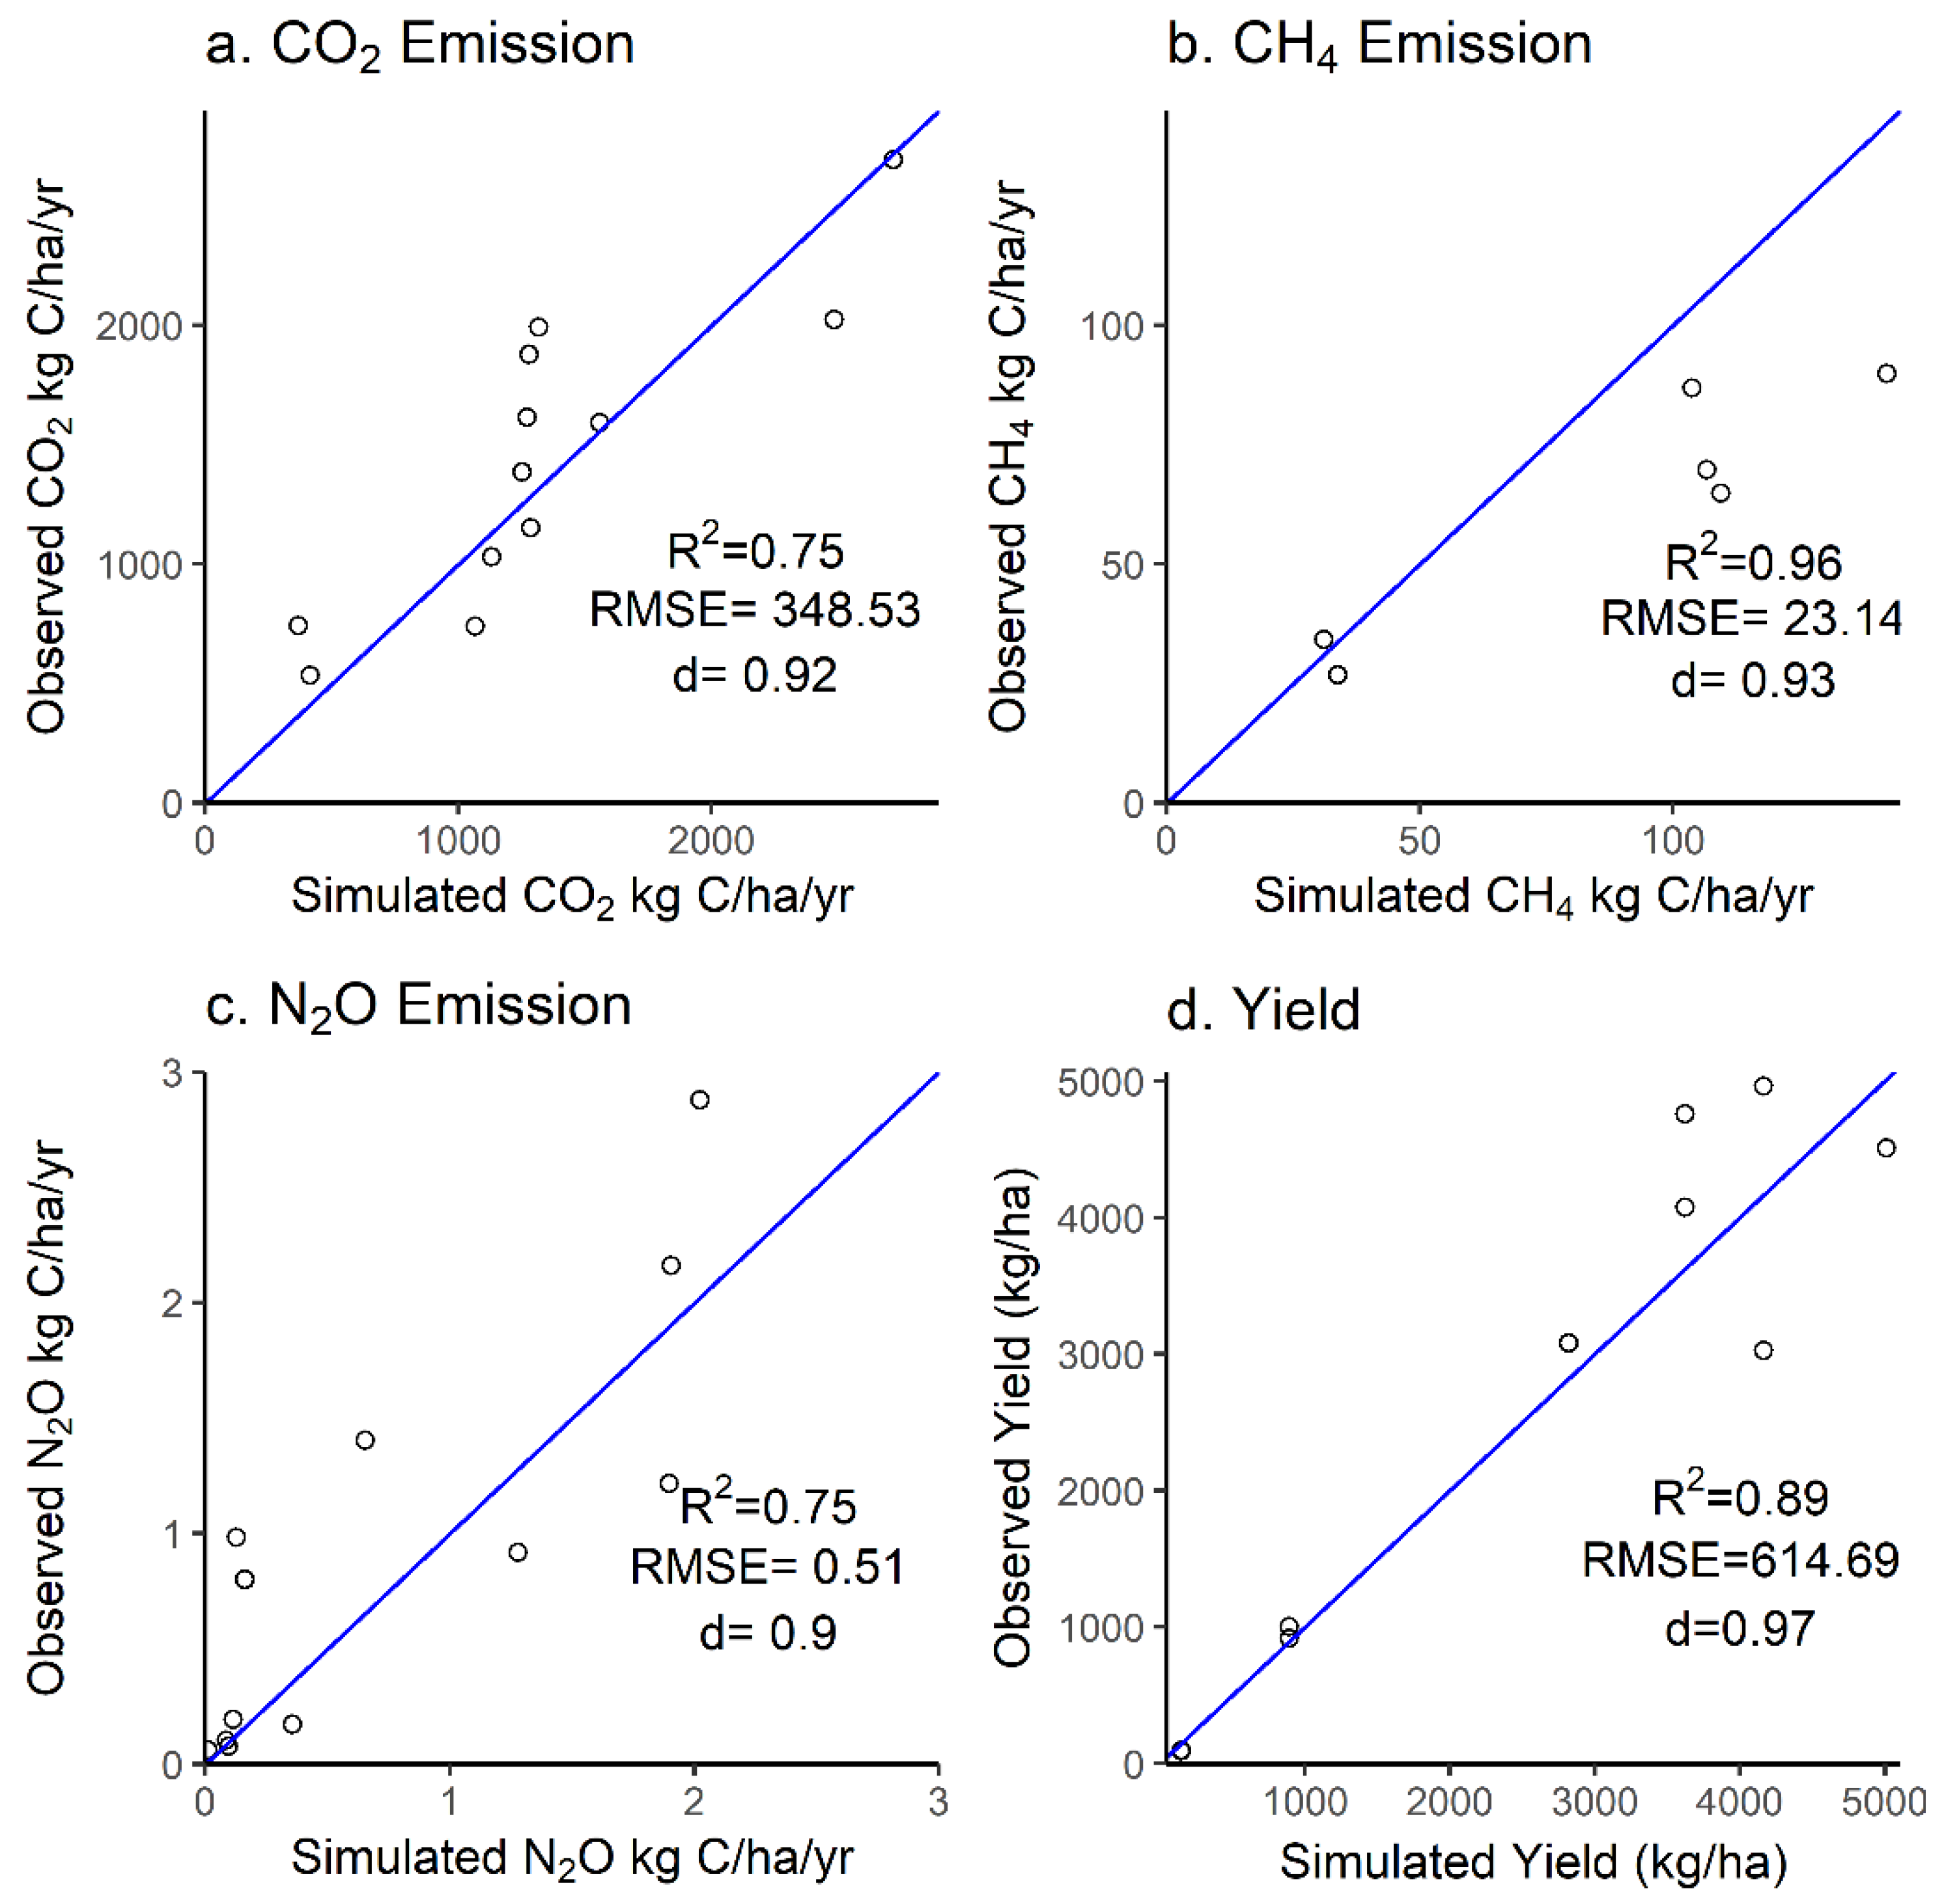
The DNDC-simulated seasonal CO2, CH4, and N2O emissions were comparable with the observed data (Figure 5a–c). The high R2 values indicated that the model could simulate the responses of GHG emissions to cropping system conversions in combination with the fertilization levels well. However, the model showed better simulations of CH4 emissions than of CO2 and N2O emissions, which was consistent with the daily GHG simulations (Figure 1, Figure 2 and Figure 3). The simulated crop yields were comparable with the measured data (Figure 5d), with RMSE, d and R2 values of 614.69 kg/ha, 0.97, and 0.89, respectively. Both the measured and simulated annual crop yields were higher for rice than for the vegetable cropping system and showed no statistical difference between the two fertilization levels, although higher crop yields were obtained with fertilization than without fertilization in 2014.

3.2. Long-Term Simulated Effects of Cropping System Conversion and Fertilization

3.2.1. Annual GHG Emissions

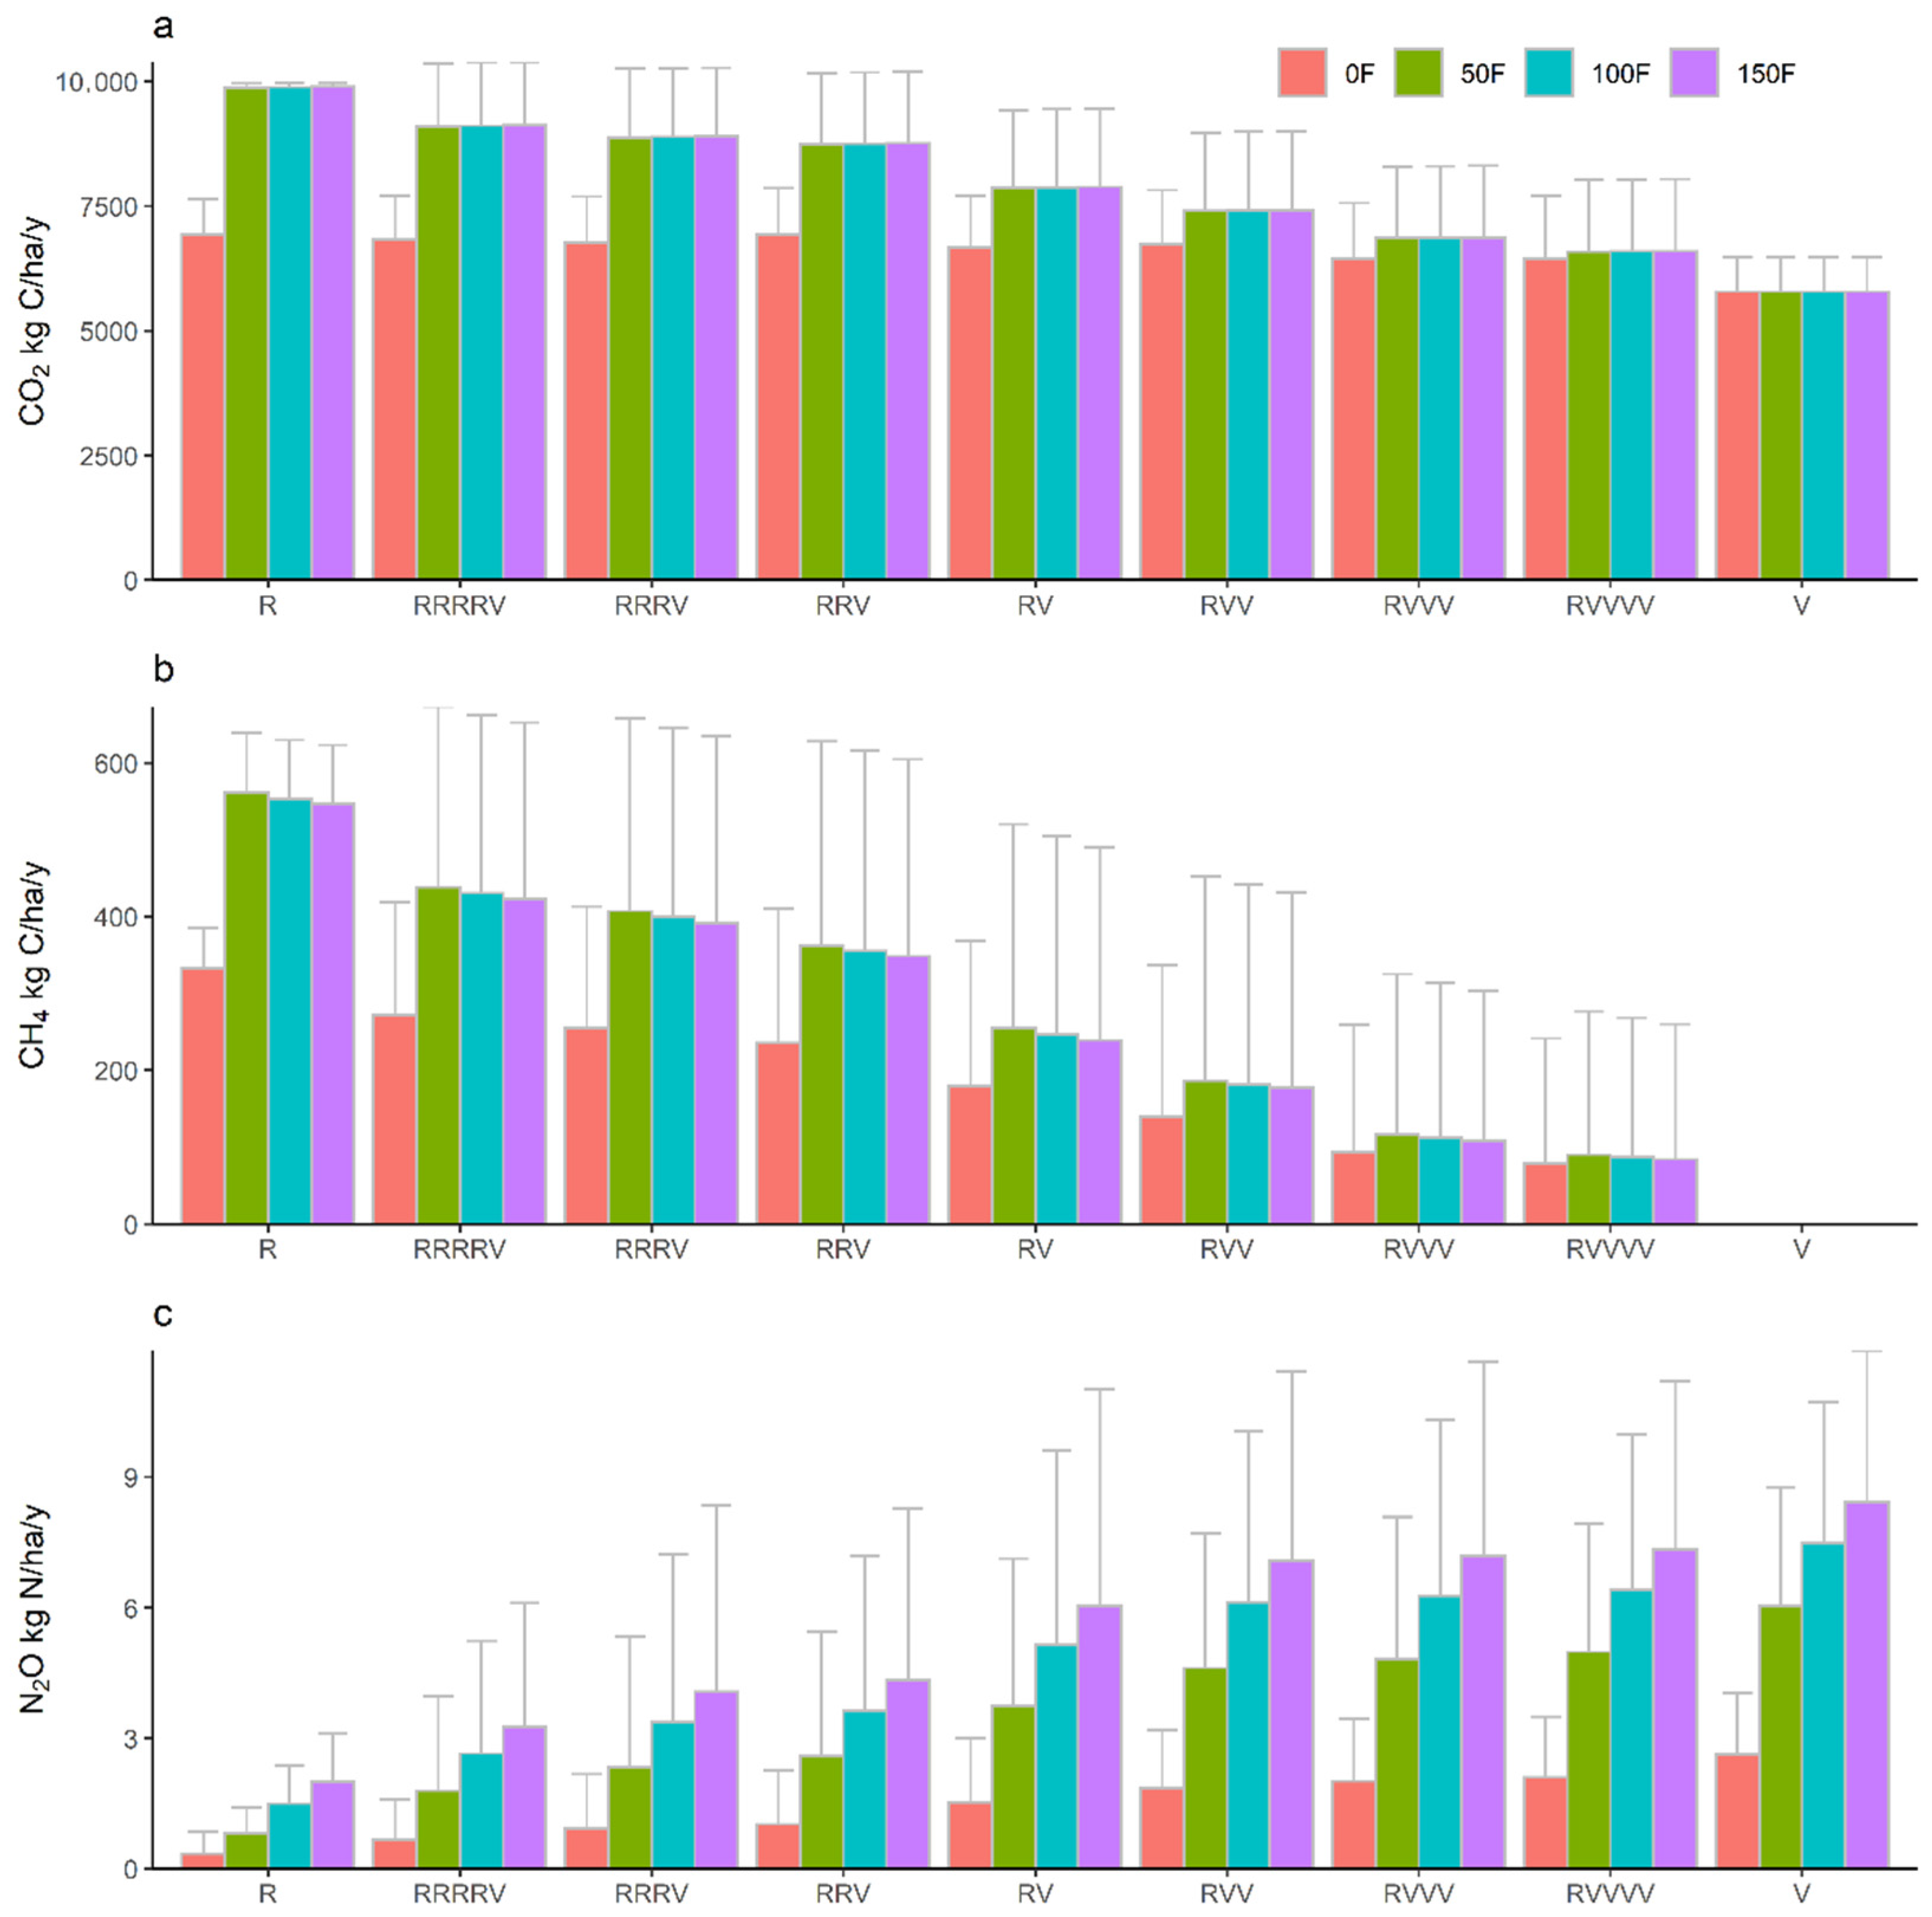
The simulated long-term average annual CO2 and CH4 emissions decreased by 37% and 100% from monotype rice to monotype vegetable cropping systems, and the inverse result was obtained for the simulated annual N2O emissions, with a 429% increase from the monotype rice to the monotype vegetable cropping systems (Figure 6). Fertilization generally increased the annual GHGs emissions, but varied greatly among these cropping systems. For example, the simulated annual CO2 and CH4 emissions increased by 10–40% from 0 F to 50 F under these rice-dominant cropping systems (R to RV cropping systems; Figure 6a,b), but increased little under these vegetable-dominant cropping systems (RVV to V cropping systems; Figure 6a,b). The difference in the CO2/CH4 emissions between 0 F and 50 F decreased for cropping system conversion from a monotype rice to a monotype vegetable cropping system, while the difference in the CO2/CH4 emissions among 50, 100 and 150 F were small across all of these cropping systems (Figure 6a,b). The simulated long-term annual N2O emissions showed pronounced increases with the fertilization rates from the rice-dominant cropping systems to the vegetable-dominant cropping systems (Figure 6c).

3.2.2. Global Warming Potentials and Crop Yield

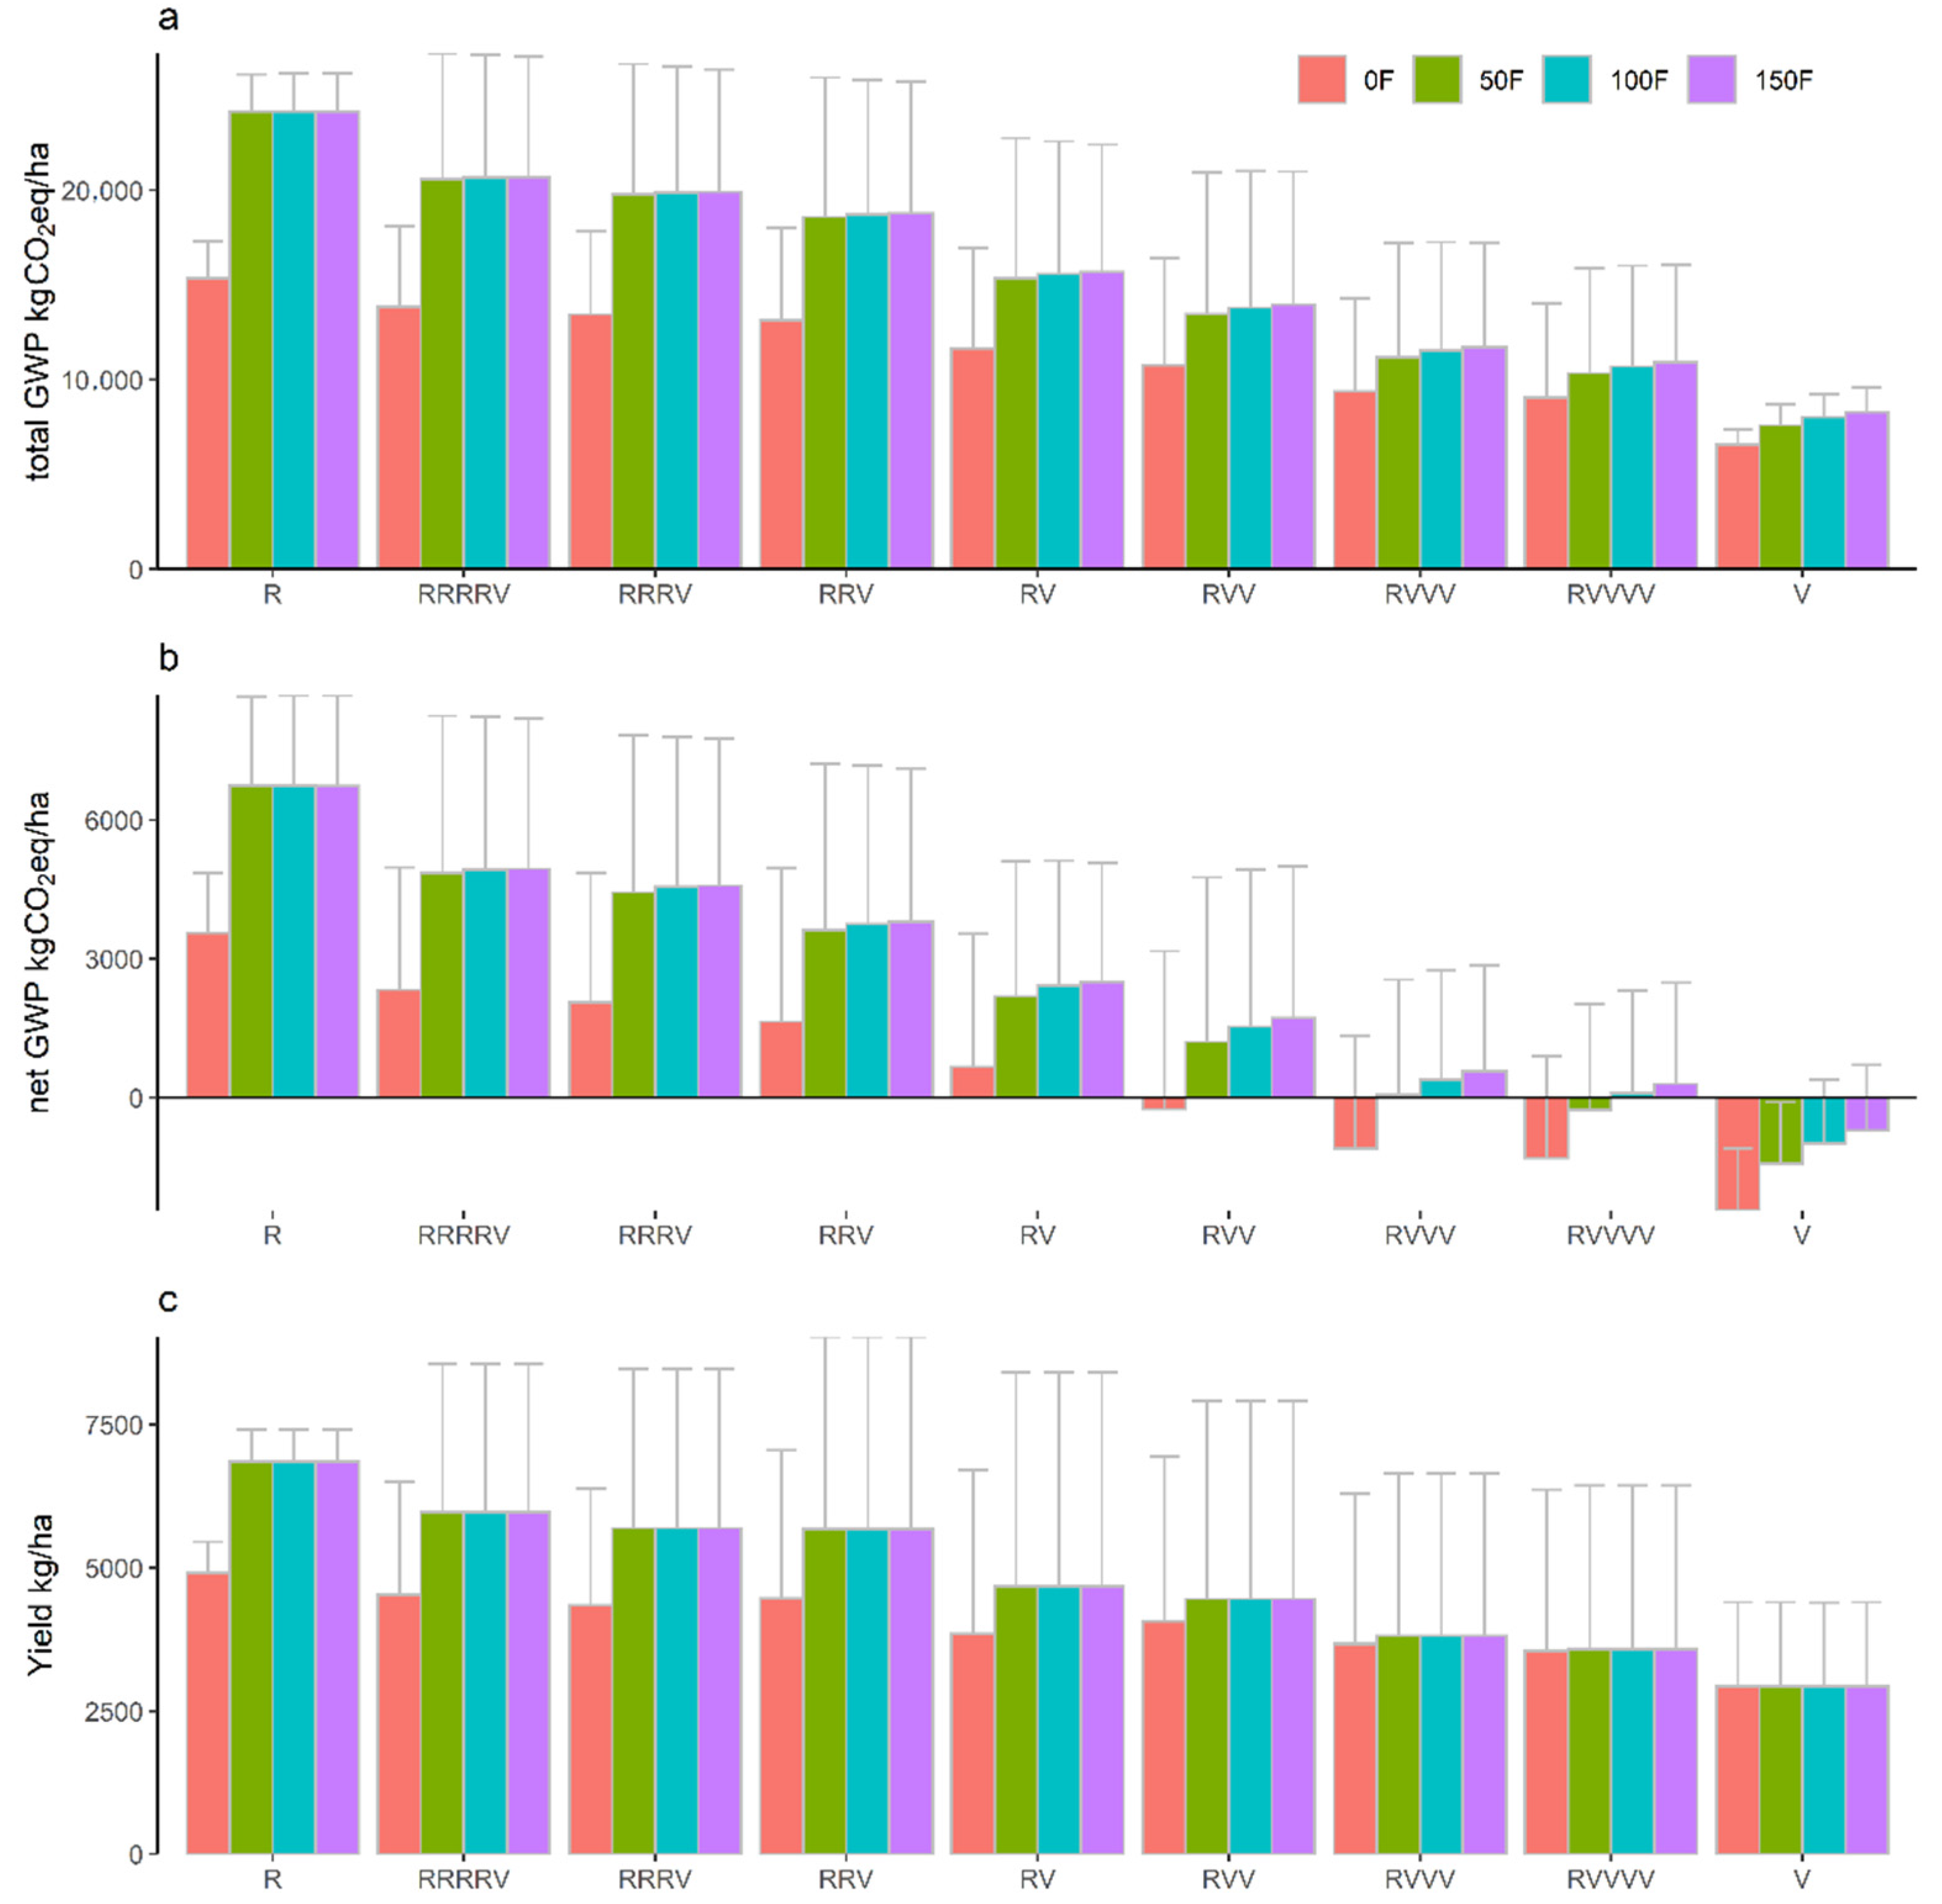
The simulated long-term annual GWP generally decreased by 68% from a monotype rice to monotype vegetable cropping systems (Figure 7a), indicating a compensation between the increase in the N2O emission and the decreases in the CO2 and CH4 emissions for these vegetable-dominant cropping systems (Figure 6). The reductions in the CH4 emissions were the main contributor to the decrease in the GWP for these vegetable-dominant cropping systems. Similar to the annual total GWP, the annual net GWP decreased by 122% from the rice dominant to vegetable dominant cropping systems (Figure 7b). The vegetable cropping system with negative net GWP values indicated a high potential of a migrating GWP.
Both the simulated annual total and net GWPs increased from 0 to 50 F levels (about 10–60% for total and 40–1480% for net GWPs), and then increased little or less under further, higher fertilization levels (Figure 7). For these vegetable-dominant cropping systems, the simulated annual GWP still increased with the increase in fertilization (Figure 7), which was mainly associated with the similar response of the N2O emissions to fertilization and the cropping systems (Figure 6c). Overall, the mean annual net GWPs were positive for the R, RRRRV, RRRV, RRV, and RV treatments, and for RVV and RVVV, with a higher than 50 F fertilization level, and for RVVVV, with 100 and 150 F levels. The mean annual net GWPs were negative for V and RRRRV, with a lower than 100 F fertilization level, and for RVVV and RVV with no fertilizations (Figure 7b).
The simulated long-term annual crop yields generally decreased from the monotype rice to the monotype vegetable cropping systems (Figure 7c). Fertilization increased the annual yields but varied greatly among these cropping systems. For example, the simulated annual yields increased from 0 F to 50 F under the rice-dominant cropping system (R to RV cropping systems), but increased little under the vegetable-dominant cropping systems (RVV to V cropping systems).

4. Discussion

4.1. DNDC Model Performance

The DNDC model showed good performances in simulating the daily (Figure 2, Figure 3 and Figure 4) or annual (Figure 5) CO2, CH4 and N2O emissions across treatments and seasons. The RMSE and R2 values for the simulated GHG simulations across the two years were comparable with the previous DNDC simulation results in India [29,30], Thailand [25], Canada [26,35], and south China [10], as well as other models [24]. The CH4 emissions were generally simulated better than the CO2 and N2O emissions, where both the measured and simulated CH4 emission peaks occurred during the flood periods in the rice seasons (Figure 2). This result indicated that soil water was the main controlling factor of the CH4 emission. The DNDC model uses the Eh value to represent the redox environment [34], and CH4 can only be produced under specific Eh conditions (with Eh of −300 to −150 mV) [36,37].
Better CO2 emission simulations were found for the rice cropping system than for the vegetable cropping system, where obvious under-simulated CO2 emission occurred during the vegetable growth periods (e.g., April–July in 2013 and 2014). This result was mainly associated with the simulated low crop yield and biomass of pepper, according to the observed values (Figure 3c,d). The simulated high CO2 emission peaks (mainly soil respiration) (Figure 2) mainly occurred before or after the flooding periods in the rice field (e.g., 1 Sep 2012, 24 April 2013 and 8 Jun 2013), or with irrigation and rainfall events in the vegetable field (e.g., 5 Aug 2012 and 27 May 2013). This result was consistent with the field observations in the rice field [41] and the upland field [42].
The simulated daily N2O emission sufficiently captured the measured peaks after fertilization and irrigation (Figure 3), and the annual N2O emission also responded well to the cropping systems or fertilization levels (Figure 4). However, the simulated N2O emission peaks were generally higher than the observed values, and the other DNDC simulations also showed higher N2O emission peaks in the rice field [14,28,29,33] or in upland soil [28]. Further evaluations of the DNDC model for simulating N2O emission are needed, particularly for upland soil [27].
Overall, the model’s performance was better for the rice cropping system than for the vegetable cropping system. Only a few simulation studies have evaluated the DNDC for GHG simulations on vegetable fields, particularly those converted from rice cropping systems [27,28]. The conversion from rice to vegetable cropping systems were associated with changes in crop types, soil water condition, and irrigation/fertilizer management, which had a significant influence on soil nutrient and carbon cycles and crop growth. The current evaluations showed that the DNDC model could simulate the changes in GHG emissions due to the cropping system conversion in combination with different fertilization levels.

4.2. Effects of Cropping System Conversion and Fertilization on GHGs Emissions

Cropping system changes had a substantial influence on CO2 emissions [4,5,6,7], and the decreased CO2 emissions from the rice to vegetable cropping systems were mainly due to the higher rice biomass and soil respirations in wet-dry conditions [41]. A slight decrease in the CO2 emissions were also observed from the rice soil than from maize-rice rotation [43]. Both the measured and simulated CO2 emissions were higher for conventional fertilization than for zero fertilization under the rice cropping system, but were close between the two fertilization levels for the vegetable cropping systems. This result was consistent with the simulated crop yield in response to fertilizations between the two systems (Figure 7c). A long-term experiment with rice-wheat rotations also showed a significant increase in CO2 emissions with fertilization due to the increase in the crop growth [44].
The measured and simulated higher CH4 emissions for rice than the vegetable cropping system were consistent with the other studies on CH4 emissions between rice and other cropping systems [25,36,45]. No significant effect of fertilization on CH4 emission were found for both the measured and simulated data (Table 3), and similar results were also found in other field studies [6,46,47]. However, the long-term simulations showed an obvious increase in the CH4 emission from zero to 50 F levels under the rice-dominant cropping system (Figure 6b), which was consistent with other simulations or field observations on the CH4 emission response to organic [12,31,37,48] and inorganic fertilizations [19,28,48]. At or above 50 F levels, the slightly declined annual CH4 emissions for these rice-dominant cropping systems (Figure 6b) were mainly due to the lower soil dissolve carbon availability caused by higher soil respirations at higher fertilization levels (Figure S2 in the Supplemental Materials). The field experimental results showed that the CH4 emission from paddy rice soil could be increased or reduced by fertilization depending on the balance of methanogen and methanotroph activities after fertilization [19,46]. More evaluations on the management effects on GHG emissions, such as fertilizer, irrigation and tillage, are needed during the cropping system conversions from rice to vegetable.
Both the measured and simulated N2O emissions were lower for the rice soil than for the vegetable soil, and increased with the fertilization levels, which was consistent with the previous studies [14,15,28,36]. The aggregated N2O emission factor (EF) for the rice cropping systems were 0.21/0.59% for the simulated/experimental two-year data, and 0.34% for the long-term simulated data, which were lower than the proposed value of 1% by IPCC [49] and other studies from China [50]. The EF values of N2O for the vegetable cropping systems were 0.91/1.63% for the simulated/experimental two-year data, and 1.17% for the long-term simulated data, which were comparable with the IPCC proposed value (aggregated EF of 1%) [51].
No significant difference was found in the simulated vegetable crop yields between no fertilization and conventional fertilization, for both the experimental data [5] and the simulated data (Figure 5). The long-term simulated vegetable yields also showed no response to these different fertilization levels (Figure 7c). The main reasons are due to the N supplement from crop N fixation (particularly for cowpea) of about 34.4 ± 8.9 kg N/ha each year and soil of 28.8 ± 91.2 kg N /ha each year, which could almost cover the vegetable N uptake (81.6 ± 18.6 kg N/ha/yr; Figure S3 in the Supplemental Materials). However, the DNDC-simulated rice yield showed a positive response to these fertilization levels (Figure 7), where high rice N uptake (148.5 ± 4.2 kg N/ha) was simulated (Figure S3 in the Supplemental Materials). Previous studies also showed that the rice and vegetable yield increased [16,29,31,52] and that the vegetable yield did not increase with fertilizations [16,52]. Under this context, further evaluations on the simulated vegetable crop yield and N uptake in response to fertilizations are needed for the DNDC model.
Although the simulated GWP values were higher for the rice system than for the vegetable systems (Figure 7), the latter might contribute more GWP due to the higher secondary GHGs emissions [53,54]. Due to the different responses of the GHG emission and GWP to the cropping systems and fertilization levels (Figure 6 and Figure 7), the reasonable fertilization rate should be reduced when converting from a rice to a vegetable cropping system in the region. Considering the economic benefits, the vegetable cropping system with a zero-fertilizer application rate is recommended. Considering food supply security, the rice cropping system with a 50% conventional fertilization level is recommended. To balance the economic benefits, food security and GWP effect, the rice-vegetable rotation cropping systems (such RV, RRV and RVV) with 50% conventional fertilization for rice and no fertilization for vegetable are recommended in the region.

5. Conclusions

The DNDC model showed good performances in simulating the GHG emissions and yields in response to the cropping system conversions and fertilizations across the two years. Better model simulations were obtained for the rice than for the vegetable cropping systems, and for CH4 emission than for CO2 and N2O emissions. Further evaluations on the simulation of CO2 and N2O emissions during the conversion from a rice to a vegetable cropping system are needed for the model.
Both the measured and simulated data showed higher CO2 and CH4 emissions and GWP for the rice-dominant cropping systems than for the vegetable-dominant cropping system, and the inverse results for N2O emissions were obtained. The simulated long-term annual crop yields, CO2 and CH4 (about 10–40%) emissions and GWP (about 10–60% for total and 40–1480% for net GWPs), generally increased from a zero to 50% conventional fertilization level for these rice-dominant cropping systems, and remained relatively stable for these vegetable-dominant cropping systems, even at higher fertilization levels. On the other hand, the simulated N2O emissions increased 429% with the fertilization rates for the conversion of rice cropping systems to vegetable cropping systems. The rice-dominant cropping system with 50% conventional fertilization level is recommended considering the priority of food, and the vegetable-dominant cropping system without fertilization is recommended considering the priorities of reducing the GWP.

Supplementary Materials

The following supporting information can be downloaded at: https://www.mdpi.com/article/10.3390/agronomy13020379/s1, Figure S1. Soil organic carbon (SOC) pools and decomposition processes in DNDC (DOC is dissolved organic carbon content) (https://www.dndc.sr.unh.edu/model/GuideDNDC95.pdf). Figure S2. Annual (a) average dissolve organic carbon (DOC) and (b) total soil respiration from the 40-year simulations as influenced by cropping systems and fertilizations. R and V represent a rice year or vegetable year, respectively; 0F, 50F, 100F and 150F represent 0%, 50%, 100% and 150% of the conventional fertilization level in the experiment. Figure S3. Annual (a) Crop N uptake from soil, (b) N fixation and (c) soil N reductionfrom the 40-year simulations as influenced by cropping systems and fertilizations. R and V represent a rice year or vegetable year, respectively; 0F, 50F, 100F and 150F represent 0%, 50%, 100% and 150% of the conventional fertilization level in the experiment.

Author Contributions

Conceptualization, Q.F. and B.W.; methodology, Q.F. and X.S.; formal analysis, X.S., X.Y., J.H. and B.W.; validation, Q.F.; resources, X.S., Q.F. and B.W.; writing-original draft preparation, X.S.; writing-review and editing, Q.F. and B.W.; visualization, X.S., X.Y. and J.H.; supervision, Q.F.; funding acquisition, B.W. and X.S. All authors have read and agreed to the published version of the manuscript.

Funding

This research was funded by the Natural Science Foundation of Shandong Province (ZR2021QC113) Shandong Province modern agricultural industry technology system construction funds (no. SDAIT-02-06) and the Scientific Research Funds for High-level Talents of Qingdao Agricultural University (6631118021 and 6631120069).

Institutional Review Board Statement

Not applicable.

Data Availability Statement

The data that support the findings of this study are available from the corresponding author upon reasonable request.

Acknowledgments

We appreciate the field experimental data used in this study come from the Yuan et al.

Conflicts of Interest

The authors declare no conflict of interest.

References

  1. IPCC. Climate Change 2014: Mitigation of Climate Change. Contribution of Working Group III to the Fifth Assessment Report of the Intergovernmental Panel on Climate Change; Cambridge University Press: Cambridge, UK; New York, NY, USA, 2014. [Google Scholar]
  2. Yan, X.Y.; Akiyama, H.; Yagi, K.; Akimoto, H. Global estimations of the inventory and mitigation potential of methane emissions from rice cultivation conducted using the 2006 intergovernmental panel on climate change guidelines. Glob. Biogeochem. Cycles 2009, 23, GB2002. [Google Scholar] [CrossRef]
  3. Sun, B.; Dong, Z.; Zhang, X.; Li, Y.; Cao, H.; Cui, Z. Rice to vegetables: Short-versus long-term impact of land-use change on the indigenous soil microbial community. Microb. Ecol. 2011, 62, 474–485. [Google Scholar] [CrossRef]
  4. Yuan, Y.; Liu, C.; Dai, X.; Wang, H. Effects of land⁃use conversion from double rice cropping to vegetables on CO2 and CH4 fluxes in southern China. Chin. J. Appl. Ecol. 2015, 26, 147–154. (In Chinese) [Google Scholar]
  5. Yuan, Y.; Dai, X.; Wang, H.; Xu, M.; Fu, X.; Yang, F. Effects of land-use conversion from double rice cropping to vegetables on methane and nitrous oxide fluxes in southern China. PLoS ONE 2016, 11, e0155926. [Google Scholar] [CrossRef] [Green Version]
  6. Wu, L.; Wu, X.; Lin, S.; Wu, Y.; Tang, S.; Zhou, M.; Shaaban, M.; Zhao, J.; Hu, R.; Kuzyakov, Y.; et al. Carbon budget and greenhouse gas balance during the initial years after rice paddy conversion to vegetable cultivation. Sci. Total Environ. 2018, 627, 46–56. [Google Scholar] [CrossRef] [PubMed]
  7. Xu, P.; Han, Z.; Wu, J.; Li, Z.; Wang, J.; Zou, J. Emissions of Greenhouse Gases and NO from Rice Fields and a Peach Orchard as Affected by N Input and Land-Use Conversion. Agronomy 2022, 12, 1850. [Google Scholar] [CrossRef]
  8. Holzapfel–Pschorn, A.; Conrad, R.; Seiler, W. Effects of vegetation on the emission of methane from submerged paddy soil. Plant Soil 1986, 92, 223–233. [Google Scholar] [CrossRef]
  9. Nishimura, S.; Yonemura, S.; Sawamoto, T.; Shirato, Y.; Akiyama, H.; Sudo, S.; Yagi, K. Effect of land use change from paddy rice cultivation to upland crop cultivation on soil carbon budget of a cropland in Japan. Agric. Ecosyst. Environ. 2008, 125, 9–20. [Google Scholar] [CrossRef]
  10. Zhao, M.; Shao, R.; Yang, J.; Zhao, F.; Xu, M. Simulation of greenhouse gas fluxes in rice fields based on DNDC model. Chin. J. Ecol. 2019, 38, 1057–1066. (In Chinese) [Google Scholar]
  11. Wu, L.; Tang, S.; He, D.; Wu, X.; Shaaban, M.; Wang, M.; Zhao, J.; Khan, M.; Zheng, X.; Hu, R.; et al. Conversion from rice to vegetable production increases N2O emission via increased soil organic matter mineralization. Sci. Total Environ. 2017, 583, 190–201. [Google Scholar] [CrossRef] [PubMed]
  12. Li, J.; Shao, X.; Gou, G.; Deng, Y.; Tan, S.; Xu, W.; Yang, Q.; Liu, W.; Wu, Y.; Meng, L.; et al. Effects of water and fertilization management on CH4 and N2O emissions in double-rice paddy fields in tropical regions. Environ. Sci. 2021, 42, 3458–3471. (In Chinese) [Google Scholar]
  13. Yulianingsih, E.; Pramono, A.; Setyanto, P. Greenhouse gas emissions reduction and rice yield potential under bio-fertilizer application. IOP Conf. Ser. Earth Environ. Sci. 2021, 648, 012115. [Google Scholar] [CrossRef]
  14. Zhao, Z.; Cao, L.; Deng, J.; Sha, Z.; Chu, C.; Zhou, D.; Wu, S.; Lv, W. Modeling CH4 and N2O emission patterns and mitigation potential from paddy fields in Shanghai, China with the DNDC model. Agric. Syst. 2020, 178, 102743. [Google Scholar] [CrossRef]
  15. Wang, C.; Amon, B.; Schulz, K.; Mehdi, B. Factors that influence nitrous oxide emissions from agricultural soils as well as their representation in simulation models: A review. Agronomy 2021, 11, 770. [Google Scholar] [CrossRef]
  16. He, F.; Chen, Q.; Jiang, R.; Chen, X.; Zhang, F. Yield and nitrogen balance of greenhouse tomato (Lycopersicum esculentum Mill.) with conventional and site-specific nitrogen management in Northern China. Nutr. Cycl. Agroecosyst. 2007, 77, 1–14. [Google Scholar] [CrossRef]
  17. Deng, J.; Zhou, Z.; Zheng, X.; Liu, C.; Yao, Z.; Xie, B.; Cui, F.; Han, S.; Zhu, J. Annual emissions of nitrous oxide and nitric oxide from rice–wheat rotation and vegetable fields: A case study in the Tai-Lake region, China. Plant Soil 2012, 360, 37–53. [Google Scholar] [CrossRef]
  18. Zschornack, T.; Rosa, C.M.; Reis, C.E.S.; Pedroso, G.M.; Camargo, E.S.; Santos, D.C.; Boeni, M.; Bayer, C. Soil CH4 and N2O emissions from rice paddy fields in southern Brazil as affected by crop management levels: A three-year field study. Rev. Bras. Ciênc. Solo 2018, 42, e0170306. [Google Scholar] [CrossRef] [Green Version]
  19. Jiang, M.; Xu, P.; Zhou, W.; Shaaban, M.; Zhao, J.; Ren, T.; Lu, J.; Hu, R. Prior nitrogen fertilization regulates CH4 emissions from rice cultivation by increasing soil carbon storage in a rapeseed-rice rotation. Appl. Soil Ecol. 2020, 155, 103633. [Google Scholar] [CrossRef]
  20. Cheng, K.; Ogle, S.M.; Parton, W.J.; Pan, G. Simulating greenhouse gas mitigation potentials for Chinese Croplands using the DAYCENT ecosystem model. Glob. Chang. Biol. 2014, 20, 948–962. [Google Scholar] [CrossRef]
  21. Begum, K.; Kuhnert, M.; Yeluripati, J.; Ogle, S.; Parton, W.; Kader, M.A.; Smith, P. Model based regional estimates of soil organic carbon sequestration and greenhouse gas mitigation potentials from rice croplands in Bangladesh. Land 2018, 7, 82. [Google Scholar] [CrossRef] [Green Version]
  22. Hediger, W. Modeling GHG emissions and carbon sequestration in Swiss agriculture: An integrated economic approach. Int. Congr. Ser. 2006, 1293, 86–95. [Google Scholar] [CrossRef]
  23. Veltman, K.; Jones, C.D.; Gaillard, R.; Cela, S.; Chase, L.; Duval, B.D.; Izaurralde, R.C.; Ketterings, Q.M.; Li, C.; Matlock, M.; et al. Comparison of process-based models to quantify nutrient flows and greenhouse gas emissions associated with milk production. Agric. Ecosyst. Environ. 2017, 237, 31–44. [Google Scholar] [CrossRef] [Green Version]
  24. Fang, Q.X.; Ma, L.; Halvorson, A.D.; Malone, R.W.; Ahuja, L.R.; Del Grosso, S.J.; Hatfield, J.L. Evaluating four nitrous oxide emission algorithms in response to N rate on an irrigated corn field. Environ. Model Softw. 2015, 72, 56–70. [Google Scholar] [CrossRef]
  25. Cha-Un, N.; Chidthaisong, A.; Towprayoon, S. Using the DNDC model to predict methane emissions from crop-rice rotation systems. Res. J. Chem. Environ. 2017, 21, 3. [Google Scholar]
  26. Yadav, D.; Wang, J. Modelling carbon dioxide emissions from agricultural soils in canada. Environ. Pollut. 2017, 230, 1040. [Google Scholar] [CrossRef]
  27. Cai, Z.; Sawamoto, T.; Li, C.; Kang, G.; Boonjawat, J.; Mosier, A.; Wassmann, R.; Tsuruta, H. Field validation of the DNDC model for greenhouse gas emissions in East Asian cropping systems. Glob. Biogeochem. Cycles 2003, 17, 1107. [Google Scholar] [CrossRef] [Green Version]
  28. Zhang, X.; Bi, J.; Sun, H.; Zhang, J.; Zhou, S. Greenhouse gas mitigation potential under different rice–crop rotation systems: From site experiment to model evaluation. Clean Technol. Environ. Policy 2019, 21, 1587–1601. [Google Scholar] [CrossRef]
  29. Babu, Y.J.; Li, C.; Frolking, S.; Nayak, D.R.; Adhya, T.K. Field validation of DNDC model for methane and nitrous oxide emissions from rice-production systems of India. Nutr. Cycl. Agroecosyst. 2006, 74, 157–174. [Google Scholar] [CrossRef]
  30. Oo, A.Z.; Sudo, S.; Fumoto, T.; Inubushi, K.; Ono, K.; Yamamoto, A.; Bellingrath-Kimura, S.D.; Win, K.T.; Umamageswari, C.; Bama, K.S.; et al. Field validation of the DNDC-rice model for methane and nitrous oxide emissions from double–cropping paddy rice under different irrigation practices in Tamil Nadu, India. Agriculture 2020, 10, 355. [Google Scholar] [CrossRef]
  31. Pandey, A.; Dou, F.; Morgan, C.; Guo, J.; Deng, J.; Schwab, P. Modeling organically fertilized flooded rice systems and its long–term effects on grain yield and methane emissions. Sci. Total Environ. 2021, 755, 142578. [Google Scholar] [CrossRef]
  32. Fumoto, T.; Kobayashi, K.; Li, C.; Yagi, K.; Hasegawa, T. Revising a process-based biogeochemistry model (DNDC) to simulate methane emission from rice paddy fields under various residue management and fertilizer regimes. Glob. Chang. Biol. 2008, 14, 382–402. [Google Scholar] [CrossRef]
  33. Katayanagi, N.; Furukawa, Y.; Fumoto, T.; Hosen, Y. Validation of the DNDC-Rice model by using CH4 and N2O flux data from rice cultivated in pots under alternate wetting and drying irrigation management. Soil Sci. Plant Nutr. 2012, 58, 360–372. [Google Scholar] [CrossRef]
  34. Oertel, C.; Matschullat, J.; Zurba, K.; Zimmermann, F.; Erasmi, S. Greenhouse gas emissions from soils-A review. Geochemitry 2016, 76, 327–352. [Google Scholar] [CrossRef] [Green Version]
  35. Jiang, R.; Yang, J.; Drury, C.F.; He, W.; Smith, W.N.; Grant, B.B.; He, P.; Zhou, W. Assessing the impacts of diversified crop rotation systems on yields and nitrous oxide emissions in Canada using the DNDC model. Sci. Total Environ. 2021, 759, 143433. [Google Scholar] [CrossRef]
  36. Giltrap, D.L.; Li, C.; Saggar, S. DNDC: A process–based model of greenhouse gas fluxes from agricultural soils. Agric. Ecosyst. Environ. 2010, 136, 292–300. [Google Scholar] [CrossRef]
  37. Yin, S.; Zhang, X.; Lyu, J.; Zhi, Y.; Chen, F.; Wang, L.; Liu, C.; Zhou, S. Carbon sequestration and emissions mitigation in paddy fields based on the DNDC model: A review. AI Agric. 2020, 4, 140–149. [Google Scholar] [CrossRef]
  38. Yuan, Y.; Dai, X.; Wang, H. Greenhouse gas fluxes dataset effected by land–use conversion from double rice cropping to vegetables in southern China. J. Glob. Chang. Data Discov. 2018, 1, 99–106. [Google Scholar]
  39. Wang, J.; Wang, E.; Yin, H.; Feng, L.; Zhao, Y. Differences between observed and calculated solar radiations and their impact on simulated crop yields. Field Crops Res. 2015, 176, 1–10. [Google Scholar] [CrossRef]
  40. Willmott, C.J. On the Validation of Models. Phys. Geogr. 1981, 2, 184–194. [Google Scholar] [CrossRef]
  41. Yang, S.; Xiao, Y.; Xu, J.; Liu, X. Effect of straw return on soil respiration and NEE of paddy fields under water-saving irrigation. PLoS ONE 2018, 13, e0204597. [Google Scholar] [CrossRef] [Green Version]
  42. Nielsen, U.N.; Ball, B.A. Impacts of altered precipitation regimes on soil communities and biogeochemistry in arid and semi-arid ecosystems. Glob. Chang. Biol. 2015, 21, 1407–1421. [Google Scholar] [CrossRef] [PubMed]
  43. He, Y.; Siemens, J.; Amelung, W.; Goldbach, H.; Wassmann, R.; Alberto, M.C.R.; Lücke, A.; Lehndorff, E. Carbon release from rice roots under paddy rice and maize-paddy rice cropping. Agric. Ecosyst. Environ. 2015, 210, 15–24. [Google Scholar] [CrossRef]
  44. Liu, Y.; Hu, C.; Mohamed, I.; Wang, J.; Zhang, G.; Li, Z.; Chen, F. Soil CO2 Emissions and drivers in rice-wheat rotation fields subjected to different long-term fertilization practices. CLEAN-SOIL AIR WATER 2016, 44, 867–876. [Google Scholar] [CrossRef]
  45. Li, C.; Mosier, A.; Wassmann, R.; Cai, Z.; Zheng, X.; Huang, Y.; Tsuruta, H.; Boonjawat, J.; Lantin, R. Modeling greenhouse gas emissions from rice-based production systems: Sensitivity and upscaling, Glob. Biogeochem. Cycles 2004, 18, GB1043. [Google Scholar] [CrossRef]
  46. Yao, Z.; Zheng, X.; Dong, H.; Wang, R.; Mei, B.; Zhu, J. A 3-year record of N2O and CH4 emissions from a sandy loam paddy during rice seasons as affected by different nitrogen application rates. Agric. Ecosyst. Environ. 2012, 152, 1–9. [Google Scholar] [CrossRef]
  47. Ly, P.; Jensen, L.S.; Bruun, T.B.; de Neergaard, A. Methane (CH4) and nitrous oxide (N2O) emissions from the system of rice intensification (SRI) under a rain–fed lowland rice ecosystem in Cambodia. Nutr. Cycl. Agroecosyst. 2013, 97, 13–27. [Google Scholar] [CrossRef]
  48. Zhao, X.; Pu, C.; Ma, S.; Liu, S.; Xue, J.; Wang, X.; Li, S.; Lal, R.; Chen, F.; Zhang, H. Management-induced greenhouse gases emission mitigation in global rice production. Sci. Total Environ. 2019, 649, 1299–1306. [Google Scholar] [CrossRef]
  49. Intergovernmental Panel on Climate Change. 2006 IPCC Guidelines for National Greenhouse GAS Inventories; Institute for Global Environmental Strategies: Hayama, Kanagawa, Japan, 2006. [Google Scholar]
  50. Wang, X.; Gao, X.; Chen, X. Meta–analysis data quantifying nitrous oxides emissions from Chinese vegetable production. Data Brief 2018, 19, 114–116. [Google Scholar] [CrossRef]
  51. Akiyama, H.; Sano, T.; Nishina, K.; Sudo, S.; Oura, N.; Fujimori, M.; Uezono, I.; Yano, S.; Ohkoshi, S.; Fujita, Y.; et al. N2O emission factors for organic amendments in Japan from measurement campaign and systematic review. Sci. Total Environ. 2023, 864, 161088. [Google Scholar] [CrossRef]
  52. Liu, Z.; Jiang, L.; Li, X.; Härdter, R.; Zhang, W.; Zhang, Y.; Zheng, D. Effect of N and K fertilizers on yield and quality of greenhouse vegetable crops. Pedosphere 2008, 18, 496–502. [Google Scholar] [CrossRef]
  53. Liang, D.; Lu, X.; Zhuang, M.; Shi, G.; Hu, C.; Wang, S.; Hao, J. China’s greenhouse gas emissions for cropping systems from 1978–2016. Sci. Data 2021, 8, 1–10. [Google Scholar] [CrossRef] [PubMed]
  54. Shi, Z.; Jia, T.; Wang, Y.; Wang, J.; Sun, R.; Wang, F.; Li, X.; Bi, Y. Comprehensive utilization status of crop straw and estimation of carbon from burning in China. Chin. J. Agric. Resour. Reg. Plan. 2017, 38, 32–37. [Google Scholar]
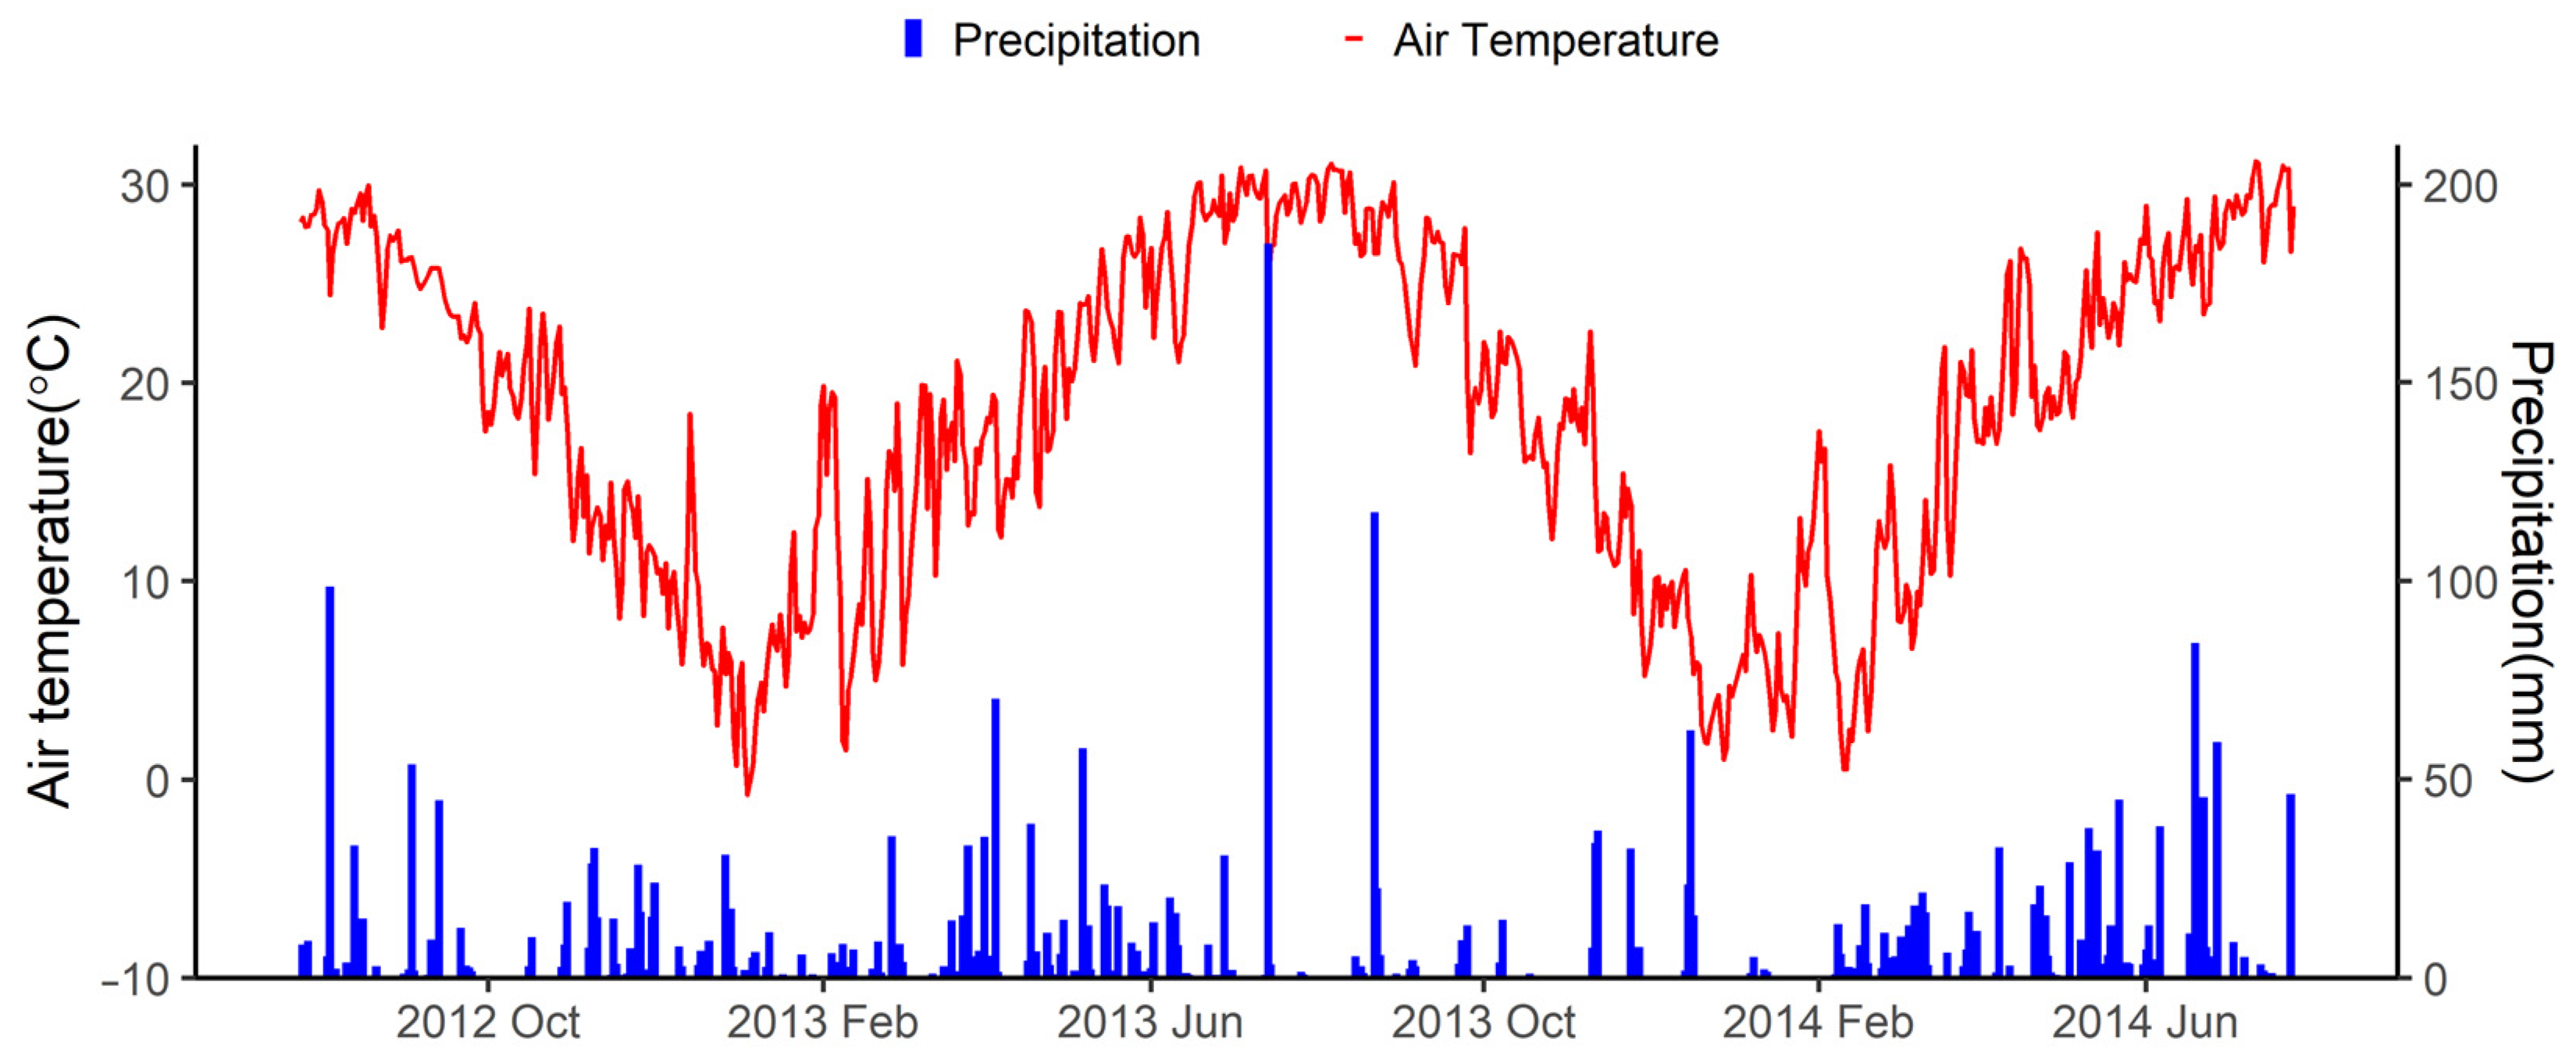
Figure 1. Daily air temperature and precipitation from 2012 to 2014 at the Qingyanzhou Ecological Research Station, south China.
Agronomy 13 00379 g001
Figure 2. Observed and simulated (ad) daily CH4 emission and (e,f) water depth from 2012 to 2014 under the different cropping systems and fertilization levels. RF: rice with fertilization; RNF: rice without fertilization; VF: vegetable with fertilization and VNF: vegetable without fertilization.
Agronomy 13 00379 g002
Figure 3. Observed and simulated (ad) daily CO2 emission and (e,f) soil temperature (5 cm) from 2012 to 2014 under different cropping systems and fertilizations. RF: rice with fertilization; RNF: rice without fertilization; VF: vegetable with fertilization and VNF: vegetable without fertilization.
Agronomy 13 00379 g003
Figure 4. Observed and simulated (ad) daily N2O emission under the different cropping systems and fertilizations from 2012 to 2014. RF: rice with fertilization; RNF: rice without fertilization; VF: vegetable with fertilization and VNF: vegetable without fertilization; red arrows indicated fertilizer application events; and blue arrows indicated irrigation events.
Agronomy 13 00379 g004
Figure 5. Observed and simulated seasonal (a) CO2, (b) CH4, and (c) N2O emissions and (d) crop yields under the different cropping systems and fertilizations from 2012 to 2014.
Agronomy 13 00379 g005
Figure 6. Average annual (a) CO2, (b) CH4 and (c) N2O emissions crop yield from the 40-year simulations as influenced by cropping systems and fertilizations. R and V represent a rice year or vegetable year, respectively; 0, 50, 100 and 150 F represent 0, 50, 100 and 150% of the conventional fertilization level in the experiment.
Agronomy 13 00379 g006
Figure 7. Average annual (a) total global warming potentials (GWPs), (b) net GWPs and (c) annual crop yields across the 40-year simulations as influenced by cropping systems and fertilizations. R and V represent a rice year or vegetable year, respectively; 0, 50, 100 and 150 F represent 0, 50, 100 and 150% of the conventional fertilization level in the experiment.
Agronomy 13 00379 g007
Table 1. The main management practices used for rice and vegetables cropping system from 2012 to 2014.
Cropping SystemCropGrowth PeriodTime of
Fertilization
N Applied
(kg N/ha)
P Applied
(kg P ha−1)
K Applied
(kg P ha−1)
RiceLate rice2012.7.30~2012.11.142012.7.3071.7 (Compound fertilize)31.359.5
2012.8.10107.5(Urea)
Early rice2013.4.24~2013.7.232013.4.2471.7 (Compound fertilize)31.359.5
2013.5.3107.5(Urea)
Late rice2013.7.27~2013.11.22012.7.2671.7 (Compound fertilize)31.359.5
2012.8.12107.5(Urea)
Early rice2014.4.25~2014.7.252013.4.1971.7 (Compound fertilize)31.359.5
2013.4.29107.5(Urea)
VegetablesCowpea2012.7.30~2012.10.262012.7.3071.7 (Compound fertilize)31.359.5
2012.8.2553.3(Urea)
White radish2012.10.31~2013.3.92012.10.3071.7 (Compound fertilize)31.359.5
Pepper2013.4.7~2013.7.232013.4.771.7 (Compound fertilize)31.359.5
2013.5.745.0 (Compound fertilize)19.637.3
2013.6.2145.0 (Compound fertilize)19.637.3
Chinese Cabbage2013.8.12~2013.10.202012.8.1271.7 (Compound fertilize)31.359.5
2012.8.2553.3 (Urea)
White radish2013.10.21~2014.4.182012.10.2171.7 (Compound fertilize)31.359.5
Pepper2014.4.19~2014.7.172013.3.2771.7 (Compound fertilize)31.359.9
2013.4.1945.0 (Compound fertilize)19.637.3
2013.6.1445.0 (Compound fertilize)19.637.3
Note: the consistent of elements in compound fertilizer was N: P2O5: K2O = 15%:15%:15%.
Table 2. The soil and crop parameters used by the DNDC model.
CategoryParameterValue
Soil propertiesLand-useRice paddy field
Textureloam
Bulk density (g/cm3)1.27~1.35 *
pH4.91~5.09 *
Clay fraction0.14
Conductivity (m/hr)0.025
Porosity (0–1)0.451
SOC at surface soil (0–10 cm) (kg C/kg soil)0.01
Bulk C/N10.09
Crop parameters Rice CowpeaWhite RadishChinese Cabbage Pepper
Grain max biomass production (kgC/ha/yr)3477.5 529.23760.735.050.8
Grain biomass fraction0.450.10 0.350.010.02
Annual N demand (kgN/ha/yr)119.5170.5232.8161.912.7
Thermal degree days for maturity (°C)20002300100025001800
Water demand (g water/g DM)508550 508450500
* The specific data of different treatments were in the Yuan et al. [5].
Table 3. Statistics for the observed and simulated daily CO2, CH4 and N2O emissions under the different cropping systems and fertilization levels. RF: rice with fertilization; RNF: rice without fertilization; VF: vegetable with fertilization and VNF: vegetable without fertilization; RMSE is root mean square error; R2 is coefficient of determination; d is d-index [40]. Different letters within a cultivar indicate significant differences between groups (p < 0.05).
ItemsTreatmentObserved MeanSimulated MeanRMSER2d
Daily CO2 emissions RF32.99 ± 2.07 a33.52 ± 2.27 a29.250.130.51
(kg C/ha/day)RNF24.33 ± 1.40 b29.97 ± 1.98 a28.460.050.44
VF24.85 ± 1.63 ab17.85 ± 1.46 b31.470.200.39
VNF23.84 ± 1.77 bc17.56 ± 1.64 b28.040.180.42
Daily CH4 emissions RF1.18 ± 0.15 a1.76 ± 0.27 a2.310.620.78
(kg C/ha/day)RNF1.14 ± 0.14 a1.52 ± 0.216 a1.620.690.86
VF0.00 ± 0.00 b0.00 ± 0.00 b0.010.020.09
VNF0.00 ± 0.00 b0.00 ± 0.00 b0.020.000.10
Daily N2O emissions RF0.008 ± 0.002 c0.003 ± 0.001 b0.030.000.16
(kg N/ha/day)RNF0.002 ± 0.000 d0.001 ± 0.000 c0.010.000.35
VF0.033 ± 0.004 a0.029 ± 0.020 a0.110.060.40
VNF0.017 ± 0.002 b0.021 ± 0.015 b0.110.010.11
Disclaimer/Publisher’s Note: The statements, opinions and data contained in all publications are solely those of the individual author(s) and contributor(s) and not of MDPI and/or the editor(s). MDPI and/or the editor(s) disclaim responsibility for any injury to people or property resulting from any ideas, methods, instructions or products referred to in the content.