Abstract
JA (Jerusalem artichoke) cultivars react differently to mineral fertilization. Hence, the aim of this study was to assess the effect of mineral fertilization on the yield and yield structure of this species in terms of its aboveground biomass. The research was based on a field experiment carried out in 2016–2018 in Central and Eastern Poland using the randomized subblock method, in a split-split-plot-dependent system. The factors of the first-order experiment were the cultivars of Jerusalem artichoke (JA) (‘Albik’, ‘Rubik’ and ‘Violet de Renes’), while the second-order factors were differentiated mineral fertilizers (N0P0K0 as a control object and P43, K124, N100, P43K124, N50P43K124m N100P43K124, and N150P43K124) converted to their elemental forms compared with the full dose of manure. The third-order factors were nitrogen forms, including ammonium nitrate and amide. The aboveground biomass yield and its structure were determined. The tested cultivars did not differ significantly in yield, but had different yield structures. The use of mineral fertilization brought measurable effects in the form of an increase in the yield of aboveground biomass. The ‘Albik’ cultivar responded best to mineral fertilization, with the highest yield of aboveground biomass being obtained after applying 150 kg N ha−1 in the form of ammonium nitrate against the background of constant phosphorus–potassium fertilization. The ‘Rubik’ cultivar responded most favorably to the addition of 50 kg N ha−1 in the amide form against the background of phosphorus–potassium fertilization, while the ‘Violet de Renes’ cultivar produced the highest yield of aboveground biomass after the application of 100 kg N ha−1 in the amide form, including PK fertilization. It was found that it was advantageous to use a combination of nitrogen and phosphorus–potassium fertilization.
1. Introduction
JA (Helianthus tuberosus L.) is a species belonging to the Asteraceae family, with a high yield potential. Currently, more than 300 cultivars and hybrids of this species have been identified in the world. Its cultivation covers 2.5 million hectares worldwide. In Poland, in 2022, the cultivation area of this species was less than 2000 ha [1]. The main producers of JA in Europe are France, Scandinavia, Great Britain and Austria. In Europe, this species is cultivated as a vegetable, fodder plant and energy plant. This species also has great healing properties [2,3] and is also used in soil reclamation for phytoremediation [4]. Depending on the cultivar, JA can reach a height of 4 m, has numerous side shoots and different numbers of leaves. This plant is highly effective in converting solar energy into biomass, both quantitatively and qualitatively. The aboveground part is excellent fodder for livestock in the form of green fodder or silage. It can be ensiled alone or in combination with grasses and legumes. The leaves themselves are a very good raw material for the production of high-quality feed in the form of granules or dried feed for monogastric animals, and can also serve as a raw material for the production of protein and protein–vitamin concentrates [5]. It is recommended to add silage with JA to the daily diets of cattle, sheep, goats, pigs of all ages, horses, rabbits, nutria and poultry [2,5]. Abdel-Wahab et al. [6] proved that the use of the JAEx extract as a feed additive significantly positively affected the performance, blood biochemistry, antioxidant indices, immunity and intestinal microflora of growing Japanese quails. Therefore, in the long term, JA has a chance to become a strategic point for the development of high-quality feed for livestock and game, mainly wild boar and deer. H. tuberosus is often planted in Europe by foresters and hunting clubs in forest clearings and on the edges of agricultural fields, the so-called ecotones, which are the so-called barrier plots for forest animals. This species can also be used to sow aviaries for birds, to which it gives a sense of security and shelter, and, at the same time, is valuable fodder [2].
There are many cultivars and clones of JA in the world. The general morphology and physiology of the JA may have a decisive influence on its productivity. Nevertheless, two genetically identical plants grown in different climatic, soil and geographical conditions may develop morphologically in different ways [7]. JA performs well in a variety of soil textures, such as sand, loam sand, sandy loam and loam with a pH of 5.2–7.2. JA is tolerant to both low and high air temperatures. This species adapts to different growing conditions and is widespread in areas with different types of climates, such as the Mediterranean, tropical, subtropical, monsoon and temperate climates [2,8]. JA is also drought-tolerant; however, Puangbut et al. (2013) observed that, under such conditions, plants are shorter and their leaf area, biomass, stomatal conductivity and photosynthesis rate decrease. A negative impact on JA yields was also noted under high substrate salinities [9]. Recently, research on JA has focused on the breeding of cultivars that will meet the relevant requirements, e.g., relating to the size and quality of the yield of aboveground biomass, as well as cultivars that respond favorably to organic and mineral fertilization [8,10].
One of the basic goals of agriculture is to maximize production. Achieving it is possible through, among other methods, the use of proper fertilization, which supports plant nutrition. Absorption by the plant of inorganic compounds from the soil solution, i.e., minerals, is the basis for its proper growth and development. There are about 50 different elements in plants, of which only 13, including nitrogen, phosphorus and potassium, are considered the most essential [11,12]. The efficiency of using these nutrients (NUE—nitrogen-use efficiency) is a measure of how well plants use the available minerals [13]. The improvement of the NUE is a prerequisite for the development of crop production. The elements that most often limit this growth are N, P, K and S. The NUE depends on the ability to effectively absorb nutrients from the soil, but also on the transport of elements in the plant, storage, mobilization and, finally, their use in the plant and even in the environment [13,14,15].
Mineral fertilization is one of the basic yield-forming factors of JA. However, too high and too low doses of mineral fertilizers may cause the deterioration of both the quantity and quality of the JA yield. In the cultivation of JA, phosphorus stimulates the development of the root system, resulting in increased resistance to water shortage and a lack of nutrients [14,16,17,18]. The content of these macroelements in the plant being correct betters the condition of the tissues, increasing resistance to frost and plant diseases. When the phosphorus content in the plant drops below 0.1%, the first symptoms of its deficiency appear, i.e., a change in the color of the leaves. Older leaves take on a dark green or even violet color and become short and narrow, shoots shorten, lateral buds die, the plant assumes a soaring habit, and, in case of high deficiency, growth is completely inhibited [19]. A deficiency of this element is the most dangerous in the early stages of plant growth, as it has a decisive influence on the rate of root growth and the plant’s ability to absorb nutrients and water from the soil [20]. The total content of phosphorus in soils is 0.02–0.5% P2O5, but only about 0.1% of this content is available to plants; therefore, fertilization with phosphorus is one of the basic agricultural practices [17,19,21].
Potassium deficiency drastically reduces nitrogen uptake by plants, which, in turn, affects their yield potential. The interaction between nitrogen and potassium boils down to a reduction in yield gains under the influence of nitrogen fertilization, and, thus, to greater absorption of potassium by plants. Proper supply of plants with potassium promotes nitrogen uptake. The role of this element is much wider and includes many factors responsible for photosynthesis, energy transformation, water management and osmotic processes, as well as nitrogen management [16,19,22,23]. The first symptom of an insufficient supply of potassium to the plant is inhibition of growth, especially of somatic cells. The first visual manifestation of potassium deficiency is the stunting of plants, which results from a direct potassium deficiency and an insufficient nitrogen supply [19].
A critical element for all living organisms is nitrogen, and its assimilation by plants is limited by its form in the ecosystem. The global N cycle has changed significantly recently due to the continued introduction of nitrogen fertilizers. The cycle of this element includes five main stages: biological N fixation, ammonification, nitrification, N assimilation to the pool of microbial biomass and denitrification. Chemical nitrogen fertilizers are often applied to the soil in amounts exceeding those required for plant growth, which leads to a loss of nitrogen [15,24]. Nitrogen deficiency can be indicated as the basic factor limiting the dynamics of the correct growth of JA plant biomass. This element is introduced into the soil in the form of nitrate ions (nitrate—N-NO3−), ammonium ions (N-NH4+) and amide ions (N-NH2−). Each of them has a different mode of action in the soil. Nitrate nitrogen is absorbed by plants the fastest, while ammonium nitrogen absorption is slightly slower. Amide nitrogen, on the other hand, is available to plants only after transformation in the soil into ammonium and nitrate forms [11,13]. Of the nitrogen used for crop growth, only 45–50% is incorporated into agricultural products, and the rest is exposed to significant losses [18,25]. The reaction of H. tuberosus cultivars to mineral fertilization, including N and its forms, may also vary. Information on alternative crop management strategies that can be adapted to Central and Eastern Europe, with its changing climate and poor soils, is scarce. Therefore, the aim of this study was to assess the effect of nitrogen fertilization against the background of the phosphorus–potassium and organic fertilization on the yield and aboveground biomass structure of several JA cultivars. An alternative research hypothesis was put forward, which assumed that nitrogen fertilization, including its different forms, will cause an increase in the aboveground biomass of JA and will favorably change its structure, in relation to the null hypothesis that nitrogen fertilization and its forms do not affect the yield potential or structure of the aboveground parts of JA.
2. Materials and Methods
2.1. Location of the Experiment
The field experiment was carried out in 2016–2018 at the Experimental Station in Parczew (51°38′ N, 22°55′ E) on Luvisols. Parczew is located in the Polesie region and is part of the West Polesie macroregion belonging to the Polesie sub-province, which is part of the East Baltic–Belarusian Lowland (Figure 1A,B).
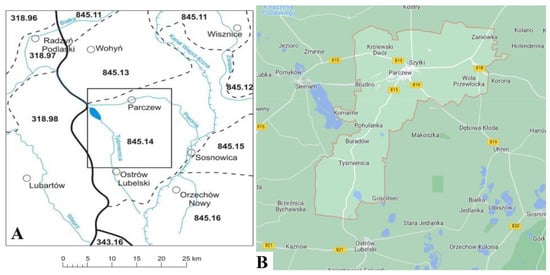
Figure 1.
Location of Parczew against the background of physico-geographical units: (A) Province: East Baltic–Belarusian Lowlands, sub-province: Polesie; (B) Location on the map of the Parczew commune in the Western Polesie, which is the part of the East Baltic–Belarusian Lowland province.
The soils here were formed from sandy and clay formations of glacial water origin, mainly boulder clays, sand and gravel and organogenic formations in accumulation valleys. These are acidic soils that were formed from rocks poor in alkaline components, particularly from sandy sediments, in a cool and humid climate under coniferous vegetation. These are lessive soils classified as medium-quality soils with a granulometric composition of loamy sand turning into clay. The tested soil, according to the criterion of agricultural suitability developed by the Institute of Soil Science and Cultivation in Puławy, was classified as a good rye complex [21].
2.2. Experimental Design
The experiment was set up as double-split experimental units (split-split-plot) in three repetitions. The first-order factors were the cultivars: ‘Albik’, ‘Rubik’ and ‘Violet de Rennes’. The second-order factors were the types of mineral fertilizers (P43, K124, N100, P43K124, N50P43K124, N100P43K124, N150P43K124 and N0P0K0 as a control object), calculated based on the elemental form of the fertilizers against the full dose of manure (30 t ha−l) and the third-order factors were the nitrogen fertilization forms, including urea (46%) and ammonium nitrate (34%).
2.3. Characteristics of Cultivars
The cultivars ‘Albik’ and ‘Rubik’ used in the experiment were from Polish breeding, while ‘Violet de Rennes’ was a cultivar of French breeding. The cultivars ‘Albik’ and ‘Rubik’ were bred by Prof. S. Góral at the Plant Acclimatization Breeding Institute in Radzików and entered on the list of cultivars of the Central Research Center for Cultivated Plants (COBORU) in 1997 [26]. They are characterized by a medium-scattered habit and stems of up to 3 m high with medium thickness and rich foliage. The tubers and flesh of the ‘Albik’ cultivar are white and spherical in shape, while the tubers of the ‘Rubik’ cultivar are club-shaped, with red–purple skin and white flesh. All three JA cultivars tested were late and characterized by high contents of dry matter and inulin, allowing them to be used for direct consumption, for animal feed, and for the food processing, pharmaceutical and energy industries [2]. The ‘Violet de Rennes’ cultivar was bred in 1985 by Dr. F. Le Cochec at La Station d‘Amelioration des Plantes Ecole Nationale de Rennes INRA. It is characterized by a long vegetation period (220–250 days). The plants reach a height of up to 2.5 m. The tubers are purple in color with white flesh and are pear-shaped. They form between July and the second half of November, and are fully formed in mid-November [7].
2.4. Soil Sampling
Soil samples were collected annually in the year preceding the establishment of the experiment, just after harvesting the forecrop, in accordance with applicable standards. Soil samples were taken from the topsoil (0–20 cm) in 5 replicates from each combination and repetition of the field experiment using a Nekrasov auger [27]. The obtained samples were homogenized and then stored in sealed foil bags at 4 °C. After drying and sieving through a 2 mm sieve, they were used for the physicochemical analysis of the soil.
2.5. Conducting a Field Experiment
In all years, the forecrop of JA was winter rape after harvesting, which was subjected to stubble cultivation combined with harrowing, and before winter, pre-winter plowing combined with plowing in manure was conducted, which was applied at a dose of 30 t ha−1. In the spring, cultivation and harrowing were carried out and mineral fertilization was applied. Phosphate fertilizers were applied in the form of triple superphosphate (48%) in the amount of 43 kg P ha−1 (i.e., 98.51 P2O5 ha−1), potassium fertilizers in the form of potassium salt 60% in the amount of 124 kg K ha−1 (i.e., 149.42 K2O ha−1) and nitrogen fertilization in the form of urea (46%) or ammonium nitrate (34%) in three doses of 50, 100 or 150 kg N ha−1. Nitrogen doses above 100 kg ha−1 were divided and applied on 2 dates, before planting and after the emergence of plants, during the 10th phase according to the BBCH scale [28]. JA tubers were planted with a potato planter to a depth of about 6 cm with a spacing of 62.5 × 40 cm, resulting in 40,000 plants ha−1. Between the plots, paths with a width of 2 m were marked out. The date of planting was related to the course of the weather—in 2016, it was on April 6; in 2017, it was on April 11; and in 2018, it was on April 16. After emergence, harrowing was carried out again, combined with rolling. Just before plant emergence, the herbicide Linurex 50 SC, with the active substance linuron ([3-(3,4-dichlorophenyl)-methylurea]), was applied in the amount of 2 L ha−1 to control dicotyledonous weeds. In phases 12–14 on the BBCH scale, the herbicide Fusilade Forte 150 EC was used, with the active substance fluazifop-P-butyl ((R)-2-[4-(trifluoromethyl-2-pyridyloxy)phenoxy] butyl propionate), in the amount of 150 g in 1 dm−3 for controlling monocotyledonous weeds. It was applied to the leaves with 300 L ha−1 of water. Agrotechnical treatments were carried out in accordance with the requirements of good agricultural practice. During the growing season, no diseases or pests that would require the use of fungicides or insecticides were found in any year of the study. The plot area for harvesting was 20 m2.
2.6. Collection of Plant Samples
The aboveground biomass was harvested once in the year, during the second half of October, before the onset of frosts. Plants were harvested at stage 91 on the BBCH 99 scale. The aboveground weight was measured on an electronic scale and determined to two decimal places. During harvest, samples of aboveground biomass were taken from 20 plants of each object and each field replication for the yield structure studies. Plant sampling points were randomly set at equal distances from each other, diagonally across the plot’s surface. During this operation, contamination or damage to the collected samples was avoided at all stages of the sampling process due to the possibility of influencing the analysis result. The sampling equipment was composed of materials that would not contaminate the collected research material [29]. In the aboveground biomass, the number of stems and side shoots, the number and weight of leaves and their percentage share in the weight of the aboveground parts or in the total number of stems and leaves were determined.
2.7. Determination of the Physical and Chemical Properties of the Soil
The granulometric composition of the soils was determined by analyzing the particle size distribution using a laser diffractometer. The samples were air-dried, then crushed in a porcelain mortar and sieved through a 2 mm sieve [21]. The contents of assimilable phosphorus (P2O5) and potassium (K2O) were determined in the soil samples using the Egner–Riehm method. Soil acidity was determined by the potentiometric method using a pH meter in 1 M KCl extract [30,31] and the humus content was determined by the Tiurin method [32]. At the same time, these samples were analyzed for the contents of carbon, pHKCl, pHH2O and mineral forms of nitrogen, such as N-NH4+ and N-NO3− [33,34].
2.8. Soil Conditions
The experiment was carried out on sandy-clay soil. According to the share of sand, silt and clay fractions, it was in a granulometric subgroup of loamy sand (average soil). The sand fraction accounted for 66.79%, the silt fraction accounted for 30.28% and the clay fraction accounted for 2.93%. The fractions of sand and silt were homogeneous in terms of the values of these features in 2016–2017. The granulometric composition within the clay fraction was homogeneous, i.e., it did not differ significantly between individual years (Table 1). The proportion of individual granulometric fractions corresponded to the composition of clay dust. In terms of agricultural suitability, these soils belong to the good rye complex, the agronomic category of medium soils [21].

Table 1.
Soil granulometric composition (2016–2018).
The physical and chemical properties of soils are presented in Table 2.
Table 2.
Physical and chemical properties of soils in Parczew (2016–2018).
The content of humus in the arable layer of the soil ranged from 1.62 to 2.15 g kg−1, and the highest content of organic compounds was found in the soil in 2018, which was homogeneous in the remaining years of the study. The average contents of available nutrients in the soil were as follows: high contents of available phosphorus (114 mg kg−1 of soil) and potassium (132 mg K kg−1 soil), average content of magnesium (34 mg Mg kg−1 soil), high abundances of manganese (151.67 mg Mn kg−1 soil) and zinc (8.20 mg Zn kg−1 soil), average content of iron (685 mg Fe kg−1 1 soil) and low contents of boron (0.56 mg B kg−1 soil) and copper (1.47 mg Cu kg−1 soil) (Table 1). However, the richness of assimilable macro- and microelements in the soils was variable between the years of research. The year 2018 was characterized by the highest abundances of magnesium and microelements in the soil. The soil available phosphorus content was significantly the highest in 2017 and significantly the lowest in 2018; the abundance of this macroelement in soil was homogeneous in 2016 and 2018. The soil had the significantly highest content of potassium in 2016 and the lowest in 2017; the soil abundance of this element turned was homogeneous in 2016 and 2018. The soil had the significantly highest content of potassium in 2016 and the lowest in 2017; the soil abundance of this element was homogeneous in 2016 and 2018. A similar relationship was observed in the case of the soil abundances of available zinc and iron, while in 2016 and 2018, homogeneous values of physicochemical properties were recorded in the cases of the contents of available manganese and copper. Only the content of assimilable boron in the soil did not differ significantly between the study years (Table 2).
Carbon and humus allow the estimation of the contents of organic matter in the soil, as well as the degree of its humification. The content of humus in the soil was significantly the highest in 2018 and significantly the lowest in 2017; the content was homogeneous in 2016 and 2017 (Table 2). The highest C content in the tested soil was found in 2018, and the lowest in 2016; the content of this element in the soil in 2016 and 2017 was homogeneous (Table 3).
Table 3.
Physical and chemical properties of soil under JA cultivation.
The total N content was significantly higher in 2018, and in that year, the value of the C:N ratio was the highest (Table 3). Higher nitrate activity, expressed as the amount of accumulated N nitrate, was recorded in 2018, and the lowest was recorded in 2017. Soil samples were characterized by significantly higher ammonification activity determined by the amount of ammonia N accumulated in 2018; this activity was homogeneous in 2017 and 2018 (Table 3). The soils on which the field experiment was carried out were characterized by a reaction from slightly acidic to neutral. The lowest soil pH value, both in KCl and H2O, was recorded in 2018, while the highest values of this feature were obtained in 2017 (Table 3).
2.9. Meteorological Conditions
Based on the decadal values of the Sielianinov index, monthly values were calculated, which were used to analyze meteorological data [34,35]. The meteorological conditions in the research years were very diverse (Table 4, Figure 1). The course of the weather during the growing season of 2016 was unusual. The average air temperature in the April–October period was 15.0 °C and was higher than the long-term average for this period by 2.0 °C.
Table 4.
Rainfall, air temperature and hydrothermal coefficients of Sielianinov during the growing season of JA according to the data from the meteorological station in Uhnin for 2016–2018.
In April and October, the average temperature exceeded the long-term norm by more than 30%. Precipitation during the growing season of plants was very unevenly distributed. The total precipitation amounted to 472.8 mm, of which more than half fell in August (262 mm), allowing this month to be described as extremely wet. It was preceded by an extremely dry July. In 2016, only August was extremely wet, May was a month of drought and the remaining months of vegetation were characterized by moderate drought (Table 4, Figure 2). In 2017, the average air temperature during the JA vegetation period ranged from 7.3 °C to 19.6 °C and was 1.3 °C higher than the long-term average. The hottest month was July and the coldest was October. The period of April–October was characterized by the lowest rainfall in three years. There were alternating months of extremely dry and extremely wet weather. The heaviest rainfall was recorded in May and July, while in April, August and October, it did not exceed 20 mm. In the growing season of 2018, the average air temperature was 14.2 °C, which was 1.2 °C higher than the long-term standard. The month with the largest deviations from the long-term norm was October (Figure 2). Sielianinov’s hydrothermal coefficient indicated that 2018 was generally optimal, both in terms of precipitation and air temperature. During the growing season, only June was dry, September was rather wet, October was very wet and the remaining months were optimal in this regard (Table 4).

Figure 2.
Comparison of precipitation and air temperature during the growing season of H. tuberosus in 2016–2018 according to data from the COBORU weather station in SDOO Uhnin.
2.10. Statistical Calculations
The study results were statistically analyzed using ANOVA analysis of variance. The analyzes were based on multiple T-Tukey tests, with an assumed significance level of p = 0.05. Calculations were conducted in SAS/STAT® 9.2 [36]. T-Tukey’s multiple comparison tests enabled detailed comparative analyzes of means by separating statistically homogeneous groups of means (homogeneous groups) and determining the so-called smallest significant differences in the means, which were marked as LSD in Tukey’s tests. The average letter indicators determined the so-called homogeneous (statistically homogeneous) groups. The occurrence of the same letter indicator with the means (at least one) indicated that there was no statistically significant difference between them [37]. SPSS Statistics 28 [38] was used to calculate the descriptive statistics.
3. Results
3.1. Aboveground Biomass Yield
The total yield of the aboveground parts of JA averaged 32.54 Mg ha−1. The genetic features of the tested cultivars did not vary in terms of the yield of the aboveground parts. A tendency to produce a higher yield weight of the aboveground parts of plants was only observed for the ‘Albik’ cultivar (Table 5).
Table 5.
Yield of fresh aboveground biomass of JA (Mg·ha−1).
All tested cultivars produced the lowest yields in the dry year of 2017 and the highest yields in 2018, with optimal weather conditions during the growing season of JA. The yields of the ‘Albik’ cultivar were homogeneous in 2016 and 2017, and the yields of the Rubik cultivar were homogeneous in 2016 and 2018 (Table 5). Mineral fertilization, regardless of other experimental factors, significantly modified the yield of aboveground matter (Table 5). The highest yield-forming effect was obtained for the plants fertilized with a dose of 150 kg N ha−1 in the form of ammonium nitrate against the background of constant phosphorus–potassium fertilization and a full dose of manure, in relation to the control object without mineral fertilization, but also in comparison with the plants fertilized with PK, K and P. A significant increase in the yield of aboveground biomass was obtained after applying a dose of 50 kg N ha−1 combined with phosphorus–potassium fertilization and manure, in comparison with the control object. A further increase in nitrogen fertilization did not cause a significant increase in the yield of aboveground matter compared to the previous dose. The effect of fertilization of JA with the amide form of nitrogen did not differ significantly from the ammonium nitrate form at doses of 50 and 100 kg N ha−1, but at the rate of 150 kg N ha−1, a significantly greater effect was obtained using the ammonium nitrate form than the amide form. Fertilization with single phosphorus and potassium fertilizers, as well as phosphorus–potassium fertilization alone, did not cause a significant increase in the yield of aboveground matter compared with the control (Table 5).
Table 6 contains data relating to the descriptive statistics of the JA aboveground biomass yields for individual fertilization treatments. The median ranged from 24.57 to 37.06. Skewness, which is a measure of the symmetry/asymmetry of a distribution, means that if the distribution is perfectly symmetrical, the value of skewness is zero. Only the application of P fertilization, 50 kg N fertilization in the ammonium nitrate form against PK fertilization, and fertilization of 100 kg N ha−1 in the amide and ammonium–nitrate forms against the background of fertilization PK fertilization were characterized by a left-skew asymmetry, with an extended left arm of the distribution. The other fertilization treatments were characterized by a right-skew distribution, with an elongated right arm of the distribution. The coefficient of variation (V) is a measure of relative volatility, which belongs to classical and positional dispersion measures, and can help to determine the degree of variation in the value of a variable. A high value of the coefficient means high differentiation of the trait and proves the heterogeneity of the studied population, while a low value of the coefficient indicates low variability of the trait and homogeneity of the studied population. The value of the variability coefficients of all tested fertilization treatments, except for PK + 50 kg N ha−1 in the form of ammonium–nitrate, which had medium variability, were characterized by very low variability in the examined feature (V from 10.03 to 21.96%) and high accuracy of the experiment (Table 6).
Table 6.
Descriptive statistics of the JA aboveground biomass yield depending on fertilization (means for cultivars and years 2016–2018).
The cultivar ‘Albik’ responded most favorably to mineral fertilization (Figure 3).

Figure 3.
Yields of fresh weight of the aboveground parts of JA depending on the cultivar and mineral fertilization (average in 2016–2018). Legend: control object—N0P0K0; P—43 kg P·ha−1; K—124 kg K·ha−1; as—ammonium sulfate; u—urea; Nu and Nas—100 kg N·ha−1; PK—P43K124; N1—50 kg N·ha−1; PK+N1—N50P43K124; N2—100 kg N·ha−1; PK+N2—N100P43K124; N3—150 kg N·ha−1; N3+PK—N150P43K124 kg ha−1. Letter indicators (a, b, c, etc.) next to averages refer to the so-called homogeneous (statistically homogeneous) groups. The occurrence of the same letter indicator next to the means (at least one) means that there were no statistically significant differences at p0.05 between them.
A significant increase in the fresh weight yield of the aboveground parts of this cultivar was noted after the application of nitrogen alone, in both its forms, against the background of organic fertilization. Another significant increase in the H. tuberosus biomass yield occurred only under the influence of 150 kg N ha−1 applied in the amide form. In the case of the ‘Rubik’ cultivar, a significant increase in the yield of fresh aboveground biomass was obtained by applying 50 kg N ha−1 in the amide form together with phosphorus–potassium fertilization. The cultivar ‘Violet de Rennes’ responded best to the application of the same dose of nitrogen, but in the form of nitrate–ammonium, compared with the control. Further increasing the nitrogen dose did not result in a significant increase in the aboveground biomass of this cultivar. In addition, significant differences were observed resulting from the form of the applied nitrogen fertilizer at a dose of 150 kg N ha−1 in the cases of the ‘Albik’ and ‘Rubik’ cultivars. The use of nitrogen in the ammonium nitrate form was more advantageous (Figure 3).
The atmospheric conditions in the years of research significantly determined the yields of fresh aboveground biomass JA (Table 5). The lowest value of this feature was obtained during the fairly dry and warm 2017 and the highest was obtained in 2018, which was optimal in terms of both precipitation and temperature. The difference in yield between these years was 28.6%. The yield of fresh matter in 2016 was significantly higher by 4.73 Mg ha−1 than that in 2017, but lower by 6.23 Mg ha−1 than that in 2018.
The interaction of years × fertilization was insignificant for the value of this feature (Table 5).
3.2. The Structure of the Yield of the Aboveground Parts of Plants
3.2.1. Mass of Aboveground Parts
The effect of cultivars, fertilization and years on the aboveground weights of the stems, leaves and plants, and the number of stems and leaves of JA is shown in Table 7. The average weight of the aboveground parts of JA plants was 0.66 kg plant−1, of which 0.43 kg plant−1 was attributed to the weight of stems and 0.23 kg plant−1 was attributed to the weight of leaves.
Table 7.
Structure of weights and numbers of the aboveground parts of JA.
The genetic properties of the tested cultivars had the greatest impact on the yield structure features. The cultivar ‘Violet de Rennes’ had the highest weight, both of whole plants and stems, and ‘Rubik’ had significantly the lowest weight. The weight of plants of the ‘Albik’ cultivar did not differ significantly from that of the ‘Violet de Rennes’ cultivar, but was significantly higher than that of the ‘Rubik’ cultivar. The weight of the stems of the ‘Albik’ cultivar was significantly lower than that of the ‘Violet de Rennes’ cultivar, but significantly higher than that of the ‘Rubik’ cultivar. The significantly largest mass of leaves was produced by the cultivar ‘Albik’ and the significantly lowest mass was produced by ‘Rubik’ (Table 7).
Mineral fertilization had a significant effect on the masses of both whole plants and their individual elements (Table 7).
The highest mass of leaves and stems, as well as the entire mass of aboveground parts, was obtained in plants fertilized with 150 kg of nitrogen; both forms of nitrogen were homogeneous in terms of the values of these features. A significant increase in the weight of a single plant occurred only in the objects fertilized with 100 kg N ha−1 of the amide form of nitrogen in comparison with the control object. Further increasing nitrogen fertilization did not result in a significant increase in the value of this feature. In addition, tendencies to increase the weights of the aboveground parts of plants were observed after the application of 50 kg N ha−1 against the background of constant phosphorus–potassium fertilization (Figure 4). In the case of the weight of leaves from one plant, a significant increase in the value of this feature occurred in combination with 50 kg N ha−1, applied in the ammonium nitrate form, while the application of nitrogen in the amide form exerted a significant effect only on objects fertilized with 150 kg N ha−1. Considering the weight of the stems of a single plant, their highest weight was found in the control object without mineral fertilization. A homogeneous value of this feature was obtained in the plants fertilized with 50 kg N ha−1 in the ammonium nitrate form, in combinations fertilized with 100 and 150 kg N ha−1 of both forms of nitrogen and in the treatment with the application of only nitrogen in the amide form. The highest mass of the aboveground parts of plants was obtained in the fairly dry and warm 2017 and the lowest was obtained in 2018, the optimal year both in terms of precipitation and temperature. The highest masses of leaves were obtained in 2016 and 2017, which were homogeneous in terms of their values, and the lowest was obtained in 2018, which was optimal in terms of precipitation and temperature. The weights of stems were the highest in 2017 and the lowest in the dry year of 2016 (Table 7).

Figure 4.
Leaf-to-stem ratios under the influence of mineral fertilization for H. tuberosus (2016–2018). Legend: control object-N0P0K0; P-43 kg P·ha−1; K-124 kg K·ha−1; as-ammonium sulfate; u-urea; Nu and Nas100 kg N·ha−1; PKP43K124; N1-50 kg N·ha−1; PK+N1N50P43K124; N2100 kg N·ha−1; PK+N2N100P43K124; N3150 kg N·ha−1; N3+PKN150P43K124 kg ha−1. Letter indicators (a, b, etc.) next to averages refer to the so-called homogeneous (statistically homogeneous) groups. The occurrence of the same letter indicator next to the means (at least one) means that there were no statistically significant differences at p0.05 between them.
The ratio of leaf weight to stem weight was the most important criterion in assessing the nutritional value of H. tuberosus. Plants that have more leaves than stems have better digestibility, taste and nutritional value. The most favorable ratio of leaves to stems was obtained with nitrogen fertilization at a dose of up to 50 kg N ha−1 in the ammonium nitrate form against the background of phosphorus–potassium fertilization and a full dose of manure. Fertilization with 100 kg N ha−1 in the same form with PK fertilization was homogeneous in this respect (Figure 4). Regression analysis showed a curvilinear dependence of the third-degree ratio of leaves to stems JA on mineral fertilization applied against the background of manure fertilization with a coefficient of determination equal to 66.54%, which proves its credibility (Figure 4).
3.2.2. Number of Stems and Leaves in the Aboveground Biomass
The highest share of the number of stems in the aboveground biomass was found in the cultivar ‘Violet de Rennes’ (mean 23.04 Pcs plant−1) and the largest share of leaves was found in the cultivar ‘Albik’ (mean 187.33 Pcs plant−1) (Table 7).
Mineral fertilization had a significant effect on the number of JA stems and leaves. An increase in the number of leaves and side shoots was found in the objects fertilized with a dose of 100 kg N ha−1 of amide against the background of phosphorus–potassium fertilization and a full dose of manure compared with the control object. A further increase in nitrogen fertilization produced homogeneous results compared with the previous dose of nitrogen and did not cause a significant effect in the form of an increase in the number of leaves and shoots (Table 7).
The JA plants were highly leafy, with an average of 169 leaves per plant. They also branched out well. The average number of side shoots growing from one tuber was 21 (Table 7). The cultivar ‘Albik’ was the leafiest and ‘Rubik’ had the fewest leaves. ‘Violet de Rennes’ was characterized by more foliage than ‘Rubik’, but significantly less foliage than ‘Albik’. The latter two cultivars produced the most leaves during the warm 2016, while ‘Violet de Rennes’ produced the most leaves in the rather dry and warm 2017.
The largest number of leaves was produced by plants fertilized with a dose of 100 kg N·ha−1 of amide applied together with phosphorus–potassium fertilization compared with the control, but this was not a significant effect (Table 7).
The reaction of the tested cultivars ‘Rubik’ and ‘Violet de Rennes’ to mineral fertilization varied under the influence of fertilization, but no significant differences were noted in the number of leaves produced by the cultivar ‘Albik’ (Figure 5). The ‘Albik’ cultivar showed tendencies for improved foliage after fertilization with single components and phosphorus–potassium and after application of nitrogen together with PK fertilizers, and fertilization of 100 kg N ha−1 amine and 50 kg N ha−1 ammonium nitrate was the most beneficial. The application of nitrogen fertilization in the amount of 100 kg N ha−1 of ammonium nitrate and 50 kg N ha−1 of amide resulted in a reduced number of leaves in the ‘Albik’ cultivar. The cultivar ‘Rubik’ produced the most leaves among the plants fertilized with 100 kg N ha−1 in the amide form against the background of phosphorus–potassium fertilization in comparison with the control object. The cultivar ‘Violet de Rennes’ produced the most leaves with a dose of 150 kg N ha−1, applied in the amide form, against the background of phosphorus–potassium fertilization compared with the control combination, fertilization with potassium, phosphorus–potassium fertilization and fertilization of 100 kg N·ha−1 against the background of PK fertilization; homogenous values of this feature were obtained in the experimental variants fertilized with the same dose of nitrogen in the amide form, with a dose of 100 kg N ha−1 in the ammonium nitrate form, against the background of PK fertilization and with the dose of 100 kg N ha−1 in both forms alongside manure fertilization (Figure 5).

Figure 5.
The effect of mineral fertilization and cultivar properties on the number of leaves (2016–2018); designations as in Table 5. Legend: control object—N0P0K0; P—43 kg P·ha−1; K—124 kg K·ha−1; as—ammonium sulfate; u—urea; Nu and Nas—100 kg N·ha−1; PK—P43K124; N1—50 kg N·ha−1; PK+N1—N50P43K124; N2—100 kg N·ha−1; PK+N2—N100P43K124; N3—150 kg N·ha−1; N3+PK—N150P43K124 kg ha−1; Letter indicators (a, b, etc.) next to averages refer to the so-called homogeneous (statistically homogeneous) groups. The occurrence of the same letter indicator next to the means (at least one) means that there were no statistically significant differences at p0.05 between them.
The largest number of side shoots was produced by ‘Violet de Rennes’, and the fewest were produced by ‘Albik’. The ‘Rubik’ cultivar was characterized by a greater tendency to branch and form side shoots than cv. ‘Albik’, but a smaller tendency than ‘Violet de Rennes’ (Table 7).
Mineral fertilization also had a significant effect on the number of side shoots. The largest number of side shoots was found in the objects fertilized with a dose of 100 kg N ha−1 in the amide form in comparison with the control object without mineral fertilization. It was also proven that the value of this feature was homogeneous for plants fertilized with 150 kg N ha−1 in the amide form and in combination with nitrogen fertilization at a dose of 50 kg N ha−1 in the nitrate–amide form (Table 7).
The tested cultivars reacted differently to mineral fertilization (Figure 6). The ‘Albik’ cultivar developed the largest number of side shoots in the objects fertilized with nitrogen, applied in the form of ammonium nitrate without phosphorus–potassium fertilization compared with the control object, as well as PK fertilization alone and fertilization with 100 kg N.ha−1 in the form of ammonium nitrate against the background of PK fertilization. In the case of the remaining cultivars, the significantly highest value of this feature was obtained in plants fertilized with nitrogen in the amide form against PK fertilization in amounts of 100 kg N ha−1 for ‘Rubik’ and 150 kg N ha−1 for ‘Violet de Rennes’ compared with the control; the treatments marked with the same letter did not differ significantly from each other.

Figure 6.
Effect of mineral fertilization and varietal properties on the number of shoots (2016–2018); designations as in Table 5. Legend: control object—N0P0K0; P—43 kg P·ha−1; K—124 kg K·ha−1; as—ammonium sulfate; u—urea; Nu and Nas—100 kg N·ha−1; PK—P43K124; N1—50 kg N·ha−1; PK+N1—N50P43K124; N2—100 kg N·ha−1; PK+N2—N100P43K124; N3—150 kg N·ha−1; N3+PK—N150P43K124 kg ha−1; Letter indicators (a, b, etc.) next to averages refer to the so-called homogeneous (statistically homogeneous) groups. The occurrence of the same letter indicator next to the means (at least one) means that there were no statistically significant differences at p0.05 between them.
This feature was also significantly modified by the meteorological conditions of the vegetation period. In the year 2018, with an excessively wet October, the number of lateral shoots produced by one plant was more than twice as low as that in the warm years of 2016 and 2017, which had different rainfall conditions (Table 7).
3.3. Descriptive Statistics of Yield and of Structure of Aboveground Biomass of JA
The descriptive characteristics of the examined features of the JA aboveground biomass yields are presented in Table 8. For the statistical characteristics, the median was taken into account because the data contained outliers; therefore, the average would not be a good measure for data analysis. This is because the mean is very susceptible to outliers.
Table 8.
Descriptive statistics of plant, stem and leaf weights, numbers of stems and leaves, and fresh weight yield of the aboveground parts of JA.
The coefficient of variation (CV), as a measure of the relative variability of features, independent of the scale of the units, belongs to the measures of dispersion (including both classical and positional measures) and can help to determine the degree of differentiation of the value of a variable feature. A high value of the coefficient indicates a strong differentiation of the trait and vice versa. The most stable feature of the yield structure was the number of leaves, and the most variable was the number of stems.
Kurtosis is a measure of the concentration of results and indicates how much our observations and results are concentrated around the mean. The kurtosis coefficient can take both negative and positive values. The kurtosis value itself (whether it is small or large compared with standard distributions) must be analyzed in the context of a normal distribution. Kurtosis in a normal distribution is 0. The variables in the analyzed data in Table 8 had a more “slender” distribution (higher concentration) compared with the normal distribution, had a positive kurtosis value and could be called leptokurtic distributions. Variables whose distributions have a kurtosis value similar to that of the normal distribution are called mesokurtic distributions.
Skewness is a measure of the asymmetry of the analyzed results. It informs how the results of a given variable are shaped around the mean. Are most of them to the left of the mean, close to the mean, or to the right of the mean? When the skewness coefficient is close to 0, it means that the results are not asymmetric. In the case of the data considered in Table 8, the skewness coefficient had values above ‘0′, which proves the right-sided asymmetry of the distribution (otherwise known as a positively skewed distribution) (Table 8).
4. Discussion
4.1. Effect of Fertilization on Aboveground Biomass Yield
In Europe, JA is usually planted in marginal soils with the belief that it requires fewer nutrients. However, if we want to achieve the assumed yield potential, we should pay attention to the nutritional needs and meet them with appropriate fertilization. Of all the nutrients required by JA, nitrogen (N), phosphorus (P) and potassium (K) are of the greatest importance, as the addition of these fertilizers to the soil improves the yield of H. tuberosus by encouraging the formation of large tubers and also increasing the proportion of leaves in the yield of aboveground biomass [3,14,39,40,41,42].
4.1.1. Effect of Nitrogen Fertilization on Yield
The highest yield-forming effect was obtained in objects fertilized with a dose of 150 kg N ha−1, applied in the form of nitrate–ammonium, against the background of constant phosphorus–potassium fertilization and a full dose of manure, in the relation to the control object without mineral fertilization, as well as in comparison with objects fertilized PK, K and P. However, from the environmental point of view, a significant increase in aboveground biomass was obtained after applying a dose of 50 kg N ha−1, combined with phosphorus–potassium fertilization and manure, in comparison with the control object. A further increase in nitrogen fertilization did not result in a significant increase in the yield of aboveground matter in relation to the previous dose of nitrogen. Sawicka and Kalembasa [18] and Matei et al. [40] confirmed that the use of mineral fertilizers has a positive effect on the yield of aboveground matter. Matei et al. [40] proved that nitrogen fertilization at a dose of 160 kg N ha−1 is the most beneficial against the background of phosphorus–potassium fertilization (160 P2O5 ha−1 and 80 K2O ha−1). Additionally, Izsáki and Kádi [43] found that increased doses of nitrogen alone and this element against the background of phosphorus–potassium fertilization resulted in higher yields of fresh and green aboveground matter. The highest value of this feature was obtained in the plants fertilized with 200 kg N ha−1 against the background of phosphorus–potassium fertilization. In turn, Epie et al. [44], using doses of nitrogen fertilizer of up to 90 kg N ha−1, did not find a significant increase in the yield of aboveground matter, but only tendencies to improve this parameter.
The effect of JA fertilization with the amide form of nitrogen did not differ significantly from that with the ammonium nitrate form at doses of 50 and 100 kg N ha−1, but with the application of 150 kg N ha−1, a significantly higher effect was obtained when using the ammonium nitrate form than when using the amide form. The different effects of both forms of nitrogen on the characteristics of the aboveground biomass result from the fact that each of them has a specific system of action in the soil. The ammonium form is well absorbed in the soil, it is taken up by plants more slowly, it works well at low temperatures and it is a typical form used in pre-sowing.
The use of nitrogen in the form of ammonium nitrate promotes the development of the root system; better branching; uptake of phosphorus, sulfur and boron, i.e., elements that stimulate the proper branching of plants; photosynthesis; plant resistance to abiotic factors; etc. The use of this form of nitrogen reduces the accumulation of nitrates in tubers and roots [20,23,24,44,45]. The amide form present in urea decomposes in the soil, first to the ammonium nitrate form and then to the nitrate form. The research carried out with JA confirmed that the amide form of nitrogen is slower acting than the ammonium nitrate form and is more useful for the spring fertilization of plants. According to Gworek et al. [24], the higher the soil is in culture, the higher the soil temperature and the higher the number of bacteria, the faster that urea works.
4.1.2. Potassium Fertilization
In the tests carried out, the JA cultivars showed a varied response to potassium fertilization. This was also confirmed by the research of Bogucka et al. [16]. The reaction of plants to potassium depends largely on the supply of nitrogen. The action of this element is defined as specific, which means that it cannot be replaced by another cation. This element is an essential component of the plant from the beginning of vegetation because it determines the rate of growth of the vegetative parts. The special and very important role of potassium results from its high content in tissues and physiological and biochemical functions. Potassium affects the efficiency of plant production not only by affecting the growth and development of plants, but also by increasing resistance to diseases and low temperatures. Mansour et al. [41] studied the effect of different doses of potassium (48, 72 and 96 kg K2O ha−1) in soil application and K2O at a concentration of 0.05 and 1.0% in foliar application on the growth, yield and quality of tubers of the JA cultivar ‘Fuseau’ grown in clay soil. JA fertilization at a dose of 72 kg K2O ha−1 via soil application and spraying plants with K2O at a concentration of 1% four times 75, 90, 105 and 120 days after planting had significant effects on the plant height; number of shoots per plant; N, P and K contents in the shoots and their uptake; and the total yield per plot. Meanwhile, application at 96 kg K2O ha−1 to the soil and spraying the plants with K2O at a concentration of 1% exerted a significant effect and resulted in an increase in the contents of total carbohydrates, inulin, K and dry matter in tubers compared with plants fertilized with 48 kg K2O ha. Finally, under the same conditions, JA fertilization in the amount of 72 kg K2O ha−1 applied to the soil and spraying the plants with K2O at a concentration of 1% reduced the consumption of potassium fertilizers by 25% and increased the total yield by 9.9% and 6.9% compared with fertilization of 96 kg K2O ha−1. The factor determining the extent of the nutritional needs of plants is the size of the crop and the abundance of this element in the soil.
In many regions and countries, the deficiency of this nutrient in the soil strongly reduces yields, especially of root crops. However, potassium fertilization does not always lead to an increase in yields. Factors such as the cultivar, yield size, canopy architecture, air temperature and interdependencies (soil–air–water) have a significant impact on the amount of uptake of the element [16,18,46]. Another factor determining potassium uptake is the structure and extent of the plant’s root system. The better-developed root system of JA plants than that of other root crops allowed for more effective use of the applied fertilizers, as well as the reserves of nutrients in the soil. JA plants take up more potassium from the reserves stored in the root zone than from manure. The effect of lower consumption of potassium fertilizers is, in turn, the excessive exploitation of soil resources and the resulting dependence of biomass yields on the course of the weather, plants’ greater sensitivity to drought, salinity and, at the same time, greater susceptibility to biotic stresses. The condition for the proper and effective control of the plant water supply is good plant nutrition with potassium and phosphorus. By applying appropriate mineral fertilization, especially with phosphorus and potassium, the effects of abiotic and biotic stress can be reduced. On the other hand, the effects of unbalanced potassium fertilization are manifested by increased susceptibility of JA plants to abiotic and biotic factors [18,19,20,46].
Bogucka et al. [16] found that increasing the dose of potassium fertilizer to 250 kg K2O ha−1 reduced the yield of fresh aboveground matter compared with plots fertilized with 150 kg K2O ha−1. When the potassium dose was increased to 350 kg K2O·ha−1, a slight and insignificant increase in the yield of fresh aboveground matter was observed. In turn, Izsáki and Kádi [43] proved that mineral fertilization caused an increase in plant weight and that, on average, by the 85th day of vegetation, JA plants of late cultivars accumulated 60% of the total mass of fresh, leafy stems and 84% of the total aboveground biomass by the 115th day. The maximum value of fresh plant biomass was observed by these authors on the 155th day of the growing season, i.e., 40% of the total fresh aboveground biomass was produced within 70 days, i.e., between the 85th and 155th days of the growing season.
4.1.3. Fertilization with Phosphorus
Phosphorus is one of the most important macroelements necessary for the proper functioning of plant and animal organisms. It plays an important role in many biochemical processes, as it occurs in compounds with a key role in metabolism, including nucleotides (NAD, NADP, FAD, FMN and CoA), nucleic acids (DNA and RNA) and high-energy compounds (ATP, NADPH, etc.). This element, through phosphorylation, activates enzymes involved in the processes of energy production and conversion, respiration, photosynthesis and synthesis of carbohydrates, fats and proteins [17,19,21,39]. Phosphorus, as a component of phospholipids, is a component of cell membranes and a building component of the cell wall (as a component of pectins) and plant reserve compounds (e.g., phytins) [14,17,19]. In the conducted studies, the effectiveness of phosphorus fertilization was demonstrated in the form of an increase in the yield of aboveground biomass amounting to 12.5%. Phosphorus increased the number of leaves by 12.1% and their weight increased by 10.5%, but it did not significantly affect the number of shoots and decreased their weight by 25% compared with the control. Thus, JA fertilization with phosphorus alone contributed to an improvement in the structure of the aboveground biomass and to obtaining a more delicate animal feed with a higher proportion of leaves. The correct content of phosphorus in plants is in the range of 0.1–1.0% of their dry matter mass and has a decisive impact on the quantity and quality of crops, as phosphorus particularly affects the generative parts of plants [17,18,19]. Depending on the pH of the soil, bioavailable phosphate ions contained in the soil solution may change into insoluble forms. In the soil, when the pH is lowered below 6.5, phosphorus is bound by Al3+ and Fe2+ cations, while an increase in the pH above 6.5 causes the binding of phosphorus by Ca2+ cations [4,18]. Phosphorus is one of the elements that are difficult to assimilate from the soil, which is related to the chemical relationships prevailing in the soil solution (pH) and temperature. At temperatures below 12 °C, the availability of phosphorus is significantly reduced (up to 70%), which, in the spring, decreases the availability of phosphorus and negatively affects the development of the root system of young plants. However, the negative symptoms of deficiency are transient and, usually, after a few days with a temperature of around 15 °C, the plants can continue to develop their root system. The contents of different soil phosphorus forms depend on the type and quality of soils, soil pH, degree of decomposition of organic compounds, degree of bedrock degradation and phosphate solubility [16]. However, the availability of phosphorus can be improved by changing the pH of the soil, e.g., from a too-high pH (alkaline), by acidification and the use of special preparations and fertilizers (e.g., with a dilute solution of phosphoric acid) [14,17].
4.2. Impact of Mineral Fertilization on the Aboveground Biomass Structure
An important process determining the productivity of plants is the distribution of assimilates from donors, i.e., mainly from leaves to organs constituting agricultural crops, which, in the case of JA, are both the tubers and aboveground parts. Therefore, the share of leaves in the total aboveground weight of plants is important. The conducted research showed that the weight of the stems accounted for approx. 65% and the weight of the leaves accounted for approx. 35% of the total aboveground weight. A similar ratio of leaves to stems was obtained by Sawicka [47], where the mass of leaves constituted about 30% of the whole plant. The leaves and their mass are important for the development of the fodder industry, as they contain approx. 120 g kg−1 of dry matter, including approx. 40 g kg−1 of protein, B vitamins, β-carotene and vitamin C (approx. g−1 fresh weight), and are also an excellent source of lutein. The nutritional value of 100 g of raw leaves is estimated to be about 34 Kcal (145 KJ) and they contain significant amounts of mineral salts, especially calcium, phosphorus and potassium. The Ca:P ratio in the leaves is 0.4:1 [17,48]. Factors significantly modifying the weight of both whole plants and their individual elements in our research were genetic properties and weather conditions, while mineral fertilization influenced their weights and numbers in a different way. The ratio of the leaf weight to stem weight is considered the most important criterion in assessing the nutritional value of H. tuberosus. The most favorable ratio of leaves to stems was obtained in the plants with nitrogen fertilization at a dose of 50 kg N ha−1 in the ammonium nitrate form against the background of phosphorus–potassium fertilization and the full dose of manure. Ghoneim [22] showed that the use of potassium fertilizer in a dose of up to 96 kg K2O significantly increased the number of shoots, fresh weight of plants and the proportion of leaves. Studies by Chołuj et al. [49] indicated, however, that the share of stems in the yield may exceed even 80%. The lower share of leaves in the weight of the whole plant, according to Sawicka and Michałek [50], resulted from the aging of the lower leaves during plant development, which, in turn, is caused by shading, which is aggravated by high air temperatures and a high density of plants in the canopy. According to Kantar et al. [51], the lower leaves are at a very competitive disadvantage and their photosynthetic efficiency decreases to the point where the destruction and recycling of many components of the cell occur until they die. Leaf shedding serves to reduce the number of older, less-productive crown leaves and to reduce plant maintenance costs.
The values of the shoot and leaf masses per plant were lower than those obtained by Lakić et al. [52], who obtained an average yield of 1.32 kg plant−1. The weight of one plant resulted not only from the use of fertilization, but also from the plant density per unit area. These authors used much lower plant density than that in our research. In turn, Ghoneim [22] found that delaying the harvest date from 120 to 180 days from planting in combination with the use of 96 kg of K2O was the most effective combination of treatments that resulted in vigorous growth of vegetation to be used as fodder in the summer season and obtaining higher yield potential. Additionally, El-Zohiri and Youssef [53] indicated that increasing the potassium dose from 72 kg K2O to the highest dose (120 kg K2O) significantly increased the fresh weight of the plant, the number of shoots per plant and the fresh weight of leaves.
The weight and number of JA leaves are also determined by their location on the plant. Sawicka [7], Kays and Nottingham [54], Kays and Kultur [55] and Žaldarienė [56] reported that the size of leaves initially increases with height on parent shoots or their side shoots, and then decreases toward the tip of the shoot. The leaves on the lower part of the stem are arranged opposite, and alternately on the upper part. There are also angular leaves that are small and located close to the stem. The leaves are usually smaller at the base of the stems, but increase in size until the mid-stem and then decrease toward the tip. The leaves on flowering shoots and side shoots are smaller than those on the main stems and non-flowering shoots. The leaf area index ranges from 4 to 6 and is considered optimal. Monti et al. [57] reported higher values of this indicator (5–8), depending on the degree of water supply to plants. The time to maximum leaf area index varies greatly depending on plant density. Sawicka and Michałek [50] proved that the maximum leaf area index eventually started to decrease due to the mutual shading of the leaves. Their final number and area vary depending on the plant population, as well as on their ontogenetic development [50,56,58]. This species is characterized by a large number and area of leaves (3.5–4.5 per 1 m2) and high availability of photoactive photosynthetic radiation of 2.1–2.7%, while, in the case of known agricultural plants, this indicator does not exceed 1 (7%) [5,56,58]. After the start of flowering, the number of leaves begins to decrease significantly until they are completely defoliated by frost. The reduction in the number of leaves occurs gradually during individual development stages throughout the growing season and at low temperatures due to the death of the aboveground parts of plants [56,58]. Their area can be analyzed using the LAI index, expressed as the ratio of the area of assimilation organs of the entire field to the area of land occupied by this field [50,59]. The value of this index at the end of vegetation is 5. The best vectors characterizing the efficiency and, thus, the yield-forming potential of H. tuberosus cultivars are physiological indices characterizing the photosynthetic apparatus of plants, such as the performance index (PII) and the maximum PSII quantum yield (FV/ FM) [6,60]. At the beginning of the vegetation period, the upper layer of the JA leaf canopy is characterized by a significantly higher index of photosystem II. This is accompanied by a higher maximum efficiency of the PSII quantum field. In August, a significant increase in the activity of the photosynthetic apparatus was observed. Sawicka et al. [60] proved that, at the end of the vegetation period, higher values of both the PI and the maximum quantum efficiency of photosystem II occurred in crops fertilized with mineral fertilizers.
The yield (harvest) index, which is the ratio of economic efficiency to biological productivity, is most often determined on the basis of the mass of the aboveground parts in relation to the total mass of plants, which provides an indicator of the relative distribution between tubers and aboveground biomass. H. tuberosus is characterized by a relatively high yield index due to the high possibility of reallocation of dry matter from the aboveground parts of plants to tubers during the second part of the vegetation period. The capacity of this process in the biomass of JA ranges from 67.7% to 94.9% and depends on genetic and environmental factors [11,41,60,61]. A higher yield index of this species is observed in early cultivars (0.60 to 0.78) than in late cultivars (0.50–0.55), despite their similar total yields per unit time [62]. According to McLaurin et al. [63], this ratio reaches a value of 0.70. The JA yield index generally increases under conditions that inhibit vegetative growth and flowering, such as shade, low temperatures and short days [6,62]. Diversified nitrogen fertilization causes the modification of processes in the photosynthesis apparatus during the growth of H. tuberosus plants. Sawicka et al. [60] found that a dose of 170 kg N ha−1 was optimal for the functioning of the photosynthesis apparatus of JA.
4.3. Influence of Cultivars on Yield and Aboveground Biomass Structure
The genetic features of the cultivars studied did not significantly differentiate the yields of the aboveground parts. However, a tendency to create more biomass was observed for the ‘Albik’ cultivar. The cultivars studied were in the same group of earliness and their yield variability coefficients were at similar levels (11.14–25.23%), proving the high stability of this feature. In the research by Bogucka [16] and Wierzbowska et al. [5], greater variability in the tested cultivars was observed, which could have been due to the different earliness groups of the cultivars, as well as different soil and climatic conditions.
The average mass of the aboveground parts of JA was 0.66 kg plant−1, which was lower than that obtained by Leontiev et al. [64], who obtained an average yield for one plant of 1.5 kg. However, the value of this feature was closely related to the plant density per unit area. Leontiev et al. [64] and Szpunar-Krok et al. [65] used a much smaller plant density in their plots than that in our research. A single plant of H. tuberosus produced, on average, 21 shoots and a total of 169 leaves. The foliage of the plants obtained in our research was much higher than that reported by Sawicka [48], Encheva [66] and Abdalla et al. [67]. Sawicka [47] reported that H. tuberosus plants produced an average of 31 leaves on the main shoot, while Encheva et al. [66] observed that wild JA plants produced an average of 39 leaves per plant. The number of leaves on a single plant depends on genetic properties [62,63,66], applied herbicides, meteorological conditions [47] and plant density per area unit [52,65]. The research by Szpunar-Krok et al. [65] showed that the yield of leaves of the ‘Albik’ cultivar accounted for 25% of the aboveground biomass, while in the aboveground biomass of the ‘Rubik’ cultivar, they only accounted for 10.1% of the total aboveground yield. The leaves of H. tuberosus are single, short and quite large, and their size is determined by environmental conditions and the location on the plant. the stomata in JA leaves are unevenly distributed and the upper part of the leaf blade contains fewer of them than the lower part [67]. The average number of stomata varies widely; on average, it is about 200 per 1 mm2. When the plant loses water, the stomata close, and when fresh water reaches the leaves, they open [54,55]. According to McLaurin et al. [63] and Sawicka and Michałek [50], the number of leaves and leaf area of H. tuberosus vary depending on the plant population. JA has a large number and area of leaves (3.5–4.5 m−2 of leaf surface per 1 m2 of surface) and high availability of photoactive photosynthetic radiation (2.1–2.7%). Against the background of the most well-known species of agricultural plants, whose area does not exceed 1.7%, it gives the plant a high position in terms of yielding potential. Manokhina et al. [10] indicated that the leaf area, depending on the cultivar, may range from 0.41 to 2.31 m2 per plant. After flowering begins, the number of leaves decreases significantly until they are completely defoliated by frost. However, the reduction in the number of leaves occurs gradually during individual development phases (the most intensive begins during BBCH scale 90, where 40% of the aboveground green parts of the plant dry out [28]) as the air temperature drops below 0 °C, caused by the death of the aboveground biomass of the plants [58]. According to McLaurin et al. [63], the number of leaves gradually increases until the flowering stage and then decreases as they fall from below due to their less favorable position for light reception. According to Swanton [68], the number of stems and thinner shoots is 30–50 Pcs plant−1. This was confirmed by the research by Kantar et al. [51], who reported that the number of JA stems can exceed 45 Pcs plant−1. There may be variations in fodder forms, as fodder should be cultivars with thin stems and a large mass of leaves [5].
The main factor in the variability of the JA aboveground biomass is genotypic variability associated with varietal characteristics. According to Sawicka et al. [2], the share of genotypic variability in the overall variability ranges from 1.4% to 36.8%. The dominant source of variation is the interaction of cultivars with climatic conditions. It has been proven that the size of the variance of the genotypic components, in the case of weight and the number of stems and leaves, is high and indicates the potential for improvement of these features by the selection of cultivars. However, in the case of JA, it is difficult because this species does not reproduce from seeds in the conditions of Central and Eastern Europe [2,69]. The proportion of genotypic variation for leaves or stems is low, suggesting that it is difficult to improve these traits through selection. Some ecotypes are better adapted to growth under nitrogen deficiency, while others are better able to cope with phosphorus deficiency [14,70]. Genetic diversity can be used to enrich plants with macronutrients through both conventional and modern plant breeding. At the same time, various genetic engineering approaches can be developed based on a better understanding of metabolic pathways and the expression patterns of chelating agent transporters and other related compounds. The most promising is the alleviation of macro- and micronutrient deficiencies in order to increase the mineral content of crops and, at the same time, increase their bioavailability by increasing the concentration of minerals absorbed [71].
4.4. Reaction of Cultivars to Mineral Fertilization
Let us note that, apart from the assumed factors causing the variability in each of the examined features, such as constant factors, i.e., varieties, fertilization, forms of nitrogen and variable, and random factors (years), there are additional sources of variability—interactions, i.e., a combined effect. Interactions indicate to what extent the influence of one factor depends on the level of the second and third factors. If it stays the same, there is no interaction. Otherwise, there is an interaction between two or three factors. The ability to detect significant interactions, and, thus, develop more complex research hypotheses about the reality around us, makes analysis of variance a very versatile tool. Using the t-test, we would not obtain identical results [37].
Our research confirms the hypothesis that the tested JA cultivars would react differently to increases in the doses of N fertilizer and to the form of nitrogen fertilizers used. The reaction of cultivars to applied fertilization was varied. The cultivar ‘Albik’ responded best to mineral fertilization, obtaining the highest yield of aboveground biomass after applying 150 kg N ha−1 in the form of ammonium nitrate against the background of constant phosphorus–potassium fertilization. The cultivar ‘Rubik’ reacted most favorably to the introduction of 50 kg N ha−1 in the amide form against the background of phosphorus–potassium fertilization, while the ‘Violet de Renes’ cultivar produced the highest yield of aboveground matter after applying 100 kg N ha−1 in the amide form alongside PK fertilization. Wierzbowska et al. [15] observed that the yield of the aboveground biomass of cv. ‘Gute Gelbe’ increased by 33.9% in response to 120 kg N ha−1, while that of the cultivar ‘Rubik’ by about 11% under the same dose compared with the non-fertilized plant. The above dose of N reduced the yield of aboveground biomass in cv. ‘Albik’ by 7% compared with the control object. So far, it has not been fully explained why H. tuberosus cultivars react differently to nitrogen fertilization, regardless of the length of the growing season. It is probably related to the morphological and anatomical structure of the leaves, as well as the rate of absorption of nutrients from the substrate. Nitrogen fertilizers, especially those applied as foliar fertilizers after the emergence of a crop plant, can penetrate the plants in two ways: through the surface of the leaf blade and through the stomata [60,67]. This may be related to the presence of wax on the surface of the leaves or various types of hairs on which drops or granules of post-emergence fertilizers can be retained. Plants growing in conditions of moisture deficiency produce a thicker cuticle layer, which protects against excessive loss of moisture and, thus, constitutes an additional barrier to the fertilizers used.
The tested cultivars reacted differently to mineral fertilization. No significant differences were noted in terms of the numbers of leaves and stems, while the individual fertilization combinations increased the yield of aboveground biomass and the number of leaves and side shoots of H. tuberosus. The cultivar ‘Albik’ significantly developed the largest number of lateral shoots in the plants fertilized with nitrogen in the form of ammonium nitrate without PK fertilization, and the remaining cultivars fertilized with nitrogen in the form of amide against the background of PK fertilization. A different reaction of plants to mineral fertilization, including the form of applied nitrogen, may result from the genetic values of the tested cultivars, as well as their growth rates. The cultivar ‘Albik’, which had the fastest initial growth rate, probably made better use of the nitrogen available in the ammonium nitrate form due to the fact that it is available faster because it does not have to undergo decomposition in the soil [25].
It recently appeared that there is also a great opportunity to use the aboveground biomass of JA as a source of biomass for the production of renewable energy [72]. Zelenkov et al. [73] reported that Uzbekistan started producing paper from JA stalks, which contain up to 45% cellulose. The papermaking process with JA has proven to be economically viable. The depletion of traditional energy sources and cellulose means another chance for JA to be used as an ecological raw material whose “deposits” are renewed every year, and its processing does not threaten the environment [2,73].
5. Conclusions and Prospects for the Future
The tested cultivars did not differ significantly in yield, but had different yield structures. The highest share of mass and number of leaves in the yield was found for the cultivar ‘Albik’, which predestines it for fodder purposes. The ‘Rubik’ cultivar, in terms of yield structure, was homogeneous with the cultivar ’Violet de Rennes’. Mineral fertilization is one of the basic factors supplying the soil with nutrients for plants. The dose of mineral fertilization and its favorable or unfavorable effect on the yield of JA aboveground biomass could not be unequivocally determined because each of the tested cultivars reacted differently to mineral fertilization. The cultivar ‘Albik’ responded best to mineral fertilization, which obtained the highest yield of aboveground biomass after applying 150 kg N ha−1 in the form of ammonium nitrate against the background of constant phosphorus–potassium fertilization. The cultivar ‘Rubik’ reacted most favorably to the application of 50 kg N ha−1 in the amide form against the background of phosphorus–potassium fertilization, while the cultivar ‘Violet de Renes’ produced the highest yield of overground matter after the application of 100 kg N ha−1 in the amide form alongside PK fertilization. It is beneficial to use nitrogen and phosphorus–potassium fertilization together. In the cultivation of JA for fodder, attention should be paid not only to the yield size of the aboveground matter, but also to its structure. The most favorable ratio of leaves to stems can be obtained using nitrogen fertilization in the amount of 50 kg N ha−1 in the form of ammonium nitrate together with phosphorus–potassium fertilization and a full dose of manure. In this respect, the results of fertilization with a dose of 100 kg N ha−1 in the form of ammonium nitrate together with PK fertilization and the full dose of manure were homogeneous.
In further research, it will be important to determine the suitable type of fertilization depending on the purpose of JA cultivation for aboveground biomass—whether it will be for fodder, energy or paper—because, in each of these cases, the yield structure (share and number of shoots and leaves) is important.
Author Contributions
Conceptualization, D.S. and B.S.; methodology, D.S.; software, P.B.; validation, E.J. and B.K.-M.; formal analysis, D.S.; investigation, P.B.; resources, B.K.-M.; data curation, E.J.; writing—original draft preparation, D.S.; writing—review and editing, B.S.; visualization, P.B.; supervision, E.J.; project administration, D.S.; funding acquisition, B.S. All authors have read and agreed to the published version of the manuscript.
Funding
This research received no external funding.
Data Availability Statement
Not applicable.
Acknowledgments
We would like to thank the University of Life Sciences in Lublin for administrative and technical support.
Conflicts of Interest
The authors declare no conflict of interest.
Abbreviations
| JA | Jerusalem artichoke |
| C:N | Carbon to Nitrogen ratio |
| N | Nitrogen |
| N-NH4 | Ammonium Nitrogen |
| N-NO3 | Nitrate |
| NUE | Nitrogen-use efficiency |
| PK | Phosphorus–potassium fertilization |
References
- Register.arimr.gov.pl. Available online: https://rejestrupraw.arimr.gov.pl/# (accessed on 20 November 2022). (In Polish)
- Sawicka, B. Słonecznik bulwiasty (Helianthus tuberosus L.). Biologia, hodowla, znaczenie użytkowe; Uniwersytet Przyrodniczy w Lublinie: Lublin, Poland, 2016; p. 241. ISBN 978-83-72-59-251-2. (In Polish) [Google Scholar]
- Krochmal-Marczak, B.; Sawicka, B.; Barbaś, P. Chapter 4. Utility meaning of Jerusalem artichoke. In Jerusalem Artichoke Food Science and Technology, 1st ed.; Helianthus Tuberosus; Sawicka, B., Krochmal-Marczak, B., Eds.; Springer Nature: Singapore, 2022; pp. 91–138. ISBN 978-981-19-0804-0. [Google Scholar] [CrossRef]
- Antonkiewicz, J.; Kołodziej, B.; Bielińska, E.J.; Witkowicz, R.; Tabor, S. Wykorzystanie karczocha jerozolimskiego do ekstrakcji metali ciężkich z komunalnych osadów ściekowych. Zmieniona gleba. Polish J. Środowisko. Stadnina 2018, 27, 513–527. [Google Scholar]
- Manokhina, A.A.; Dorokhov, A.S.; Kobozeva, T.P.; Fomina, T.N.; Starovoitova, O.A. Varietal Characteristics of Jerusalem Artichoke as a High Nutritional Value Crop for Herbivorous Animal Husbandry. Appl. Sci. 2022, 12, 4507. [Google Scholar] [CrossRef]
- Samal, L.; Chaturvedi, V.B.; Pattanaik, A.K. Effects of dietary supplementation with Jerusalem artichoke (Helianthus tuberosus L.) tubers on growth performance, nutrient digestibility as well as activity and composition of large intestinal microbiota in rats. J. Anim. Feed Sci. 2017, 26, 50–58. [Google Scholar] [CrossRef]
- Dascălu, T.; Munteanu, N.; Hamburdă, S.B.; Avasiloaiei, D.I. Results Regarding biological particularities study of Jerusalem Artichoke (Helianthus tuberosus L.), Lucrări Ştiinţifice, s. Horticultură 2013, 56, 167–172. [Google Scholar]
- Liava, V.; Karkanis, A.; Danalatos, N.; Tsiropoulos, N. Cultivation Practices, Adaptability, and Phytochemical Composition of Jerusalem artichoke (Helianthus tuberosus L.): A Weed with Economic Value. Agronomy 2021, 11, 914. [Google Scholar] [CrossRef]
- Dias, N.S.; Ferreira, J.F.S.; Liu, X.; Suarez, D.L. Jerusalem artichoke (Helianthus tuberosus L.) maintains high inulin, tuber yield, and antioxidant capacity under moderately-saline irrigation waters. Ind. Crops Prod. 2016, 94, 1009–1024. [Google Scholar] [CrossRef]
- Breton, C.; Breton, S.D.; Kiru, A.; Bervillé, N.Y. Anushkevich. Breeding of Jerusalem artichoke with the desired traits for different directions of use: Retrospective, approaches, and prospects. Agric. Biol. 2017, 52, 940–951. [Google Scholar]
- Boroń, F. Wymagania biotopowe w rozmnażaniu wegetatywnym topinamburu (Helianthus tuberosus L.) w warunkach uprawy wazonowej. Acta Juvenum 2021, 6, 21–27. (In Polish) [Google Scholar]
- Miller, A.J.; Cramer, M.D. Root nitrogen acquisition and assimilation. Plant Soil 2004, 274, 1–36. [Google Scholar] [CrossRef]
- Sawicka, B. Effectiveness of Nutrient Utilization for Food Security, Sustainable Development and Immunity. In Zero Hunger. Encyclopedia of UN Sustainable Development Goals; Leal Filho, W., Azul, A., Brandli, L., Özuyar, P., Wall, T., Eds.; Springer: Cham, Switzerland, 2020. [Google Scholar]
- Abbasian, A.; Ahmadi, A.; Abbasi, A.R.; Darvishi, B. Effect of different concentrations of phosphorus and calcium on potato tuber production. J. Plant Nutr. 2018, 41, 1765–1777. [Google Scholar] [CrossRef]
- Wierzbowska, J.; Cwalina-Ambroziak, B.; Bogucka, B. The Effect of Nitrogen Fertilization on Yield and Macronutrient Concentrations in Three Cultivars of Jerusalem artichoke (Helianthus tuberosus L.). Agronomy 2021, 11, 2161. [Google Scholar] [CrossRef]
- Bogucka, B.; Pszczółkowska, A.; Okorski, A.; Jankowski, K. The Effects of Potassium Fertilization and Irrigation on the Yield and Health Status of Jerusalem Artichoke (Helianthus tuberosus L.). Agronomy 2021, 11, 234. [Google Scholar] [CrossRef]
- Peltovuori, T. Phosphorus in Agricultural Soils of Finland—Characterization of Reserves and Retention in Mineral Soil Profiles. Ph.D. Thesis, Department of Applied Chemistry and Microbiology, University of Helsinki, Helsinki, Finland, 2006. [Google Scholar]
- Sawicka, B.; Kalembasa, D. Variation of macroelements content in tubers of Helianthus tuberosus L. at different levels of nitrogen fertilization. Acta Sci. Pol. Agric. 2008, 7, 67–82. [Google Scholar]
- Grzebisz, W. Pierwiastki w środowisku–Fosfor. J. Elem. 2003, 8, 160. (In Polish) [Google Scholar]
- Lemanowicz, J.; Koper, J. Zawartość wybranych form fosforu w glebie i kończynie łąkowej oraz aktywność fosfataz glebowych na tle zróżnicowanego nawożenia mineralnego i organicznego. Woda Sr. Obsz. Wiej. 2009, 9, 119–139. (In Polish) [Google Scholar]
- WRB. World Reference Base for Soil Resources. International Soil Classification System for Naming Soils and Creating Legends for Soil Maps; World Soil Resources Reports; Food and Agriculture Organization of the United Nations Vaile delle Terme di Caracalla: Rome, Italy, 2014; Volume 106, p. 192. [Google Scholar]
- Ghoneim, I.M. Effect of harvesting dates and potassium fertilization levels on vegetative growth, tuber yield and quality of Jerusalem artichoke. J. Agric. Env. Sci. Alex. Univ. Egypt 2005, 4, 37–63. [Google Scholar]
- Sowiński, J.; Szydełko-Rabska, E.; Kulczycki, G. Impact of different forms of nitrogen fertilizers on the content and uptake of microelements from sorghum. J. Elem. 2014, 19, 567–576. [Google Scholar] [CrossRef]
- Gworek, B.; Łabętowicz, J.; Kijeńska, M.; Tokarz, L.; Barański, A. Nitrogen transformations from nitrogen fertilizers in soils of central and eastern Europe in changing climatic conditions. Soil Sci. Annu. 2021, 72, 132440. [Google Scholar]
- Mahmud, K.; Panday, D.; Mergoum, A.; Missaoui, A. Nitrogen Losses and Potential Mitigation Strategies for a Sustainable Agroecosystem. Sustainability 2021, 13, 2400. [Google Scholar] [CrossRef]
- Gacek, E. (Ed.) Lista odmian roślin rolniczych; Pod red.; COBORU: Słupia Wielka, Poland, 1998. (In Polish) [Google Scholar]
- ISO 18400-205; Soil Quality-Sampling-Part 205: Guidelines for the Procedure for Testing Natural, Almost Natural, and Cultivated Areas. ISO: Geneva, Switzerland, 2018. Available online: https://www.iso.org/obp/ui/#iso:std:iso:18400:-205:ed-1:v1:en (accessed on 31 August 2022).
- Kliszcz, A. Phenological growth stages and BBCH-identification keys of Jerusalem artichoke (Helianthus tuberosus L.). Ann. Univ. Paedagog. Crac. Stud. Nat. 2021, 6, 203–225. [Google Scholar] [CrossRef]
- Anonymous. Procedura pobierania prób roślinnych. 2022. Available online: https://www.nexbio.pl/assets/upload/files/Analiza%20patogen%C3%B3w%20ro%C5%9Blin/%23Procedura%20pobierania%20pro%CC%81b%20ros%CC%81linnych.pdf (accessed on 31 August 2022). (In Polish).
- Egner, H.; Riehm, H.; Domingo, W.R. Untersuchungen über die chemische Boden Analyse als Grundlage für die Beurteilung des nahrstoffzustandes der Boden. II. Chemische extraktions-methoden zu Phosphor–and kalimbestimmung kungle. Lantbrukshoegsk. Ann. 1960, 26, 204–209. [Google Scholar]
- ISO 10390; Soil Quality–pH Determination. ISO: Geneva, Switzerland, 2005. Available online: https://www.iso.org/standard/40879.html (accessed on 31 August 2022).
- ISO 10694; Soil Quality–Determination of Organic and Total Carbon after Dry Combustion (Elemental Analysis). ISO: Geneva, Switzerland, 1995. Available online: https://www.iso.org/obp/ui/#iso:std:iso:10694:ed-1:v1:en (accessed on 30 September 2022).
- AOAC. Official Methods of Analysis of AOAC International, 18th ed.; Association of Analytical Communities: Gaithersburg, MD, USA, 2005. [Google Scholar]
- AOCS. Official Methods and Recommended Practices of the AOCS, 7th ed.; 2nd Printing; AOCS: Urbana, IL, USA, 2017; ISBN 978-1-630670-60-3. Available online: https://myaccount.aocs.org/PersonifyEbusiness/Store/Product-Details/productId/70978091 (accessed on 30 September 2022).
- Skowera, B. Zmiany warunków hydrotermicznych na obszarze Polski (1971−2010). Fragm. Agron. 2014, 31, 74–87. (In Polish) [Google Scholar]
- SAS, I.I. SAS/STAT®9.2. Users Guide; SAS Institute: Cary, NC, USA, 2008. [Google Scholar]
- Koronacki, J. Statistics, for Students of Technical and Natural Sciences; WNT: Warsaw, Poland, 2009; p. 491. ISBN 83-204-2994-3. [Google Scholar]
- SPSS Statistics, version 28.0.1. IBM: Armonk, NY, USA. Available online: https://www.ibm.com/uk-en/products/spss-statistics. (accessed on 31 August 2022).
- Ciereszko, I. Czy można usprawnić pobieranie fosforanów przez rośliny? Kosmos 2005, 4, 394–400. (In Polish) [Google Scholar]
- Matei, G.; Valda, V.; Pistacia, S.; Pânzaru, R.L.; Popa, D. Potential of Jerusalem artichoke (Helianthus tuberosus L.) as a biomass crop. Scientific Papers. Series A. Agronomy 2020, 63, 387–393. [Google Scholar]
- Mansour, F.; Abd El-Rahman, L. An Attempt to Reduce the Use of Potassium Fertilization in Jerusalem Artichoke Plants in Clay Soil. J. Soil Sci. Agric. Eng. 2021, 12, 603–610. [Google Scholar] [CrossRef]
- Sawicka, B.; Danilčenko, H.; Jariene, E.; Skiba, D.; Rachoń, L.; Barbaś, P.; Pszczółkowski, P. Nutritional Value of Jerusalem Artichoke Tubers (Helianthus tuberosus L.) Grown in Organic System under Lithuanian and Polish Conditions. Agriculture 2021, 11, 440. [Google Scholar] [CrossRef]
- Izsáki, Z.; Kádi, G.N. Biomass Accumulation and Nutrient Uptake of Jerusalem Artichoke (Helianthus tuberosus L.). Am. J. Plant Sci. 2013, 4, 1629–1640. [Google Scholar] [CrossRef]
- Epie, K.E.; Santanen, A.; Mäkelä, P.S.A.; Stoddard, F.L. Fertilizer and intercropped legumes as nitrogen source for Jerusalem artichoke (Helianthus tuberosus L.) tops for bioenergy. Agric. Food Sci. 2018, 27, 199–205. [Google Scholar] [CrossRef]
- Grześkowiak, A. Nawożenie mineralne w bezpłużnych technologiach uprawy roli. Nasza Rola 2007, 8, 18–19. (In Polish) [Google Scholar]
- Żołnowski, C. Badania nad Zmiennością Plonu i Cechami Jakości Ziemniaka Stołowego (Solanum tuberosum L.) Uprawianego Przy Zróżnicowanym Poziomie Nawożenia Mineralnego; Uniwersytet Warmińsko-Mazurski, Rozprawy i Monografie: Olsztyn, Poland, 2013; Volume 191, p. 259. ISBN 978-83-7299-832-3. (In Polish) [Google Scholar]
- Sawicka, B. Efekt stosowania herbicydów w uprawie Helianthus tuberosus L. Cz. II. Plon i struktura nadziemnych części roślin. Biul. IHAR 2002, 223/224, 397–414. (in Polish). [Google Scholar]
- USDA. National Nutrient Database for Standard Reference, Legacy Release. 2018. Available online: https://data.nal.usda.gov/dataset/usda-national-nutrient-database-standard-reference-legacy-release (accessed on 28 November 2022).
- Chołuj, D.; Podlaski, S.; Wiśniewski, G.; Szmalec, J. Kompleksowa ocena biologicznej przydatności 7 gatunków roślin wykorzystywanych na cele energetyczne. Stud. I Rap. IUNG-PIB 2008, 11, 81–99. (In Polish) [Google Scholar]
- Sawicka, B.; Michałek, W. Evaluation and Productivity of Helianthus tuberosus L. in the Conditions of Central-East Poland. EJPAU 2005, 8, 42. Available online: http://www.ejpau.media.pl/volume8/issue3/art-42.html. (accessed on 26 August 2022).
- Kantar, M.; Betts, K.; Hulke, B.E.; Stupar, R.M.; Wyse, D. Breaking tuber dormancy in Helianthus tuberosus L. and interspecific hybrids of Helianthus annuus L. × Helianthus tuberosus. J. Exp. Bot. 2013, 64, 421–431. [Google Scholar] [CrossRef]
- Lakić, Ž.; Balalaika, I.; Nožinić, M. Genetic variability for yield and yield components in Jerusalem artichoke (Helianthus tuberosus L.). Genetica 2018, 50, 45–57. [Google Scholar]
- El-Zohiri, S.S.M.; Youssef, M.E.A. Response of Jerusalem artichoke to cut off irrigation before harvest and fertilization with Ca, Mg and B. J. Product. Dev. 2015, 20, 61–81. [Google Scholar] [CrossRef]
- Kays, S.J.; Nottingham, S.F. Biology and Chemistry of Jerusalem Artichoke (Helianthus tuberosus L.); CRC Press Taylor & Francis Group: Broken Sound Parkway, NW, USA, 2008. [Google Scholar]
- Kays, S.J.; Kultur, F. Genetic Variation in Jerusalem Artichoke (Helianthus tuberosus L.) Flowering Date and Duration. Hort Science 2005, 40, 1675–1678. [Google Scholar] [CrossRef]
- Žaldarienė, S. Chemical Composition of Different Genotypes of Organic Jerusalem Artichoke (Helianthus tuberosus L.) along the Ontogenesis Cycle. Master’s Thesis, Aleksandras Stulginskis University, Akademija, Lithuania, 2017; p. 178. [Google Scholar]
- Monti, E.; Reggiani, C.; Franchi, M.V.; Toniolo, L.; Sandri, M.; Armani, A.; Zampieri, S.; Giacomello, E.; Sarto, F.; Sirago, G.; et al. Neuromuscular junction instability and altered intracellular calcium handling as early determinants of force loss during unloading in humans. J. Physiol. 2021, 599, 3037–3061. [Google Scholar] [CrossRef]
- Suturin, A.I.; Suturin, V.I. Artichoke-biotech crop XXI century. In Proceedings of the International Conference in Moskov, Moskow, Russia, 24–25 November 2011; pp. 24–25. (In Russian). [Google Scholar]
- Żyromski, A.; Szulczewski, W.; Biniak-Pieróg, M.; Okrasińska, H. Zastosowanie modelu wsmt do oceny ewapotranspiracji miskanta i topinamburu. Woda-Sr. Obsz. Wiej./Water-Environ. Rural. Areas 2012, 12, 401–409. (In Polish) [Google Scholar]
- Sawicka, B.; Michałek, W.; Pszczółkowski, P. The relationship of potato tubers chemical composition with selected physiological indicators. Zemdirb. Agric. 2015, 102, 41–50. [Google Scholar] [CrossRef]
- Cosgrove, D.R.; Oelke, E.A.; Doll, J.D.; Davis, D.W.; Undersander, D.J.; Oplinger, E.S. Jerusalem artichoke. In Alternative Field Crops Manual [online]; University of Wisconsin: Madison, WI, USA, 2011. [Google Scholar]
- Kocurek, M.; Pilarski, J. Implication of stem structures for photosynthetic functions in select herbaceous plants. Pol. J. Environ. Stud. 2012, 21, 1687–1696. [Google Scholar]
- McLaurin, W.J.; Somda, Z.C.; Kays, S.J. Jerusalem artichoke growth, development, and field storage. I. Numerical assessment of plant development and dry matter acquisition and allocation. J. Plant Nutr. 1999, 22, 1303–1313. [Google Scholar] [CrossRef]
- Leontiev, N.V.; Dubar, D.A.; Lugin, V.G.; Feskova, A.E.V.; Ignatovets, O.S.; Titok, V.V. Biological potential of Jerusalem artichoke as a feedstock for food and pharmaceutical industries. Chemistry, organic substances Technology and Biotechnology. Proc. BSTU 2014, 4, 206–209. [Google Scholar]
- Szpunar-Krok, E.; Bobrecka-Jamro, D.; Grochowska, S.; Buczek, J. Yield of the aboveground parts and tubers of Jerusalem artichoke (Helianthus tuberosus L.) depending on plant density. Acta Sci. Pol. Agric. 2016, 15, 69–78. [Google Scholar]
- Encheva, J.; Christov, M.; Ivanov, P. Characterization of Interspecific Hybrids between Cultivated Sunflower H. annuus L. (cv. Albena) and Wild Species Helianthus tuberosus. Helia 2003, 26, 43–50. [Google Scholar] [CrossRef]
- Abdalla, N.; Taha, H.; Arafa, N.; Ragab, M.; El-Miniawy, S.; Kovács, S.; Tóth, I.; El-Ramady, H.; El-Nady, M. Anatomical Studies on Three Jerusalem Artichoke (Helianthus tuberosus L.) Cultivars Grown in Hungary. J. Sus. Agric. Sci. 2022, 48, 101–109. [Google Scholar] [CrossRef]
- Swanton, C.J. Ecological aspects of growth and development of Jerusalem artichoke (Helianthus tuberosus L.). Ph.D. Thesis, University Western Ontario, London, ON, Canada, 1986; p. 181. [Google Scholar]
- Góral, S. Wartość użytkowa topinamburu (Helianthus tuberosus L.). Zesz. Probl. Postępów Nauk. Rol. 2000, 468, 17–30. (In Polish) [Google Scholar]
- Coetzee, P.E.; Ceronio, G.M.; Preez, C.C.D. Effect of phosphorus and nitrogen sources on essential nutrient concentration and uptake by maize (Zeal mays L.) during early growth and development. South Afr. J. Plant Soil 2017, 34, 55–64. [Google Scholar] [CrossRef]
- Benzaazoua, M.; Marion, P.; Liouville-Bourgeois, L.; Joussemet, R.; Houot, R.; Franco, A.; Pinto, A. Mineralogical distribution of some minor and trace elements during a laboratory flotation processing of Neves-Corvo ore (Portugal). Int. J. Miner. Process. 2002, 66, 163–181. [Google Scholar] [CrossRef]
- Sawicka, B. Energy value of Jerusalem artichoke (Helianthus tuberosus L.) as a source of biomass. Zesz. Nauk. UP Wrocław Rol. 2010, 97, 245–256. (In Polish) [Google Scholar]
- Zelenkov, N.; Romanova, N.G. Jerusalem artichoke: Agrobiological portrait and prospects for innovative use. Available online: https://www.topinambour.ru/information/170914195656.html (accessed on 20 November 2022).
Disclaimer/Publisher’s Note: The statements, opinions and data contained in all publications are solely those of the individual author(s) and contributor(s) and not of MDPI and/or the editor(s). MDPI and/or the editor(s) disclaim responsibility for any injury to people or property resulting from any ideas, methods, instructions or products referred to in the content. |
© 2023 by the authors. Licensee MDPI, Basel, Switzerland. This article is an open access article distributed under the terms and conditions of the Creative Commons Attribution (CC BY) license (https://creativecommons.org/licenses/by/4.0/).