Abstract
Chilo suppressalis is a major global host-specific pest of rice and water oat crops, having caused severe yield damage and great economic loss. The pest occasionally feeds on other plants, preventing them from completing a full life cycle. Dietary differences may shape the gut microbiota of the pest and may further influence its performance. In order to test this hypothesis, an assembly of the gut bacterial community of C. suppressalis larvae reared on rice, water oat, corn, and an artificial diet were investigated using an amplicon-based next-generation sequencing approach. The larval body size and feeding rate on each diet type were analyzed in parallel. We found that the size and feeding rate of C. suppressalis varied among the different dietary regimes, as a low feeding rate was found for rice and corn diets, whereas rice-fed larvae had the biggest body size and corn-fed larvae had the lowest body size. Further high-throughput sequencing results showed that the artificial-diet-fed larvae had the lowest bacterial diversity among all the samples, and the corn-fed larvae presented the most diversified microbial community. Further analysis revealed that the bacterial genera Enterococcus, Sphingobacterium, Klebsiella, Gluconobacter, Serratia, and Lactococcus possessed high abundance in C. suppressalis larvae, and the varied abundances contributed to the differences in community structure. The microbial function classification suggested that metabolic function categories significantly increased while the larvae were feeding on their preferred diet (rice and water oat) and decreased when on an artificial diet. This study expands our understanding of the microbe–insect interaction of C. suppressalis larvae in response to changes in diet, and is an essential step towards the future development of potential microbial-based pest management strategies.
1. Introduction
Rice (Oryza sativa) is considered the most popular staple food, which feeds more than three billion people around the world [1]. Rice is usually planted in a mosaic fashion or under a crop rotation system with ‘Jiaobai’, which is also called water oat (Zizania latifolia) [2]. The striped stem borer, Chilo suppressalis Walker (Lepidoptera: Crambidae), is one of the most destructive rice pests [3,4]. It primarily feeds on rice plants during the vegetative stage and causes yellowing and drying of the growing shoot, forming “dead hearts”. Furthermore, feeding during the reproductive stage of rice plants results in panicles with unfilled grains, which are known as “whiteheads” [5,6].
Water oat is often planted with rice, offering C. suppressalis an opportunity for host shift from rice to water oat [7]. Although C. suppressalis also attacks other plants, e.g., corns, only the larva that feed on either rice or water oat can complete a full life cycle [8]. Acquiring knowledge about the feeding habits of pests and their effects on crops is important in order to develop efficient integrated pest management strategies [9]. In addition, the larvae feeding on water oats perform differently compared with those feeding on rice [2,9,10,11,12,13]. The comparative transcriptome analysis of C. suppressalis revealed a difference in the expression levels of ribosome-inactivating proteins between those feeding on rice and water oat [2,14]. Furthermore, expression of the digestive enzymes in rice-fed C. suppressalis showed many notable differences compared with water-oat-fed larvae [2,15,16]. From another point of view, emerging studies have highlighted the profound effect of the host plant on shaping gut microbiota [15,17]. This raises an alternative scenario that may explain the varied performance of insects on different plants, where a normobiotic gut microbiota would promote host development, nutrition, and growth [18].
Nevertheless, the interactive relationship between insects and gut microbes are ubiquitous but vary greatly in terms of their functions and microbiome configurations [15,16,19]. Notably, an insect with compositional changes in the gut microbiota may result in different genetic and physiological consequences when it encounters biotic and abiotic stresses or even when living under ideal conditions [20,21]. However, the ways in which varied microbiome compositions and configurations change host performance in response to dietary changes remain elusive and are difficult to determine. Consequently, the study of gut microorganisms that contribute to the homeostasis of an insect has attracted great interest in the research field, which has been greatly facilitated by the growing availability of metagenomics [22]. Metagenomics is usually adopted to understand the existence and interactions of bacterial communities in a specific environmental niche [23]. Among the next-generation sequencing (NGS) methods, high-throughput 16s rRNA gene amplicon sequencing of the bacteria is useful in order to identify the microbes and has been widely applied [24,25], allowing us to identify both the taxonomy and the composition of the bacterial community [26,27]. Moreover, the profiling of the varied gut microbiota could be further linked to different phenotypes of host insects.
The aim of the current study was to use 16S rRNA amplicon-based NGS metagenomics in order to investigate the variation in the gut microbial community of C. suppresalis that feed on rice (O. sativa) and water oat (Z. latifolia). The microbiota of C. suppressalis that feed on corn (Zea mays) and an artificial diet were also included as a comparison. In parallel, we assayed the larval size and feeding rate on different diet regimes. The comparison of C. suppressalis gut microbiota associated with its performance in each diet would help to monitor the bacteria dominated in each C. suppressalis and identify the key bacteria participating in different biological processes during pest feeding, so as to understand its relation to pest growth.
2. Methods
2.1. Insect Maintenance and Sample Collection
Chilo suppressalis larvae (3rd-4th instar) were collected from Dawu County, Hubei Province, China, and were maintained on an artificial diet in a climatic chamber with 28 ± 1 °C, a 16:8 h light:dark photoperiod, and 80% relative humidity. An artificial diet was prepared as previously described [28]. A total of 600 newly hatched healthy larvae were used, with 150 larvae in each treatment group reared on four different types of diet: corn, rice, water oat, and an artificial diet for 20 days until they reached the fourth instar (LAAD: larvae fed on an artificial diet, LACO: larvae fed on a corn diet, LARE: larvae fed on a rice diet, and LAOAT: larvae fed on a water oat diet). Rice shoots, corn, and water oat pulps were collected from our experimental field at Huazhong Agricultural University, Wuhan, Hubei Province, China. The healthy and fresh plant materials were washed with distilled water three times and dried in the air before larvae feeding. Then, two-day-old fourth instar larvae were chosen separately for further analysis. The feed rate estimation experiment was performed for each diet, where a group of five larvae per sample was taken (n = 6). The experiment was performed by placing 100 mg of diet in each cup, and consumption was measured at 12 h and 24 h. The size of each larva used for the analysis was estimated by taking images of the larva (n = 20). The Image J application was used to determine the size of each larva in millimeters. After estimating the size of each larva, five larvae were taken for each sample (n = 3). The fourth instar larvae were surface sterilized using 75% ethanol for 1 min. Then, they were washed using distilled water three times each for 1 min, stabilized using PBS buffer for 1 min in order to maintain the osmotic pressure, collected in liquid nitrogen for 1 min, and stored at −80 °C for further analysis.
2.2. DNA Extraction
All the samples (whole individuals) were selected and were then surface sterilized in 75% ethanol for 60 s, followed by three rinses in sterile water. The guts were extracted, and five guts were pooled in a centrifuge tube for replication; each treatment had three replicates. The total DNA from the samples was extracted using the Insect DNA kit (OMEGA, Bio-Tek, Winooski, VT, USA) according to the manufacturer’s protocol. DNA quantity and quality were measured on a NanoDrop 2000 spectrophotometer (Thermo Fisher Scientific, USA). The integrity of the DNA after extraction was determined using a 1% agarose gel containing ethidium bromide. The extracted total DNA was preserved at −80 °C.
2.3. PCR Amplification and High-Throughput Sequencing
The V3-V4 variable region of the bacterial 16S rRNA gene was amplified with primers 338F (5′-ACT CCT ACG GGA GGC AGC AG-3′) and 806R (5′-GGA CTA CHV GGG TWT CTA AT-3′). The 20 μL PCR reaction used TransGen AP221-02: TransStart Fastpfu DNA Polymerase. The 20 μL reaction system contained 4 μL of 5 × FastPfu Buffer, 2 μL of 2.5 mM dNTPs, 0.8 μL of 5 μM Bar-PCR primer F, 0.8 μL of 5 μM primer R, 0.4 μL of FastPfu polymerase, 0.2 μL of BSA, and 10 ng of genomic DNA. PCR amplification was conducted in an ABI GeneAmp® 9700 thermocycler (IET, MA, USA) using the following protocol: 95 °C for 3 min followed by 30 cycles of 30 s at 94 °C, 30 s at 55 °C, and 45 s at 72 °C, and final extension for 10 min at 72 °C. The PCR products were examined by 2% agarose gel electrophoresis and purified using Agencourt AMPure XP beads (Beckman, Brea, CA, USA). Finally, the 16S rRNA gene amplicons quantified with 10 ng were pooled and subjected to the Illumina MiSeq platform for sequencing at Shanghai Majorbio Bio-pharm Technology Co., Ltd. (Shanghai, China).
2.4. Statistical and Bioinformatics Analysis
The 16s rRNA gene sequences generated were pair-end merged, their chimeric sequences were removed, and taxonomy assignment at Shanghai Majorbio Bio-pharm Technology Co., Ltd. The analyses were performed using the free online platform Majorbio Cloud Platform (www.majorbio.com, accessed on 16 October 2022). A higher-resolution equivalent of the operational taxonomic unit (OTU) at a 97% similarity level was obtained using the Software platform Usearch (version 7.0 http://drive5.com/uparse/, accessed on 16 October 2022) [29]. Afterward, the taxonomic analysis was performed using Silva software Silva for the bacterial 16S rRNA (http://www.arb-silva.de, accessed on 16 October 2022) [30,31,32,33,34,35]. In order to compare the feeding rates, the body size of C. Suppresallis larvae, and the values of α-diversity indices among the four diet groups, the means of cases were tested using a one-way ANOVA coupled with the Bonferroni test (equal variances) or the Dunnett’s T3 (unequal variances), or the nonparametric Kruskal–Wallis H test, depending on the normality of the data using SPSS (Version 27.0.1). An array of alpha and beta diversity measures was calculated using QIIME and were displayed using R software (Version3.3.1). Beta diversity was calculated, including a principal coordinate analysis (PCoA), and NMDS on the OTU level based on the Bray–Curtis distance using the Vegan package in R was performed in order to evaluate similarities between the samples. Within beta diversity (samples dispersion) was determined using an ANOSIM analysis based on Bray–Curtis using the Vegan package in R (Version3.3.1). The PICRUSt2 tool (https://github.com/picrust/picrust2, accessed on 16 October 2022) was used to predict the functional category abundances for 16S rRNA gene sequence data by standardizing the OTU abundant table.
3. Results
3.1. Analysis of Larval Size and Feeding Rate on Different Diet Regimes
The larvae that were fed on an artificial diet and those fed on a water oat diet consumed significantly greater quantities of food than the corn and rice groups. These larvae consumed about 6.25 mg per hour and 7.41 mg per hour to reach a size of 18.91 mm and 18.21 mm when fed on an artificial diet and a water oat diet, respectively (Figure 1). In comparison, the larvae consumed significantly lower quantities of corn (3.18 ± 0.44 mg per hour) and rice (2.79 ± 0.13)(one-way ANOVA, F3, 20 = 22.91, p < 0.001). However, rice-fed larvae (LARE) had the largest body size (20.45 ± 3.54) and corn-fed larvae (LACO) had the smallest body size (13.42 ± 2.35), suggesting that corn is not a preferable host for C. suppressalis larvae (Figure 1b).
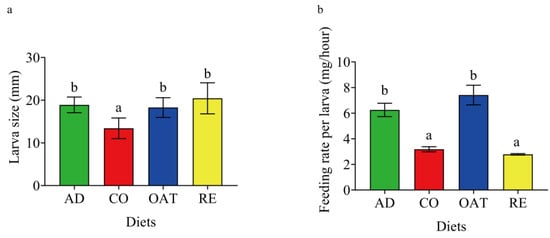
Figure 1.
Effect of diet regimes on the performance of C. suppressalis larvae. (a) Larval size on each diet. (b) Feeding rate of larvae on each diet. AD: artificial diet, CO: corn diet, RE: rice diet, OAT: water oat diet, LAAD: larvae fed on an artificial diet, LACO: larvae fed on a corn diet, LARE: larvae fed on a rice diet, and LAOAT: larvae fed on a water oat diet. Different letters indicate significant differences across the treatments, p < 0.05.
3.2. Microbial Richness and Diversity Indices
After quality filtering and removal of the redundant sequences from 24 samples, a total of 81,528 high-quality sequences were retained in the 16S rRNA (V3-V4 region) sequencing database, with a length between 200 and 520 bp and an average of 420 bp. The rarefaction curve showed that all the samples were of sufficient quantity (Figure S1). Based on the 16S prokaryotic OTU identification pipeline, all the detected OTUs belonged to the bacteria domain, and the 425 OTUs were classified into 247 genera, 123 families, 70 orders, 32 classes, and 19 phyla.
The alpha diversity was estimated using the Sobs, ACE, Chao1, Shannon, and Simpson indices (Table 1). The OTU number of water-oat-fed C. suppresallis larvae (LAOAT) was the highest (161.00 ± 25.14), followed by the LACO group (158.33 ± 31.56), the LARE group (75.33 ± 10.97), and the LAAD group (55.67 ± 20.14). There were significant differences in bacterial richness among the C. suppressalis larvae that were fed on a non-preferable diet compared to those fed on a preferable diet (Table 1; one-way ANOVA, p < 0.05). The bacterial diversity indices showed that the Shannon index of LAOAT (3.08 ± 0.10) was the highest, followed by LACO (2.28 ± 0.61), LARE (2.14 ± 0.11), and LAAD (0.15 ± 0.20). On the contrary, the Simpson index showed a different pattern; the index of LAAD (0.93 ± 0.01) was the highest and LAOAT (0.10 ± 0.02) was the least. There were significant differences in the bacterial diversity indices between the C. suppressalis larvae that were fed on artificial diets and those fed on natural diets (rice, water oat, and corn) (Table 1; one-way ANOVA, p < 0.05).

Table 1.
Comparison of alpha diversity indices (Mean ± SD) among different groups. Different letters indicate significant differences across treatments (p < 0.05).
Based on the detected OTUs across the 12 samples, the PCoA and NMDS analyses were performed in order to explain the beta diversity. The results from the PCoA and NMDS analyses showed that C. suppressalis larvae bacterial communities in different diet groups dispersed independently and distinctly from the other three groups (Figure 2a; ANOSIM test, R = 0.8889, p < 0.001). PCoA ordination suggested that each host species group presented a distinct microbiota, whereas LACO and LARE showed greater similarity. In the scatter plot, the first two principal coordinates, PCO1 and PCO2, explained 41.27% and 25.78% of the data variation, respectively, clearly separating each group. The ANOSIM analysis based on Bray−Curtis was used to show the variations between the groups and between the samples (sample dispersion or within beta diversity). In each diet group, the bacterial communities formed distinct clusters. LAAD individuals had relatively stable bacterial communities that formed tight clusters in the ordination space. The within beta diversity of LACO was significantly higher than that of LAAD and LARE (Figure 2c; ANOSIM test, R2 = 0.749, p = 0.001), which suggested that CO diets significantly affected the sample-to-sample variability compared to AD and RE. LACO individuals had the greatest dispersion.
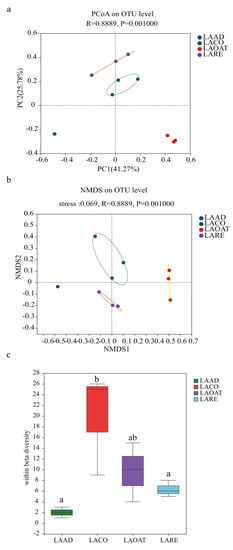
Figure 2.
Beta diversity and within beta diversity analyses of C. suppressalis larvae on different diets. (a) PCoA (principal coordinates analysis) based on the Bray−Curtis distance at OTU level. (b) NMDS (non-metric multidimensional scaling) diagrams based on the Bray−Curtis matrix at OTU level. (c) At each diet, variations of within beta diversity (sample dispersion) were measured as the distance of each sample from the centroid of each diet group. Distance was calculated using the OTU level of each sample group based on Bray−Curtis. The distribution of within beta diversity for each diet was visualized using boxplots (reported data: minimum, first quartile, median, third quartile, and maximum). LAAD: larvae fed on an artificial diet, LACO: larvae fed on a corn diet, LARE: larvae fed on a rice diet, and LAOAT: larvae fed on a water oat diet. Different letters indicate significant differences across the treatments, p < 0.05.
3.3. Microbial Community Structure
The taxonomic analysis at the phylum level revealed that Firmicutes was dominant in LAAD (99.41%) and LARE (45.36%) (Figure 3a). The other two groups were dominated by phyla Proteobacteria and Bacteridetes (Figure 3a). The relative abundance of Actinobacteria (10.38%) in LAOAT was higher compared to the other groups. Furthermore, the analysis was conducted at the genus level for the 16s database, revealing the presence of bacteria associated with each diet regime (Figure 3b). The feeding larvae of each diet regime showed greatly different bacterial communities. LAAD was dominated by Enterococcus (96.62%). The dominant genus was Gluconobacter (22.56%) in LACO, followed by Enterococcus (16.38%) and Klebsiella (14.64%). LAOAT contained a greater abundance of Sphingobacterium (25.40%) and Serratia (16.85%). The dominant genera in LARE were Enterococcus (22.44%), Lactococcus (20.46%), and Klebsiella (15.81%). A total of 28 genera were shared among all the gut samples, which mainly belonged to the phyla Proteobacteria, Acidobacteria, Firmicutes, and Bacteroidetes (Figure 3c). LAAD and LARE shared 5 genera, whereas LACO and LAOAT shared 53 genera. LARE had 11 unique genera and the other three larvae had over 27 specific genera (Figure 3c).
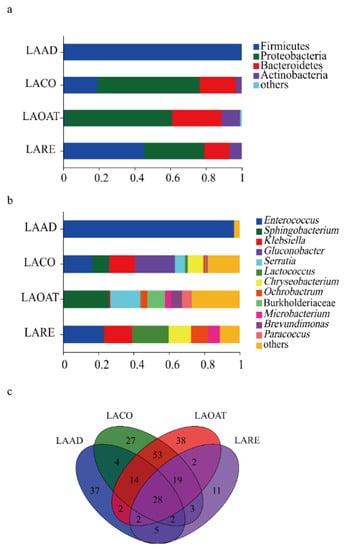
Figure 3.
The relative abundance and composition of gut bacterial communities in C. suppresallis. (a) Relative abundance of bacterial communities at the phylum level. (b) Bacterial community relative abundance at the genus level. (c) Venn diagram of the shared and unique genera among different diet groups. A few phyla and genera with a relative abundance lower than 0.05% of the total sequences were referred to as “others.” LAAD: larvae fed on an artificial diet, LACO: larvae fed on a corn diet, LARE: larvae fed on a rice diet, and LAOAT: larvae fed on a water oat diet.
Heatmaps of the top ten abundant genera in C. suppresallis fed with different diets are shown in Figure 4a. Genera including Lactococcus, Klebsiella, Chryseobacterium, Ochrobactrum, and Microbacterium were significantly more abundant in LARE (Figure 4b; Kruskal–Wallis H test, p < 0.05). In LACO, Gluconobacter, Enterococcus, Klebsiella, Chryseobacterium, Sphingobacterium, and Serratia had high abundance. The proportion of the genera Sphingobacterium and Serratia were significantly higher in LAOAT compared with the other three groups (Figure 4b; Kruskal–Wallis H test, p < 0.05). Gluconobacter, Burkholderiaceae, and Lactococcus were significantly more abundant in LACO, LAOAT, and LARE compared to LAAD, respectively (Figure 4b; Kruskal–Wallis H test, p < 0.05).
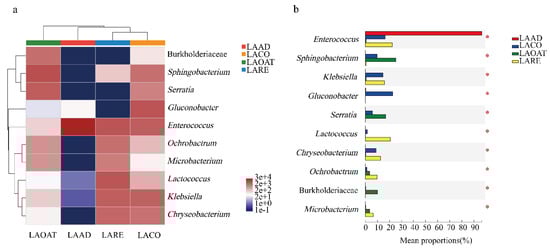
Figure 4.
Comparison of the top ten most abundant genera in the gut of C. suppressalis raised on four different diet regimes. (a) Heatmap of the relative abundance of the top ten shared genera. The colors indicate relative abundance ranging from blue grey (lower abundance) to white and red grey (higher abundance). The color scale represents the normalized values of relative abundances by log10. (b) Relative abundances of the top ten genera that showed statistical differences among samples. LAAD: larvae fed on an artificial diet, LACO: larvae fed on a corn diet, LARE: larvae fed on a rice diet, and LAOAT: larvae fed on a water oat diet.
3.4. Function Diversity in the Microbiota of C. suppressalis
The abundances of KEGG pathways were predicted using PICRUSt based on 16S rRNA gene sequences. We displayed the pathway abundances at two levels using heatmaps (pathway level two and pathway level three) (Figure 5). In pathway level two, carbohydrate metabolism, amino acid metabolism, and membrane transport were enriched in all the groups except LAAD (Figure 5a). At pathway level three, metabolic pathways, the biosynthesis of secondary metabolites, the microbial metabolism in diverse environments, and ABC transporters were enriched in LACO, LAOAT, and LARE (Figure 5b).
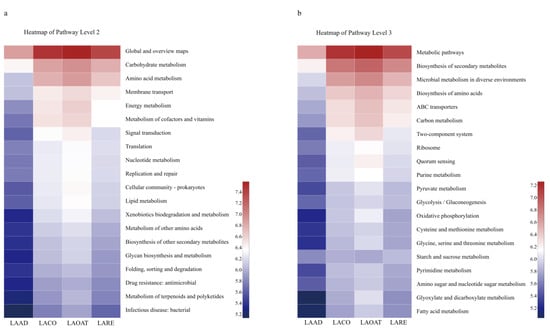
Figure 5.
Prediction of KEGG functions for C. suppresallis gut bacteria reared on different diets. (a) Function prediction in pathway level two. (b) Function prediction in pathway level three. LAAD: larvae fed on an artificial diet, LACO: larvae fed on a corn diet, LARE: larvae fed on a rice diet, and LAOAT: larvae fed on a water oat diet.
4. Discussion
Research relating to gut microbial communities has become a hot topic due to their profound relationship with an animal host’s health. Similarly, numerous studies have been devoted to learning the structure and function of gut microbial communities in insects [36]. Previous investigations have reported that the gut microbiota contributes to entomic nutrition, shapes the host metabolism and immune system [37,38,39], and plays an important role in intra- or inter-specific communication [40]. Since an insect’s diet regime could profoundly influence the structure of their gut microbiota [25,40,41,42], theoretically, an artificial intervention and manipulation of a pest’s gut microbiota may be a potential approach for sustainable pest management [36]. In order to achieve this target, it is a prerequisite to clarify the relationship between an insect’s pest and its varied gut microbiota. A key result was that the potential effect of gut microbiota (beneficial or deleterious to C. suppressalis) depends on the diets tested. The gut microbiota seemed to promote C. suppressalis growth in a rice dietary regime, whereas its development was hindered when corn was used as a diet. When reared on the artificial diet, the host and microbiota showed a commensal relationship, suggesting the various diet-derived nutrients are in sufficient abundance and their consumption by the gut microbiota does not limit host performance.
Previous studies have investigated the effects of rice and oat as a preferable host for larval growth [13]. The larvae that were raised on oat showed a bigger body size, associated with bigger wings, lower rates of mortality, higher sexual activity accompanied with a greater production of pheromones, and shorter larval developmental periods [10,11,12,13]. Consistent with previous studies, the larvae that were fed on rice or oat had a significantly larger body size than those fed on corn. Furthermore, it seems as though the pest could acquire sufficient nutrition with the lowest feeding rate on host rice. The larvae also showed a high preference for oat in terms of feeding rate. The reason why C. suppressalis showed such an obvious opposite feeding rate on the two favorable host plants deserves further study. Nevertheless, we can conclude that the preference of C. suppressalis among different diets could reflect its fitness consequences to some degree, which is independent of the feeding rate of C. suppressalis on different diets. Corn is not an ideal food for the pest as the body size of corn-fed larvae was significantly smaller than the larvae reared on the other three foods, and it also showed a low feeding rate.
A series of biotic and abiotic factors are known to influence the composition of animal gut microbiota in a context-dependent way and often show different patterns [43,44]. Among these factors, food is the most prominent as it has both different nutritional contents and diet-associated microbiota. For example, diet can affect the composition and abundance of gut microbiota and shapes the phenotypic traits (i.e., development, body mass, food preference, body reserves, metabolic rate, and stress tolerance) of Drosophila melanogaster [45]. However, we previously found that varied dietary nutrients have limited impacts on the composition of gut microbiota in a spider, which can maintain a relatively stable assembly of gut microbiota [46]. Here, we found that different dietary regimes could profoundly shape the assembly of C. suppressalis gut microbiota as the gut samples in each diet were clustered together and were independent from the samples in other diets. Hammer et al. suggested that caterpillars lack a stable gut microbiota which is strongly affected by host plants [47]. In line with this conclusion, only six genera were shared by C. suppressalis larvae that were fed four dietary regimes. Further evidence is needed to determine whether these six genera are the core microbiome of the pest. Furthermore, according to the Anna Karenina Principle, larvae in stressed situations would have more dispersed gut microbiota [48]. The within beta diversity of the gut microbial community in corn-fed larva is significantly higher than the gut microbiota of larvae that fed on the other three diets, suggesting that eating corn may impose stress on the larvae. The dispersed pattern of gut microbiota is consistent with the worst performance (small larval size and low feeding rate) of C. suppressalis when reared on corn.
Our results showed the enrichment of some species in each diet. For example, Enterococcus was the most abundant bacterial genus in the artificial diet. This genus is a well-known gut commensal bacterium that is widely distributed in lepidoptera larvae [49]. However, it could transition from a commensal to a pathogenic lifestyle when its host insect is under stressors, e.g., BT toxin [50]. Here, we did not detect a detrimental effect of the increased bacterial abundance, which is mainly attributed to an ideal environment of the larvae in the artificial diet, with sufficient nutrients and fewer entomopathogens. However, whether the bacteria possess biological functions (e.g., facilitate nutrient utilization) in the gut remains an open question. A significantly higher abundance of the genus Gluconobacter was found in corn-fed larvae compared to larvae in the other three treatment groups. He et al. found that Gluconobacter cerinus accelerates fruit fly (Bacterocera dorsalis) development and hatching rates [51]. Whether the abundant bacteria play a positive or negative role in the development of the corn-fed larvae requires further analysis. Furthermore, PICRUSt was used to predict the functions of bacteria in different diet regimes [52]. The gut microbiota of oat-fed larvae showed the most active participation in metabolic processes, including the metabolic pathways, the biosynthesis of secondary metabolites and amino acids, and carbon metabolism, whereas artificial diet samples presented the lowest active involvement in biological processes. Interestingly, function of the metabolism (in pathway level two) was also enriched for the gut microbiota of corn-fed larvae. Whether metabolism function facilitates development of the host insect or the bacteria themselves is unclear. Although PICRUSt is capable of predicting metabolic potential from the OTUs, the resolution remains low. Thus, there could be some bias in our results, which need further bioinformatics or experimental evidence in order to verify.
Collectively, the present results showed that C. suppressalis larvae perform better on rice and oat diets than on corn diets, having demonstrated varied feeding rates on the different diets. In parallel, we found that the gut microbiota of the larvae was significantly influenced by the different types of diet. The gut samples of LACO showed the most dispersed pattern, suggesting that food poses a stressor to the pest. Thus, a rice–corn or oat–corn rotation pattern may help to suppress the pest population, which deserves further exploration. At the genus level, different bacteria were enriched for each type of diet; Enterococcus was the most abundant genus in LAAD, Gluconobacter in LACO, Sphingobacterium in LAOAT, and Lactococcus in LARE. Further PICRUSt predictions suggested that the gut microbiota is involved in diverse metabolism functions, but their exact role requires further investigation.
Supplementary Materials
The following supporting information can be downloaded at: https://www.mdpi.com/article/10.3390/agronomy13020304/s1, Figure S1: Rarefaction curves.
Author Contributions
Conceptualization, P.Z., B.M., W.M. and L.X.; methodology and validation, P.Z., B.M., M.M. and J.C.; software, P.Z., B.M. and J.C.; formal analysis, P.Z. and B.M.; data curation, P.Z., B.M., W.M. and L.X.; writing—original draft preparation, P.Z., B.M. and L.X.; writing—review and editing, W.M. and L.X.; visualization, P.Z.; supervision, W.M. and L.X.; project administration, W.M. and L.X.; funding acquisition, L.X. All authors have read and agreed to the published version of the manuscript.
Funding
This research was supported by the National Natural Science Foundation of China (31971663) and the Young Elite Scientists Sponsorship Program by CAST (2020QNRC001).
Data Availability Statement
The datasets generated and analyzed during the current study are available from the corresponding author on reasonable request.
Acknowledgments
Thank you to Mostafa Abouzeid for their support throughout the rearing steps and thank you to Sun Yajie and Jin HuiHui for providing the diet materials and the larvae.
Conflicts of Interest
The authors declare no conflict of interest.
References
- Birla, D.S.; Malik, K.; Sainger, M.; Chaudhary, D.; Jaiwal, R.; Jaiwal, P.K. Progress and challenges in improving the nutritional quality of rice (Oryza sativa L.). Crit. Rev. Food Sci. Nutr. 2017, 57, 2455–2481. [Google Scholar] [CrossRef] [PubMed]
- Zhong, H.; Li, F.; Chen, J.; Zhang, J.; Li, F. Comparative transcriptome analysis reveals host-associated differentiation in Chilo suppressalis (Lepidoptera: Crambidae). Sci. Rep. 2017, 7, 13778. [Google Scholar] [CrossRef] [PubMed]
- Jiang, M.X.; Cheng, J.A. Interactions between the striped stem borer Chilo suppressalis (Walk.) (Lep., Pyralidae) larvae and rice plants in response to nitrogen fertilization. J. Pest Sci. 2003, 76, 124–128. [Google Scholar] [CrossRef]
- Li, C.S. Status and control of Chilo spp., their distribution, host range and economic importance in Oceania. Int. J. Trop. Insect Sci. 1990, 11, 535–539. [Google Scholar] [CrossRef]
- Chen, M.; Shelton, A.; Ye, G.Y. Insect-resistant genetically modified rice in China: From research to commercialization. Annu. Rev. Entomol. 2011, 56, 81–101. [Google Scholar] [CrossRef]
- Wang, Y.; Ju, D.; Yang, X.; Ma, D.; Wang, X. Comparative Transcriptome Analysis Between Resistant and Susceptible Rice Cultivars Responding to Striped Stem Borer (SSB), Chilo suppressalis (Walker) Infestation. Front. Physiol. 2018, 9, 1717. [Google Scholar] [CrossRef]
- Ding, N.; Dalin, P.; Zhu, Q.H.; Ma, W.H.; Zhu, F.; Wang, X.P. A comparison of the larval overwintering biology of the striped stem borer, Chilo suppressalis (Lepidoptera: Crambidae), in rice and water-oat fields. Appl. Entomol. Zool. 2013, 48, 147–153. [Google Scholar] [CrossRef]
- Jiang, W.H.; Li, H.D.; Cheng, X.F.; Ye, J.R.; Feng, Y.B.; Han, Z.J. Study on host plants for reproduction of Chilo suppressalis. J. Asia-Pac. Entomol. 2015, 18, 591–595. [Google Scholar] [CrossRef]
- Zhu, L.; Feng, S.; Gao, Q.; Liu, W.; Ma, W.H.; Wang, X.P. Host population related variations in circadian clock gene sequences and expression patterns in Chilo suppressalis. Chronobiol. Int. 2019, 36, 969–978. [Google Scholar] [CrossRef]
- Ishiguro, N.; Yoshida, K.; Tsuchida, K. Genetic differences between rice and water-oat feeders in the rice stem borer, Chilo suppressalis (Walker) (Lepidoptera: Crambidae). Appl. Entomol. Zool. 2006, 41, 585–593. [Google Scholar] [CrossRef]
- Matsukura, K.; Hoshizaki, S.; Ishikawa, Y.; Tatsuki, S. Morphometric differences between rice and water-oats population of the striped stem borer moth, Chilo suppressalis (Lepidoptera: Crambidae). Appl. Entomol. Zool. 2006, 41, 529–535. [Google Scholar] [CrossRef]
- Matsukura, K.; Hoshizaki, S.; Ishikawa, Y.; Tatsuki, S. Differences in timing of the emergence of the overwintering generation between rice and water-oats populations of the striped stem borer moth, Chilo suppressalis (Lepidoptera: Crambidae). Appl. Entomol. Zool. 2009, 44, 485–489. [Google Scholar] [CrossRef]
- Samudra, I.M.; Emura, K.; Hoshizaki, S.; Ishikawa, Y.; Tatsuki, S. Temporal differences in mating behavior between rice- and water-oats-populations of the striped stem borer, Chilo suppressalis (Walker)(Lepidoptera: Crambidae). Appl. Entomol. Zool. 2002, 37, 257–262. [Google Scholar] [CrossRef]
- Johnson, J.S.; Spakowicz, D.J.; Hong, B.Y.; Petersen, L.M.; Demkowicz, P.; Chen, L.; Leopold, S.R.; Hanson, B.M.; Agresta, H.O.; Gerstein, M.; et al. Evaluation of 16S rRNA gene sequencing for species and strain-level microbiome analysis. Nat. Commun. 2019, 10, 5029. [Google Scholar] [CrossRef] [PubMed]
- Jones, A.G.; Mason, C.J.; Felton, G.W.; Hoover, K. Host plant and population source drive diversity of microbial gut communities in two polyphagous insects. Sci. Rep. 2019, 9, 2792. [Google Scholar] [CrossRef] [PubMed]
- Neis, E.P.; Dejong, C.H.; Rensen, S.S. The role of microbial amino acid metabolism in host metabolism. Nutrients 2015, 7, 2930–2946. [Google Scholar] [CrossRef]
- Mason, C.J.; Hoover, K.; Felton, G.W. Effects of maize (Zea mays) genotypes and microbial sources in shaping fall armyworm (Spodoptera frugiperda) gut bacterial communities. Sci. Rep. 2021, 11, 4429. [Google Scholar] [CrossRef]
- Martin, A.M.; Sun, E.W.; Rogers, G.B.; Keating, D.J. The Influence of the Gut Microbiome on Host Metabolism Through the Regulation of Gut Hormone Release. Front. Physiol. 2019, 10, 428. [Google Scholar] [CrossRef]
- Xiong, W. Intestinal microbiota in various animals. Integr. Zool. 2022, 17, 331–332. [Google Scholar] [CrossRef]
- Hamdi, C.; Balloi, A.; Essanaa, J.; Crotti, E.; Gonella, E.; Raddadi, N.; Ricci, I.; Boudabous, A.; Borin, S.; Manino, A.; et al. Gut microbiome dysbiosis and honeybee health. J. Appl. Entomol. 2011, 135, 524–533. [Google Scholar] [CrossRef]
- Luo, J.; Cheng, Y.; Guo, L.; Wang, A.; Lu, M.; Xu, L. Variation of gut microbiota caused by an imbalance diet is detrimental to bugs’ survival. Sci. Total. Environ. 2021, 771, 144880. [Google Scholar] [CrossRef] [PubMed]
- Xia, X.; Gurr, G.M.; Vasseur, L.; Zheng, D.; Zhong, H.; Qin, B.; Lin, J.; Wang, Y.; Song, F.; Li, Y.; et al. Metagenomic Sequencing of Diamondback Moth Gut Microbiome Unveils Key Holobiont Adaptations for Herbivory. Front. Microbiol. 2017, 8, 663. [Google Scholar] [CrossRef] [PubMed]
- Sleator, R.D.; Shortall, C.; Hill, C. Metagenomics. Lett. Appl. Microbiol. 2008, 47, 361–366. [Google Scholar] [CrossRef] [PubMed]
- Escobar-Zepeda, A.; Vera-Ponce de León, A.; Sanchez-Flores, A. The Road to Metagenomics: From Microbiology to DNA Sequencing Technologies and Bioinformatics. Front. Genet. 2015, 6, 348. [Google Scholar] [CrossRef] [PubMed]
- Krishnan, M.; Bharathiraja, C.; Pandiarajan, J.; Prasanna, V.A.; Rajendhran, J.; Gunasekaran, P. Insect gut microbiome—An unexploited reserve for biotechnological application. Asian Pac. J. Trop. Biomed. 2014, 4, S16–S21. [Google Scholar] [CrossRef] [PubMed]
- Rajagopal, R. Beneficial interactions between insects and gut bacteria. Indian J. Microbiol. 2009, 49, 114–119. [Google Scholar] [CrossRef]
- Yun, J.H.; Roh, S.W.; Whon, T.W.; Jung, M.J.; Kim, M.S.; Park, D.S.; Yoon, C.; Nam, Y.D.; Kim, Y.J.; Choi, J.H.; et al. Insect gut bacterial diversity determined by environmental habitat, diet, developmental stage, and phylogeny of host. Appl. Environ. Microb. 2014, 80, 5254–5264. [Google Scholar] [CrossRef]
- Han, L.; Li, S.; Liu, P.; Peng, Y.; Hou, M. New artificial diet for continuous rearing of Chilo suppressalis (Lepidoptera: Crambidae). Ann. Entomol. Soc. Am. 2012, 105, 253–258. [Google Scholar] [CrossRef]
- Edgar, R.C. UPARSE: Highly accurate OTU sequences from microbial amplicon reads. Nat. Methods 2013, 10, 996–998. [Google Scholar] [CrossRef]
- Beccati, A.; Gerken, J.; Quast, C.; Yilmaz, P.; Glöckner, F.O. SILVA tree viewer: Interactive web browsing of the SILVA phylogenetic guide trees. BMC Bioinform. 2017, 18, 433. [Google Scholar] [CrossRef]
- Glöckner, F.O.; Yilmaz, P.; Quast, C.; Gerken, J.; Beccati, A.; Ciuprina, A.; Bruns, G.; Yarza, P.; Peplies, J.; Westram, R.; et al. 25 years of serving the community with ribosomal RNA gene reference databases and tools. J. Biotechnol. 2017, 261, 169–176. [Google Scholar] [CrossRef] [PubMed]
- Klindworth, A.; Pruesse, E.; Schweer, T.; Peplies, J.; Quast, C.; Horn, M.; Glöckner, F.O. Evaluation of general 16S ribosomal RNA gene PCR primers for classical and next-generation sequencing-based diversity studies. Nucleic Acids. Res. 2013, 41, e1. [Google Scholar] [CrossRef] [PubMed]
- Pruesse, E.; Peplies, J.; Glöckner, F.O. SINA: Accurate high-throughput multiple sequence alignment of ribosomal RNA genes. Bioinformatics 2012, 28, 1823–1829. [Google Scholar] [CrossRef]
- Pruesse, E.; Quast, C.; Knittel, K.; Fuchs, B.M.; Ludwig, W.; Peplies, J.; Glöckner, F.O. SILVA: A comprehensive online resource for quality checked and aligned ribosomal RNA sequence data compatible with ARB. Nucleic Acids. Res. 2007, 35, 7188–7196. [Google Scholar] [CrossRef]
- Quast, C.; Pruesse, E.; Yilmaz, P.; Gerken, J.; Schweer, T.; Yarza, P.; Peplies, J.; Glöckner, F.O. The SILVA ribosomal RNA gene database project: Improved data processing and web-based tools. Nucleic Acids. Res. 2013, 41, D590–D596. [Google Scholar] [CrossRef]
- Coelho, L.P.; Kultima, J.R.; Costea, P.I.; Fournier, C.; Pan, Y.; Czarnecki-Maulden, G.; Hayward, M.R.; Forslund, S.K.; Schmidt, T.S.B.; Descombes, P.; et al. Similarity of the dog and human gut microbiomes in gene content and response to diet. Microbiome 2018, 6, 72. [Google Scholar] [CrossRef]
- Engel, P.; Moran, N.A. The gut microbiota of insects—Diversity in structure and function. FEMS Microbiol. Rev. 2013, 37, 699–735. [Google Scholar] [CrossRef] [PubMed]
- Senderovich, Y.; Halpern, M. The protective role of endogenous bacterial communities in chironomid egg masses and larvae. ISME J. 2013, 7, 2147–2158. [Google Scholar] [CrossRef]
- Ma, M.; Tu, C.; Luo, J.; Lu, M.; Zhang, S.; Xu, L. Metabolic and immunological effects of gut microbiota in leaf beetles at the local and systemic levels. Integr. Zool. 2021, 16(3), 313–323. [Google Scholar] [CrossRef]
- Santos-Garcia, D.; Mestre-Rincon, N.; Zchori-Fein, E.; Morin, S. Inside out: Microbiota dynamics during host-plant adaptation of whiteflies. ISME J. 2020, 14, 847–856. [Google Scholar] [CrossRef]
- Mao, K.; Li, W.; Liao, X.; Liu, C.; Qin, Y.; Ren, Z.; Qin, X.; Wan, H.; Sheng, F.; Li, J. Dynamics of Insecticide Resistance in Different Geographical Populations of Chilo suppressalis (Lepidoptera: Crambidae) in China 2016-2018. J. Econ. Entomol. 2019, 112, 1866–1874. [Google Scholar] [CrossRef] [PubMed]
- Zeng, J.Y.; Vuong, T.M.; Shi, J.H.; Shi, Z.B.; Guo, J.X.; Zhang, G.C.; Bi, B. Avermectin stress varied structure and function of gut microbial community in Lymantria dispar asiatica (Lepidoptera: Lymantriidae) larvae. Pestic. Biochem. Phys. 2020, 164, 196–202. [Google Scholar] [CrossRef]
- Girard, M.; Luis, P.; Valiente Moro, C.; Minard, G. Crosstalk between the microbiota and insect postembryonic development. Trends Microbiol. 2022, in press. [CrossRef]
- Fan, C.; Zhang, L.; Jia, S.; Tang, X.; Fu, H.; Li, W.; Liu, C.; Zhang, H.; Cheng, Q.; Zhang, Y. Seasonal variations in the composition and functional profiles of gut microbiota reflect dietary changes in plateau pikas. Integr. Zool. 2022, 17, 379–395. [Google Scholar] [CrossRef] [PubMed]
- Henry, Y.; Overgaard, J.; Colinet, H. Dietary nutrient balance shapes phenotypic traits of Drosophila melanogaster in interaction with gut microbiota. Comp. Biochem. Physiol. Part A Mol. Integr. Physiol. 2020, 241, 110626. [Google Scholar] [CrossRef] [PubMed]
- Zhang, W.; Liu, F.; Zhu, Y.; Han, R.; Xu, L.; Liu, J. Differing Dietary Nutrients and Diet-Associated Bacteria Has Limited Impact on Spider Gut Microbiota Composition. Microorganisms 2021, 9, 2358. [Google Scholar] [CrossRef]
- Hammer, T.J.; Janzen, D.H.; Hallwachs, W.; Jaffe, S.P.; Fierer, N. Caterpillars lack a resident gut microbiome. Proc. Natl. Acad. Sci. USA 2017, 114, 9641–9646. [Google Scholar] [CrossRef] [PubMed]
- Marasco, R.; Fusi, M.; Callegari, M.; Jucker, C.; Mapelli, F.; Borin, S.; Savoldelli, S.; Daffonchio, D.; Crotti, E. Destabilization of the Bacterial Interactome Identifies Nutrient Restriction-Induced Dysbiosis in Insect Guts. Microbiol. Spectr. 2022, 10, e0158021. [Google Scholar] [CrossRef]
- Chen, G.; Li, Q.; Yang, X.; Li, Y.; Liu, W.; Chen, F.; Han, L. Comparison of the co-occurrence patterns of the gut microbial community between Bt-susceptible and Bt-resistant strains of the rice stem borer, Chilo suppressalis. J. Pest. Sci. 2022, 96, 299–315. [Google Scholar] [CrossRef]
- Mason, K.L.; Stepien, T.A.; Blum, J.E.; Holt, J.F.; Labbe, N.H.; Rush, J.S.; Raffa, K.F.; Handelsman, J. From commensal to pathogen: Translocation of Enterococcus faecalis from the midgut to the hemocoel of Manduca sexta. mBio 2011, 2, e00065-11. [Google Scholar] [CrossRef]
- He, M.; Jiang, J.; Cheng, D. The plant pathogen Gluconobacter cerinus strain CDF1 is beneficial to the fruit fly Bactrocera dorsalis. AMB Express 2017, 7, 207. [Google Scholar] [CrossRef] [PubMed]
- Zhu, W.; Shi, X.; Qi, Y.; Wang, X.; Chang, L.; Zhao, C.; Zhu, L.; Jiang, J. Commensal microbiota and host metabolic divergence are associated with the adaptation of Diploderma vela to spatially heterogeneous environments. Integr. Zool. 2022, 17, 346–365. [Google Scholar] [CrossRef] [PubMed]


Disclaimer/Publisher’s Note: The statements, opinions and data contained in all publications are solely those of the individual author(s) and contributor(s) and not of MDPI and/or the editor(s). MDPI and/or the editor(s) disclaim responsibility for any injury to people or property resulting from any ideas, methods, instructions or products referred to in the content. |
© 2023 by the authors. Licensee MDPI, Basel, Switzerland. This article is an open access article distributed under the terms and conditions of the Creative Commons Attribution (CC BY) license (https://creativecommons.org/licenses/by/4.0/).