Abstract
Northern Slopes of Tianshan Mountain (NSTM) in Xinjiang hold significance as a principal agricultural hub within the region’s arid zone. Accurate crop mapping across vast agricultural expanses is fundamental for intelligent crop monitoring and devising sustainable agricultural strategies. Previous studies on multi-temporal crop classification have predominantly focused on single-point pixel temporal features, often neglecting spatial data. In large-scale crop classification tasks, by using spatial information around the pixel, the contextual relationships of the crop can be obtained to reduce possible noise interference. This research introduces a multi-scale, multi-temporal classification framework centered on ConvGRU (convolutional gated recurrent unit). By leveraging the attention mechanism of the Strip Pooling Module (SPM), a multi-scale spatial feature extraction module has been designed. This module accentuates vital spatial and spectral features, enhancing the clarity of crop edges and reducing misclassifications. The temporal information fusion module integration features from various periods to bolster classification precision. Using Sentinel-2 imagery spanning May to October 2022, datasets for cotton, corn, and winter wheat of the NSTM were generated for the framework’s training and validation. The results demonstrate an impressive 93.03% accuracy for 10 m resolution crop mapping using 15-day interval, 12-band Sentinel-2 data for the three crops. This method outperforms other mainstream methods like Random Forest (RF), Long Short-Term Memory (LSTM), Transformer, and Temporal Convolutional Neural Network (TempCNN), showcasing a kappa coefficient of 0.9062, 7.52% and 2.42% improvement in Overall Accuracy compared to RF and LSTM, respectively, which demonstrate the potential of our model for large-scale crop classification tasks to enable high-resolution crop mapping on the NSTM.
1. Introduction
The 2023 United Nations report on the State of Food Security and Nutrition reveals a sobering global situation: 2.4 billion individuals are food insecure, with acute shortages in numerous regions, spotlighting significant ongoing challenges in global food security [1]. Precise and systematic crop mapping has emerged as a crucial instrument for expansive crop monitoring. This approach not only delivers foundational data for crop acreage assessments, planting structure analyses, and yield estimations [2], but it also provides the groundwork for evaluating regional crop production and underpinning national food security [3,4]. As remote sensing technology advances, there is an enhanced potential for meticulous and trustworthy quantifications of soil attributes and canopy states at a regional level [5]. Presently, the application of remote sensing spans diverse agricultural areas, ranging from crop identification [6,7,8] and pest/disease surveillance [9,10,11] to grain yield predictions [12,13] and land use patterns [14]. The burgeoning availability of extensive, multi-sourced remote sensing satellite imagery, characterized by its broad scope, detailed spectral content, multi-temporal stages, and superior resolution, is increasingly facilitating precision in large-scale agricultural mapping [15,16,17].
Traditional crop classification methodologies predominantly employ vegetation indices to discern variations among crops throughout their growth cycle for effective categorization. Jakubauskas et al. [18] utilized NOAA-AVHRR data for harmonic analyses of NDVI time series, incorporating additive terms, phase, and amplitude as core classification criteria, yielding crop mapping results for Finney County in southwestern Kansas. Similarly, Wardlow et al. [19] analyzed time-series MODIS 250 m Enhanced Vegetation Index (EVI) and Normalized Difference Vegetation Index (NDVI) datasets through graphical and statistical approaches. Their findings indicated that these datasets possessed ample features to identify primary crops in the U.S. Central Great Plains.
The incorporation of artificial intelligence, epitomized by machine learning, into image classification, has ushered in an era where algorithms like Random Forest (RF) [20], Support Vector Machine (SVM) [21], and Extreme Gradient Boosting (XGBoost) [22] are frequently employed for crop classification. You et al. [23] devised a refined feature selection mechanism, opting for features conducive to classification, and employed the RF approach to generate 10 m resolution maps, classifying primary crops like maize, soybean, and rice in Northeast China from 2017 to 2019. Their results showcased an overall accuracy ranging from 0.81 to 0.86. Luo et al. [24] utilized both RF and unsupervised techniques to identify pivotal features, including those within NDVI time series, texture, and phenology. Their classification, executed using RF and SVM, achieved an impressive overall accuracy of 93%. Notably, machine learning models are favored in crop classification due to their interpretability, enabling a clearer differentiation of crop features and thus aiding in decision making. However, one limitation of machine learning is its reliance on prior knowledge and manual feature extraction. The mentioned studies necessitate evaluating and prioritizing numerous features before model training, which may compromise the model’s optimal fit for diverse crop classification tasks.
In the age of remote sensing big data, deep learning technology has garnered attention due to its capacity to autonomously discern intricate features within vast datasets and uncover inherent relationships among them. This technology, particularly through deep and intricate model structures, has made notable strides in object detection [25], change detection [26], and semantic segmentation [27] when using remotely sensed images. For crop classification tasks, Convolutional Neural Networks (CNNs) and Recurrent Neural Networks (RNNs) are predominantly employed. Specifically, 1D-CNN is often utilized to comprehend the temporal relationships of crop pixels. For instance, Zhao et al. [28] developed a 1D-CNN-based classification model, achieving over 85% accuracy in classifying summer maize and cotton in Hengshui City, Hebei Province, even when certain optical data were absent.
2D-CNN is suitable for crop classification from remote sensing images at a single point in time and cannot directly capture the temporal information of crops. 3D-CNN can use convolution to incorporate the information of the phenological period of different crops into the feature representation while capturing the spatial features of the crops, but 3D-CNN requires more data and computational resources. Semantic segmentation models, such as U-Net and Deeplab-V3+ within the 2D-CNN realm, have been instrumental in deriving spatial attributes from single-phase crop images. Illustratively, Li et al. [29] pinpointed crucial classification periods for specific crops by assessing Global Separability Index (GSI) and applied U-Net, U-Net++, and Deeplab-V3+ techniques for classification, with U-Net achieving an optimal accuracy of 96.28%. Additionally, Seydi et al. [30] combined NDVI images from various periods, devising a deep feature extraction framework anchored in 2D-CNN and the attention mechanism. This approach emphasized salient features of both spatial and spectral characteristics while minimizing redundancy. However, its fixed input size of 11 × 11 pixel patches constrained the model’s capability to extract detailed information from crops across varying plot dimensions.
3D-CNN primarily facilitates the concurrent extraction of temporal and spatial features from crop imagery. As an illustration, Gallo et al. [31] employed a fully convolutional 3D-CNN approach for the semantic segmentation of multi-phase Sentinel-2 images from the Lombardy region, effectively classifying crops like maize, rice, and grains. However, generating sample labels for the spatial dimensions required by most 2D-CNN and 3D-CNN-based crop classification methods is highly challenging, and fieldwork in large-scale regional mapping tasks is costly. While certain studies have leveraged sample migration for training, inherent variations in phenology and spectral attributes across diverse regions and phases can compromise classification precision. This hinders the model’s peak performance utilization, limiting its broader applicability.
RNNs, specifically tailored for sequence data, have evolved with the introduction of structures like Long Short-Term Memory (LSTM) [32] and Gated Recurrent Unit (GRU) [33]. These structures effectively address issues like gradient vanishing and exploding and can manage arbitrarily long time series. Multi-temporal crop classification methods (MTCCN) leveraging RNNs adeptly preserve temporal crop information during their growth phase for classification, making them a preferred approach in the domain. For instance, Lin et al. [34] employed a multi-task learning LSTM framework, achieving an impressive 98.3% accuracy in classifying major rice-producing regions in the U.S. using Sentinel-1 SAR images. Similarly, Khan et al. [35] utilized LSTM and Sentinel-2 imagery to classify wheat, rice, and sugarcane, obtaining up to 93.77% accuracy. Unlike single-temporal methods, MTCCN captures crop phenological nuances through time-series data, thereby discerning intricate temporal feature relationships. This approach significantly mitigates misclassifications arising from spectrally similar crops in regions with intricate agricultural structures. Its resilience and robustness have led to its application in early crop identification [36] and crop rotation prediction [37]. However, the primary limitation is MTCCN’s over-reliance on time-series data, often sidelining the spatial nuances of crop distribution. This oversight can jeopardize the model’s ability to accurately classify crop border regions.
In reviewing large-scale crop extraction methodologies, the following challenges are evident as follows:
- (1)
- Machine learning methods necessitate substantial effort in feature selection and design.
- (2)
- Semantic segmentation-based crop classification tasks have difficulty in obtaining sample labels, which does not satisfy the sample requirements of crop classification tasks over a wide area.
- (3)
- The majority of research predominantly focuses on the spectral-temporal data from individual crop pixels, often sidelining crucial spatial context.
- (4)
- Relying on fixed-size spatial data can compromise a model’s capacity to discern feature details.
The Northern Slopes of Tianshan Mountain (NSTM) in Xinjiang stands as a pivotal hub in the Belt and Road Initiative, bridging Asia and Europe. As a typical oasis agricultural area, it has high-quality production bases of cotton, corn, and winter wheat, with a large arable land area and parcel area and less cloud. Therefore, realizing high-resolution crop mapping in this region is beneficial for acreage detection and ensuring food security in China. In addressing the challenges noted, the following advancements were made as follows:
- (1)
- Introduction of a ConvGRU-based multi-scale and multi-temporal classification framework, incorporating a module for multi-scale spatial feature extraction to integrate spatial context.
- (2)
- Utilization of the SPM module to prioritize pivotal spectral features and spatial context, enhancing classification precision.
- (3)
- In order to accurately map data sets characterized by varied features and time intervals are constructed. Subsequently, suitable data sets are identified, compared, and evaluated with commonly used methods.
- (4)
- The optimal model and dataset were used to map the large-scale crop distribution of cotton, corn, and winter wheat on the NSTM.
2. Materials and Methods
2.1. Study Area
As shown in Figure 1, NSTM stretches between Tianshan Mountain to the south and Altai Mountains to the north, situated in Xinjiang, China. It lies between latitudes 42°54′57″–46°12′45″ N and longitudes 79°52′57″–91°35′7″ E. The region encompasses the Bortala Mongol Autonomous Prefecture, Wusu, Karamay, Kuitun, Shawan, Shihezi, Changji Hui Autonomous Prefecture, Wujiaqu, and Urumqi. The area experiences a temperate continental arid to semi-arid climate. Summers are warm, while winters are cold, with an average yearly temperature ranging from −4 °C to 9 °C. The area benefits from a frost-free period spanning 140 days to 185 days annually and receives precipitation ranging from 150 mm to 200 mm. The predominant land cover types include cropland, grassland, and bareland, with croplands representing 30% of Xinjiang’s total agricultural land, distributed in bands and patches.
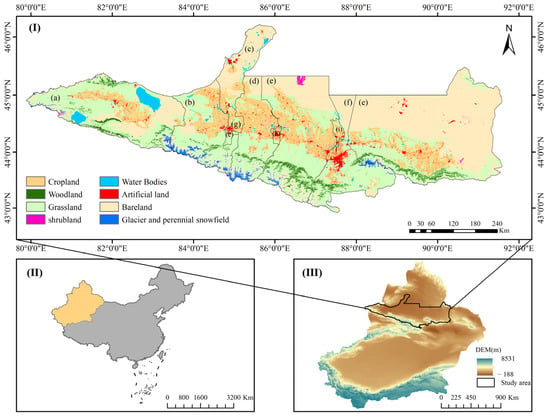
Figure 1.
Spatial distribution map of the study area: (I) land use distribution map (GlobeLand30, 2020) of the study area: (a) Bortala Mongol Autonomous Prefecture; (b) Wusu City; (c) Keramay City; (d) Shawan City; (e) Changji Hui Autonomous Prefecture; (f) Urumqi City; (g) Kuitun City; (h) Shihezi City; (i) Wujiaqu City; (II) Xinjiang Uighur Autonomous Region (XUAR), China; (III) spatial location and topography of study area within XUAR.
In the study area, cotton, corn, and winter wheat are the predominant crops, constituting 73.57% of the cultivated land. As illustrated in Figure 2, cotton and corn are primarily sown in mid-to-late April, whereas winter wheat planting takes place in October of the preceding year. Cotton reaches its peak growth during the boll formation stage in late July, with harvesting commencing in early October.

Figure 2.
Crop calendars for the five main crops in the study area. Note: E = Early month; M = Mid month; L = Late month.
Corn’s peak growth, corresponding to the tasseling phase, occurs from mid to late July, leading to harvest around early October. Winter wheat peaks in its growth from mid to late May and is harvested by early July. Additionally, the region sees the cultivation of cash crops such as chilli, sunflower, and tomato. These occupy a smaller proportion of the land and generally share a similar growth pattern.
2.2. Datasets
2.2.1. Satellite Data
The study employs the 2022 Sentinel-2A/B Multispectral Instrument (MSI) L2A image data provided by the Copernicus Data Space Ecosystem (https://dataspace.copernicus.eu/, accessed on 11 April 2023). These data offer atmospherically corrected bottom-of-the-atmosphere reflectance images. Sentinel-2 system encompasses A and B satellites that operate concurrently, boasting a revisit cycle of five days and is equipped with a Multispectral Instrument. The analysis utilizes its 12 observable bands, as detailed in Table 1. These bands span the visible, near-infrared, and shortwave-infrared spectrums with a resolution ranging from 10 m to 60 m. Notably, the vegetation red edge bands within these have demonstrated significant potential for crop identification [38].

Table 1.
Bands information of Sentinel-2 L2A Images.
2.2.2. Sample Data
In this study, sample points for cotton, corn, and winter wheat from the 2022 study area were obtained through comprehensive field surveys. To ensure sample accuracy, central points of uniform crops within plots exceeding 50 m × 50 m were identified using a GPS-equipped handheld device. Given that the sample size can impact a deep learning model’s accuracy, samples for the three crops were augmented through manual visual interpretation to ensure a balanced spatial distribution. As depicted in Figure 3, a false-color composite of Sentinel-2 L2A image bands B8, B6, and B4 was chosen, providing clear differentiation for the crop types and assist us in framing the pixels. We obtained internal pixel samples by externally expanding rectangles based on the location of field centroids from the field survey. To ensure the reliability of the samples, the centroids were all located in plots of the same crop, and the outward expanding rectangles did not exceed the boundaries of the plots. To further reduce the noise interference from other pixels, we exploited the characteristics of the crop’s phenological period to perform the above operations on multi-temporal data.
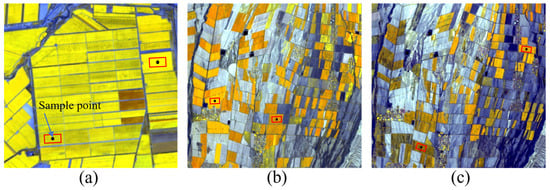
Figure 3.
Representative crop expansion samples: (a) Cotton growing area in July image; (b) corn growing area in August image; (c) Winter wheat growing area in May image, black dots represent sample points sampled in the field, and the red squares represent sample frames expanded outward based on the sample points.
The chlorophyll content and biomass of a crop change gradually during growth, and these changes can be reflected by spectral features in the image [39]. For cotton sample expansion, images from late July were selected as cotton distinctly exhibited a bright yellow hue during this period. Figure 3b,c present false-color composites from early August and early May, respectively, depicting areas with mixed corn and winter wheat cultivation. Visually, these crops appear closely related, manifesting an orange-yellow shade. In early May, while most crops were at the sowing stage, some winter wheat approached maturity, presenting a muted yellow color. By August, summer wheat harvest was complete, and corn was in its growth zenith. Notably, the winter wheat sample location from Figure 3b appears as bare ground in Figure 3c due to the change in cultivation stages.
Figure 4 illustrates the spatial distribution of sample frames. There are 1469, 1458, and 1271 sample frames for cotton, corn, and winter wheat, respectively. Meanwhile, other categories, such as bare land, water bodies, woodland, and man-made surfaces, were designated as negative samples using Google Earth’s high-resolution imagery, summing up to 1574 sample frames. Subsequently, pixels within these frames were randomly apportioned into training, validation, and test sets at a ratio of 8:1:1. The detailed distribution can be observed in Figure 5.
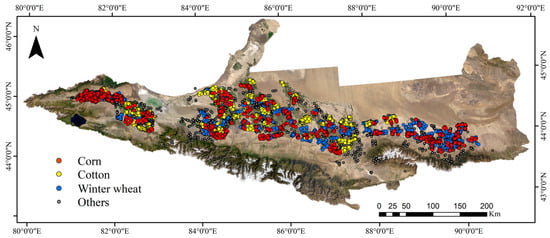
Figure 4.
Distribution of sampling frame locations within the study area.
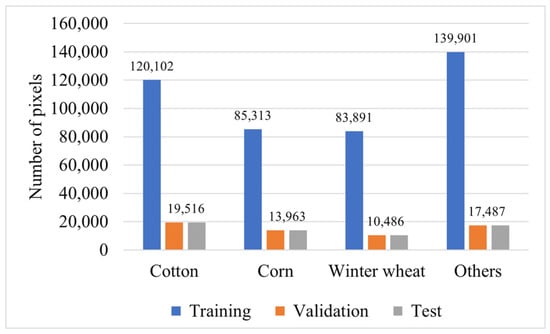
Figure 5.
Pixel points distribution for training, validation, and testing.
2.3. Methods
The study followed these steps: (1) data processing, including image de-clouding, median compositing, and pan-sharpening; (2) dataset preparation, encompassing sample expansion and NDVI calculation; (3) model construction, training, and param optimization; and (4) evaluation of results and method accuracy.
2.3.1. Data Processing
Google Earth Engine (GEE) facilitated the acquisition of 12-band median composite images from Sentinel-2 L2A, spanning May to October, at designated intervals. Utilizing the QA60 band—a quality assessment tool for Sentinel-2 L2A products—interference from clouds and shadows was minimized. Images exhibiting less than 50% cloud cover were prioritized. The linear interpolation approach addressed data gaps from cloud masking. Pixel median compositing used two temporal intervals: 15 days and 30 days. Post-compositing yielded 384 images and 192 images for each interval, all of which were pan-sharpened to a 10 m resolution.
2.3.2. Feature Preparation
NDVI, derived from the difference between near-infrared and red spectral bands, acts as an indicator of crop growth conditions and is apt for monitoring crop dynamics [40]. From field investigations, 2000 pixels were randomly selected for each crop type. Mean values of spectral bands and NDVI were computed, facilitating the creation of respective time series curves. Figure 6a illustrates the NDVI time series from May to October for cotton, corn, and winter wheat. All display a singular peak, signifying an annual maturation cycle. Winter wheat peaks between May and June, highlighting its distinct growth vigor relative to cotton and corn. While cotton and corn share similar growth periods, corn consistently registers a higher NDVI value.
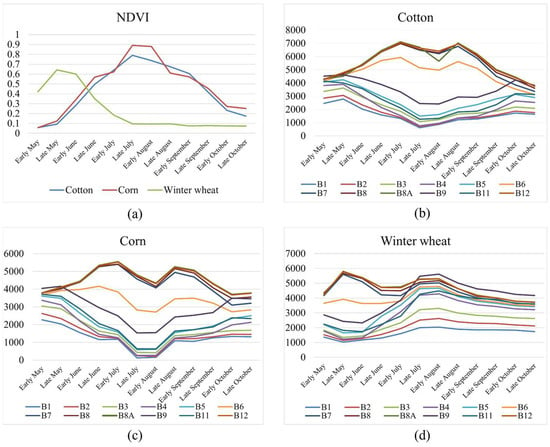
Figure 6.
Temporal dynamics of (a) NDVI for three crop types; (b) spectral band values for cotton; (c) spectral band values for corn; (d) spectral band values for winter wheat, B1–B12: the twelve spectral bands from Sentinel-2.
Figure 6b–d present the time series of the 12 spectral bands from Sentinel-2 for the three crops. Overall, cotton and corn trends, particularly in bands like B8 and B3, suggest concurrent growth phases. Yet, variations exist, with specific cotton bands ranging between 5000 and 7000 and corresponding corn bands between 4000 and 6000. Winter wheat, due to its seasonal nature, diverges in its trend. Hence, both NDVI and Sentinel-2 spectral values can effectively classify these crops.
In this study, Sentinel-2 imagery underwent processing to yield NDVI data derived from band computations. Four time series datasets, spanning May to October in the study area, were constructed based on the pixel ratios and distributions detailed in Section 2.2.2. These datasets were employed for model training, validation, and testing. Neighborhood information, focusing on pixels surrounding the target pixel, was incorporated in two sizes, 5 × 5 and 3 × 3, to match the model’s input specifications. Table 2 delineates the datasets:

Table 2.
Four time series datasets. Note: 12 Band denotes 12 band values in Sentinel-2 L2A image.
2.3.3. Model Construction
A unique network architecture tailored for crop classification was devised in this study. It primarily features a multi-scale spatial extraction module at its upper level and a temporal fusion module rooted in multi-layer ConvGRU at the lower level. The network harnesses features from neighborhood information across varying periods and scales. The introduction of the Strip Pooling Module (SPM) accentuates the network’s focus on critical spatial and spectral characteristics. For a holistic grasp of the data’s contextual correlations, both positive and negative bi-directional time-series features were formulated. The multi-layer ConvGRU network discerns intrinsic feature associations and facilitates feature integration across distinct temporal spans, enhancing the temporal depth of single-point pixel crop features. The multi-scale spatial feature extraction module mainly consists of three feature extraction branches for neighborhood information and the SPM module. This design arises from an observation: many studies using multi-temporal data for crop classification omit spatial information during the extraction phase, relying solely on time series pixel data for model classification. This might neglect inter-pixel feature relationships, such as field textures. Referring to Figure 7, time series datasets were derived from multi-temporal data, centering on the target pixel for model input. These datasets had feature dimensions of 5 × 5 × 12 × T, 3 × 3 × 12 × T, and 1 × 1 × 12 × T, with neighborhood sizes being 5 × 5, 3 × 3, and 1 × 1, respectively. Here, 12 signifies the band count per image (with 12 bands as an illustration), while T indicates the number of time intervals. Through the three convolutional branches, deeper feature information for each time frame was extracted. Each branch escalated the feature channel from 12 to 32 per interval, successively downsizing the 5 × 5 and 3 × 3 neighborhood features via convolution to achieve a universal 1 × 1 feature representation. This yielded three time series feature sets with 1 × 1 × 32 × T dimensions.
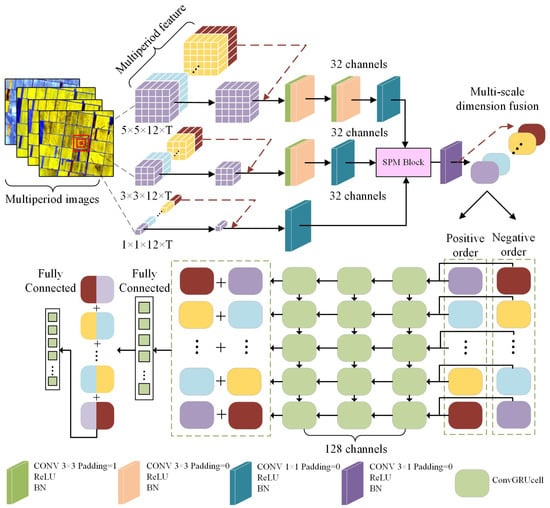
Figure 7.
Proposed ConvGRU-based multi-scale and multi-temporal crop classification framework.
The multi-scale spatial feature extraction module mainly consists of three feature extraction branches for neighborhood information and the SPM module. This design arises from an observation: many studies using multi-temporal data for crop classification omit spatial information during the extraction phase, relying solely on time series pixel data for model classification. This might neglect inter-pixel feature relationships, such as field textures. Referring to Figure 7, time series datasets were derived from multi-temporal data, centering on the target pixel for model input. These datasets had feature dimensions of 5 × 5 × 12 × T, 3 × 3 × 12 × T, and 1 × 1 × 12 × T, with neighborhood sizes being 5 × 5, 3 × 3, and 1 × 1, respectively. 12 signifies the band count per image (with 12 bands as an illustration), while T indicates the number of time intervals. Through the three convolutional branches, deeper feature information for each time frame was extracted. Each branch escalated the feature channel from 12 to 32 per interval, successively downsizing the 5 × 5 and 3 × 3 neighborhood features via convolution to achieve a universal 1 × 1 feature representation. This yielded three time series feature sets with 1 × 1 × 32 × T dimensions.
To amplify the network’s emphasis on diverse neighborhood sizes and spectral attributes, this study was influenced by SPM [38], aimed at effectively capturing extended spatial dependencies. Referring to Figure 8, three temporal features, each with a dimension of 1 × 1 × 32 × T, were concatenated to form a feature x with a size (H × W) of 3 × (12 × T), similar to the feature dimensions of SPM applications. The concatenated features underwent horizontal and vertical strip pooling, as detailed in Equations (1) and (2):
where i and j represent the positional coordinates of the features in x; while and denote Multi-scale strip pooling with dimensions of 1 × (12 × T) and spectral strip pooling with dimensions of 3 × (1 × 1), respectively. Subsequently, 1D Conv operations are applied separately in the horizontal and vertical directions to expand them back to their original size of 3 × (12 × T). These expanded features are then fused at corresponding positions. Finally, they undergo further processing through 1D Conv and sigmoid operations, which are applied to each corresponding pixel of the original features, thereby assigning varying degrees of attention to the original features.
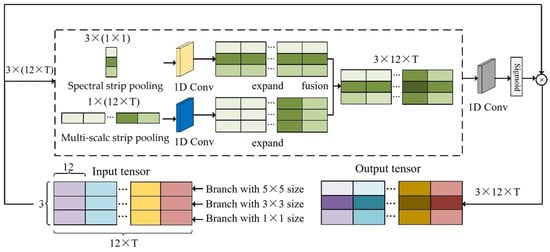
Figure 8.
Proposed strip pooling module.
Through SPM, we have established an attention mechanism for neighborhood information size and spectral features, and the network can automatically assign weights according to the contribution of neighborhood information of different sizes to centroid pixel classification in order to achieve the adaptive neighborhood information size and at the same time strengthen the degree of attention to the spectral features in multi-period imagery, which is conducive to the optimization of crop classification edges as well as the false detections problem brought about by the similarity of crop phenological periods. In the model design, we mapped the global representation of all periods to the same number of channels so that the same number of feature channels are used as inputs to the multi-layer ConvGRU network, facilitating the subsequent establishment of temporal feature linkages. After the SPM module, 1D Conv with 3 × 1 convolutional kernel size is used to reduce its feature dimension, which is equivalent to feature fusion in a multi-scale dimension.
In the temporal information fusion module, ConvGRU is used as the infrastructure for obtaining time series relationships; referring to Figure 9, the network design of ConvGRU is similar to that of ConvLSTM [41], which is an underlying model that combines CNN and GRU for better long-term dependency modelling. We take the features that have been convolved with 1D Conv and pass them through 3 layers of ConvGRU structure in positive and negative bi-directional order, respectively. The multi-layer ConvGRU structure helps to improve the model’s representation ability and complex relationship construction ability. The ConvGRUcell of each layer can capture the current time step information and pass it to the next ConvGRUcell, and each new ConvGRUcell will take into account the previously captured state information, and set the number of hidden layer channels of the output of each layer to 128, to establish the bi-directional temporal dependencies between features, and then summed and combined according to the time step to form a new feature representation. Through the combination of time-series features, past and future sequence information during crop growth is considered, which enriches the feature information of crops in the time dimension, captures the contextual information more comprehensively, and improves the accuracy of crop classification in the face of areas with complex crop distribution. Finally, after the structure of two fully connected layers, BatchNorm1d and ReLU, the feature channels are reduced to 64, the features of all periods are fused and mapped to the number of categories for crop classification, and the output is transformed into a probability score for each category using the softmax activation function.
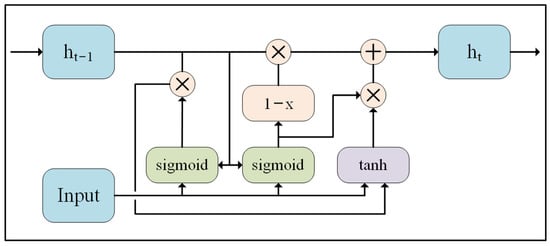
Figure 9.
Convolutional gated recurrent unit. ht is the current hidden layer state, ht−1 is the previous hidden layer state.
2.3.4. Evaluation Metrics
In this study, a confusion matrix was employed to evaluate classification accuracy. The classification efficacy of various models was gauged using four metrics: Overall Accuracy (OA), Kappa Coefficient (KC), Producer Accuracy (PA), User Accuracy (UA), and F1 score [42]. The pertinent equations are provided below:
From Equations (3)–(6), TP stands for true positives, representing the number of correctly predicted crop pixels and background pixels. FP stands for false positives, indicating the number of background pixels incorrectly predicted as crop pixels, and FN stands for false negatives, indicating the number of crop pixels incorrectly predicted as background pixels.
2.3.5. Train Details
This study employed PyTorch deep learning framework to build, design, and benchmark the proposed neural network models. Model training and subsequent predictions over an expansive study area were executed using an NVIDIA GeForce RTX 3090 GPU. The research utilized Cross-Entropy loss (CE loss) [43] as the proposed loss function and adopted the Adam optimizer [44]. The learning rate followed a cosine annealing strategy [45]. Training param included a batch size of 160, a maximum of 300 epochs, and an initial learning rate of 1 × 10⁻⁴.
3. Results
3.1. Datasets Comparison
The time interval and feature type in the data can have a significant impact on the classification results. The composite data at different time intervals differ in the level of detail in describing the crop phenological period, and for crops with similar phenological periods, the model cannot easily capture the feature differences in their temporal dimensions, and the classification judgement will be affected. Differences in the types of features can directly affect the classification accuracy of crops, and most of the studies used NDVI as the input data for the model; however, for crops with similar spectral features and phenological periods, the classification results could be misdetected. To identify the optimal dataset for the selected model, the study separately trained, validated, and tested the four datasets described in Section 2.3.2 using the consistent model param. The results from these tests were then quantitatively compared.
Table 3 illustrates that the proposed model’s best performance was 93.03% accuracy with Dataset 4, incorporating a 15-day time interval and the 12-band features. It is evident from the results that using all 12 spectral bands from Sentinel-2 data as input, as seen in Dataset 3 and Dataset 4, yields accuracies surpassing 90%. This emphasizes that the 12-band spectral features outperform the sole NDVI feature in encapsulating crops’ spectral and temporal attributes, evident in the heightened PA and UA across most categories. Comparing Dataset 2 with Dataset 4 to Dataset 1 and Dataset 3, there is an improvement of 1.08% and 1.9% in accuracy, respectively. This indicates that data synthesized with shorter time intervals offer advantages in capturing the phenological characteristics of crops. However, the impact of the time interval on classification accuracy is smaller compared to changes in feature types. This suggests that the synthesized data with a 30-day time interval already captures most of the temporal feature differences among the three crop classes. Beyond this, changes in spectral features are more beneficial for distinguishing the three crop classes.

Table 3.
Quantitative comparison of the models proposed in this paper on the four datasets constructed.
Upon evaluating individual crops, Dataset 4 (with a 30-day interval) shows a slight dip in UA for cotton. Other crops in the same set also register modest PAs, pointing to potential misclassification between cotton and other terrains. In contrast, the 15-day interval dataset exhibits better differentiation for cotton. While time intervals do not significantly influence corn’s classification, enhanced feature sets boost its accuracy above 90%. Winter wheat, possessing a distinct growth phase, does not benefit substantially from tighter time intervals, suggesting that a 30-day span already provides adequate temporal differentiation.
3.2. Methods Comparison
This study aimed to assess the efficacy of the proposed model by juxtaposing it with established methods, namely RF [20], LSTM [32], Transformer [46], and TempCNN [47]. RF stands out as a prevalent machine learning tool in crop classification, operating as an ensemble algorithm anchored on decision trees. Its Python implementation relies on the Random Forest Classifier function from the sklearn library. As shown in Table 4, we use the Grid Search method to find the optimal hyperparameters of the comparison model; an optimal classification was attained with n_estimators at 300 and max_depth at 15. LSTM, Transformer, and TempCNN, in contrast, are sequential models grounded on RNN, attention mechanisms, and 1D-CNN, respectively. The tailored multi-layer LSTM structure enhanced classification efficacy, reaching its peak when configured with three layers and a hidden layer size of 32. The Transformer method, leveraging an encoder–decoder framework grounded on self-attention, optimally hones in on intra-sequence relationships and cultivates global dependencies across sequence positions. This method peaked with three attention heads (n_head) and five TransformerEncoderLayer layers. TempCNN, comprising three 1D-CNN layers, a dense layer, and a softmax layer, is adept at discerning temporal features by convolving.

Table 4.
The optimal setting and range of hyperparameters of the comparison model.
To bolster the validity of this comparative assessment, Dataset 4 (Section 2.3.3) was employed for every model. Notably, no neighborhood data were integrated into the input of these comparator models. As shown in Table 5, the proposed model emerged as the front-runner with an OA of 0.9303, F1 scores and KC also reached a maximum of 0.9286 and 0.9062, and the highest values achieved in most classes of PA and UA. In contrast, the RF method lagged, registering an OA of 0.8448. This lag was evident in its reduced PA and UA for cotton and other backgrounds, possibly suggesting background erosion. As a result, RF’s F1 score stood at a mere 85.51%. Interestingly, both TempCNN and Transformer methods, which rely on 1D CNN and self-attention mechanisms, respectively, demonstrated an ability to extract contextual temporal sequence data. They surpassed RF by approximately 4% in OA, highlighting the potential advantages of deep learning over traditional machine learning techniques. The LSTM method, with its OA of 90.61% and an F1 score of 90.89%, appeared superior to both TempCNN and Transformer. This advantage can be attributed to the multi-layer LSTM’s capability to retain the chronological nuances of crops. Yet, when compared to LSTM, the proposed model exhibited a higher PA by 0.0385 and fewer misclassifications. This enhanced performance can be traced back to the model’s comprehensive design, which seamlessly integrates neighborhood data. Furthermore, the attention mechanism from SPM fortifies the focus on varied neighborhood data and spectral attributes.

Table 5.
Comparative analysis of the proposed and mainstream methods using various evaluation metrics.
To comprehensively assess the model’s ability to classify the three crops, prediction results from diverse crop distributions, plot sizes, and geographical areas were selected for validation. For a more lucid visual comparison, as depicted in Figure 10, the B8, B6, and B4 false-color composite images from Sentinel-2 in August were chosen. By this month, winter wheat has already been harvested, rendering it as distinct bare-ground plots in the image. Bright yellow and orange-brown regions correspond to cotton and corn, respectively. Overall, our method is effective in reducing missed or incorrect detections of the three types of crops in areas with small and fragmented plots and mixed crops and in ensuring accuracy while making the most obvious distinction between the edges of the plots among crops.
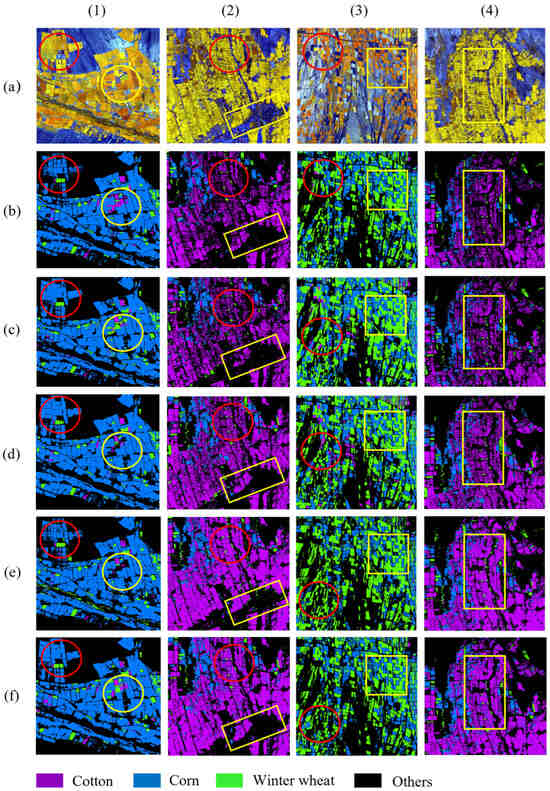
Figure 10.
Some examples of the results on the dataset. From top to bottom: (a) False color synthesis of Sentinel-2 images (B8, B6, B4); (b) RF; (c) TempCNN; (d) Transformer; (e) LSTM; (f) Proposed method, boxes and circles represent the areas in each row of the figure that are the focus of comparison.
The first and third column areas in Figure 10 are located in the alluvial plain and pre-mountain alluvial fan area, respectively, with large and regular plots. The first column of the region is a concentrated planting area of corn, with a small amount of cotton and winter wheat distribution; RF and LSTM in the red box in the large planting area of corn experienced a lot of omissions, and our model effectively avoided the omission of corn. The third column area is the mixed planting area of corn and winter wheat, and after field investigation, we know that there is no cotton planting in this area, and the sunflower and beating gourd distributed in Figure 10 are similar to the color of cotton, and LSTM, Transformer, and TempCNN have a certain number of false detections of cotton in the results of the red box, and the constructed multi-layer LSTM and our model have reduced the false detections of cotton, but the LSTM There exists significantly more pretzel noise as well as omission of corn, indicating that our model with multi-layer LSTM can better capture the feature differences between crops with similar spectral features to differentiate the crops, but LSTM is not effective in the extraction of single-class crops, which is due to the fact that the SPM module makes the spectral features favorable for crop classification strengthened by boosting its weight allocation, and also reduces the other models in the first column of the results in the yellow box that put the corn and winter wheat omission as background and confusing each other.
There are large-scale urban areas as well as more roads in the area of the second and fourth columns of Figure 10, with plots of different sizes and dense distribution, all of which are mixed planting areas of cotton and corn, with a small amount of winter wheat distribution. The results of RF in the red box of the second column and the yellow box of the fourth column area both have a large number of missed detections, and the RF in the first column also has a winter wheat false detection for cotton, RF only uses the spectral features of pixels and does not establish associations between the temporal features, so it is not easy to distinguish between the crops with similar spectral features. The prediction results of TempCNN and Transformer have a certain degree of missed detections, which suggests that the use of CNN establishes long sequence associations, and Transformer’s poor extraction of crop boundaries. LSTM has fewer omissions but many false detections, and its plot edges are not clear compared to our model results, and in combination with the results in the first column, we found that in the river area where both banks are heavily forested, LSTM misdetects trees as winter wheat, which is not found in the results of our model; however, our model results were not found. By introducing multi-scale neighborhood information and giving it different attention, our model can adaptively learn its features in response to changes in plots and boundaries and enhance the temporal feature representation through the temporal information fusion module to ensure the accuracy of crop classification.
3.3. Crop Distribution Analysis in NSTM
A 10 m resolution map depicting the distribution of cotton, corn, and winter wheat in NSTM, Xinjiang, for the year 2022 was generated using the optimized model from the proposed framework. As illustrated in Figure 11, cotton dominates the agricultural landscape, spanning approximately 9.63 × 10³ km2. Major cotton-growing regions include central locales such as Wusu and Shawan, with portions extending to Changji and Bortala. Notably, Shawan is the leading cotton-producing county, contributing around 2.57 × 10³ km2. Corn, on the other hand, occupies an area close to 2.69 × 10³ km2. Principal corn-growing territories encompass Hot Spring County and Bole City in eastern Bortala, Qitai County in Changji, and the southern reaches of Shawan. Specifically, Bortala and Changji house corn plantations covering roughly 7.75 × 10² km2 and 1.03 × 10³ km2, respectively. Lastly, winter wheat cultivation spans approximately 1.54 × 10³ km2, predominantly seen in Wusu, Shawan, and several eastern areas within Changji. These regions, respectively, account for cultivation expanses of around 87.6 km2, 95.5 km2, and 1.19 × 10³ km2.
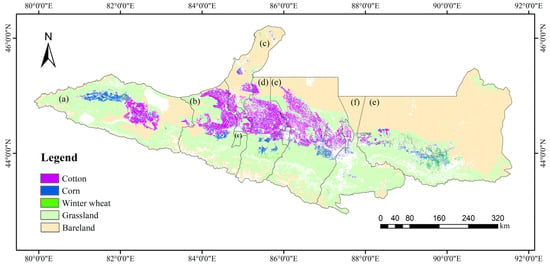
Figure 11.
Crop classification results of cotton, corn, and winter wheat at 10 m resolution within NSTM region: (a) Bortala Mongol Autonomous Prefecture; (b) Wusu City; (c) Keramay City; (d) Shawan City; (e) Changji Hui Autonomous Prefecture; (f) Urumqi City.
4. Discussion
4.1. Accuracy Assessment
This study employed multi-temporal crop classification techniques, achieving an impressive overall classification accuracy of 93% using a devised multi-scale and multi-temporal framework alongside the dataset. The ability to obtain high accuracy is mainly due to our extraction of spatial information of different sizes and SPM’s enhanced focus on spatial and spectral information, as well as the completion of bidirectional temporal feature extraction through ConvGRU. When evaluating various methods, the RF approach yielded an accuracy lower than 86.22% observed in dataset 1 of the proposed model, further trailing behind other deep learning techniques. Such findings underscore the potential and efficacy of deep learning in extensive crop mapping scenarios.
The comparison of datasets revealed distinct influences of data compositing time intervals and feature types on model accuracy. Specifically, dataset 4, composited at 15-day intervals and comprised of 12 spectral bands, presented the pinnacle of accuracy. The analysis of the results in Section 2.3.1 shows that more detailed temporal data are more adequate in terms of representing the crop phenology information, which is useful for the model to capture the differences in the temporal dimensions of different crops, and that all the band information is more adequate in terms of representing the characteristics of the crop at a given moment in time. Furthermore, each crop category demonstrated heightened PA and UA. However, sensitivity to these factors varied among crop categories. For instance, shortening compositing intervals had minimal effect on PA and UA for winter wheat. Conversely, a richer feature set consistently elevated the PA and UA beyond 90% for this particular crop.
Additionally, the refined model exhibited enhanced accuracy, delineating crop plot boundaries with increased clarity. Figure 12 demonstrates the model’s prowess in accurately identifying background features such as field roads and residential structures. Furthermore, boundary pixel mixing between crops was significantly reduced, leading to sharper, well-defined crop plot edges.
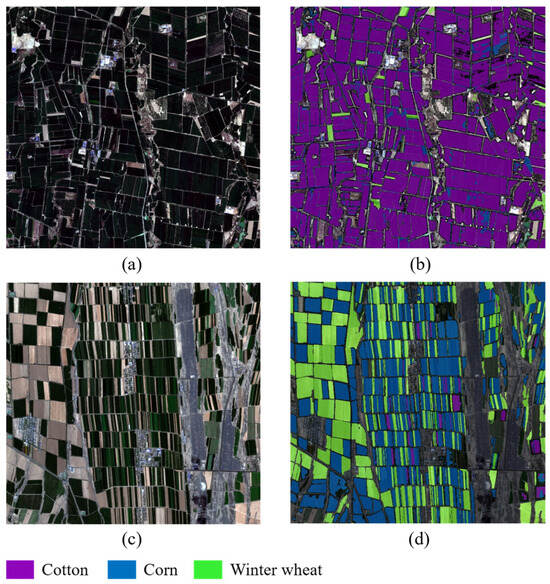
Figure 12.
High-resolution Sentinel-2 true-color images at 10 m resolution: (a,c) with overlay of crop classification results from this study (b,d).
Hu et al. [48] employed the RF classifier for cotton classification in NSTM, achieving an OA of 0.932 and a PA and UA of 0.846 and 0.871, respectively. While this study surpasses these metrics, direct comparison might be nuanced due to the use of varied datasets and experimental conditions. Notably, the two primary cotton-cultivating municipalities in NSTM for 2019, Shawan and Wusu, were estimated at 2.36 × 10³ km2 and 1.76 × 10³ km2. These figures only marginally deviate from the current study’s estimates of 2.57 × 10³ km2 and 1.94 × 10³ km2, hinting at potential temporal variations yet providing some validation for the experimental accuracy. This investigation capitalized on 12 bands of Sentinel-2 imagery, VH and VV polarization from Sentinel-1, and NDVI for classification. The need to construct masks to nullify non-crop category impacts using vegetation index thresholds was eliminated, minimizing manual interpretation and extensive feature exploration. The outcome was a singular, more efficient model capable of multi-class classification.
4.2. Applications and Limitations
Firstly, the realization of high-resolution crop mapping in a wide range of areas requires data processing of high-resolution images, and there is the influence of cloud cover, while GEE can meet the demand for efficient and convenient processing of wide-range and long-time-series remote sensing data in the multi-temporal classification method, and use the composite data of multi-period images to reduce the interference of cloud cover, and in recent years, many researches have used the GEE platform to produce a wide range of crop mapping products [23,49].
In addition, this study reduces the workload of field sampling by expanding the sample pixel points and classifying them based on a single pixel and its neighborhood information, avoids the problem of difficult production of image-level sample labels used by semantic segmentation-based methods, and is suitable for large-scale crop classification tasks. In addition, we explored the datasets used by the model and achieved high classification accuracy for some crops on monthly composites, which for some single crop monitoring tasks can effectively reduce the use of redundant data and better exclude pixel interference from clouds and shadows in the images.
In this study, spatial information is introduced on the basis of using spectral-temporal information of single-point pixels of crops, and more features lead to the improvement of background erosion and salt-and-pepper noise phenomenon in the classification results. In the method comparison, it can be found that the method can reduce the missed and false detections of crops and optimize the classification boundary between crops due to the SPM module with positive and negative bi-directional temporal dependencies, which demonstrates the advantages of this paper’s method in the task of crop extraction over a wide range of crops. The NSTM, as the core area of the Silk Road and an important mechanized agricultural production area in the northwestern region, are of great significance in guaranteeing the planting area of functional zones for corn and wheat production and in creating a high-quality cotton planting base. In the context of Xinjiang’s 2021–2035 Territorial Spatial Planning, it is conducive to optimizing the production space for agricultural products, implementing the functional areas for grain production, and promoting the construction of high-standard farmland and the protection of permanent basic farmland.
While the presented method boasts several strengths, it is not without challenges. Primarily, cloud interference in multi-temporal images poses a significant hurdle. For regions like southern China, known for extensive cloud cover, critical crop growth phases could remain obscured for extended periods, adversely impacting model precision. Additionally, in expansive regions, certain cash crops exhibit spectral characteristics that closely mirror phenological cycles. Given their dispersed distribution and a potential shortage of representative samples, ensuring accurate classification becomes complex.
Future research directions include: (1) Addressing the cloud interference in multi-temporal data. This could involve harnessing multiple data sources for replacement and augmentation and designing models that mask or interpolate over cloudy areas to enhance model versatility; (2) strategies such as comparative learning and clustering may be employed to amass comprehensive samples. This not only eases the challenges of large-scale fieldwork but also feeds deep learning models with richer datasets, driving efficiency; (3) considering regions like Xinjiang, where agricultural plots exhibit regularity and large scales, introducing object-level, plot-based classification might bolster crop classification accuracy.
5. Conclusions
This study introduces a crop classification technique utilizing multi-temporal Sentinel-2 imagery to effectively identify major crops like cotton, corn, and winter wheat across NSTM. Key findings include: (1) Sentinel-2 composite data with a 15-day interval and 12 bands yielded an optimal OA of 0.9303 and KC of 0.9062; (2) the versatility of the proposed framework, evident when compared to Random Forests, LSTM, transformer, and TempCNN, suggests its promise for diverse crop classification endeavors; (3) incorporating spatial information alongside SPM module enhances classification precision, minimizes misdetections, and refines classification boundaries. Compared to the LSTM, the OA is improved by 0.0242, and the PA of the background is improved by 0.04; (4) the derived high-resolution crop distribution maps for 2022 underscore the method’s capability to refine crop classification in oasis agricultural regions. This paves the way for refined spatial distribution planning of agricultural goods and precise crop acreage monitoring.
Author Contributions
Conceptualization, X.Z. and Y.G.; methodology, X.Z.; validation, X.Z., Y.G. and X.T.; data curation, Y.B.; writing—original draft preparation, X.Z.; writing—review and editing, Y.G. and X.T.; visualization, X.Z. All authors have read and agreed to the published version of the manuscript.
Funding
This study was supported by The National Key Research and Development Program of China (No. 2021YFB3901300).
Data Availability Statement
Data are contained within the article.
Acknowledgments
The authors thank the editors and anonymous reviewers for their valuable comments, which greatly improved the quality of the paper.
Conflicts of Interest
The authors declare no conflict of interest.
References
- FAO. The State of Food Security and Nutrition in the World; FAO: Rome, Italy, 2023. [Google Scholar]
- Karthikeyan, L.; Chawla, I.; Mishra, A.K. A review of remote sensing applications in agriculture for food security: Crop growth and yield, irrigation, and crop losses. J. Hydrol. 2020, 586, 124905. [Google Scholar] [CrossRef]
- Mutanga, O.; Dube, T.; Galal, O. Remote sensing of crop health for food security in Africa: Potentials and constraints. Remote Sens. Appl. Soc. Environ. 2017, 8, 231–239. [Google Scholar] [CrossRef]
- Sahle, M.; Yeshitela, K.; Saito, O. Mapping the supply and demand of Enset crop to improve food security in Southern Ethiopia. Agron. Sustain. Dev. 2018, 38, 7. [Google Scholar] [CrossRef]
- Jin, X.; Kumar, L.; Li, Z.; Feng, H.; Xu, X.; Yang, G.; Wang, J. A review of data assimilation of remote sensing and crop models. Eur. J. Agron. 2018, 92, 141–152. [Google Scholar] [CrossRef]
- Khanal, S.; Kc, K.; Fulton, J.P.; Shearer, S.; Ozkan, E. Remote sensing in agriculture—Accomplishments, limitations, and opportunities. Remote Sens. 2020, 12, 3783. [Google Scholar] [CrossRef]
- Moran, M.S.; Inoue, Y.; Barnes, E. Opportunities and limitations for image-based remote sensing in precision crop management. Remote Sens. Environ. 1997, 61, 319–346. [Google Scholar] [CrossRef]
- Peña-Barragán, J.M.; Ngugi, M.K.; Plant, R.E.; Six, J. Object-based crop identification using multiple vegetation indices, textural features and crop phenology. Remote Sens. Environ. 2011, 115, 1301–1316. [Google Scholar] [CrossRef]
- Abd El-Ghany, N.M.; Abd El-Aziz, S.E.; Marei, S.S. A review: Application of remote sensing as a promising strategy for insect pests and diseases management. Environ. Sci. Pollut. Res. 2020, 27, 33503–33515. [Google Scholar] [CrossRef]
- Pinter, P.J., Jr.; Hatfield, J.L.; Schepers, J.S.; Barnes, E.M.; Moran, M.S.; Daughtry, C.S.; Upchurch, D.R. Remote sensing for crop management. Photogramm. Eng. Remote Sens. 2003, 69, 647–664. [Google Scholar] [CrossRef]
- Zhang, J.; Huang, Y.; Pu, R.; Gonzalez-Moreno, P.; Yuan, L.; Wu, K.; Huang, W. Monitoring plant diseases and pests through remote sensing technology: A review. Comput. Electron. Agric. 2019, 165, 104943. [Google Scholar] [CrossRef]
- Doraiswamy, P.C.; Moulin, S.; Cook, P.W.; Stern, A. Crop yield assessment from remote sensing. Photogramm. Eng. Remote Sens. 2003, 69, 665–674. [Google Scholar] [CrossRef]
- Muruganantham, P.; Wibowo, S.; Grandhi, S.; Samrat, N.H.; Islam, N. A systematic literature review on crop yield prediction with deep learning and remote sensing. Remote Sens. 2022, 14, 1990. [Google Scholar] [CrossRef]
- Friedl, M.A.; Brodley, C.E. Decision tree classification of land cover from remotely sensed data. Remote Sens. Environ. 1997, 61, 399–409. [Google Scholar] [CrossRef]
- Blickensdörfer, L.; Schwieder, M.; Pflugmacher, D.; Nendel, C.; Erasmi, S.; Hostert, P. Mapping of crop types and crop sequences with combined time series of Sentinel-1, Sentinel-2 and Landsat 8 data for Germany. Remote Sens. Environ. 2022, 269, 112831. [Google Scholar] [CrossRef]
- Bouguettaya, A.; Zarzour, H.; Kechida, A.; Taberkit, A.M. Deep learning techniques to classify agricultural crops through UAV imagery: A review. Neural Comput. Appl. 2022, 34, 9511–9536. [Google Scholar] [CrossRef]
- Tariq, A.; Yan, J.; Gagnon, A.S.; Riaz Khan, M.; Mumtaz, F. Mapping of cropland, cropping patterns and crop types by combining optical remote sensing images with decision tree classifier and random forest. Geo-Spat. Inf. Sci. 2023, 26, 302–320. [Google Scholar] [CrossRef]
- Jakubauskas, M.E.; Legates, D.R.; Kastens, J.H. Crop identification using harmonic analysis of time-series AVHRR NDVI data. Comput. Electron. Agric. 2002, 37, 127–139. [Google Scholar] [CrossRef]
- Wardlow, B.D.; Egbert, S.L.; Kastens, J.H. Analysis of time-series MODIS 250 m vegetation index data for crop classification in the US Central Great Plains. Remote Sens. Environ. 2007, 108, 290–310. [Google Scholar] [CrossRef]
- Biau, G.; Scornet, E. A random forest guided tour. Test 2016, 25, 197–227. [Google Scholar] [CrossRef]
- Hearst, M.A.; Dumais, S.T.; Osuna, E.; Platt, J.; Scholkopf, B. Support vector machines. IEEE Intell. Syst. Their Appl. 1998, 13, 18–28. [Google Scholar] [CrossRef]
- Chen, T.; He, T.; Benesty, M.; Khotilovich, V.; Tang, Y.; Cho, H.; Chen, K.; Mitchell, R.; Cano, I.; Zhou, T. Xgboost: Extreme gradient boosting. R Package Version 0.4-2 2015, 1, 1–4. [Google Scholar]
- You, N.; Dong, J.; Huang, J.; Du, G.; Zhang, G.; He, Y.; Yang, T.; Di, Y.; Xiao, X. The 10-m crop type maps in Northeast China during 2017–2019. Sci. Data 2021, 8, 41. [Google Scholar] [CrossRef] [PubMed]
- Luo, K.; Lu, L.; Xie, Y.; Chen, F.; Yin, F.; Li, Q. Crop type mapping in the central part of the North China Plain using Sentinel-2 time series and machine learning. Comput. Electron. Agric. 2023, 205, 107577. [Google Scholar] [CrossRef]
- Zhao, Z.-Q.; Zheng, P.; Xu, S.-t.; Wu, X. Object detection with deep learning: A review. IEEE Trans. Neural Netw. Learn. Syst. 2019, 30, 3212–3232. [Google Scholar] [CrossRef] [PubMed]
- Zhao, Y.; Chen, P.; Chen, Z.; Bai, Y.; Zhao, Z.; Yang, X. A Triple-Stream Network With Cross-Stage Feature Fusion for High-Resolution Image Change Detection. IEEE Trans. Geosci. Remote Sens. 2023, 61, 1–17. [Google Scholar] [CrossRef]
- Guo, Y.; Liu, Y.; Georgiou, T.; Lew, M.S. A review of semantic segmentation using deep neural networks. Int. J. Multimed. Inf. Retr. 2018, 7, 87–93. [Google Scholar] [CrossRef]
- Zhao, H.; Duan, S.; Liu, J.; Sun, L.; Reymondin, L. Evaluation of five deep learning models for crop type mapping using sentinel-2 time series images with missing information. Remote Sens. 2021, 13, 2790. [Google Scholar] [CrossRef]
- Li, G.; Han, W.; Dong, Y.; Zhai, X.; Huang, S.; Ma, W.; Cui, X.; Wang, Y. Multi-Year Crop Type Mapping Using Sentinel-2 Imagery and Deep Semantic Segmentation Algorithm in the Hetao Irrigation District in China. Remote Sens. 2023, 15, 875. [Google Scholar] [CrossRef]
- Seydi, S.T.; Amani, M.; Ghorbanian, A. A dual attention convolutional neural network for crop classification using time-series Sentinel-2 imagery. Remote Sens. 2022, 14, 498. [Google Scholar] [CrossRef]
- Gallo, I.; Ranghetti, L.; Landro, N.; La Grassa, R.; Boschetti, M. In-season and dynamic crop mapping using 3D convolution neural networks and sentinel-2 time series. ISPRS J. Photogramm. Remote Sens. 2023, 195, 335–352. [Google Scholar] [CrossRef]
- Yu, Y.; Si, X.; Hu, C.; Zhang, J. A review of recurrent neural networks: LSTM cells and network architectures. Neural Comput. 2019, 31, 1235–1270. [Google Scholar] [CrossRef] [PubMed]
- Hochreiter, S.; Schmidhuber, J. Long short-term memory. Neural Comput. 1997, 9, 1735–1780. [Google Scholar] [CrossRef] [PubMed]
- Lin, Z.; Zhong, R.; Xiong, X.; Guo, C.; Xu, J.; Zhu, Y.; Xu, J.; Ying, Y.; Ting, K.; Huang, J. Large-scale rice mapping using multi-task spatiotemporal deep learning and sentinel-1 sar time series. Remote Sens. 2022, 14, 699. [Google Scholar] [CrossRef]
- Khan, H.R.; Gillani, Z.; Jamal, M.H.; Athar, A.; Chaudhry, M.T.; Chao, H.; He, Y.; Chen, M. Early Identification of Crop Type for Smallholder Farming Systems Using Deep Learning on Time-Series Sentinel-2 Imagery. Sensors 2023, 23, 1779. [Google Scholar] [CrossRef] [PubMed]
- Zhao, H.; Chen, Z.; Jiang, H.; Jing, W.; Sun, L.; Feng, M. Evaluation of three deep learning models for early crop classification using sentinel-1A imagery time series—A case study in Zhanjiang, China. Remote Sens. 2019, 11, 2673. [Google Scholar] [CrossRef]
- Dupuis, A.; Dadouchi, C.; Agard, B. Performances of a Seq2Seq-LSTM methodology to predict crop rotations in Québec. Smart Agric. Technol. 2023, 4, 100180. [Google Scholar] [CrossRef]
- Jurado-Expósito, M.; López-Granados, F.; Atenciano, S.; Garcıa-Torres, L.; González-Andújar, J.L. Discrimination of weed seedlings, wheat (Triticum aestivum) stubble and sunflower (Helianthus annuus) by near-infrared reflectance spectroscopy (NIRS). Crop Prot. 2003, 22, 1177–1180. [Google Scholar] [CrossRef]
- Ghosh, P.; Mandal, D.; Bhattacharya, A.; Nanda, M.K.; Bera, S. Assessing crop monitoring potential of Sentinel-2 in a spatio-temporal scale. Int. Arch. Photogramm. Remote Sens. Spat. Inf. Sci. 2018, 42, 227–231. [Google Scholar] [CrossRef]
- Huang, J.; Wang, H.; Dai, Q.; Han, D. Analysis of NDVI data for crop identification and yield estimation. IEEE J. Sel. Top. Appl. Earth Obs. Remote Sens. 2014, 7, 4374–4384. [Google Scholar] [CrossRef]
- Shi, X.; Chen, Z.; Wang, H.; Yeung, D.-Y.; Wong, W.-K.; Woo, W.-C. Convolutional LSTM network: A machine learning approach for precipitation nowcasting. Adv. Neural Inf. Process. Syst. 2015, 28. [Google Scholar]
- Tian, X.; Bai, Y.; Li, G.; Yang, X.; Huang, J.; Chen, Z. An Adaptive Feature Fusion Network with Superpixel Optimization for Crop Classification Using Sentinel-2 Imagery. Remote Sens. 2023, 15, 1990. [Google Scholar] [CrossRef]
- Zhang, Z.; Sabuncu, M. Generalized cross entropy loss for training deep neural networks with noisy labels. Adv. Neural Inf. Process. Syst. 2018, arXiv:1805.07836. [Google Scholar]
- Kingma, D.P.; Ba, J. Adam: A method for stochastic optimization. arXiv 2014, arXiv:1412.6980. [Google Scholar]
- Loshchilov, I.; Hutter, F. Sgdr: Stochastic gradient descent with warm restarts. arXiv 2016, arXiv:1608.03983. [Google Scholar]
- Han, K.; Xiao, A.; Wu, E.; Guo, J.; Xu, C.; Wang, Y. Transformer in transformer. Adv. Neural Inf. Process. Syst. 2021, 34, 15908–15919. [Google Scholar]
- Wang, Z.; Yan, W.; Oates, T. Time series classification from scratch with deep neural networks: A strong baseline. In Proceedings of the 2017 International Joint Conference on Neural Networks (IJCNN), Anchorage, AK, USA, 14–19 May 2017; pp. 1578–1585. [Google Scholar]
- Hu, T.; Hu, Y.; Dong, J.; Qiu, S.; Peng, J. Integrating sentinel-1/2 data and machine learning to map cotton fields in Northern Xinjiang, China. Remote Sens. 2021, 13, 4819. [Google Scholar] [CrossRef]
- Jin, Z.; Azzari, G.; You, C.; Di Tommaso, S.; Aston, S.; Burke, M.; Lobell, D.B. Smallholder maize area and yield mapping at national scales with Google Earth Engine. Remote Sens. Environ. 2019, 228, 115–128. [Google Scholar] [CrossRef]
Disclaimer/Publisher’s Note: The statements, opinions and data contained in all publications are solely those of the individual author(s) and contributor(s) and not of MDPI and/or the editor(s). MDPI and/or the editor(s) disclaim responsibility for any injury to people or property resulting from any ideas, methods, instructions or products referred to in the content. |
© 2023 by the authors. Licensee MDPI, Basel, Switzerland. This article is an open access article distributed under the terms and conditions of the Creative Commons Attribution (CC BY) license (https://creativecommons.org/licenses/by/4.0/).