Article

Dynamic of Phenolic Compounds in Guadua angustifolia Kunth under Chemical, Organic, and Biological Fertilization

by
Juan José Sánchez-Matiz
,
Hair Santiago Lozano-Puentes
,
David A. Villamarín-Raad
,
Sergio A. Díaz-Gallo
and
Lucía Ana Díaz-Ariza
*
Grupo de Investigación en Agricultura Biológica, Laboratorio de Asociaciones Suelo Planta Microorganismo, Facultad de Ciencias, Pontificia Universidad Javeriana, Bogotá 110231, Colombia
*
Author to whom correspondence should be addressed.
These authors contributed equally to this work.
Agronomy 2023, 13(11), 2782; https://doi.org/10.3390/agronomy13112782
Submission received: 12 October 2023 / Revised: 3 November 2023 / Accepted: 6 November 2023 / Published: 9 November 2023

Abstract

:
Guadua angustifolia produces phenolic compounds, and this production may be influenced by the application of chemical, organic, and biological fertilizers. Currently, the effect of such fertilizers on the synthesis dynamics of this group of metabolites in bamboo is unknown. In this study, the total phenolic content (TPC) and total flavonoid content (TFC) in the leaves of plants fertilized with diammonium phosphate (DAP) and humus in combination with the biofertilizers Promofort®, Azospirillum brasilense, Pseudomonas fluorescens, and Stenotrophomonas sp. were determined using colorimetric techniques across three sampling events (four, five, and seven months after planting). Additionally, an approximation of the bacterial profile of G. angustifolia roots was performed using the DGGE-PCR fingerprint technique. Through repeated measures ANOVA (rmANOVA), it was determined that there is no statistically significant three-way interaction between humus or DAP application, biological fertilizers, and time for either TPC or TFC. However, there were interactions between the sampling event and the application of biological fertilizers for both TPC and TFC, with the latter being promoted by the application of Promofort®. Finally, NMDS analyses and heatmaps with hierarchical clustering showed that the composition and abundance of OTUs in the bacterial profile varied with fertilization type and increased over time.

1. Introduction

Guadua is a woody bamboo genus native to the Americas, belonging to the subfamily Bambusoideae within the Poaceae family [1]. The genus includes species such as G. angustifolia, an important species in the Neotropics due to its economic, social, and ecological importance [2,3,4,5]. This species is widely utilized as a substitute for forest timber species, for energy production, carbon storage, as well as in the paper, food, and construction industries [1,4,6]. The chemical composition of bio-compounds such as the flavonoids quercetin, kaempferol, and vitexin was assessed in the leaves and stems of G. angustifolia [7,8]. These are classified as bioactive secondary metabolites containing pharmacological properties that are part of a larger group of phenolic compounds [9,10]. Moreover, they are involved in plant growth and development, responses to environmental stress, the establishment of symbiotic relationships, and modification of the rhizospheric microbial community configuration [11].
The total phenolic content in plants can be positively or negatively influenced by agronomic management [12,13,14,15]. Numerous studies reported that both organic management systems [16,17,18] and those treated with conventional or chemically synthesized fertilizers [19,20,21] stimulate the production and content of bioactive phenolic compounds, phenols, and flavonoids in different plant species. Additionally, the application of conventional fertilizers such as diammonium phosphate (DAP) was described to improve the content of nitrogen and phosphorus available in the soil, promoting the content of chlorophyll in leaves [22] and plant yield [23], while organic fertilizers have an effect oriented to the promotion and benefit of the soil microbiome by acting as a biologically active agent that enhances synergistic interactions within the soil microbiome that leading to an increase in plant biomass [24].
Furthermore, the utilization of other types of fertilizers, such as biological fertilizers, can improve soil nutrient availability, plant growth, and crop production [25,26,27] by enhancing the availability of elements such as nitrogen, phosphorus, and potassium in soil [28,29]. The application of biological fertilizers was reported to be positively correlated with the content of phenolic compounds [30]. Fertilizing with bacterial products derived from various species demonstrated an increase in the concentration of these compounds, particularly flavonoids and phenolic acids [31]. Azotobacter sp., Azospirillum sp., Bacillus sp., Stenotrophomonas sp., and Pseudomonas sp., were identified to augment the content of phenolic compounds in plants [21,32], especially when combined with other fertilizers. This was recently reported for G. angustifolia [33].
Variation in the content of phenolic compounds can be attributed to various intrinsic factors of plants such as their age, as well as extrinsic biotic or abiotic factors such as soil fertility [34,35]. Lavola et al. [36] observed that the proportion and content of phenolic compounds changed in trees of different ages, with higher levels present in older plants. This accumulation may occur in various plant tissues or organs, similar to what happens in the leaves of agriculturally important plants such as Solanum lycopersicum L. [37]. In other reports, phenolic compounds decreased with plant age, as described for the leaves of Brassica napus L. and stems of Saccharum officinarum L. [38,39]. Therefore, no general consensus was established regarding the effect of age on the content of these types of secondary metabolites in plants.
The composition of rhizospheric microbial communities can impact the nutritional and phytosanitary status of host plants, so it is important to consider that the application of fertilizers affects this community [40,41]. Organic fertilizers were reported to promote the richness of soil bacterial communities [42,43], although the response can be variable [41,42,43,44]. This phenomenon is not solely due to the type of fertilization; it was also shown that temporality significantly affects the physicochemical properties of the soil and the activity and structure of the microbial community [45,46,47].
Considering that fertilization, whether organic, conventional, or biological, differentially modulates the production of secondary metabolites, particularly the content of phenolic compounds, which in turn are affected by intrinsic factors of plants, such as their age, we hypothesized that the combined application of chemical or organic fertilizers with biological fertilizers is significantly related to the content of phenolic compounds in the leaves of G. angustifolia over time. Therefore, the aim of this study was to evaluate the dynamics of the phenolic compound content in the leaves of G. angustifolia plants fertilized with organic and synthetic chemical products in combination with different biofertilizers over time in a greenhouse experiment.

2. Materials and Methods

2.1. Location of the Experiment and Biological Material

The experiment was conducted from October 2022 to June 2023 in an experimental area located in the municipality of Pacho, Cundinamarca, Colombia (5°10′51.4″ N; 74°11′44.0″ W), at an altitude of 1330 m. The average annual temperature in this location is 18 °C, with an average humidity of 86%. Guadua angustifolia plants were propagated from lateral branches collected from natural stands in Cundinamarca, Colombia. The biofertilizers used for plant inoculation were formulated using strains deposited in the Microorganism Collection of Pontificia Universidad Javeriana (RNC 148, WFCC 857). Azospirillum brasilense was formulated with the strain ATCC 29710; Pseudomonas fluorescens consisted of a consortium of four strains; Stenotrophomonas sp. was a co-culture, and Promofort® (Pontificia Universidad Javeriana, Bogotá, Col) was a consortium of Enterobacter sp., Stenotrophomonas sp., and Serratia sp. These biofertilizers were prepared according to the culture media described by Díaz [48].

2.2. Experimental Setup and Sampling

A factorial block design composed of three factors was applied: fertilizer, biofertilizer, and time, with the following levels: DAP (Nutrimon, Bogotá, Col), humus (San Rafael, Bogotá, Col), and water irrigation as control, A. brasilense, P. fluorescens, Stenotrophomonas sp., Promofort®, and water irrigation as control, and sampling event I, II, and III, respectively. Fifteen treatments were placed in three blocks, each consisting of three pots with three plants per pot, for a total of 27 plants per treatment for each sampling event. For the fertilizers, 100 mL of 0.5% humus, 1.5 g of DAP, divided into two applications (0.75 g at planting and 0.4 g at 15 and 30 days after planting), and 100 mL of water was applied, while for the control, only 100 mL of water was applied. The volume of the biofertilizers was 100 mL at a concentration of 5%. The substrate has the following physical and chemical properties: texture is silt loam, pH 6.68, electric conductivity 0.99 dS/m, oxidizable organic carbon 7.49%, organic matter 12.9%, total nitrogen 0.624%, available phosphorus 12.2 mg/kg, iron 2.55 mg/kg, copper 0.19 mg/kg, zinc 5.18 mg/kg, boron 0.612 mg/kg, sulfur 37.6 mg/kg, effective cation exchange capacity 26.3 cmolc/kg, exchangeable potassium 0.35 cmolc/kg, exchangeable calcium 19.33 cmolc/kg, exchangeable magnesium 6.60 cmolc/kg, exchangeable sodium 0.24 cmolc/kg, and apparent density 0.789 g/cm3 [33].
A composite sample of healthy leaves and roots of all three plants per pot and per block, approximately 500 mg of leaves and 800 mg of roots, were sampled at four months after planting (sampling event I), five months after planting (sampling event II), and seven months after planting (sampling event III). The leaves were dried at 37 °C for 72 h, and the roots were washed with tap water to remove soil particles and stored at −80 °C until use.

2.3. Extraction and Identification of Phenolic Compounds

The dried leaves were fragmented, sieved through an 850 μm sieve, and 150 mg of the material was weighed for further processing using the ultrasound-assisted extraction methodology [49].
Quantification of the total phenolic content (TPC) was performed using the Folin-Ciocalteu (Sigma-Aldrich, St. Louis, MI, USA) spectrophotometric technique [50]. The reaction product was read at 765 nm on the HACH® DR6000 UV-VIS spectrophotometer (Hach, Bogotá, Colombia) with RFID technology. The results obtained were compared with a gallic acid (Sigma-Aldrich, St. Louis, MI, USA) calibration curve from 0 to 100 mg/L (r2: 0.9988) and expressed as TPC = mg GAE/g DM, where TPC = total phenolic content, GAE = gallic acid equivalents, and DM = dry matter.
Quantification of the total flavonoid content (TFC) was carried out using the aluminum chloride (AlCl3) (Sigma-Aldrich, St. Louis, MI, USA) spectrophotometric technique [51]. The reaction product was read at 425 nm on the HACH® DR6000 UV-VIS spectrophotometer with RFID technology. The results obtained were compared with a rutin (Sigma-Aldrich, St. Louis, MI, USA) calibration curve from 0 to 80 mg/L (r2: 0.9947) and expressed as TFC = mg RE/g DM, where TFC = total flavonoid content, RE = rutin equivalents, and DM = dry matter.

2.4. Extraction and Amplification of Root Bacterial DNA

A total of 300 mg of frozen roots was placed in a vial and macerated with liquid nitrogen. The DNA extraction was conducted following the modified method of Doyle and Doyle [52], with the addition of 10 µL of lysozyme (Sigma-Aldrich, St. Louis, MI, USA) (60 µg/mL) and 10 µL of mutanolysin (Sigma-Aldrich, St. Louis, MI, USA) (24 U/mL). The mixture was then incubated at 37 °C for 30 min. Subsequently, 20 µL of proteinase K (Macherey Nagel, Düren, Germany) (0.1 mg/mL) was added, followed by further incubation under the same previous reaction conditions.
Polymerase chain reactions (PCR) specific to bacteria were performed. The first amplification reaction targeted the V1-V8 regions of the 16S rDNA using primers 1378R (5′-CGG TGT GTA CAA GGC CCG GGA ACG-3′) and 27F (5′-AGA GTT TGA TCC TGG CTC AG-3′) [53]. The PCR conditions were as follows: initial denaturation at 95 °C for 4 min, followed by 35 cycles of denaturation at 94 °C for 45 s, annealing at 50 °C for 45 s, and extension at 72 °C for 90 s. A final extension step was carried out at 72 °C for 10 min. The second reaction was performed using 1 µL of a 1:50 dilution of the first reaction and primers 1378R and 968GC (5′-AAC GCG AAG AAC CTT AGC GCC CGC CGC GCC CCG CGC CCG TCC CGC CGC CCC CGC CCG-3′) [54]. The amplification conditions included an initial denaturation at 94 °C for 5 min, followed by 35 cycles of denaturation at 93 °C for 30 s, annealing at 56 °C for 40 s, and extension at 68 °C for 40 s. A final extension step was carried out at 68 °C for 7 min.
The bacterial profile was determined from the last reaction of the PCR product in 8% (w/v) polyacrylamide gel (Sigma-Aldrich St. Louis, MI, USA) with a denaturing gradient (DGGE) [55], using a gradient ranging from 40% to 55%.

2.5. Statistical Analyses and Data Handling

To evaluate the effect of fertilizer, biofertilizer, and time on the content of total phenols and flavonoids, a three-way repeated-measures analysis of variance (rmANOVA) was employed, followed by Tukey’s post hoc tests [56] adjusted with the Bonferroni correction for multiple comparisons. The Shapiro–Wilk test was used to assess whether the observations followed a normal distribution, which was confirmed [57]. The assumption of homogeneity of variances was verified using the Levene test [58]. Mauchly’s sphericity test was checked for each rmANOVA and corrected using the Greenhouse–Geisser (GG) and Huynh–Feldt (HF) methods [59,60]. The rmANOVA was conducted using R (R Foundation for Statistical Computing version 4.3.1, Vienna, Austria) [61] with the ez package v4.4-0 [62]. Graphs, multiple comparison statistics, and assumption checks were performed using the rstatix v0.7.2 [63] and ggpubr v0.6.0 [64] packages.
The analysis of the band patterns detected by the DGGE analysis was performed using ImageLab® Software (Bio-Rad Laboratories Inc., Image Lab Software for PC, Version 6.1, Hercules, CA, USA). DGGE patterns were assessed by recording the presence (1) or absence (0) of individual bands in each lane per sample, with each band present in the gel interpreted as a distinct operational taxonomic unit (OTU).
Based on the abundance of each detected OTU and grouped according to the results obtained from rmANOVA for TPC and TFC, non-metric multidimensional scaling (NMDS) analyses were performed using the vegan package v2.6-4 [65] in R v4.3.1 [61]. Using the NMDS results, heatmaps were generated with hierarchical clustering based on Euclidean dissimilarity measures according to the recommendations of [66] for the combinations of considered factors per the rmANOVA. The heatmaps and their hierarchical clusterings were obtained using the CIMMiner One Matrix CIM software from the U.S. National Institutes of Health (http://discover.nci.nih.gov/cimminer, accessed on 11 October 2023) [67].

3. Results

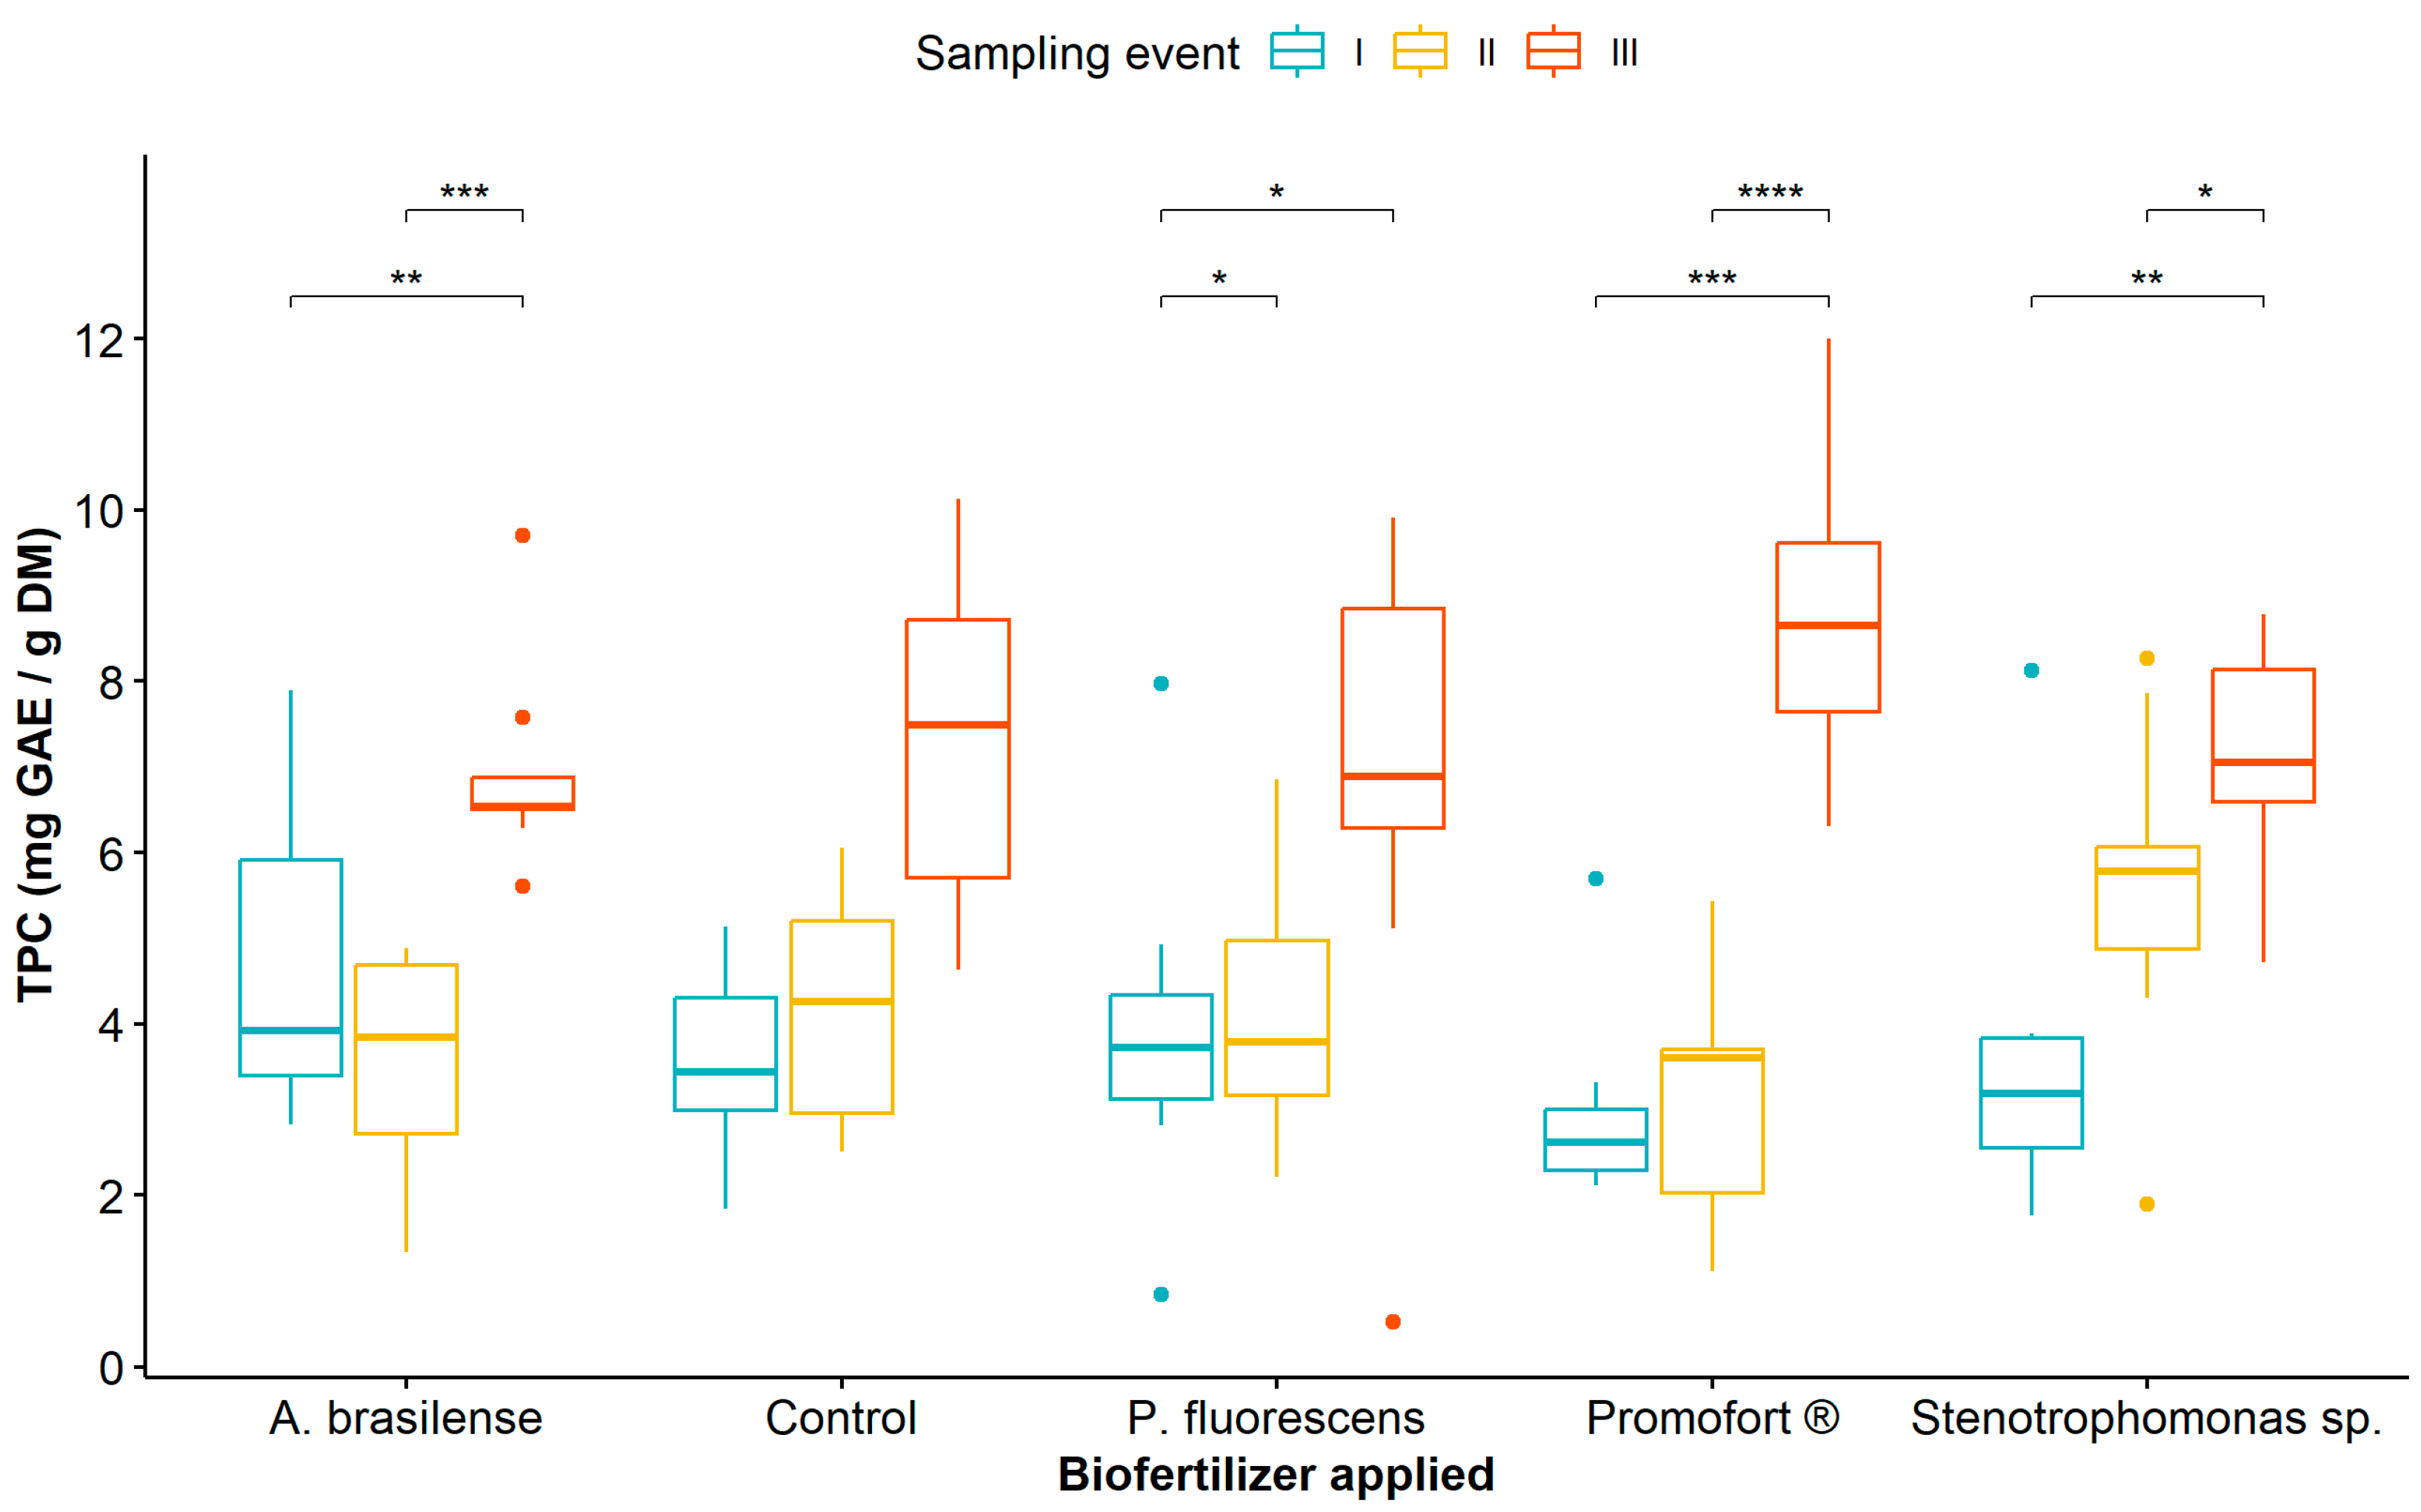
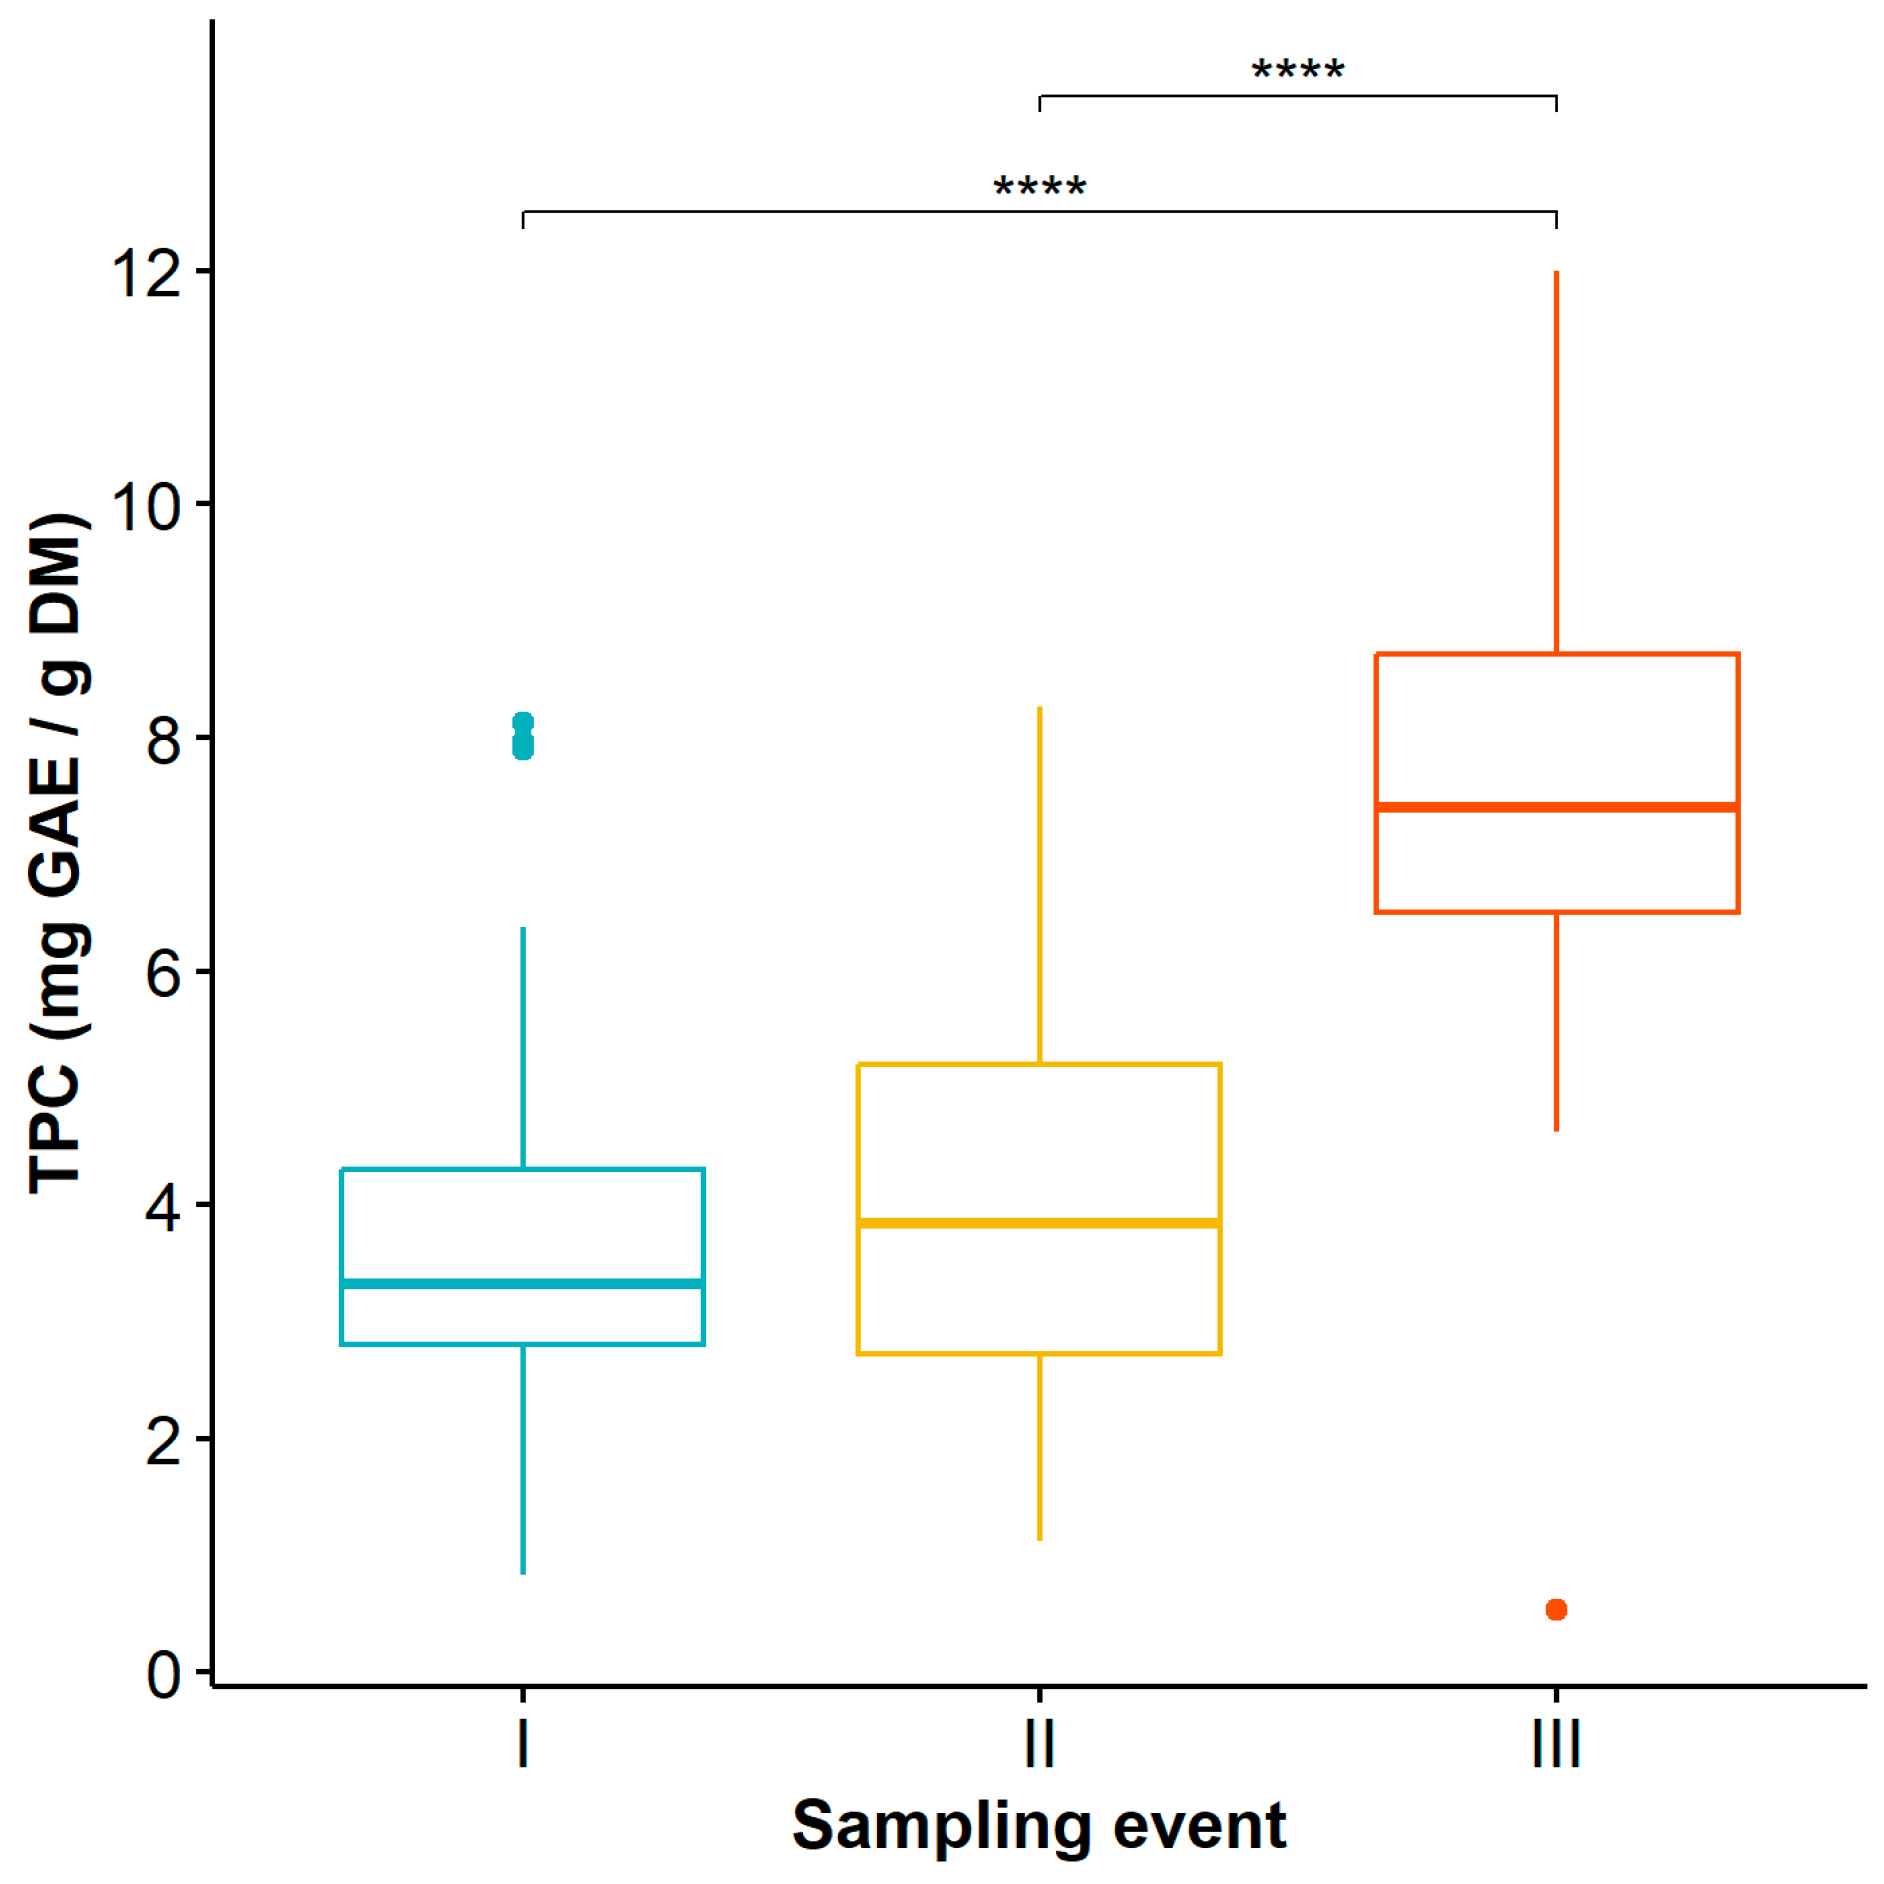
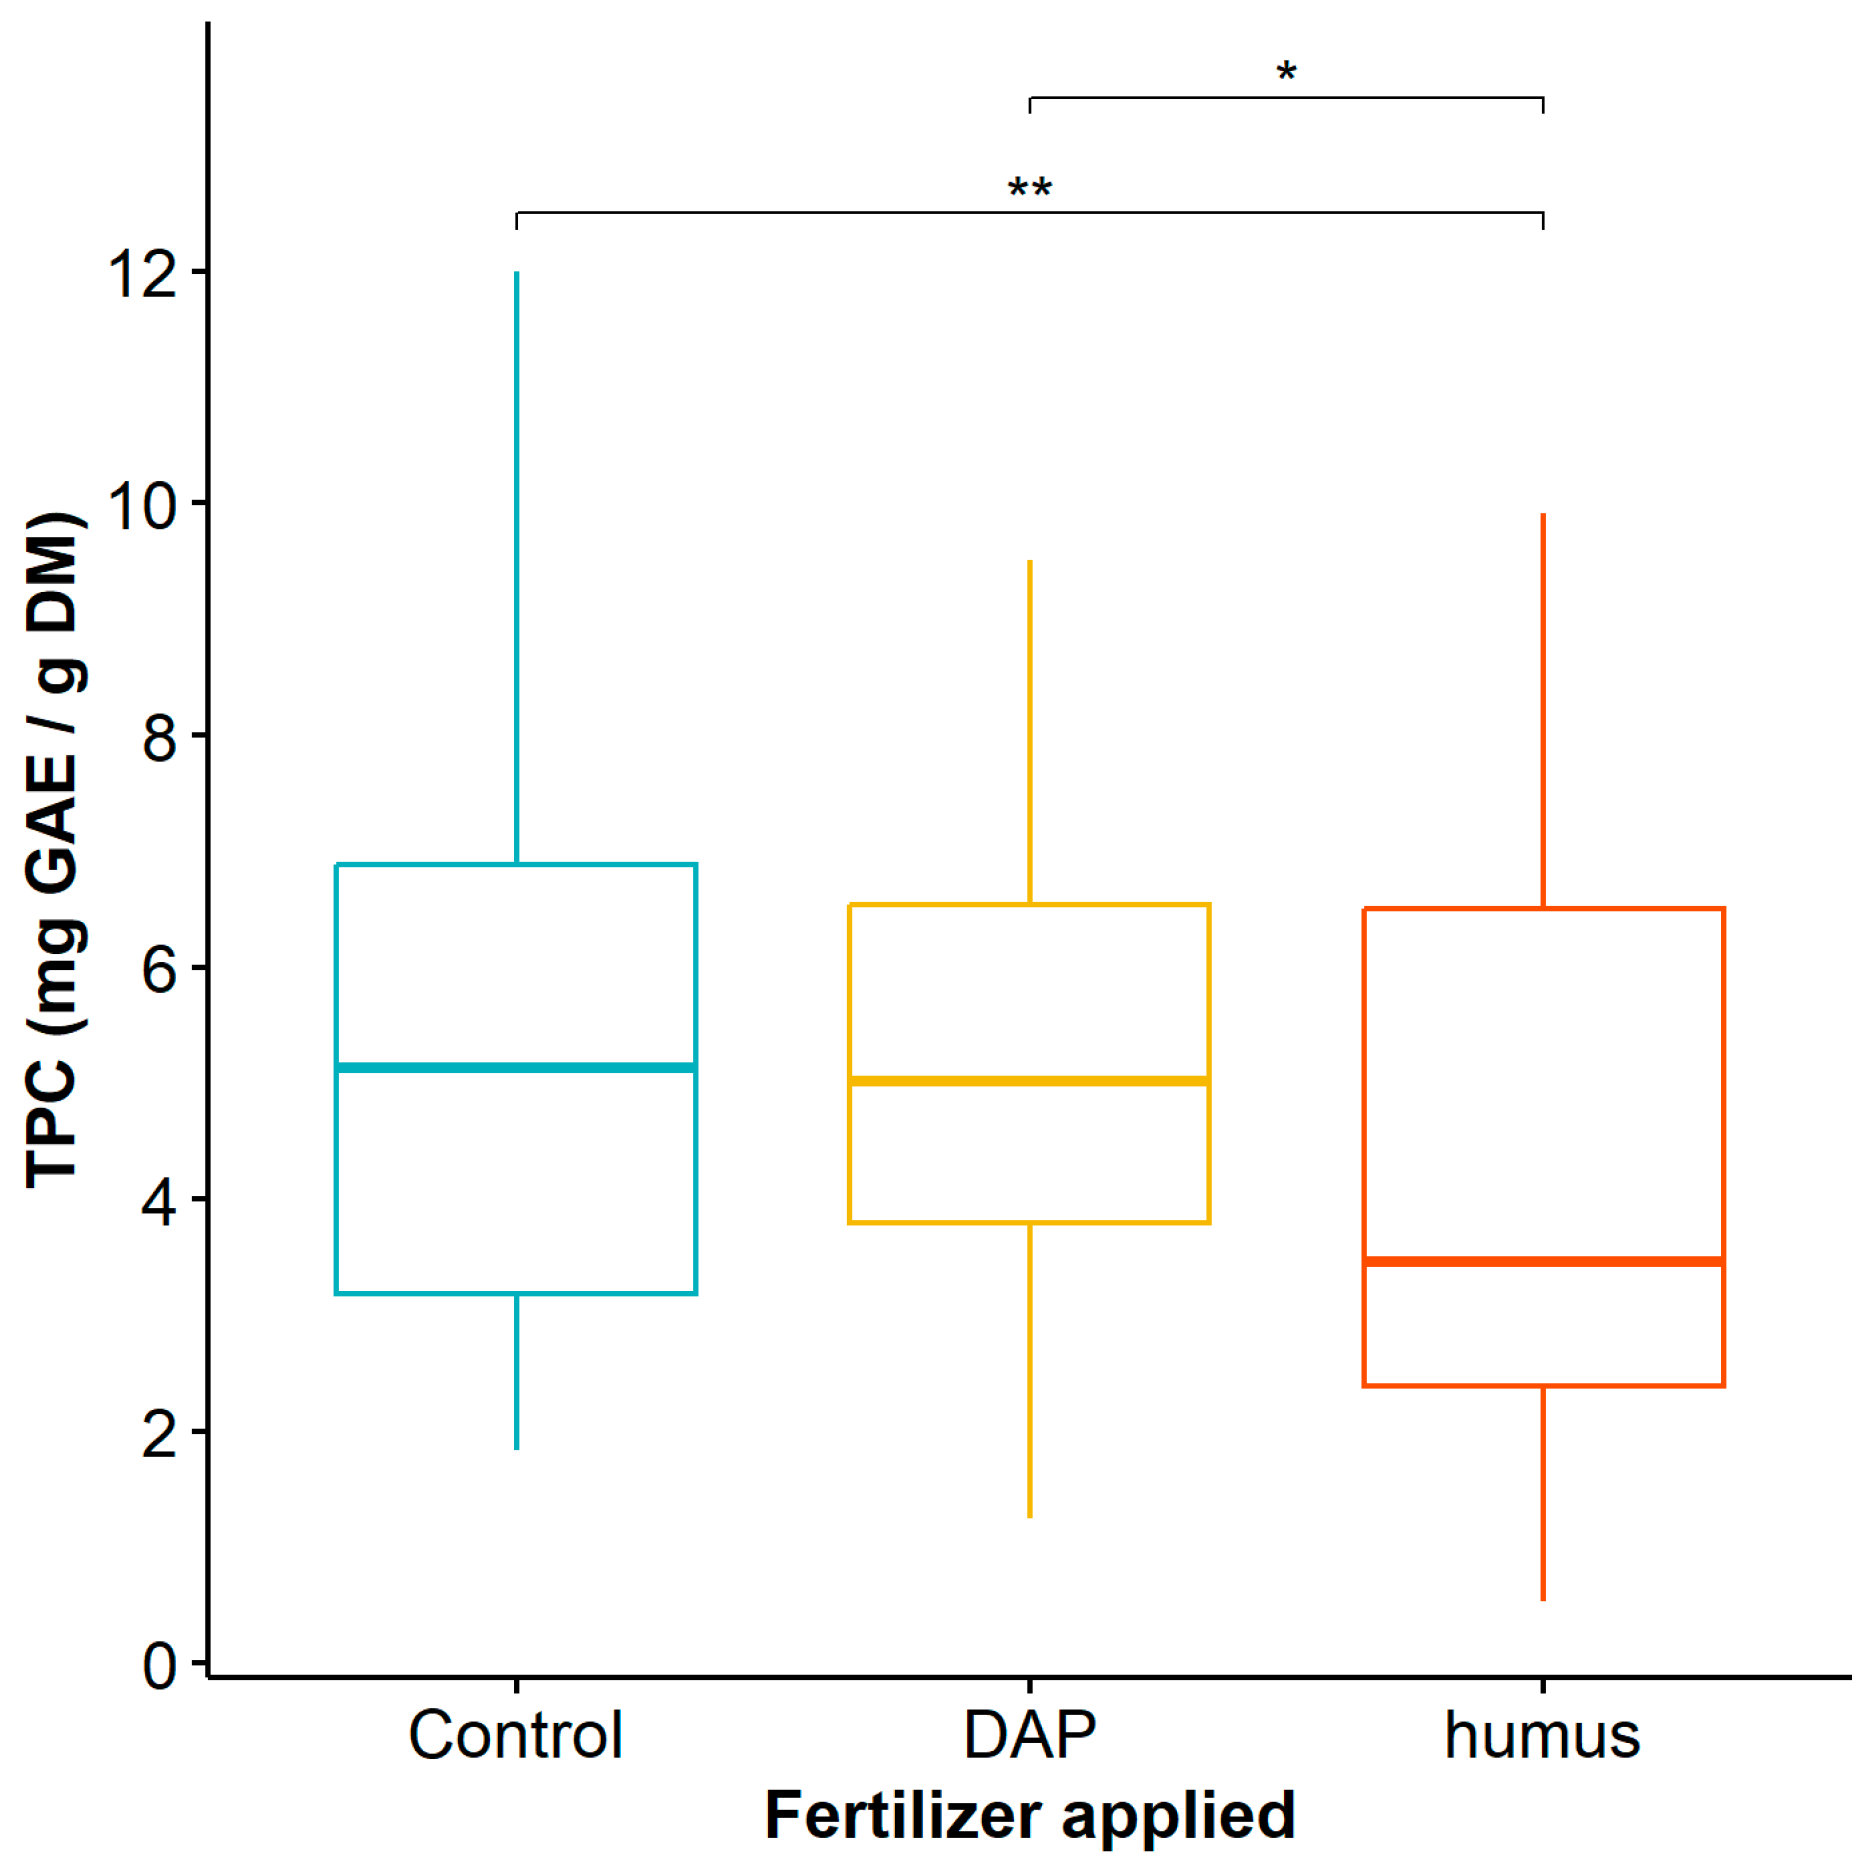
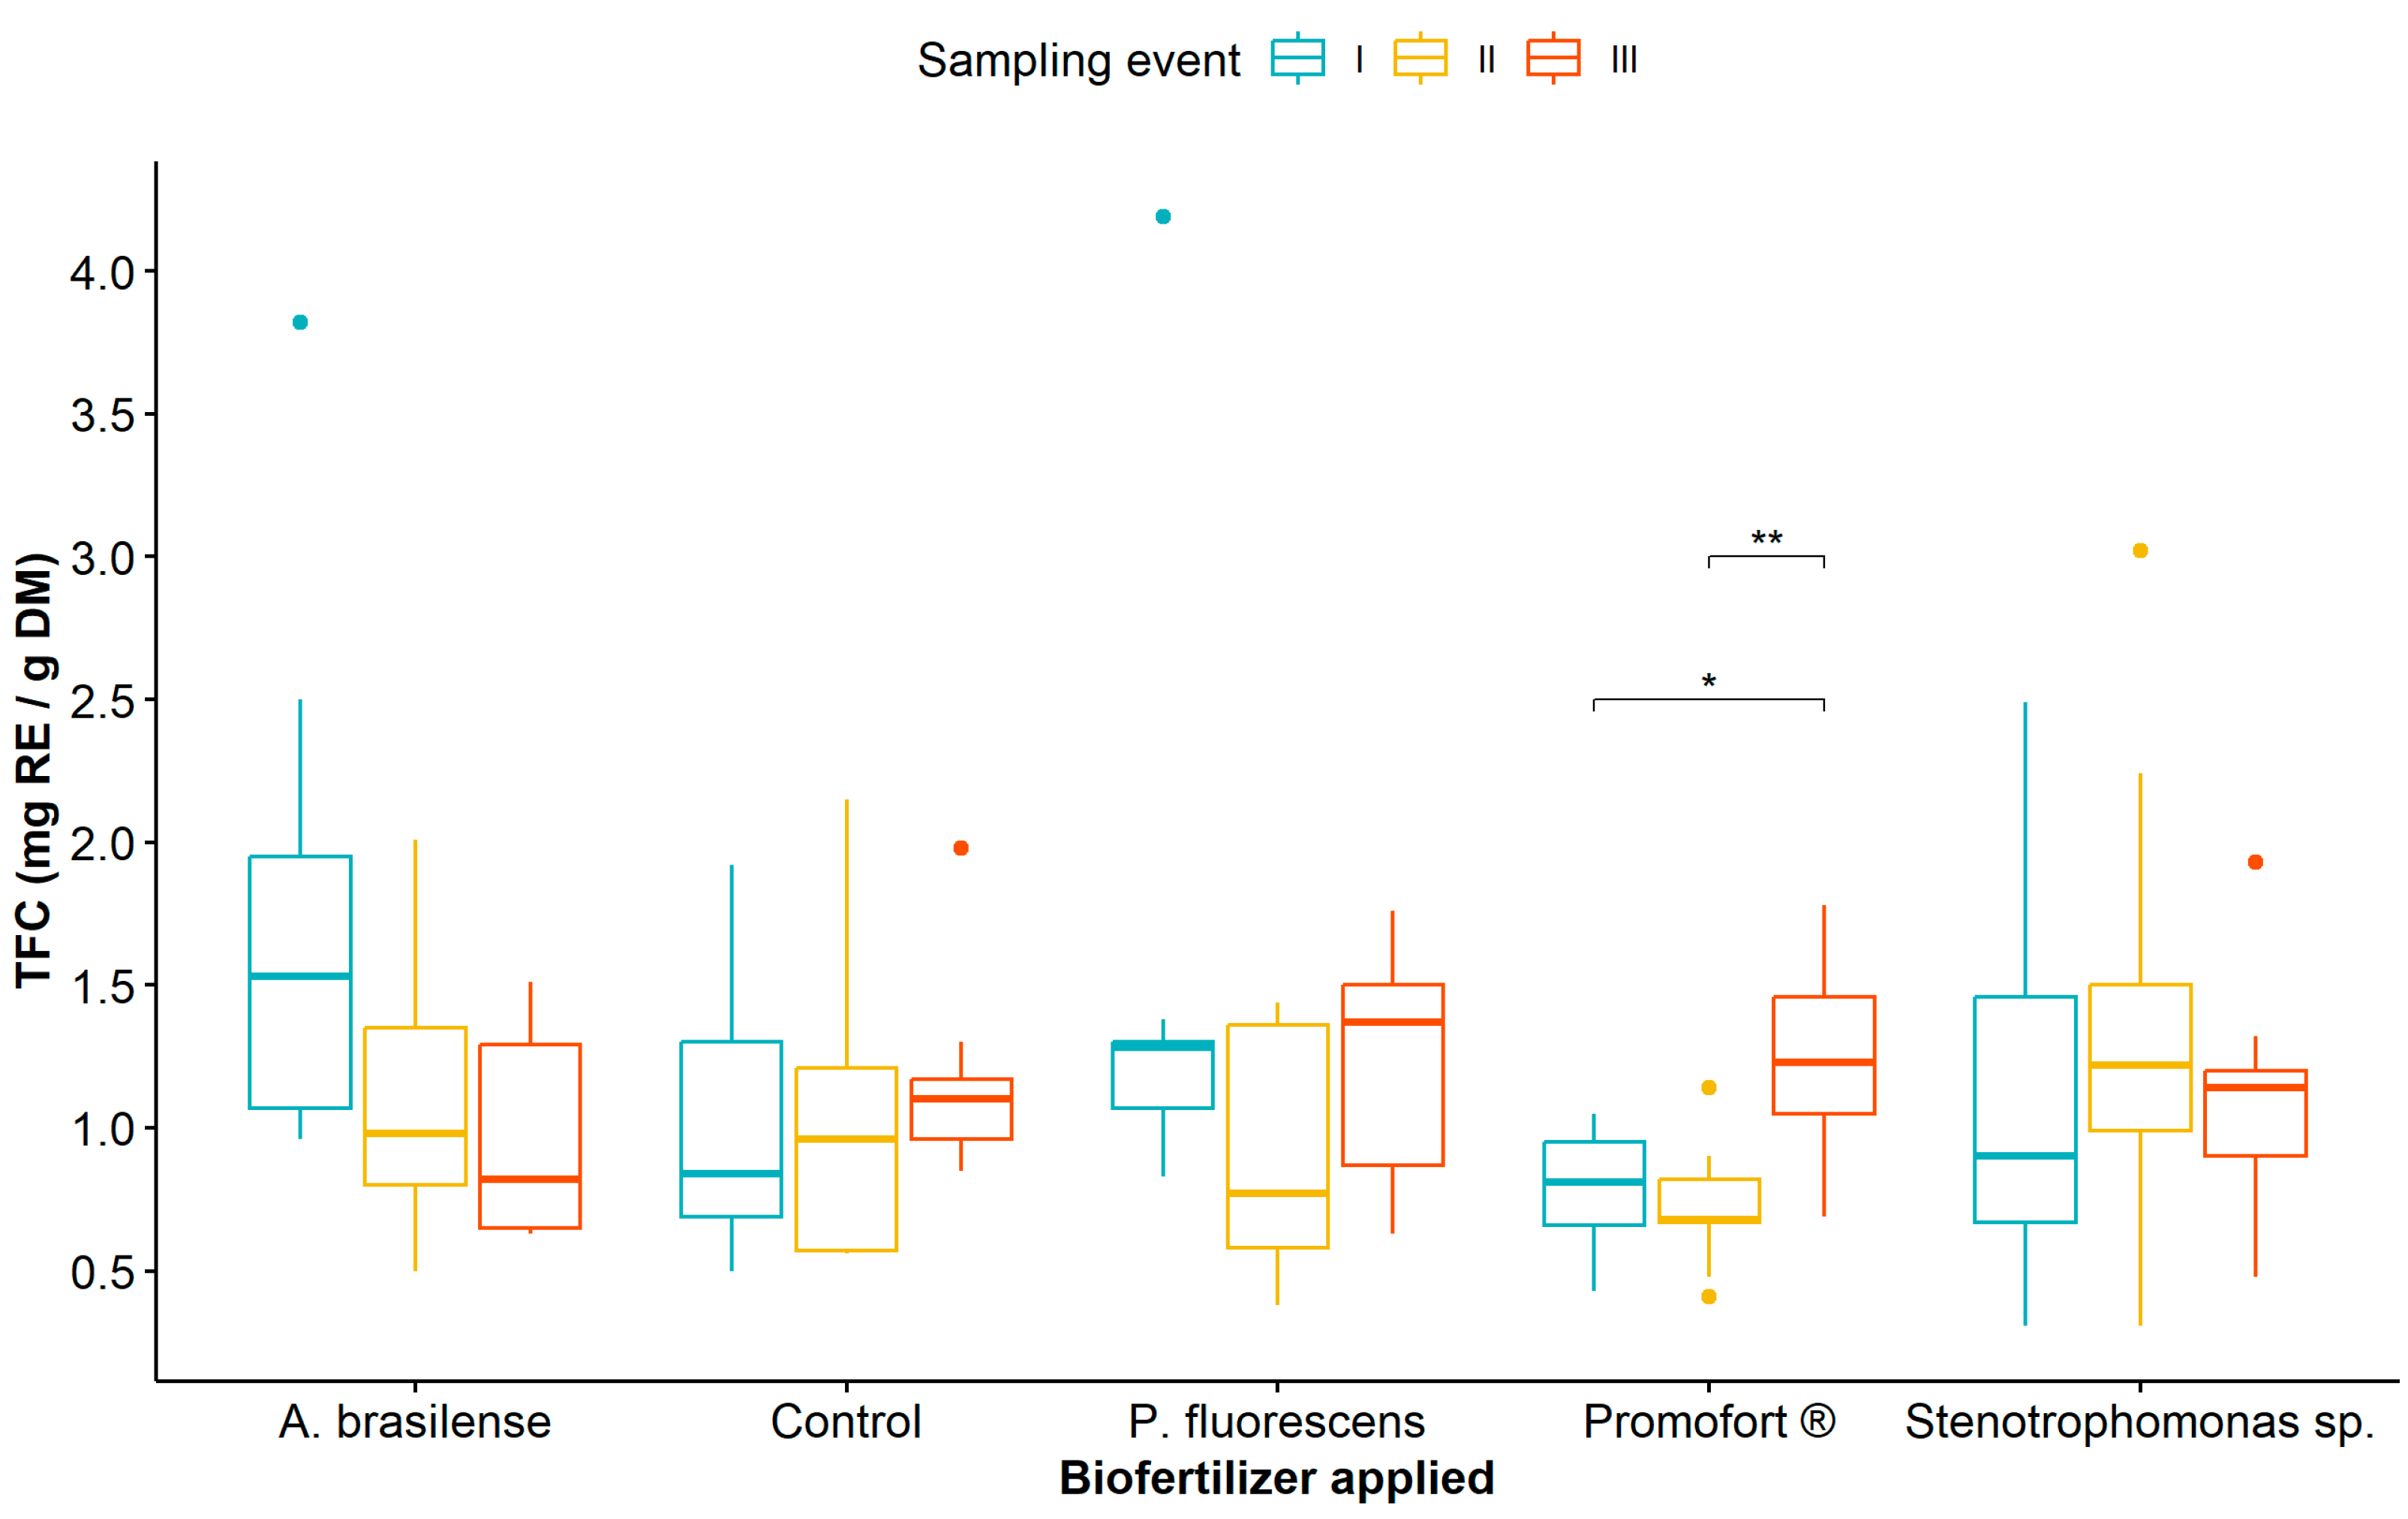
3.1. Analysis of Phenolic Compound Content

The average TPC for plants fertilized with DAP seven months after transplanting (sampling event III) was 7.06 ± 2.48 (mg GAE/g DM), with values of 5.98 ± 1.93 (mg GAE/g DM) for plants biofertilized with P. fluorescens and 8.57 ± 1.01 (mg GAE/g DM) for plants fertilized with Stenotrophomonas sp. The rmANOVA revealed no statistically significant effects from the interactions among the three factors of the sampling event, DAP and humus fertilization, and biological fertilization on the total phenolic content (TPC) (p = 0.89, Table S1). However, the analysis detected that the interaction between the biofertilizer and time factors, as well as the DAP and humus fertilization factor and the time factor, have a significant effect on TPC in Guadua angustifolia leaves (p = 6.9 × 10⁻³, p = 9.6 × 10⁻³, and p = 1.8 × 10⁻¹⁵, respectively, Table S1), despite the assumption of Mauchly’s sphericity with its respective corrections for the interaction of biofertilizers and time not being confirmed (p < 0.05) (Table S1).
Regarding the effect of biological fertilization and sampling event, the mean comparison analysis showed that TPC was significantly higher at sampling event III compared to sampling events I and II in all plants treated with biological fertilizers, unlike the control plants where no differences were observed between sampling events (Figure 1, Table S4). Likewise, when comparing TPC in treatments with biological fertilizers, the highest values were recorded in plants fertilized with Promofort® (Figure 1).
Regarding the time factor, statistically significant differences were found in TPC at sampling event III compared to sampling events I and II (Table S3), with the highest values observed at time III (Figure 2) (12 mg GAE/g DM).
When considering the application of humus and DAP to Guadua angustifolia plants, the mean comparison test showed significant differences in TPC between the control plants and the plants fertilized with DAP when compared to those fertilized with humus (Table S2), with the latter being significantly lower (Figure 3).
On the other hand, the highest value for TFC was found seven months after transplanting (sampling event III) in plants treated with Promofort® with a 1.26 ± 0.34 (mg GAE/g DM), while the lowest value was obtained in plants biofertilized with A. brasilense with a value of 0.98 ± 0.36 (mg GAE/g DM). The rmANOVA assessing the effect of sampling event, fertilization with DAP and humus, and biological fertilization on TFC showed no statistically significant interaction between these factors (p = 0.78, Table S5). However, the analysis detected that fertilization with DAP and humus, as well as with biological fertilization, are factors that interact significantly with the sampling event when evaluating the TFC content in G. angustifolia (p = 0.04 for both factors interactions, Table S5), while the factor of fertilization with DAP or humus may have a statistically marginal effect on the total flavonoid content (p = 0.06, Table S5), which was also seen between the humus treatment and control (p = 0.07, Table S6).
Regarding the effect of biofertilizer application and sampling event, the mean comparison analysis indicated that TFC was only statistically different at sampling event III, where the highest values were observed in plants treated with Promofort® (Figure 4, Table S8).
Finally, when considering the interaction between the application of humus or DAP and the sampling events on TFC, the mean comparison test indicated that only humus fertilization significantly influenced TFC in G. angustifolia at different sampling events, with lower values observed at sampling event II (Figure 5, Table S7).

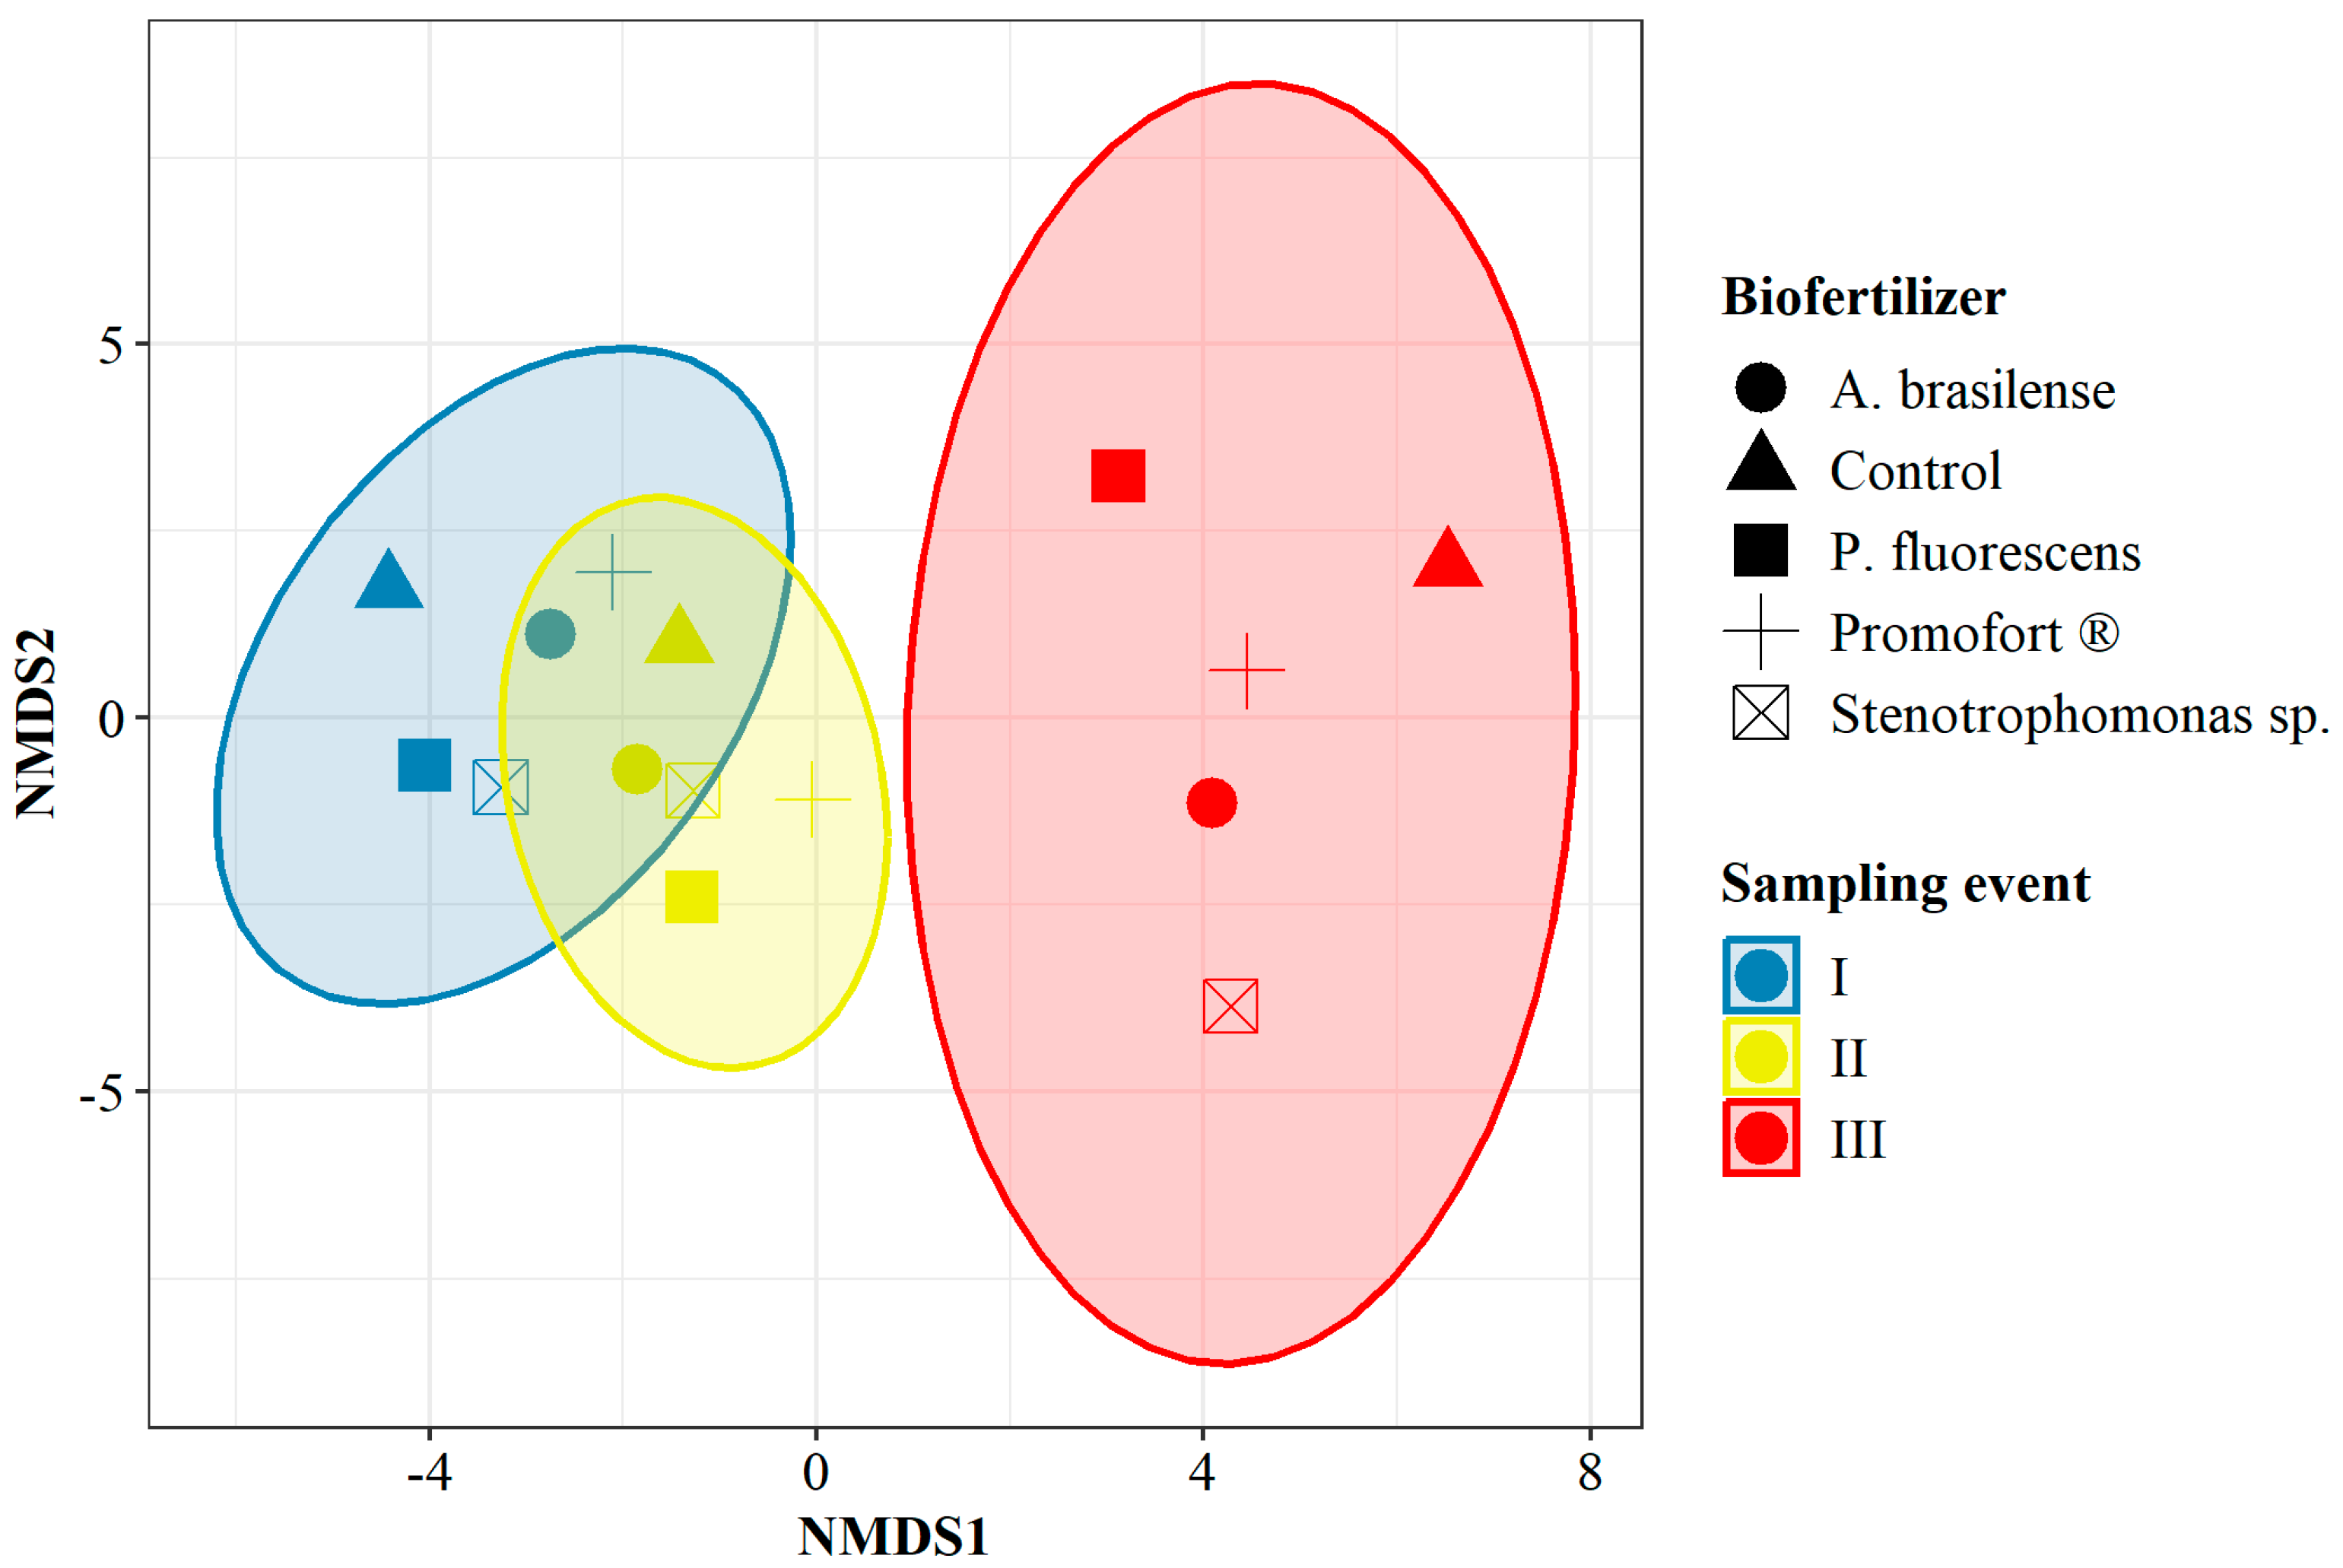
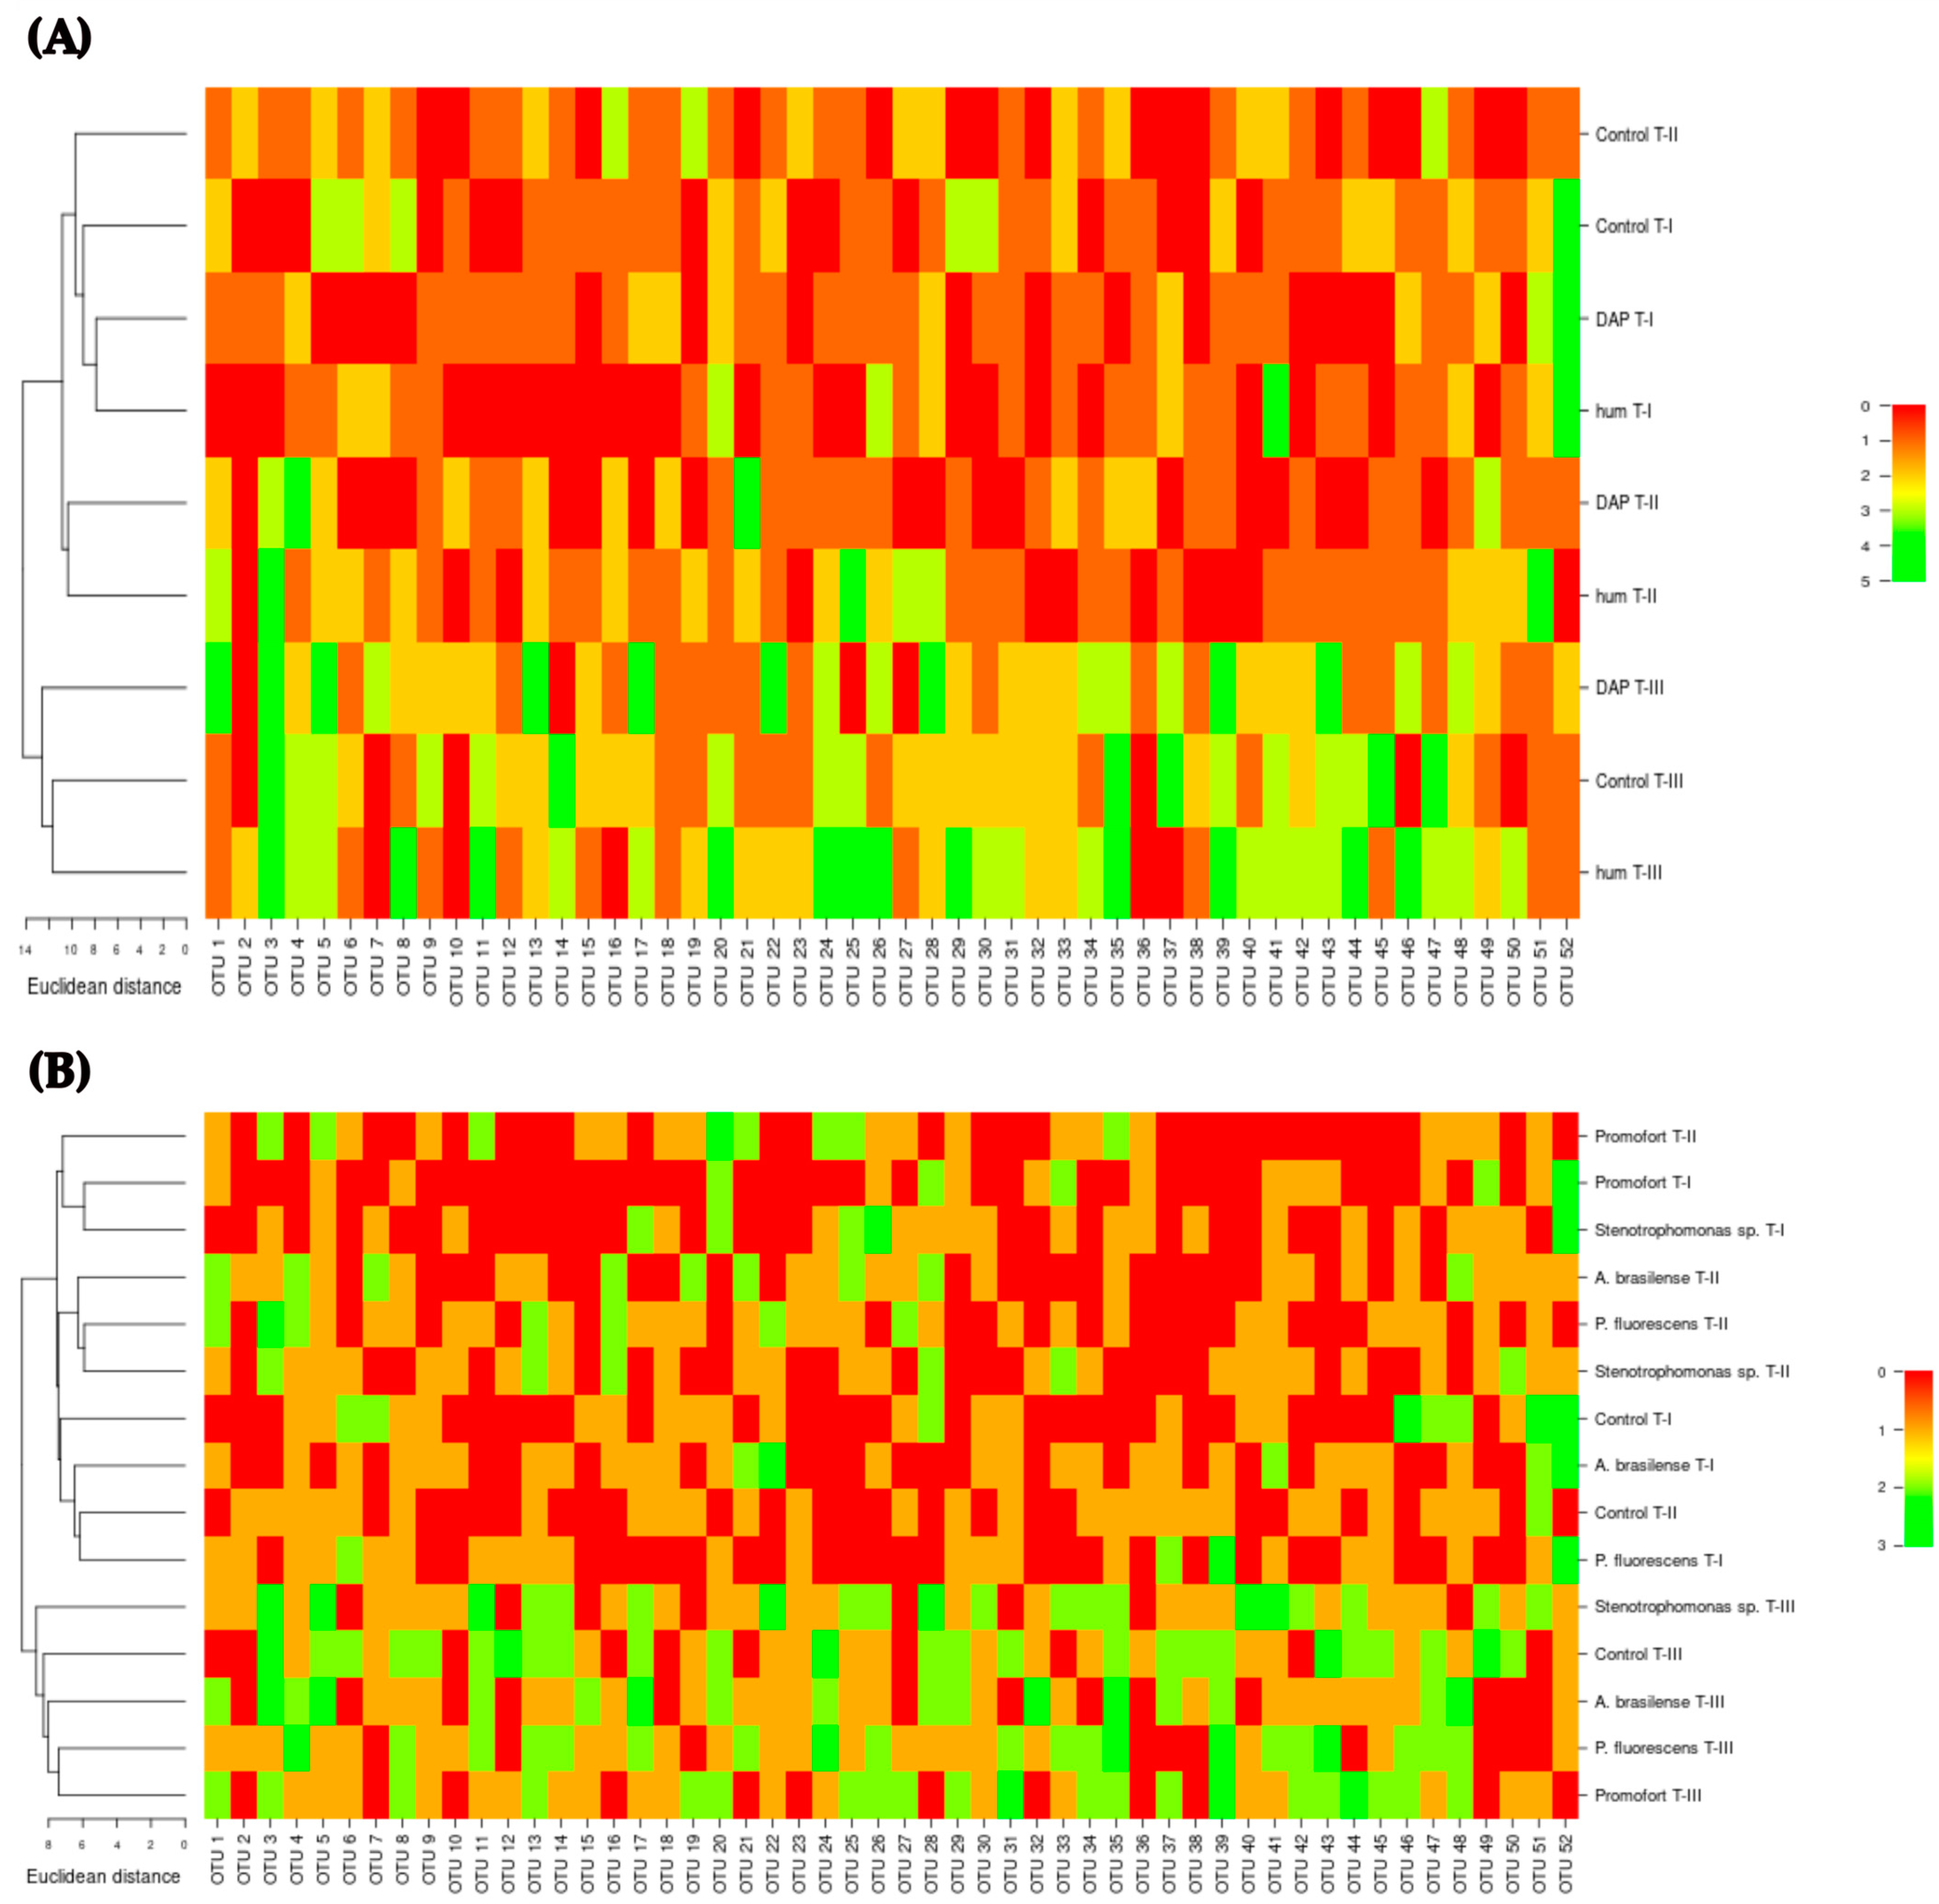
3.2. Analysis of the Bacterial Profile in G. angustifolia Roots

Non-metric multidimensional scaling (NMDS) analyses were conducted based on the abundance of each operational taxonomic unit (OTU) for the factor of time and for the interaction between DAP and humus fertilizers over time, as well as for the interaction between applied biofertilizers and time. In the first case, the analysis revealed that the abundance and composition of OTUs detected at each sampling event were different. There is greater similarity between times I and II than between either of them with time III (NMDS stress < 0.05, Figure S1). For the analysis of OTU abundance and composition in the interaction between fertilizers and sampling event, the NMDS results did not detect differences between humus and DAP for times I and II. However, it discriminated time III, where the similarity in the abundance and composition of OTUs was higher between humus and the control (NMDS stress < 0.05, Figure S2). Finally, the analysis of OTUs allowed for groupings by sampling event for all evaluated biofertilizers. Times I and II were more similar to each other than to time III, which was the only sampling event to be distinguished as an independent group (NMDS stress < 0.2, Figure 6). However, when considering the sampling event, the results do not generate dissimilar groupings by biofertilizer.
Subsequently, the bacterial profile associated with G. angustifolia roots was explored through heatmaps and hierarchical clustering of OTU composition and abundance for the interaction between humus and DAP fertilization over time (Figure 7A) and for the interaction between biofertilizer application and time (Figure 7B). These results corroborate the groupings and differences detected by the NMDS analyses (Figure S2, Figure 6).
Across various interactions considered for analysis, it becomes evident that the abundance and composition of OTUs exhibit variability. This variation is particularly notable within different combinations of factors and sampling events. In response to the various fertilization treatments applied (humus, DAP, or biological), the structure of the bacterial community in the roots of G. angustifolia undergoes shifts (Figure 7A,B). While certain OTUs may exhibit presence and recurrence within the treatments, their abundance within each treatment does not remain constant. Moreover, the composition of these OTUs shows fluctuations, with certain OTUs being either present or absent across different samplings or within treatments involving distinct types of fertilizers (Figure 7A,B). Consequently, this investigation underscores that the profile of the bacterial community in G. angustifolia roots varies both in terms of composition and abundance in response to the specific fertilization regimen applied, illustrating the dynamic nature of these microbial populations within the plant’s rhizosphere.

4. Discussion

Although no interaction was found between DAP or humus fertilization, biological fertilization, and sampling event for TPC or TFC, interactions of time with the other two factors were observed for the variables assessed.
Regarding the effect of biofertilizer application, the inoculated plants showed significant differences in TPC, with values increasing over time. These results are in line with what was described for Artemisia annua, where fertilization with a mixture of microbial inoculants significantly increased the total phenolic content [68]. Similarly, the application of Bacillus cereus to Brassica oleracea var. sabellica increased the content of phenolic compounds [69], and the inoculation of Pseudomonas fluorescens in Mentha piperita significantly favored the production of phenolic acids [70]. These microorganisms may be modulating the biosynthesis of secondary metabolites through various mechanisms following their inoculation, including changes in the expression of genes related to metabolite biosynthesis, enzymatic activity, or phytohormone levels [71].
TFC was significantly higher in the sampling event III, seven months after planting, in Guadua plants fertilized with Promofort®. This inoculant is known to contain indolic derivatives [48], including indole-3-acetic acid (IAA), whose application increases the expression of the genes CHS and CHI, which are part of the metabolic pathways involved in the production of chalcone, a precursor of various flavonoids. It also regulates the expression of the genes FLS and F3’H, which are involved in the synthesis of flavonoids such as quercetin and kaempferol [72], flavonoids that were previously described in the chemical profile of the genus Guadua, including G. angustifolia [8], which was also described to have a rich profile of C-glycoside flavonoids [8,33]. Additionally, it was demonstrated that exogenous auxins, such as those produced and released by microorganisms in different biofertilizers, are capable of inducing the synthesis of jasmonic acid [73,74], which in turn promotes the synthesis of phenolic compounds by increasing the expression of the PAL gene [75].
Regarding the effect of fertilization with humus and DAP, we observed that plants fertilized with humus had lower TPC and TFC values. Our results differ from those reported for Labisia pumila plants with the addition of organic fertilizer, which favored the production of total phenols and flavonoids in the plant [76], or the effects of fertilization with humic and fulvic acids in Achillea millefolium, where plants achieved a 59% higher content of total phenols and flavonoids [77]. The application of vermicompost was also reported to increase the total content of phenols and flavonoids in Withania somnifera leaves by 40% [78]. These contrasts with the literature could be related to the type and application method of the organic fertilizer. In our case, the application of humus increased the C/N ratio in the early sampling months, leading to immobilization of available nitrogen (N) in the soil, which can have two possible effects due to the low availability of this element. Firstly, it may affect the synthesis of phenolic compounds since N is the substrate for the biosynthesis of phenylalanine, a precursor of these compounds [79,80,81]. Secondly, it can alter the resource allocation patterns between primary and secondary metabolism, where the production of polyphenolic compounds decreases if growth increases [82,83]. This is similar to what was reported in eight-month-old greenhouse-propagated G. angustifolia plants, where the application of humus also resulted in a reduction in the content of phenolic compounds, which was accompanied by low foliar N levels [33].
Additionally, when reviewing the effects of organic fertilization with humus or conventional fertilization with DAP on the TPC and TFC in G. angustifolia leaves, the absence of significant differences with the control indicates that watering is enough to obtain the same TPC or TFC content. However, these results contrast with the findings reported by [33] for G. angustifolia, where the application of DAP resulted in a considerable increase in phenolic compound content. This is because the biomass of plants fertilized with DAP was greater compared to other treatments, allowing us to obtain a higher content of phenolic compounds per plant, which makes DAP fertilization the preferred option when the interest is the production of plant material with a high content of phenolic compounds [33].
Our study demonstrated that fertilization induces changes in the abundance and composition of bacterial OTUs present in the roots of plants collected at seven months after planting. The effect of fertilizers can be specific to certain bacterial groups [84,85]. The type of fertilizer, whether organic or conventional, can favor the abundance of particular groups of microorganisms while affecting the abundance of others [86], as observed in our results. In the case of humus fertilization, the occurrence of bacterial OTUs increased compared to treatments fertilized with DAP. During the evaluation of the compatibility of the biofertilizers used in this study with the two fertilizers (DAP and humus), under in vitro conditions, humus favored the increase in bacterial populations in all cases (unpublished data).
On the other hand, the changes in the number of occurrences found for the inoculants Promofort® and P. fluorescens seven months after planting can be attributed in both cases to the use of bacterial consortia that increase the available forms of nutrients such as P, N, and K in soil [33]. In this regard, the availability of nutrients in the soil can promote root growth and consequently modify rhizodeposition in the soil, which was widely described as a determinant of root-associated microorganism assemblages that can significantly affect microbial diversity, as previously described for other biofertilizers [87,88].
Seven months after planting, an increase in the variability of the bacterial profiles of G. angustifolia roots fertilized with different products was observed. This is consistent with previous reports, such as the finding that in Arabidopsis, time explained a greater variation in root-associated microbial communities [89]. It was also reported that bacterial communities associated with plant rhizospheres can change over the course of a season, a behavior related to the dynamics of metabolite profiles in roots and nutrient fluxes between soil and roots [90,91].
In this study, when analyzing the dynamics of TPC and TFC under the application of fertilizers (humus, DAP, or biological) in relation to the response of the bacterial community, the general pattern was similar to what was described by other authors. This pattern showed a rise in metabolite content as well as an increase in the abundance and presence of bacterial OTUs over time. Although the combined application of fertilizers and microbial inoculants does not affect the total content of phenolic compounds, these combinations do have an effect on the abundance of specific compounds, such as cinnamic acid derivatives and glycosylated flavones [33].

5. Conclusions

This study demonstrated that fertilization with humus and DAP, along with the application of biological fertilizers, do not collectively influence the content of phenolic compounds in Guadua angustifolia leaves as the plant grows. However, when these factors are considered individually or in dual combinations, they have a direct effect on the content of phenolic compounds. We concluded that seven months after planting, plants fertilized with DAP had a higher content of phenolic compounds. Furthermore, the application of biofertilizers was a determining factor in increasing the total phenolic content in the plant; in particular, the application of Promofort®, whose production of indolic derivatives can promote total flavonoid content. Finally, the composition and abundance of the bacterial OTUs in the roots increased in response to time and was not dependent of fertilizer application.
In this regard, for subsequent evaluations of the effects of conventional and organic fertilization, as well as biological fertilization, on metabolites of interest, we suggest assessing the chemical composition of these metabolites, understood in terms of their content and profile, to differentially determine the effect of the factors considered on specific compounds. Another aspect to consider is the identification of rhizospheric bacterial groups associated with G. angustifolia to enhance current knowledge of their association and relationship with secondary metabolites of interest produced by this plant species.

Supplementary Materials

The following supporting information can be downloaded at: https://www.mdpi.com/article/10.3390/agronomy13112782/s1, Table S1: Three-way repeated measures ANOVA on TPC; Table S2: Comparison humus-DAP on TPC; Table S3: Comparison Time on TPC; Table S4: Comparison interaction Inoculant-Time on TPC; Table S5: Three-way repeated measures ANOVA on TFC; Table S6: Comparison humus-DAP on TFC; Table S7: Comparison interaction humus and DAP-Time on TFC; Table S8: Comparison interaction Inoculant-Time on TFC; Figure S1: NMDS of sampling events; Figure S2: NMDS of interaction humus-DAP-Time.

Author Contributions

Conceptualization, J.J.S.-M. and L.A.D.-A.; investigation, H.S.L.-P., D.A.V.-R., S.A.D.-G. and L.A.D.-A.; data curation, J.J.S.-M., H.S.L.-P., D.A.V.-R. and S.A.D.-G.; formal analysis, J.J.S.-M. and L.A.D.-A.; writing—original draft, J.J.S.-M., H.S.L.-P., S.A.D.-G. and L.A.D.-A.; writing—review and editing, J.J.S.-M., H.S.L.-P. and L.A.D.-A. Resources, L.A.D.-A.; funding acquisition, L.A.D.-A. All authors have read and agreed to the published version of the manuscript.

Funding

This research was conducted with the financial support of: Pontificia Universidad Javeriana, Ministerio de Ciencia, Tecnología e Innovación, Ministerio de Educación Nacional, Ministerio de Industria, Comercio y Turismo e ICETEX, 2a Convocatoria Ecosistema científico—Colombia Científica 792-2017, Programa “Generación de alternativas terapéuticas en cáncer a partir de plantas a través de procesos de investigación y desarrollo traslacional, articulados en sistemas de valor sostenibles ambiental y económicamente” (Contrat no. FP44842-221-2018). Convocatoria del Fondo de Ciencia, Tecnología e Innovación del Sistema General de Regalías, en el marco del Programa de Becas de Excelencia Doctoral del Bicentenario, definido en el artículo 45 de la ley 1942 de 2018, Bogotá, Colombia.

Data Availability Statement

The data presented in this study are available within the article or supplementary material.

Acknowledgments

We extend our gratitude to the Ministerio de Ambiente y Desarrollo Sostenible for granting permission to use genetic resources and derived products (Contract 281/2019; Resolution 2167/2019). Additionally, we would like to acknowledge Geoambiente S.A.S. for their support.

Conflicts of Interest

The authors declare no conflict of interest.

References

  1. Clark, L.G.; Londoño, X.; Ruiz-Sanchez, E. Bamboo Taxonomy and Habitat. In Bamboo; Liese, W., Köhl, M., Eds.; Springer International Publishing: Cham, Switzerland, 2015; Volume 10, pp. 1–30. [Google Scholar] [CrossRef]
  2. Judziewicz, E.J.; Clark, L.G.; Londoño, X. American Bamboos; Smithsonian Institution Press: Washington, DC, USA, 1999. [Google Scholar]
  3. Londoño, X. El bambú en Colombia. Biotecnol. Veg. 2011, 11, 143–154. [Google Scholar]
  4. Long, T.T.; Yanxia, L.; Jayaraman, D. Global Priority Species of Economically Important Bamboo; INBAR Technical Report no. 44; International Bamboo and Rattan Organization (INBAR): Beijing, China, 2022; Available online: https://www.inbar.int/resources/inbar_publications/global-priority-species-economically-important-bamboo (accessed on 15 September 2023).
  5. Reyes-Agüero, J.A.; Cruz-Armendáriz, N.M.; Ruiz-Sanchez, E. Servicios ecosistémicos de las especies nativas e introducidas de bambú en la Huasteca Potosina, México: Usos del bambú. Acta Bot. Mex. 2023, 130, e2132. [Google Scholar] [CrossRef]
  6. Akinlabi, E.T.; Anane-Fenin, K.; Akwada, D.R. Bamboo; Springer International Publishing: Cham, Switzerland, 2017. [Google Scholar] [CrossRef]
  7. Durango, C.; Gallardo, A.; Contreras, A. Estudios para el aprovechamiento potencial de hojas de Guadua angustifolia Kunth (Poaceae), para el sector cosmético. Rev. Cuba. Farm. 2015, 49, 535–542. [Google Scholar]
  8. Chitiva, L.C.; Lozano-Puentes, H.S.; Londoño, X.; Leão, T.F.; Cala, M.P.; Ruiz-Sanchez, E.; Díaz-Ariza, L.A.; Prieto-Rodríguez, J.A.; Castro-Gamboa, I.; Costa, G.M. Untargeted metabolomics approach and molecular networking analysis reveal changes in chemical composition under the influence of altitudinal variation in bamboo species. Front. Mol. Biosci. 2023, 10, 1192088. [Google Scholar] [CrossRef] [PubMed]
  9. Pang, Z.; Chen, J.; Wang, T.; Gao, C.; Li, Z.; Guo, L.; Xu, J.; Cheng, Y. Linking Plant Secondary Metabolites and Plant Microbiomes: A Review. Front. Plant Sci. 2021, 12, 621276. [Google Scholar] [CrossRef]
  10. Narayanan, Z.; Glick, B.R. Secondary Metabolites Produced by Plant Growth-Promoting Bacterial Endophytes. Microorganisms 2022, 10, 2008. [Google Scholar] [CrossRef]
  11. Ghitti, E.; Rolli, E.; Crotti, E.; Borin, S. Flavonoids Are Intra- and Inter-Kingdom Modulator Signals. Microorganisms 2022, 10, 2479. [Google Scholar] [CrossRef]
  12. Naguib, A.E.-M.M.; El-Baz, F.K.; Salama, Z.A.; Hanaa, H.A.E.B.; Ali, H.F.; Gaafar, A.A. Enhancement of phenolics, flavonoids and glucosinolates of Broccoli (Brassica oleracea var. Italica) as antioxidants in response to organic and bio-organic fertilizers. J. Saudi Soc. Agric. Sci. 2012, 11, 135–142. [Google Scholar] [CrossRef]
  13. Verma, N.; Shukla, S. Impact of various factors responsible for fluctuation in plant secondary metabolites. J. Appl. Res. Med. Aromat. Plants 2015, 2, 105–113. [Google Scholar] [CrossRef]
  14. Barroso, M.R.; Martins, N.; Barros, L.; Antonio, A.L.; Rodrigues, M.; Sousa, M.J.; Santos-Buelga, C.; Ferreira, I.C. Assessment of the nitrogen fertilization effect on bioactive compounds of frozen fresh and dried samples of Stevia rebaudiana Bertoni. Food Chem. 2018, 243, 208–213. [Google Scholar] [CrossRef] [PubMed]
  15. Amarowicz, R.; Cwalina-Ambroziak, B.; Janiak, M.A.; Bogucka, B. Effect of N Fertilization on the Content of Phenolic Compounds in Jerusalem Artichoke (Helianthus tuberosus L.) Tubers and Their Antioxidant Capacity. Agronomy 2020, 10, 1215. [Google Scholar] [CrossRef]
  16. Wei, X.; Chen, J.; Gao, B.; Wang, Z. Role of controlled and slow release fertilizers in fruit crop nutrition. In Fruit Crops; Srivastava, A.K., Hu, C., Eds.; Elsevier: Amsterdam, The Netherlands, 2020; pp. 555–566. [Google Scholar] [CrossRef]
  17. Ramaiya, S.D.; Lee, H.H.; Xiao, Y.J.; Shahbani, N.S.; Zakaria, M.H.; Bujang, J.S.; Sarker, U. Organic cultivation practices enhanced antioxidant activities and secondary metabolites in giant granadilla (Passiflora quadrangularis L.). PLoS ONE 2021, 16, e0255059. [Google Scholar] [CrossRef] [PubMed]
  18. Sałata, A.; Nurzyńska-Wierdak, R.; Kalisz, A.; Kunicki, E.; Ibáñez-Asensio, S.; Moreno-Ramón, H. Effects of Organic Cropping on Phenolic Compounds and Antioxidant Capacity of Globe Artichoke Herbs. Agronomy 2022, 12, 192. [Google Scholar] [CrossRef]
  19. Colipano, J.M.; Cagasan, U.A. A review on the impact of organic, conventional and nano fertilizer application in crop production. Eurasian J. Agric. Res. 2022, 6, 101–109. [Google Scholar]
  20. Alizadeh, A.; Khoshkhui, M.; Javidnia, K.; Firuzi, O.R.; Tafazoli, E.; Khalighi, A. Effects of fertilizer on yield, essential oil composition, total phenolic content and antioxidant activity in Satureja hortensis L. (Lamiaceae) cultivated in Iran. J. Med. Plants Res. 2010, 4, 33–40. [Google Scholar] [CrossRef]
  21. Moradzadeh, S.; Moghaddam, S.S.; Rahimi, A.; Pourakbar, L.; Sayyed, R.Z. Combined bio-chemical fertilizers ameliorate agro-biochemical attributes of black cumin (Nigella sativa L.). Sci. Rep. 2021, 11, 11399. [Google Scholar] [CrossRef]
  22. Cevheri, C.I.; Sakin, E.; Ramazanoglu, E. Effects of different fertilizers on some soil enzymes activity and chlorophyll contents of two cotton (G. hirsutum L.) varieties grown in a saline and non-saline soil. J. Plant Nutr. 2022, 45, 95–106. [Google Scholar] [CrossRef]
  23. Chuma, G.B.; Mulalisi, B.; Mondo, J.M.; Ndeko, A.B.; Bora, F.S.; Bagula, E.M.; Mushagalusa, G.N.; Civava, R. Di-ammonium phosphate (DAP) and plant density improve grain yield, nodulation capacity, and profitability of peas (Pisum sativum L.) on ferralsols in eastern D.R. Congo. CABI Agric. Biosci. 2022, 3, 65. [Google Scholar] [CrossRef]
  24. Zhang, J.; Bei, S.; Li, B.; Zhang, J.; Christie, P.; Li, X. Organic fertilizer, but not heavy liming, enhances banana biomass, increases soil organic carbon and modifies soil microbiota. Appl. Soil Ecol. 2018, 136, 67–79. [Google Scholar] [CrossRef]
  25. Zhaoxiang, W.; Huihu, L.; Qiaoli, L.; Changyan, Y.; Faxin, Y. Application of bio-organic fertilizer, not biochar, in degraded red soil improves soil nutrients and plant growth. Rhizosphere 2020, 16, 100264. [Google Scholar] [CrossRef]
  26. Kumari, M.; Swarupa, P.; Kesari, K.K.; Kumar, A. Microbial Inoculants as Plant Biostimulants: A Review on Risk Status. Life 2023, 13, 12. [Google Scholar] [CrossRef] [PubMed]
  27. O’Callaghan, M.; Ballard, R.A.; Wright, D. Soil microbial inoculants for sustainable agriculture: Limitations and opportunities. Soil Use Manag. 2022, 38, 1340–1369. [Google Scholar] [CrossRef]
  28. Li, Y.; Li, Q.; Guan, G.; Chen, S. Phosphate solubilizing bacteria stimulate wheat rhizosphere and endosphere biological nitrogen fixation by improving phosphorus content. PeerJ 2020, 8, e9062. [Google Scholar] [CrossRef] [PubMed]
  29. Wang, Y.; Yan, X.; Su, M.; Li, J.; Man, T.; Wang, S.; Li, C.; Gao, S.; Zhang, R.; Zhang, M.; et al. Isolation of potassium solubilizing bacteria in soil and preparation of liquid bacteria fertilizer from food wastewater. Biochem. Eng. J. 2022, 181, 108378. [Google Scholar] [CrossRef]
  30. Ghaderimokri, L.; Rezaei-Chiyaneh, E.; Ghiyasi, M.; Gheshlaghi, M.; Battaglia, M.L.; Siddique, K.H.M. Application of humic acid and biofertilizers changes oil and phenolic compounds of fennel and fenugreek in intercropping systems. Sci. Rep. 2022, 12, 1–14. [Google Scholar] [CrossRef]
  31. Khalid, M.; Hassani, D.; Bilal, M.; Asad, F.; Huang, D. Influence of bio-fertilizer containing beneficial fungi and rhizospheric bacteria on health promoting compounds and antioxidant activity of Spinacia oleracea L. Bot. Stud. 2017, 58, 35. [Google Scholar] [CrossRef]
  32. Dasgan, H.Y.; Aldiyab, A.; Elgudayem, F.; Ikiz, B.; Gruda, N.S. Effect of biofertilizers on leaf yield, nitrate amount, mineral content and antioxidants of basil (Ocimum basilicum L.) in a floating culture. Sci. Rep. 2022, 12, 20917. [Google Scholar] [CrossRef]
  33. Villamarin-Raad, D.A.; Lozano-Puentes, H.S.; Chitiva, L.C.; Costa, G.M.; Díaz-Gallo, S.A.; Díaz-Ariza, L.A. Changes in Phenolic Profile and Total Phenol and Total Flavonoid Contents of Guadua angustifolia Kunth Plants under Organic and Conventional Fertilization. ACS Omega 2023, 8, 41223–41231. [Google Scholar] [CrossRef]
  34. Bouderias, S.; Teszlák, P.; Jakab, G.; Kőrösi, L. Age- and season-dependent pattern of flavonol glycosides in Cabernet Sauvignon grapevine leaves. Sci. Rep. 2020, 10, 14241. [Google Scholar] [CrossRef]
  35. Saffaryazdi, A.; Ganjeali, A.; Farhoosh, R.; Cheniany, M. Variation in phenolic compounds, α-linolenic acid and linoleic acid contents and antioxidant activity of purslane (Portulaca oleracea L.) during phenological growth stages. Physiol. Mol. Biol. Plants 2020, 26, 1519–1529. [Google Scholar] [CrossRef]
  36. Lavola, A.; Maukonen, M.; Julkunen-Tiitto, R. Variability in the composition of phenolic compounds in winter-dormant Salix pyrolifolia in relation to plant part and age. Phytochemistry 2018, 153, 102–110. [Google Scholar] [CrossRef] [PubMed]
  37. Yu, Y.; Kleuter, M.; Dinani, S.T.; Trindade, L.M.; van der Goot, A.J. The role of plant age and leaf position on protein extraction and phenolic compounds removal from tomato (Solanum lycopersicum) leaves using food-grade solvents. Food Chem. 2023, 406, 135072. [Google Scholar] [CrossRef] [PubMed]
  38. Qudsieh, H.Y.M.; Yusof, S.; Osman, A.; Rahman, R.A. Effect of Maturity on Chlorophyll, Tannin, Color, and Polyphenol Oxidase (PPO) Activity of Sugarcane Juice (Saccharum officinarum Var. Yellow Cane). J. Agric. Food Chem. 2002, 50, 1615–1618. [Google Scholar] [CrossRef] [PubMed]
  39. Yu, X.; Bals, O.; Grimi, N.; Vorobiev, E. A new way for the oil plant biomass valorization: Polyphenols and proteins extraction from rapeseed stems and leaves assisted by pulsed electric fields. Ind. Crop. Prod. 2015, 74, 309–318. [Google Scholar] [CrossRef]
  40. O’brien, F.J.M.; Dumont, M.G.; Webb, J.S.; Poppy, G.M. Rhizosphere Bacterial Communities Differ According to Fertilizer Regimes and Cabbage (Brassica oleracea var. capitata L.) Harvest Time, but Not Aphid Herbivory. Front. Microbiol. 2018, 9, 1620. [Google Scholar] [CrossRef] [PubMed]
  41. Dang, P.; Li, C.; Lu, C.; Zhang, M.; Huang, T.; Wan, C.; Wang, H.; Chen, Y.; Qin, X.; Liao, Y.; et al. Effect of fertilizer management on the soil bacterial community in agroecosystems across the globe. Agric. Ecosyst. Environ. 2022, 326, 107795. [Google Scholar] [CrossRef]
  42. Hartmann, M.; Frey, B.; Mayer, J.; Mäder, P.; Widmer, F. Distinct soil microbial diversity under long-term organic and conventional farming. ISME J. 2014, 9, 1177–1194. [Google Scholar] [CrossRef]
  43. Xu, F.; Sun, G.; Du, W.; Ai, F.; Yin, Y.; Guo, H. Impacts of Chemical and Organic Fertilizers on the Bacterial Communities, Sulfonamides and Sulfonamide Resistance Genes in Paddy Soil Under Rice-Wheat Rotation. Bull. Environ. Contam. Toxicol. 2022, 110, 20. [Google Scholar] [CrossRef] [PubMed]
  44. Pershina, E.; Valkonen, J.; Kurki, P.; Ivanova, E.; Chirak, E.; Korvigo, I.; Provorov, N.; Andronov, E. Comparative Analysis of Prokaryotic Communities Associated with Organic and Conventional Farming Systems. PLoS ONE 2015, 10, e0145072. [Google Scholar] [CrossRef]
  45. Herzog, S.; Wemheuer, F.; Wemheuer, B.; Daniel, R. Effects of Fertilization and Sampling Time on Composition and Diversity of Entire and Active Bacterial Communities in German Grassland Soils. PLoS ONE 2015, 10, e0145575. [Google Scholar] [CrossRef] [PubMed]
  46. Zhao, J.; Ni, T.; Li, Y.; Xiong, W.; Ran, W.; Shen, B.; Shen, Q.; Zhang, R. Responses of Bacterial Communities in Arable Soils in a Rice-Wheat Cropping System to Different Fertilizer Regimes and Sampling Times. PLoS ONE 2014, 9, e85301. [Google Scholar] [CrossRef]
  47. Zhong, W.; Gu, T.; Wang, W.; Zhang, B.; Lin, X.; Huang, Q.; Shen, W. The effects of mineral fertilizer and organic manure on soil microbial community and diversity. Plant Soil 2009, 326, 511–522. [Google Scholar] [CrossRef]
  48. Díaz Ariza, L.A. Bioinoculant Composition. U.S. Patent 11,001,536 B2, 11 May 2021. [Google Scholar]
  49. Lozano-Puentes, H.S.; Sánchez-Matiz, J.J.; Ruiz-Sanchez, E.; Costa, G.M.; Díaz, L.A. Guadua angustifolia Kunth Leaves as a Source for Bioactive Phenolic Compounds: Optimization of Ultrasound-Assisted Extraction Using Response Surface Methodology and Antioxidant Activities. SSRN 2023. submitted. [Google Scholar]
  50. Lamuela-Raventós, R.M. Folin-Ciocalteu method for the measurement of total phenolic content and antioxidant capacity. In Measurement of Antioxidant Activity & Capacity: Recent Trends and Applications; John Wiley & Sons, Ltd.: Chichester, UK, 2017; pp. 107–115. [Google Scholar] [CrossRef]
  51. Chandra, S.; Khan, S.; Avula, B.; Lata, H.; Yang, M.H.; ElSohly, M.A.; Khan, I.A. Assessment of Total Phenolic and Flavonoid Content, Antioxidant Properties, and Yield of Aeroponically and Conventionally Grown Leafy Vegetables and Fruit Crops: A Comparative Study. Evid.-Based Complement. Altern. Med. 2014, 2014, 253875. [Google Scholar] [CrossRef]
  52. Doyle, J.J.; Doyle, J.L. Isolation of plant DNA from fresh tissue. Focus 1990, 12, 13–15. [Google Scholar]
  53. Heuer, H.; Krsek, M.; Baker, P.; Smalla, K.; Wellington, E.M. Analysis of actinomycete communities by specific amplification of genes encoding 16S rRNA and gel-electrophoretic separation in denaturing gradients. Appl. Environ. Microbiol. 1997, 63, 3233–3241. [Google Scholar] [CrossRef] [PubMed]
  54. Valášková, V.; Baldrian, P. Denaturing gradient gel electrophoresis as a fingerprinting method for the analysis of soil microbial communities. Plant Soil Environ. 2009, 55, 413–423. [Google Scholar] [CrossRef]
  55. Myers, R.M.; Lumelsky, N.; Lerman, L.S.; Maniatis, T. Detection of single base substitutions in total genomic DNA. Nature 1985, 313, 495–498. [Google Scholar] [CrossRef]
  56. Tukey, J.W. Comparing Individual Means in the Analysis of Variance. Biometrics 1949, 5, 99–114. [Google Scholar] [CrossRef] [PubMed]
  57. Shapiro, S.S.; Wilk, M.B.; Chen, H.J. A Comparative Study of Various Tests for Normality. J. Am. Stat. Assoc. 1968, 63, 1343. [Google Scholar] [CrossRef]
  58. Conover, W.J.; Iman, R.L. Rank Transformations as a Bridge Between Parametric and Nonparametric Statistics. Am. Stat. 1981, 35, 124. [Google Scholar] [CrossRef]
  59. Greenhouse, S.W.; Geisser, S. On methods in the analysis of profile data. Psychometrika 1959, 24, 95–112. [Google Scholar] [CrossRef]
  60. Huynh, H.; Feldt, L.S. Estimation of the Box Correction for Degrees of Freedom from Sample Data in Randomized Block and Split-Plot Designs. J. Educ. Stat. 1976, 1, 69. [Google Scholar] [CrossRef]
  61. R Core Team. R: A Language and Environment for Statistical Computing; R Foundation for Statistical Computing: Vienna, Austria, 2023; Available online: https://www.R-project.org (accessed on 9 August 2023).
  62. Lawrence, M.A. Ez: Easy Analysis and Visualization of Factorial Experiments; R package v4.4-0; CRAN: Vienna, Austria, 2016; Available online: https://CRAN.R-project.org/package=ez (accessed on 9 August 2023).
  63. Kassambara, A. Rstatix: Pipe-Friendly Framework for Basic Statistical Tests; R package v0.7.2; CRAN: Vienna, Austria, 2023; Available online: https://CRAN.R-project.org/package=rstatix (accessed on 9 August 2023).
  64. Kassambara, A. Ggpubr: ‘ggplot2’ Based Publication Ready Plots; R package v0.6.0; CRAN: Vienna, Austria, 2023; Available online: https://CRAN.R-project.org/package=ggpubr (accessed on 9 August 2023).
  65. Oksanen, J.; Blanchet, F.G.; Kindt, R.; Legendre, P.; Minchin, P.R.; O’Hara, R.B.; Simpson, G.L.; Solymos, P.; Stevens, M.H.H.; Wagner, H. Package ‘vegan’. In Community Ecology Package, R package version 2.6-4; CRAN: Vienna, Austria, 2022; Available online: https://CRAN.R-project.org/package=vegan (accessed on 9 August 2023).
  66. Buttigieg, P.L.; Ramette, A. A guide to statistical analysis in microbial ecology: A community-focused, living review of multivariate data analyses. FEMS Microbiol. Ecol. 2014, 90, 543–550. [Google Scholar] [CrossRef] [PubMed]
  67. Weinstein, J.N.; Myers, T.G.; O’Connor, P.M.; Friend, S.H., Jr.; Fornace, A.J.; Kohn, K.W.; Fojo, T.; Bates, S.E.; Rubinstein, L.V.; Anderson, N.L.; et al. An Information-Intensive Approach to the Molecular Pharmacology of Cancer. Science 1997, 275, 343–349. [Google Scholar] [CrossRef]
  68. Gupta, R.; Singh, A.; Gupta, M.M.; Pandey, R. Cumulative role of bioinoculants on growth, antioxidant potential and artemisinin content in Artemisia annua L. under organic field conditions. World J. Microbiol. Biotechnol. 2016, 32, 167. [Google Scholar] [CrossRef] [PubMed]
  69. Helaly, A.A.; Mady, E.; Salem, E.A.; Randhir, T.O. Stimulatory effects of growth-promoting bacteria on growth, nutritional composition, and yield of kale plants. J. Plant Nutr. 2022, 45, 2465–2477. [Google Scholar] [CrossRef]
  70. Chiappero, J.; Cappellari, L.d.R.; Alderete, L.G.S.; Palermo, T.B.; Banchio, E. Plant growth promoting rhizobacteria improve the antioxidant status in Mentha piperita grown under drought stress leading to an enhancement of plant growth and total phenolic content. Ind. Crop. Prod. 2019, 139, 111553. [Google Scholar] [CrossRef]
  71. Wang, Z.; Xu, Z.; Chen, Z.; Kowalchuk, G.A.; Fu, X.; Kuramae, E.E. Microbial inoculants modulate growth traits, nutrients acquisition and bioactive compounds accumulation of Cyclocarya paliurus (Batal.) Iljinskaja under degraded field condition. For. Ecol. Manag. 2021, 482, 118897. [Google Scholar] [CrossRef]
  72. Lewis, D.R.; Ramirez, M.V.; Miller, N.D.; Vallabhaneni, P.; Ray, W.K.; Helm, R.F.; Winkel, B.S.; Muday, G.K. Auxin and Ethylene Induce Flavonol Accumulation through Distinct Transcriptional Networks. Plant Physiol. 2011, 156, 144–164. [Google Scholar] [CrossRef]
  73. Luo, J.; Zhou, J.-J.; Zhang, J.-Z. Aux/IAA Gene Family in Plants: Molecular Structure, Regulation, and Function. Int. J. Mol. Sci. 2018, 19, 259. [Google Scholar] [CrossRef] [PubMed]
  74. Yang, J.; Duan, G.; Li, C.; Liu, L.; Han, G.; Zhang, Y.; Wang, C. The Crosstalks Between Jasmonic Acid and Other Plant Hormone Signaling Highlight the Involvement of Jasmonic Acid as a Core Component in Plant Response to Biotic and Abiotic Stresses. Front. Plant Sci. 2019, 10, 1349. [Google Scholar] [CrossRef] [PubMed]
  75. Sabbagh, E.; Sabbagh, S.K.; Panjehkeh, N.; Bolok-Yazdi, H.R. Jasmonic Acid Induced Systemic Resistance in Infected Cucumber by Pythium aphanidermatum. J. Agric. Sci. 2018, 24, 143–152. [Google Scholar] [CrossRef]
  76. Ibrahim, M.H.; Jaafar, H.Z.E.; Karimi, E.; Ghasemzadeh, A. Impact of Organic and Inorganic Fertilizers Application on the Phytochemical and Antioxidant Activity of Kacip Fatimah (Labisia pumila Benth). Molecules 2013, 18, 10973–10988. [Google Scholar] [CrossRef] [PubMed]
  77. Bayat, H.; Shafie, F.; Aminifard, M.H.; Daghighi, S. Comparative effects of humic and fulvic acids as biostimulants on growth, antioxidant activity and nutrient content of yarrow (Achillea millefolium L.). Sci. Hortic. 2021, 279, 109912. [Google Scholar] [CrossRef]
  78. Kaur, A.; Pati, P.K.; Ohri, P.; Kaur, A. Effects of Vermicompost and Vermicompost Leachate on the Biochemical and Physiological Response of Withania somnifera (L.) Dunal. J. Soil Sci. Plant Nutr. 2022, 22, 3228–3242. [Google Scholar] [CrossRef]
  79. Marlin, M.; Simarmata, M.; Salamah, U.; Nurcholis, W. Effect of nitrogen and potassium application on growth, total phenolic, flavonoid contents, and antioxidant activity of Eleutherine palmifolia. AIMS Agric. Food 2022, 7, 580–593. [Google Scholar] [CrossRef]
  80. Barzegar, T.; Mohammadi, S.; Ghahremani, Z. Effect of nitrogen and potassium fertilizer on growth, yield and chemical composition of sweet fennel. J. Plant Nutr. 2020, 43, 1189–1204. [Google Scholar] [CrossRef]
  81. Lillo, C.; Lea, U.S.; Ruoff, P. Nutrient depletion as a key factor for manipulating gene expression and product formation in different branches of the flavonoid pathway. Plant Cell Environ. 2008, 31, 587–601. [Google Scholar] [CrossRef]
  82. Deng, B.; Li, Y.; Lei, G.; Liu, G. Effects of nitrogen availability on mineral nutrient balance and flavonoid accumulation in Cyclocarya paliurus. Plant Physiol. Biochem. 2019, 135, 111–118. [Google Scholar] [CrossRef]
  83. Heimler, D.; Romani, A.; Ieri, F. Plant polyphenol content, soil fertilization and agricultural management: A review. Eur. Food Res. Technol. 2017, 243, 1107–1115. [Google Scholar] [CrossRef]
  84. Wu, Q.; Zhang, J.; Liu, X.; Chang, T.; Wang, Q.; Shaghaleh, H.; Hamoud, Y.A. Effects of biochar and vermicompost on microorganisms and enzymatic activities in greenhouse soil. Front. Environ. Sci. 2023, 10, 1060277. [Google Scholar] [CrossRef]
  85. Liu, M.; Wang, C.; Liu, X.; Lu, Y.; Wang, Y. Saline-alkali soil applied with vermicompost and humic acid fertilizer improved macroaggregate microstructure to enhance salt leaching and inhibit nitrogen losses. Appl. Soil Ecol. 2020, 156, 103705. [Google Scholar] [CrossRef]
  86. Wang, R.; Hou, T.; Sun, Q.; Ji, L.; Lei, J.; Zhang, J. Organic Fertilizers and Soil Conditioner Recover Chemical Fertilizer-Induced Changes in Soil Bacterial Community Diversity in Wine Grape Rhizosphere Soil. Pol. J. Environ. Stud. 2021, 30, 1853–1863. [Google Scholar] [CrossRef]
  87. Zainuddin, N.; Keni, M.F.; Ibrahim, S.A.S.; Masri, M.M.M. Effect of integrated biofertilizers with chemical fertilizers on the oil palm growth and soil microbial diversity. Biocatal. Agric. Biotechnol. 2022, 39, 102237. [Google Scholar] [CrossRef]
  88. Cornell, C.; Kokkoris, V.; Richards, A.; Horst, C.; Rosa, D.; Bennett, J.A.; Hart, M.M. Do Bioinoculants Affect Resident Microbial Communities? A Meta-Analysis. Front. Agron. 2021, 3, 753474. [Google Scholar] [CrossRef]
  89. Thiergart, T.; Durán, P.; Ellis, T.; Vannier, N.; Garrido-Oter, R.; Kemen, E.; Roux, F.; Alonso-Blanco, C.; Ågren, J.; Schulze-Lefert, P.; et al. Root microbiota assembly and adaptive differentiation among European Arabidopsis populations. Nat. Ecol. Evol. 2019, 4, 122–131. [Google Scholar] [CrossRef]
  90. Emmett, B.D.; Buckley, D.H.; Drinkwater, L.E. Plant growth rate and nitrogen uptake shape rhizosphere bacterial community composition and activity in an agricultural field. New Phytol. 2019, 225, 960–973. [Google Scholar] [CrossRef]
  91. Zhalnina, K.; Louie, K.B.; Hao, Z.; Mansoori, N.; da Rocha, U.N.; Shi, S.; Cho, H.; Karaoz, U.; Loqué, D.; Bowen, B.P.; et al. Dynamic root exudate chemistry and microbial substrate preferences drive patterns in rhizosphere microbial community assembly. Nat. Microbiol. 2018, 3, 470–480. [Google Scholar] [CrossRef]
Figure 1. Dynamics of total phenolic content in Guadua angustifolia leaves at three sampling events after the application of biological fertilizers. Tukey test significances: * (p < 0.05), ** (p < 0.01), *** (p < 0.001), and **** (p < 0.0001).
Agronomy 13 02782 g001
Figure 2. Dynamics of total phenolic content in Guadua angustifolia leaves at the three evaluated sampling events. Tukey test significance: **** (p < 0.0001).
Agronomy 13 02782 g002
Figure 3. Total phenol content of Guadua angustifolia leaves fertilized with DAP and humus. Tukey test significances: * (p < 0.05), ** (p < 0.01).
Agronomy 13 02782 g003
Figure 4. Dynamics of total flavonoid content in Guadua angustifolia leaves in response to the application of biofertilizers across three sampling events. Tukey test significances: * (p < 0.05), ** (p < 0.01).
Agronomy 13 02782 g004
Figure 5. Dynamics of total flavonoid content in Guadua angustifolia leaves after DAP and humus fertilization treatments across three sampling events. Tukey test significances: * (p < 0.05), *** (p < 0.001).
Agronomy 13 02782 g005
Figure 6. Non-metric multidimensional scaling of OTU abundance for the interaction between biological fertilization and time. Stress: 0.12, k: 2.
Agronomy 13 02782 g006
Figure 7. Approximation of the bacterial profile in the roots of Guadua angustifolia at three sampling events using the fingerprint DGGE-PCR technique. (A) Hierarchical clustering heatmap depicting bacterial OTUs detected for the interaction of DAP and humus fertilization and sampling event. (B) Hierarchical clustering heatmap illustrating bacterial OTUs detected for the interaction of biological fertilization and sampling event. T-I, T-II, and T-III: sampling event.
Agronomy 13 02782 g007
Disclaimer/Publisher’s Note: The statements, opinions and data contained in all publications are solely those of the individual author(s) and contributor(s) and not of MDPI and/or the editor(s). MDPI and/or the editor(s) disclaim responsibility for any injury to people or property resulting from any ideas, methods, instructions or products referred to in the content.

