Article

Tithonia diversifolia Improves In Vitro Rumen Microbial Synthesis of Sheep Diets without Changes in Total Gas and Methane Production

by
Simón Pérez-Márquez
1,2,*,
Vagner S. Ovani
2,
Paulo de Mello Tavares Lima
2,3,
Ângela Maria Quintão Lana
1,
Helder Louvandini
2,
Adibe Luiz Abdalla
2 and
Rogério Martins Maurício
4
1
Animal Science Department, Federal University of Minas Gerais, Belo Horizonte 31270-901, MG, Brazil
2
Animal Nutrition Laboratory, Center for Nuclear Energy in Agriculture, University of São Paulo, Piracicaba 13416-000, SP, Brazil
3
Department of Animal Science, University of Wyoming, Laramie, WY 82071, USA
4
Biosystems Engineering Department, Federal University of São Jõao del Rei, São João del Rei 36307-352, MG, Brazil
*
Author to whom correspondence should be addressed.
Agronomy 2023, 13(11), 2768; https://doi.org/10.3390/agronomy13112768
Submission received: 29 August 2023 / Revised: 17 October 2023 / Accepted: 19 October 2023 / Published: 4 November 2023

Abstract

:
Among the alternatives identified as capable of making livestock farming a more efficient activity and reducing its environmental impact, the use of feeds with high digestibility and the use of non-conventional fodder species can be highlighted. Tithonia diversifolia (Hemsl.) A. Gray (TD) has already gained attention as a feed for ruminants. Nonetheless, there has been little discussion about the impacts of this plant on the rumen dynamics that lead to better animal performance. The aim of this study was to assess how increasing levels of TD could affect ruminal microbial biomass synthesis, degradability, and in vitro gas production (IVGP) of diets. Four diets were evaluated: a control diet (TD0: 400 g kg−1 soybean meal and maize grain, and 600 g kg−1 Tifton 85 hay (Cynodon spp.)) and three increasing levels of TD (TD9: 90, TD27: 270, and TD45: 450 g kg−1–dry matter basis) as a replacement for dietary roughage. A 96 h IVGP assay was carried out and five incubation times (2, 4, 10, 24, and 96 h) were used for degradability determination. Gas produced, methane (CH4), degradability of organic matter (IVDOM), short-chained fatty acid (SCFA) production, partitioning factor (PF), and microbial biomass (MB) were evaluated among treatments. There was no significant effect (p > 0.05) between TD inclusion and IVGP at most incubation times; only at 6 h of incubation did gas production increase linearly with TD inclusion (R2 = 0.19; p < 0.05). TD inclusion had no effects on CH4. IVDOM increased linearly with TD inclusion at 6 and 10 h, with TD45 being more degradable than the control diet at 6 h only. There was a positive linear relationship (R2 = 0.20; p < 0.05) between TD inclusion and PF. TD45 had significantly higher PF values than the control. MB also increased linearly (R2 = 0.30; p < 0.05) with TD inclusion, and all diets with TD had significantly more MB than the control diet. The inclusion of TD at the levels used in this work was revealed to have a positive impact on microbial protein synthesis, which could be related to the higher microbial efficiency of increased substrate quality.

1. Introduction

Among agricultural activities, ruminant livestock production is one of the sectors with the greatest impacts on land use and natural resources [1], with feed production contributing significantly to these impacts [2]. Consequently, the efficient use of natural resources and feeds that do not compete with human food are relevant objectives of the current ruminant livestock sector [3]. Among the alternatives identified as capable of making livestock farming a more efficient activity and reducing its environmental impact, the use of alternative feeds with high digestibility and the use of non-conventional fodder species can be highlighted [4,5]. In addition, the improved and efficient use of feeds that are not consumed by humans is highly relevant to the preservation of food security [6]. In this context, the screening of promising forages is salient to understanding their potential benefits for livestock production. Tithonia diversifolia (Hemsl.) A. Gray (TD) has already gained attention as a feed for ruminants due to the high protein content of its leaves (160 to 280 g kg−1 DM) [7,8,9], its high degradability (up to 800 g kg−1) [10,11,12,13,14], high biomass production [11,15,16], and the satisfactory performance of animals fed with it. (i.e., sustained or increased milk yield, milk composition, dry matter intake, and daily weight gain [17,18,19,20,21]).
Nonetheless, there has been little discussion about the impacts of TD on the rumen dynamics that lead to better animal performance. The in vitro gas production (IVGP) technique can generate meaningful information about the fermentation kinetics and degradation profile of the substrates and fermentation products (short-chained fatty acids (SCFA), gases, and microbial biomass) as well as some of the dynamics of the microbial population. Blümmel et al. [22] proposed that the evaluation of IVGP should always be accompanied by a degradability indicator. In this way, degradability would provide an indication of the amount of material that was fermented, and gas production would provide an estimate of how much of this fermented material was used to produce SCFA and gases. A more degradable material, especially in the early stages of fermentation, could be translated into improved dry matter intake, and a more efficient rumen population could lead to more microbial protein being sent to the posterior gut and thus being available for the ruminant. Therefore, the aim of this study was to assess how increasing levels of TD could affect ruminal microbial biomass synthesis, degradability, and IVGP of diets.

2. Materials and Methods

All the procedures involving the use of animals in this study were approved by the Ethics Committee on Use of Animals of the Escola Superior de Agricultura “Luiz de Queiroz”-CEUA-ESALQ/USP (Protocol 008-2018). The experiment was carried out at the Laboratory of Animal Nutrition of the Centre for Nuclear Energy in Agriculture from the University of São Paulo (LANA/CENA/USP), in the city of Piracicaba, São Paulo state, Brazil.

2.1. Diet and Treatments

The chemical composition of the ingredients of the diets is shown in Table 1. Four diet simulations (Table 2) were evaluated using a fixed concentrate: forage ratio (40:60 w/w), composed as follows: a control diet (400 g kg−1 soybean meal and maize grain and 600 g kg−1 Tifton 85 hay (Cynodon spp.) (TD0) and three increasing levels of TD (TD9: 90, TD27: 270, and TD45: 450 g kg−1–dry matter basis) replacing only Tifton hay. Two samples from each diet for every period were used for chemical composition determination.
TD was collected in different areas around the city of São João del Rei in Minas Gerais state, Brazil (−21°7′37.6″, −44°13′17.5″–December 2019). The whole plant (leaves and stems) in the flowering stage was collected, cut approximately at 50 cm above ground, chopped, and dried under sunlight. TD hay was then ground (1 cm sieve) for mixture with the rest of the diet’s components. Maize grain and Tifton 85 hay were also ground to 1 cm. The soybean meal was mixed with the rest of the ingredients without prior grounding processes.
Once mixed, a 500 g sample of each diet was collected and then ground (1 mm sieve) using a Willey mill (Marconi, Piracicaba, Brazil) for use in the in vitro trial and for chemical composition determination (Table 2). AOAC [23] guidelines were followed for the determination of dry matter (DM; ID no. 934.01), crude protein (CP; ID no. 2001.11), ether extract (EE; ID no. 2003.5), and ash fraction (ASH; ID no. 942.05). Neutral detergent fiber (assayed with a heat-stable amylase and expressed exclusive of residual ash—aNDFom) and acid detergent fiber (expressed exclusive of residual ash—ADFom) were both determined using a fiber analyzer (Tecnal TE-149, Piracicaba, Brazil) and filter bags (Ankom F57, Macedon, NY, USA), while lignin (sa) was determined by the solubilization of cellulose with sulfuric acid by non-sequential washing. Fiber fractions were determined according to the methodology described by van Soest et al. [24] and adapted by Mertens et al. [25]. Also, total phenolic compounds and total tannins were determined using the Folin–Ciocalteu method described in Makkar [26].
Table 2. Ingredient proportions and chemical composition of diets containing increasing levels of Tithonia diversifolia.
TD0TD9TD27TD45SEp-ValueRegression
LQR2
Ingredients (g kg−1)
Tithonia diversifolia0.090.0270.0450.0
Tifton 85600.0510.0330.0150.0
Maize grain263.0254.7246.2234.9
Soybean meal137.0142.6153.8165.1
Chemical composition (g kg−1 DM)
Dry matter (g kg−1)910.6906.9906.4905.74.310.85570.6520.883
Organic matter938.5928.0929.6920.51.23<0.001<0.001<0.0010.90
Crude protein163.0158.6156.5156.37.020.06550.7470.456-
Neutral detergent fiber a409.0396.6393.3392.724.480.05930.2260.118
Acid detergent fiber b299.2300.3312.7345.8 *14.510.01070.0340.0800.34
Lignin b75.683.9298.48 *129.0 *5.750.0032<0.001<0.0010.71
Gross energy (MJ kg−1 DM)15.715.515.415.50.210.35200.6640.907
Metabolizable energy (MJ kg−1 DM)5.274.73 *4.82 *4.67 *0.0680.00100.0070.0090.3
Ether extract23.718.0 *17.6 *17.5 *2.620.04500.0700.065
Non-fibrous carbohydrates342.7366.1367.0353.816.480.07230.3500.088
Total phenolic compounds c7.676.73 *5.79 *4.81 *0.24<0.001<0.0010.5760.74
Total tannins c4.303.663.02 *2.33 *0.29<0.001<0.0010.7130.80
P/E ratio29283138 *1.2<0.001<0.001<0.0010.32
a NDF—assayed with a heat-stable amylase and expressed exclusive of residual ash. b ADF—assayed exclusive of residual ash. c Values expressed in equivalent grams of tannic acid per kilogram of dry matter. * Within the same line, differs significantly from TD0 using orthogonal contrasts at p < 0.05. Non-fibrous carbohydrates—100 − (CP + NDF + EE + Ash). Metabolizable energy—estimated using formula 14b of Menke and Steingass [27]. P/E ratio—protein (mg microbial biomass per day) to energy (MJ of SCFA energy per day) ratio. SE—standard error; L and Q—P-value for the linear and quadratic responses, respectively; R2—determination coefficient.

2.2. In Vitro Trial and Gas Production

The rumen content of eight rumen-cannulated adult Santa Inês sheep (70 ± 13.4 kg BW) was collected on the day of incubation before morning feeding and was used as an inoculum following the procedure described by Lima et al. [27]. The donor animals were previously adapted (14 days) to the experimental diets described above (two animals per treatment). Four inocula were prepared, each from two donors under the same diet (treatment), and each diet was incubated using the inoculum of the pair of animals under the same treatment.
For substrate preparation, 1 g of each diet was weighed into Ankom F57 fiber bags (Ankom Technology Corp., Macedon, NY, USA), heat sealed, and placed in 160 mL glass fermentation flasks filled with 50 mL of Menke’s buffered medium [28] and 25 mL of inoculum. Incubation was performed according to the methodologies described by Mauricio et al. [29] with adaptations by Bueno et al. [30] and Longo et al. [31].
Two flasks per treatment were incubated using the corresponding diet inoculum, and five incubation times were used to assess degradability (2, 6, 10, 24, and 96 h). In addition, one flask without substrate (blank) and one with a laboratory internal standard sample (Tifton 85) were included with each inoculum and incubation time, totaling 80 flasks. After the inoculation, the flasks were closed with a rubber stopper and placed in a forced ventilation oven (incubator) (MA 035–Marconi, Piracicaba-SP, Brazil) at 39 °C.
At 2, 4, 6, 8, 10, 12, 15, 19, 24, 30, 36, 48, 60, 72, and 96 h after inoculation (0 h), the internal pressure of the flasks (PSI) was measured using a pressure transducer and datalogger (Pressure Press 800, LANA, CENA/USP, Piracicaba, Brazil). The total volume of gases produced in each flask was determined following the equation V = (5.96 × P + 0.89) (n = 321, R2 = 0.991) specific to this laboratory, where V = gas volume (mL) and P = measured pressure (psi).
For fermentation kinetics evaluation, the logistic-exponential + lag model described by Wang et al. [32] was used. Four gas production curves for each treatment were run through the model, and the following gas production attributes were derived from it: the final asymptotic volume (Vf) (mL), the volume of gas produced at 96 h (V96) (mL), the gas production rate (k) (h−1), lag time (L) (h), the time at half of total gas production (T0.5) (h), the volume of gas production at T0.5 (V0.5) (mL), and the fractional gas production rate at T0.50.5) (h−1).

2.3. In Vitro Methane (CH4) Measurements

After measuring the internal pressure of each flask with the help of a syringe, a gas sample from each flask was collected and stored in 10 mL test tubes for later determination of CH4 by gas chromatography using the chromatographic conditions described by Lima et al. [27]. At the end of each incubation time, a 10 mL gas pool (composed of the samples collected in each internal pressure measurement) was obtained. After gas collection, flask pressure was released, and the flasks were homogenized by shaking and returned to the incubator.

2.4. In Vitro Degradability

At each of the five incubation times, after pressure measurements and gas sampling, the incubation was interrupted in 16 of the flasks (two per treatment). The flasks were then suspended in cold water, and the filter bags were removed and placed in trays containing icy water to stop the fermentation process. All bags were then treated with a neutral detergent solution for 1 h at 90 °C, followed by four 5 min washes with distilled water at 90 °C using a fiber analyzer (TE-149, Tecnal, Piracicaba–SP, Brazil) and a subsequent 5 min wash with acetone. The bags were then placed in an oven at 105 °C for 24 h and then weighed to calculate the degradability of the NDF (NDFD), which was afterward reduced to ash in a muffle furnace (for 5 h at 550 °C) to determine the in vitro (true) degradability of organic matter (IVDOM) [33].

2.5. Fermentative Parameters

After the fermentation period, at every incubation time, samples of liquid content from each flask were collected into 20 mL glass vials for posterior determination of SCFA and ammonia nitrogen (N-NH3) following the methodology described by Lima et al. [27]. After collection, pH from the liquid content was measured using a pH meter (model TEC-2, Tecnal, Piracicaba, Brazil), after which the vials were stored at −20 °C until analysis.
The partitioning factor (PF) and microbial biomass (MB) were calculated based on the equations described by Blümmel et al. [22]: PF = TDOM/GP, where TDOM is truly degraded organic matter and GP is net gas produced at the incubation time; MB = TDOM − (GP × SF), where SF is the stoichiometric factor calculated from SCFA concentrations as described in Blümmel et al. [22].
The P/E ratio (protein to energy ratio) was calculated according to Preston and Leng [34] by dividing the MB (mg) after 24 h of incubation by the energy content of SCFA (acetic, propionic, and butyric) (MJ/d) after 24 h of incubation. The energy content of acetate, propionate, and butyrate was calculated using the values reported by Bergman et al. [35] and Bergman [36].

2.6. Statistical Analysis

Data were analyzed using a 4 × 4 Latin square design, with four periods, four inoculum sources, and four treatments (T. diversifolia inclusion levels). The five incubation times were considered as a subplot of the treatment. Regression analyses were performed to assess the effect of increasing doses of T. diversifolia on the variables evaluated at each incubation time, and Pearson’s correlation tests were performed to assess the relationship between independent variables. The means of the evaluated variables were also compared using orthogonal contrasts, comparing the treatments with TD inclusion against the diet without TD: TD0 vs. TD9 (1,−1,0,0), TD0 vs. TD27 (1,0,−1,0), and TD0 vs. TD45 (1,0,0,−1).
In all cases, Shapiro Wilk’s normality test and Bartlett’s Homoscedasticity test were performed; and where necessary, the data were transformed using exponential, logistic, or square root transformation. Statistical analyses and plotting were performed using the R software v. 4.3.1 [37] and the “lmerTest” [38], “emmeans” [39], “multcomp” [40], “corrplot” [41], and “ggplot2” [42] packages.
The following statistical model was employed for the data analysis:
Υijklm = μ + ti + lj + ck + eijkl + Tm + (t/T)im + e,
where Υijklm is the dependent variable, μ is the overall mean effect, ti is the effect of treatment, lj is the effect of the period (Latin square rows), ck is the effect of the inoculum source (Latin square columns), eijkl are the residuals of the plot, Tm is the effect of the incubation time, (t/T)im is the effect of the treatment inside each incubation time, and e are the residuals of the subplot.

3. Results

3.1. Total Phenolics and Total Tannins

A quadratic decrease (p < 0.001) in the concentration of both total phenolics (R2 = 0.74) and total tannins (R2 = 0.80) was observed as a consequence of the inclusion of TD in the diets (Table 2). In the case of total phenolics, all diets with TD inclusion had significantly lower values (p < 0.001) when compared to the control diet. And, in the case of total tannins, only the TD9 diet did not present significant differences when compared to the control without TD.

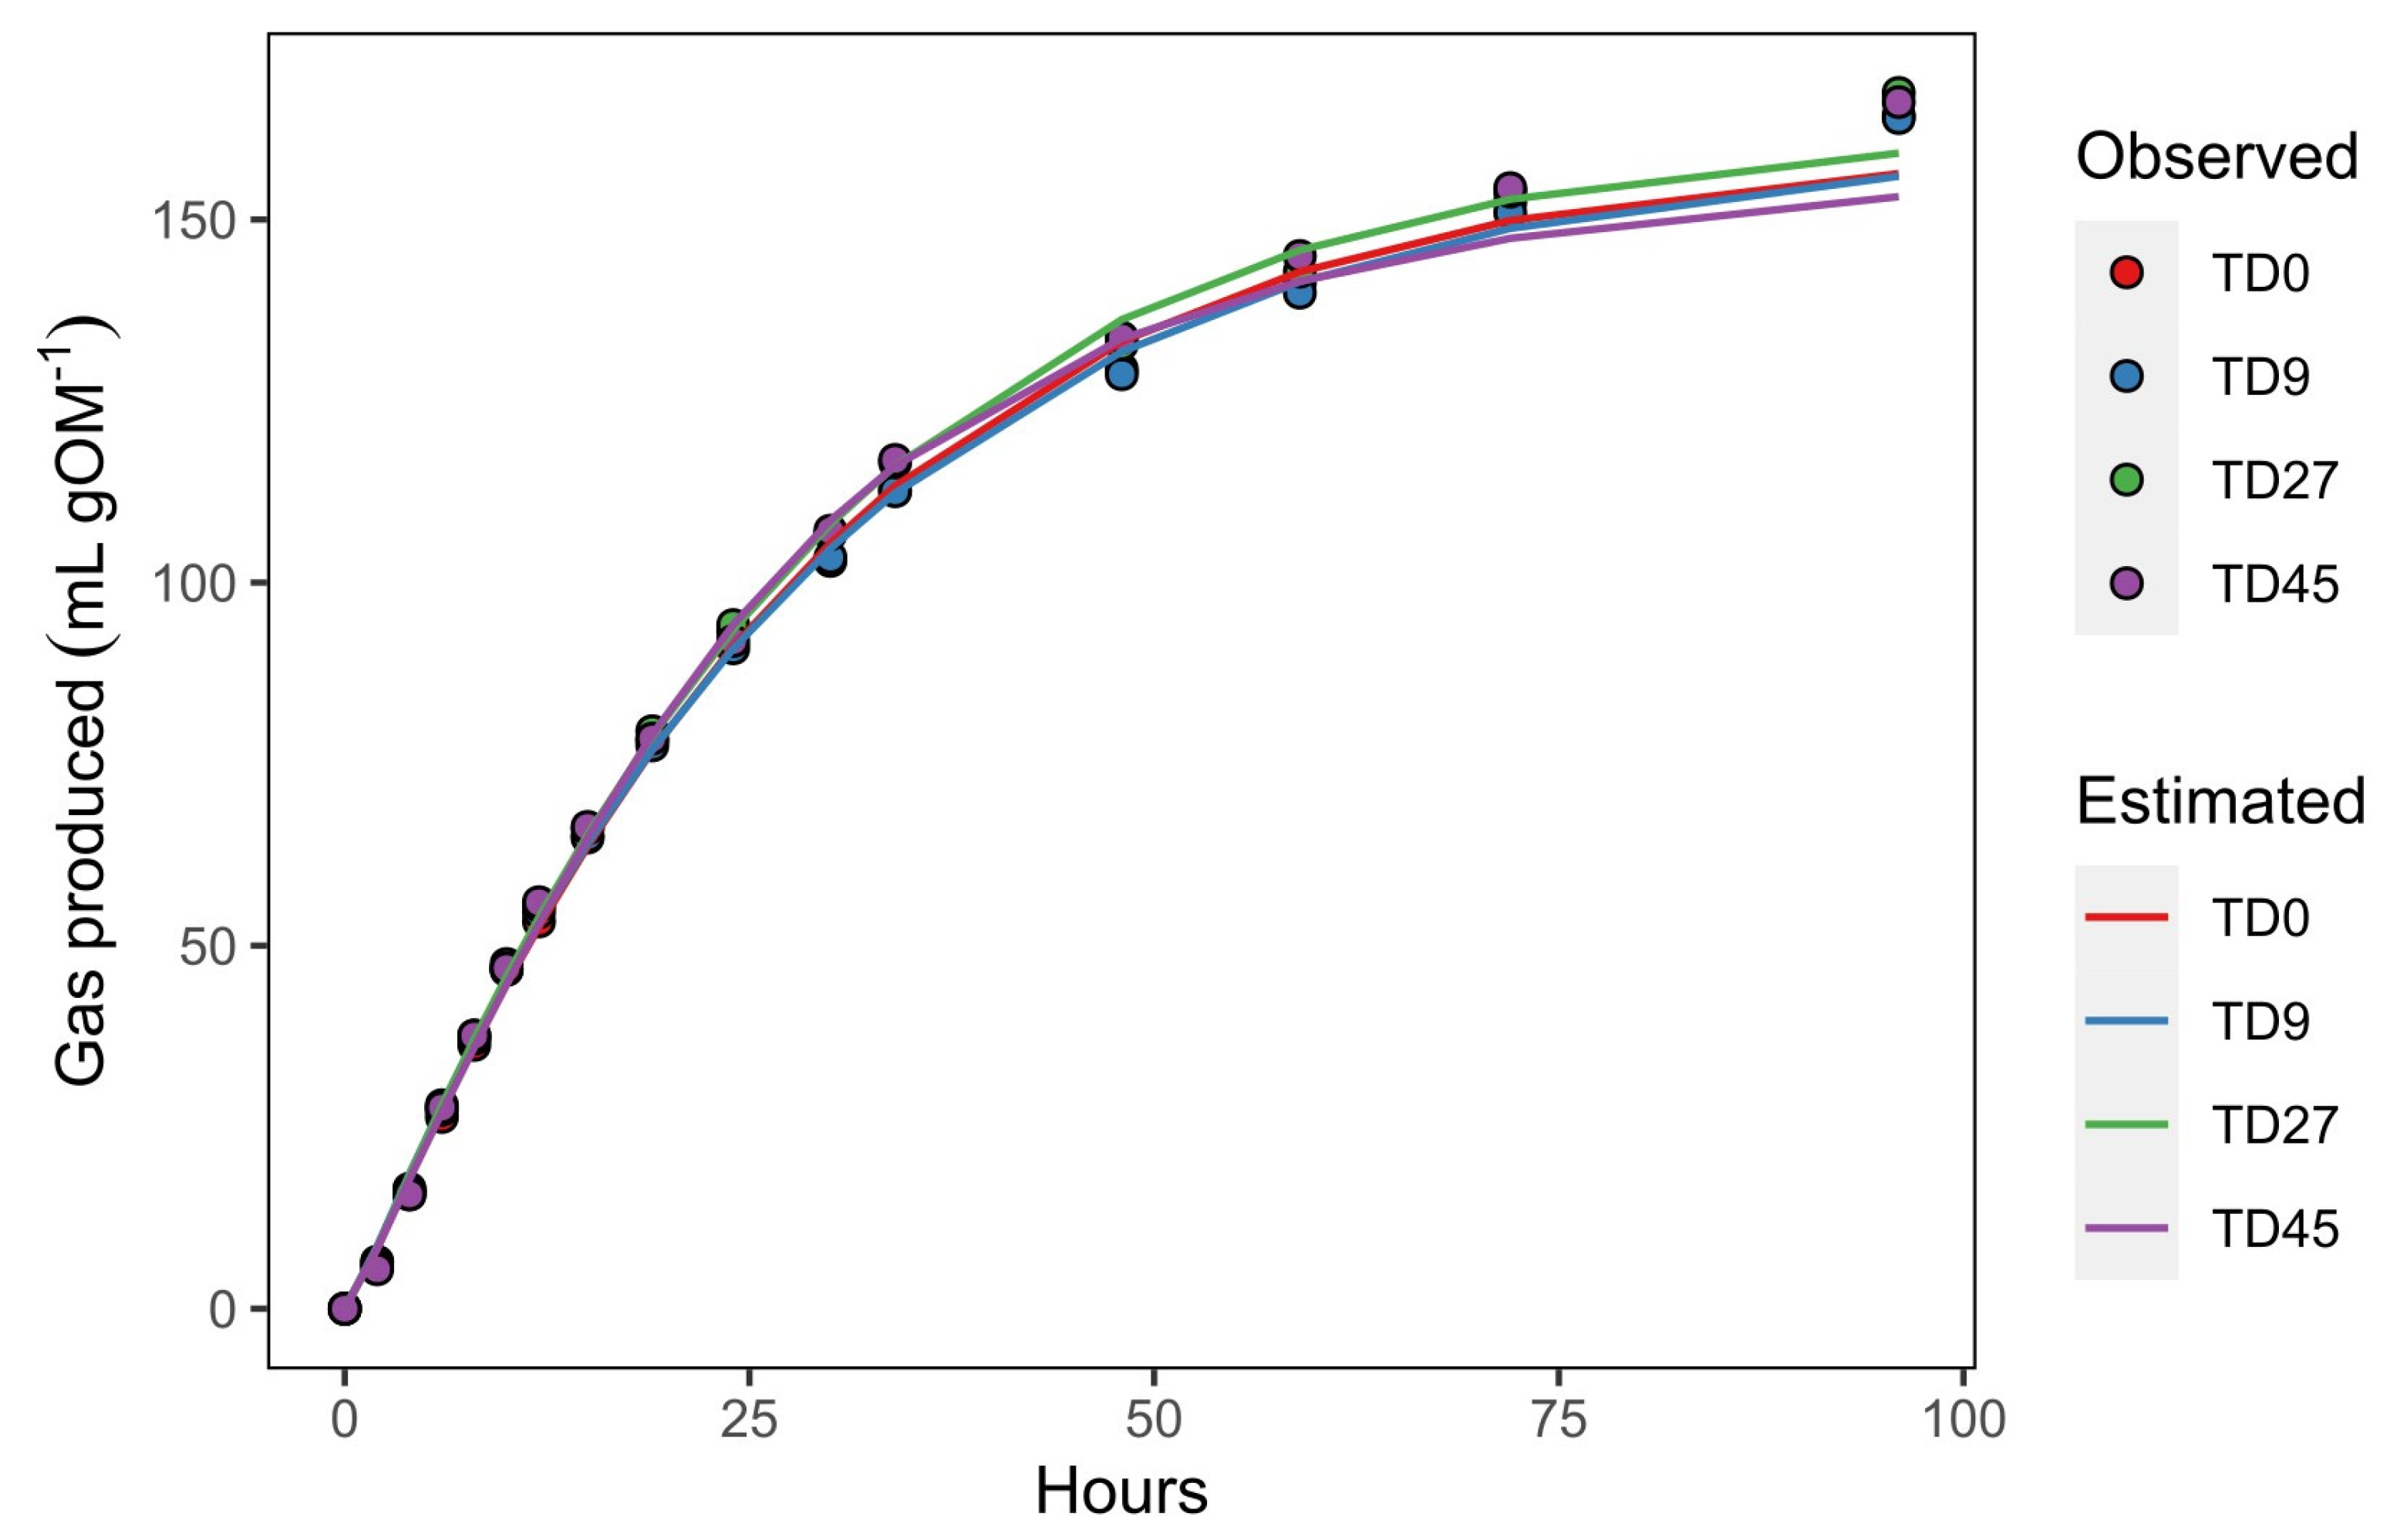
3.2. In Vitro Fermentation Kinetics

The TD dose had no significant effect (p > 0.05) on any of the fermentation kinetic parameters estimated by the model (Table 3). The asymptotic volume of gas produced (Vf) for all treatments was, on average, 168.4 mL per gram of incubated organic matter (g OM), the volume of gas at half-time (V0.5) was 84.2 mL g−1 OM, and the volume of gas at 96 h (V96) was, on average, 161.79 mL g OM−1.
All treatments had a lag phase of about 0.4 h (24 min) and attained half its total gas production at 21.3 h (T0.5). The gas production rate (k) showed a tendency (p = 0.09) (R2 = 0.19) to increase with TD inclusion, and the gas production rate at half-time (μ0.5) of the TD45 diet was significantly higher (p = 0.036) than that of the diet without TD.

3.3. In Vitro Gas Production (IVGP)

There was no clear effect of the inclusion of TD on IVGP (Table 4). Only at 6 h after incubation did the gas volume (mL per gram of degraded organic matter—mL g DOM−1) show a linear increase (R2 = 0.19; p = 0.006) as a consequence of TD inclusion. However, there was no difference (p > 0.1) in the gas produced at this time when the diets with TD inclusion were compared to the control.

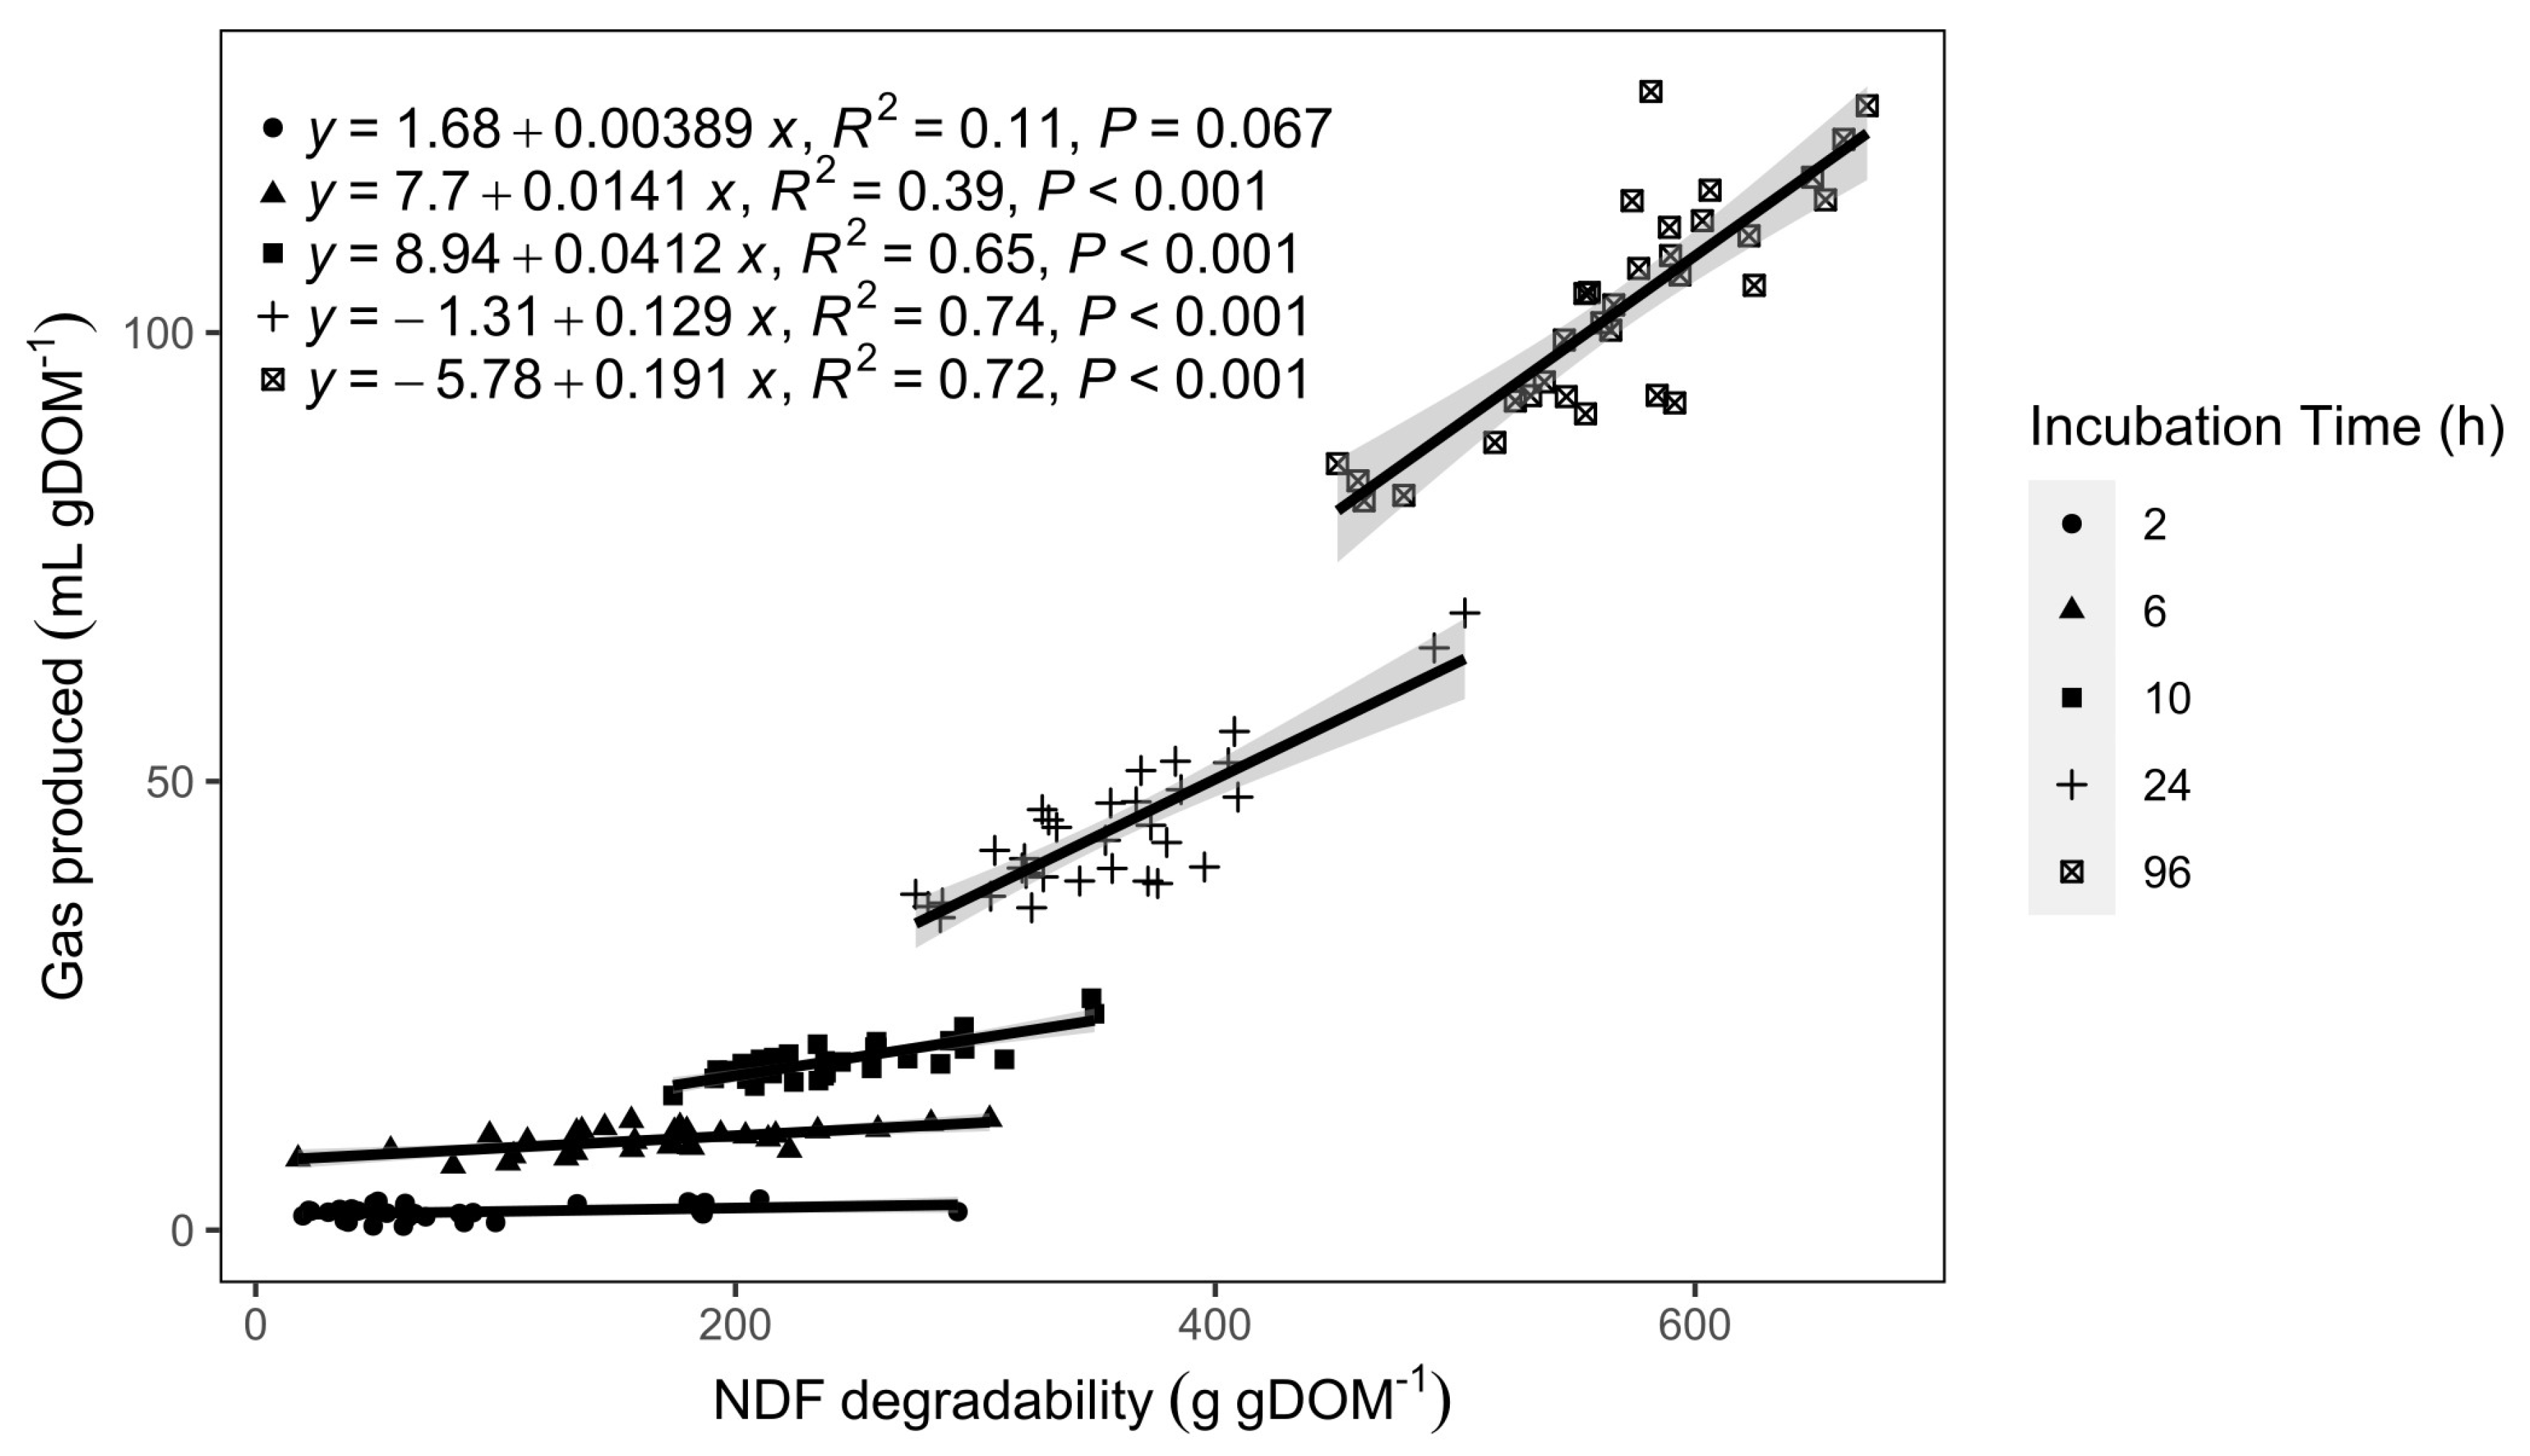
3.4. In Vitro Degradability

At 2 and 6 h of incubation, IVDOM increased linearly with TD inclusion (p < 0.05) (R2 = 0.16 and 0.20, respectively), and there was also a quadratic response at 10 h (p = 0.033) (R2 = 0.21) (Table 4). Also, at 6 h of incubation, there was a difference in the IVDOM values between the diets, with the highest inclusion of TD having a significantly higher IVDOM (p = 0.009) when compared to the diet without TD. There were no effects of TD inclusion in the IVDOM at 24 and 96 h.

3.5. In Vitro CH4 Production

There was no significant effect of TD dose on the CH4 production (p > 0.1) of the evaluated incubation times (Table 4). However, the TD9 diet showed a significantly lower production at 24 and 96 h of incubation. No effects of the diet on CH4 production were observed for the other incubation times.

3.6. In Vitro Short-Chain Fatty Acid (SCFA) Concentration

TD inclusion negatively affected the total SCFA concentration (Table 5). At 2, 10, and 24 h of incubation, a significant linear effect (p < 0.05) was observed between the level of TD inclusion and total SCFA concentration (R2 = 0.12, 0.21, and 0.13, respectively). There was no significant dose effect (p > 0.05) at 6 and 96 h of incubation.
When compared to the control diet, the TD45 diet had a lower total SCFA concentration (p < 0.05) at all times, except at 96 h. The other treatments did not significantly differ from the control diet in terms of total SCFA concentration.
There was no significant regression observed between the molar proportions (mol 100 mol−1) of acetate and TD inclusion (Table 5). However, when comparing means against the control diet, at 2 and 6 h of incubation, the TD45 and TD27 diets presented slightly lower values (p < 0.05).
The molar proportion of propionate decreased (p < 0.05) with the increase in TD inclusion (Table 5), and significant quadratic effects were observed at 10, 24, and 96 h of incubation (R2 = 0.29, 0.26, and 0.26, respectively). A trend was observed at 6 h of incubation (R2 = 0.18). However, when compared to the control diet, the proportions were statistically similar at all incubation times (p > 0.05).
No significant differences (p > 0.05) were observed in the molar proportions of butyrate at any of the incubation times, nor were any dose effects observed.
Only at 10 and 96 h of incubation were differences in the acetate-to-propionate ratio (A:P) observed (p < 0.05) (Table 5). At those incubation times, the ratio increased quadratically with the increasing level of TD in the diet (R2 = 0.21 and 0.24, respectively).
Differences in the valerate molar proportions were only observed at 2 and 96 h of incubation, with contrasting results (Table 5). At 2 h of incubation, valerate increased quadratically with TD inclusion (p = 0.014; R2 = 0.24), and the diet with the highest level of TD differed significantly from the control. In contrast, at 96 h of incubation, the valerate proportion decreased quadratically with the increase in TD (p = 0.019; R2 = 0.22), and both the TD27 and TD45 diets had lower values (p = 0.014) than the control diet. Significant differences in the valerate proportion against the control diet were not observed at the other incubation times.
The isovalerate molar proportion increased quadratically with TD inclusion (p < 0.001) at all incubation times, except at 96 h (Table 5). Moderate determination coefficients were observed at 2, 6, 10, and 96 h (R2 = 0.43, 0.45, 0.38, and 0.32, respectively). Molar proportions of isovalerate were higher (p < 0.05) in the TD45 diet when compared to the TD0 diet, for all incubation times.
TD inclusion had a positive quadratic effect on the molar proportion of isobutyrate at all incubation times (p < 0.05) except at 96 h of incubation, where only a linear effect was observed (p = 0.047; R2 = 0.12) (Table 5). The TD45 diet molar proportion mean differed significantly from the control diet at 2, 6, 10, and 24 h of incubation. At 6 h of incubation, the TD27 inclusion also had a higher molar proportion of isobutyrate (p < 0.05) when compared to the diet without TD.
The pH between the substrates ranged from 6.3 to 7.0, with lower values at longer incubation times. With the exception of 24 h, pH increased quadratically with TD inclusion (p < 0.01) at all incubation times (R2 = 0.39, 0.53, 0.26, and 0.21 for 2, 6, 10, and 96 h, respectively), and the TD45 diet had higher pH values than the control. The TD27 diet also showed higher pH values than the control at 2 and 6 h of incubation.

3.7. Ammonia Nitrogen, Partitioning Factor (PF), and Microbial Biomass (MB)

The results of ammonia nitrogen (N-NH3), PF, and MB are presented in Table 6. A negative relationship (p < 0.05) was observed between the increase in the level of TD in the diet and the concentration of N-NH3 at incubation times of 10, 24, and 96 h (R2 = 0.45, 0.18, 0.23, respectively). At 10 h, the TD45 diet had a significantly lower N-NH3 concentration than the control diet (Table 6). There was no difference (p > 0.05) in the N-NH3 between diets for incubation times of 2, 6, 10, and 24 h.
The PF increased quadratically (p < 0.01) with the increasing inclusion of TD at all incubation times except 96 h. Meanwhile, the TD45 diet had significantly higher PF values when compared to the diet without TD at the same incubation times.
TD inclusion had a quadratic effect (p < 0.001) on the MB at 2, 6, 10, and 24 h of incubation (R2 = 0.37, 0.55, 0.42, 0.40, respectively). With the exception of 96 h of incubation, MB was 34, 54, 19, and 18% higher in the TD45 diet when compared to the control, for 2, 6, 10, and 24 h, respectively.

4. Discussion

4.1. In Vitro Fermentation Kinetics

The use of mathematical models to predict in vitro fermentation kinetics is useful because these models allow the user to obtain valuable data from relatively little information (i.e., the volume of gases produced) [6,43]. Data such as asymptotic gas volume, gas production rate, T0.5, and lag time are some of the examples that yield meaningful information for the evaluation of a substrate [6,43].
According to the results of the model (Table 3), at 96 h of incubation, treatments were still not at asymptotic levels of gas production, as the V96 values were still about three percent short of the asymptotic values (Vf). Also, from the gas production curves (Figure 1), we can see a slight underestimation of the gas volumes by the model in the latter gas measurement times. This shows how the model sought to adjust the data to an asymptote and could also mean that factors such as the hydration of particles and the increase in microbial numbers could still be the sources of gas production at those times, as mentioned by France et al. [44]. These authors also mentioned that the assumption that the gas production rate approaches and asymptote is not indisputable and that factors such as the accumulation of fermentation end products, the reduced availability of growth factors, and chemical and structural restrictions could be behind the reduced gas production as degradation proceeds.
Some authors argue that the only really valuable information gained from gas production alone is the fermentation rates [44,45]. In the present study, no major differences were observed in the gas production rates (k) between the different substrates; nonetheless, the tendency in the increasing k and the differences in μ0.5 are consistent with the results obtained in the IVDOM, discussed later, granted that the latter results were more conclusive. Usually, k is considered to be proportional to the degradation of substrate [44], although some authors have mentioned that this assumption is not incontrovertible given that the gas is a product of substrate composition, microbial population, and hexoses utilization by microorganisms and is not solely a product of the degradation of the material [44,45].
Unfortunately, there is not much work in the literature describing the IVGP kinetics of TD inclusion in concentrate diets, although some authors have described its kinetic behavior in forage diets. Firsoni et al. [46] reported a gas production rate of 0.038 h−1 for a substrate using 75% T. diversifolia and 25% rice bran, values similar to our highest TD inclusion, and Rivera et al. [47] reported that B. brizantha, in association with different genotypes of TD, had a specific gas accumulation rate between 0.09 and 0.1 h−1, values higher than those obtained in the present study.
All diets attained half their total gas production (V0.5) at about 21 h of incubation (T0.5) (Table 3), suggesting that, by this time, about half of the incubated organic matter in the substrate was already degraded. An earlier T0.5 could translate to a faster passage rate in vivo, increased intake, and, consequently, better animal performance. Nonetheless, no statistical differences were observed among diets, and although there were some minor dose effects and tendencies in the k and μ0.5 values, the statistical similarity suggests that those differences (in k and μ0.5) were not strong enough to translate to a significant reduction in T0.5.

4.2. Presence of Tannins in the Diets

Tannins are a subclass of polyphenols with the ability to bind to and precipitate proteins in aqueous solutions [48,49]. High tannin content (60 to 120 g kg−1 DM of condensed tannins) in feed has been associated with low palatability, low digestibility, and low ruminant productivity [50]. Nonetheless, Naumann et al. [49] argued that the efficiency of the protein binding ability of the tannins rather than the whole tannin content is what defines its effects [51]. Mueller-Harvey [52] also commented that the effect of the tannins depends on the type of tannin being evaluated, but that concentrations below 50 g of CT kg−1 are considered to have beneficial effects, such as protecting dietary protein from ruminal degradation and shifting its site of digestion to the intestine. This is also consistent with the findings of Ban et al. [53], who did not report any negative effects while using 42 g kg−1 of CT in goat diets.
In in vitro studies, it has been reported that tannins improved N incorporation into microbes and shifted the partitioning of organic matter more to microbial biomass synthesis and less to SCFA production [48]. Makkar [48,51] also mentioned that tannins had a greater effect on the rate of gas production rather than the ultimate plateau value and attributed this to the reduction in microbe attachment to feed particles. Getachew et al. [54] concluded that browses with considerable amounts of phenolic compounds reduce IVGP compared to the same browses being incubated with a tannin complexing agent (PEG).
More specifically, regarding TD, Delgado et al. [55] and Galindo et al. [56], using diets based solely on Cynodon nlemfuenesis, included TD up to 300 g kg−1 from different plant fractions and ages and reported a “moderate” concentration of tannins in the inclusion. They also found a reduction in protozoa and bacteria presence and associated this with the increase in the tannin content. The mechanisms of the cytotoxicity of tannins on protozoa and bacteria have been discussed elsewhere [57,58].
The results of Delgado et al. [55] and Galindo et al. [56] contrast with the findings of the present experiment, as the content of phenols and total tannins decreased with the increasing inclusion of TD in the diet (Table 1). The tannin content in our TD was likely low due to the age of the plant used. Makkar [59] explained that the loss of cellular integrity resulting from plant senescence increases the oxidation processes of phenolic compounds and that drying in the air for prolonged periods can change their nature and content. In the present study, the TD used in the diets was collected from aged ruderal material (flowered stage) and sun-dried for several days. It is also relevant to note that it was also the whole plant that was used and not just the leaves (that could have had a higher TD content). These factors may have influenced the loss of phenolic compounds in the plant and thus resulted in little influence on the final diets, as observed.

4.3. IVGP, Degradability, and CH4 Production

Overall, there were no differences in the gas produced as a consequence of the inclusion of TD in the substrates (Table 4). Similar results were found by Terry et al. [60], who, replacing sugar cane and concentrate with TD, also did not find differences in gas production at 48 h of fermentation. In the present experiment, the lack of effect of TD inclusion on gas production coincided with the lack of effect on CH4 production. This was expected, as the latter is one of the main components of the measured gas [22,43]. It is worth noting that despite the increase in the IVDOM as a consequence of TD inclusion, there was no increase in CH4 production between the substrates.
Although a linear increase was observed in gas production at 6 h of incubation, this relationship had a low determination coefficient (R2 = 0.19). This increase in gas production at 6 h could be related to the increase in the IVDOM at that same incubation time, although that does not explain why, at 2 and 10 h of incubation, when the IVDOM also increased linearly with TD inclusion, there were no significant increases in gas production. We hypothesized that this discrepancy between gas production and degradability could suggest that (1) the TD inclusion favored propiogenic production routes, which are known to produce fewer gases than acetogenic routes [43], or that (2) the degraded organic matter was being allocated into another fermentation product instead of gas (i.e., MB) [22,43].
Regarding the first, most of the gas measured during IVGP is composed of CO2 and H2 [22,43]. These are also the primary substrates utilized by methanogenic archaea to generate ruminal CH4 [61,62,63] and constitute the main by-products of carbohydrate fermentation into SCFA (mainly acetate, propionate, and butyrate) [22,43]. Thus, the more SCFA produced, the more gas. However, the individual production of one SCFA does not have the same impact on gas production as the other [43]; the in vitro fermentation of carbohydrates to propionate does not contribute to the direct production of CO2 and H2, which are by-products solely of the fermentation to acetate and butyrate [22,43]. In this way, substrates that favor the presence of propiogenic microorganisms produce less gas in vitro. However, in the present experiment, the molar proportions of propionate did not support this hypothesis as they were reduced with the increase in the TD level as well as total SCFA production. Consequently, this suggests that our second hypothesis about the degraded organic matter being allocated to another fermentation product is the most plausible explanation for the discrepancy between gas production and degradability. The NDF degradability and gas-produced relationship, PF, MB, and iso-acid values serve as supportive evidence for this hypothesis, as discussed later on.
Generally, the volume of gases produced in vitro is highly correlated with substrate degradation. Higher gas volumes are often explained by high degradability [22], and although this was the case in the present experiment, we can deduce that this relationship is not constant throughout the whole fermentation period (Figure 2). In Figure 2, it can be seen how the relationship (R2) between NDFD and gas produced grows stronger as the incubation time increases. This exemplifies how gas production in later incubation times could be a product of the cellulose, hemicellulose, and lignin (fiber fraction) content, while the weaker relationship in early incubation times suggests that rapidly degradable carbohydrates and other components (non-NDF) could be responsible for gas production at early times of in vitro fermentation (2, 6 h). The main ruminal SCFA (acetate, propionate, and butyrate) and gas are mainly a product of carbohydrate (fiber) degradation, with other substrate components, such as protein, contributing less to SCFA and more into branched short-chained fatty acids (BCFA) (valerate, isovalerate, and isobutyrate) [64]. In the present study, a moderate correlation was observed between the TDOM and the concentration of isobutyrate (iBUT) (R = 0.79) and isovalerate (iVAL) (R = 0.77) (Figure 3). These isoacids are products of the ruminal degradation of amino acids, which could suggest that the TDOM in the diets was associated more strongly with the protein content (R = 0.56; p < 0.001) rather than with the fiber content (NDF) (R = 0.34; p > 0.05) (Figure 3).
Regarding the IVDOM of TD, some authors have mentioned that the incorporation of TD into substrates results in greater IVDOM [47,65,66], while others did not report significant differences [14,60,67]. In most of these cases, the IVDOM differences were explained by changes in the proportion of soluble carbohydrates within the substrates. This, however, appears to be unlikely in the case of the present experiment, as the NFC content remained unchanged between treatments (Table 1), also suggesting that the IVDOM in the present diets was not predominantly a consequence of their fiber content.

4.4. Microbial Protein Synthesis

The negative correlation of TDOM with IVGP and its positive relationship with isoacids (iBUT and iVAL) (Figure 3) further support the conclusion that the substrate was being converted to microbial protein rather than being fermented into gases. In this regard, Blümmel et al. [22] showed, with stoichiometric calculations, how a substrate with lower gas production could have a greater amount of MB produced than a substrate with higher gas production. This could be the case in the present study, as indicated by the PF and MB values (Table 6). The PF summarizes the relationship between the gases produced and the degraded substrate, with higher values being related to greater microbial efficiency, whereas MB estimates how much of the degraded substrate was put into microbial synthesis (in mg) [22].
The positive effect of TD on iso-butyric and iso-valeric acids (Table 5) also suggests that the plant could have a positive effect on microbial protein. There was also a positive correlation between MB and iVAL (p < 0.05; R = 0.59) and between MB and iBUT (p < 0.05; R = 0.60) (Figure 3). Isoacids (valerate, isovalerate, isobutyrate) are synthesized in the rumen from branched-chain amino acids (BCAA) and play an important role in bacterial growth by providing carbon skeletons for microbial biosynthesis [68]. Multiple studies have reported the benefits of iso-acid supplementation for ruminants, which include the improvement of digestion and the stimulation of ruminal microorganisms [69,70,71], the potentiation of ruminal fermentation [72,73], and the increase in cellulose and hemicellulose degradability [74,75,76]. BCAAs such as leucine and valine are precursors for iVAL and iBUT, respectively [68], and TD has been reported to be rich in these BCAA [77]. Oluwasola et al. [77] and Fasuyi et al. [78] both reported concentrations of leucine, valine, and iso-leucine in TD of 8.02 and 7.5; 4.0 and 5.2; 4.2 and 4.2 mg 100 g of DM−1, respectively. This is consistent with the increase in isoacids as a consequence of TD inclusion that was found in the present study. Much like the observations in the current investigation, Ribeiro et al. [19] reported higher amounts of isoacids in diets that had more TD, and Akanmu et al. [79] reported higher amounts of isobutyrate and valerate in TMR, Lucerna grass, and Eragostis diets when they included TD extract.
Another result that also supports the effects of TD on microbial synthesis is the N-NH3 concentration. BM and N-NH3 showed a negative relationship (Figure 3), with higher BM values correlated with a lower N-NH3 concentration (p < 0.05; R = −0.45). N-NH3 has been considered the preferred source of nitrogen for the growth of rumen bacteria [80] and decreases in its concentration could be an indication that more ammonia is being converted into microbial protein [68].
In the present study, during the early incubation times (2 and 6 h), the N-NH3 concentration did not differ between the diets (Table 6) but, as time passed (10, 24, and 96 h), a negative correlation was observed between TD increase and the concentration of N-NH3, which may suggest that the ammonia product of dietary protein degradation was being incorporated into the microorganisms.
Under in vivo conditions, N-NH3 escapes from the rumen through absorption by the rumen wall or by its incorporation into microorganisms [81]. Hristov and Ropp [82] mentioned that between 32 and 66% of the ammonia in the rumen was incorporated into microbial nitrogen.
Given that, in in vitro conditions, the absorption of ammonia by the rumen wall is non-existent, it is possible to affirm that the reduction of N-NH3 in the rumen at advanced in vitro incubation times was due to its incorporation by ruminal microorganisms. Other authors have suggested positive results in the synthesis of microbial protein with the use of TD. Galindo et al. [83,84] reported that the replacement of 200 g kg−1 of Cynodon nlemfuensis with TD increased the presence of cellulolytic bacteria; Jamarun et al. [66] and Pazla et al. [65] also reported greater microbial protein synthesis when including TD in their diets. Nonetheless, these authors highlighted the higher CP content of their diets, a product of TD inclusion, as being responsible for the greater availability of ammonia for rumen microorganisms and the consequential improvements in fiber degradation. In the present study, there were no significant differences in the CP content between diets (Table 1), which could be used as a justification for the increase in degradability or in the N-NH3 content. However, based on the increase in the isobutyrate and isovalerate concentrations, there may have been a change in the amino acid profile of the CP as a result of the inclusion of TD (e.g., leucine and valine) that led to better degradability and microbial efficiency.
The P/E ratio further supports this. Although the ME content of the diet decreased with the TD inclusion (probably due to a similar reduction in the fat content of the diets), the P/E ratio increased. The P/E ratio represents the protein available for digestion in the intestines relative to the energy absorbed as SCFAs and is directly proportional to the microbial growth efficiency, i.e., the ability of the rumen microorganisms to convert available organic matter into microbial cells [34]. More research is needed to corroborate this conjecture.
In general, it seems that the effects of TD on IVGP and ruminal fermentation parameters are a simple consequence of the quality of the substrate used. In general terms, the level of TD inclusion in the diet was not a very good predictor of any of the IVGP variables evaluated in the present experiment. The value of the coefficient of determination was moderate (R2 < 0.5) in most cases in which there was a significant regression, with some of the higher values only explaining 55, 53, 50, 45, and 42% of the variability, as was the case with MB, pH, PF, and ammoniacal nitrogen, respectively. This suggests that the inclusion of TD may have an influence on the variability of the responses but is not the only factor that explains the changes in the variables.

5. Conclusions

The replacement of tropical grass hay with TD improved the degradability of the diet at early incubation times and had no effects on fermentation kinetics, the volume of gas produced, nor CH4 production in vitro. The inclusion of TD was shown to have a positive impact on microbial protein synthesis, which may be related to greater microbial efficiency as a consequence of an increase in the substrate’s quality. Based on the linearity of these responses, inclusions over 400 g kg−1 DM of TD (replacing only forage) may offer the most promising opportunity to observe its effects on animal performance. Further studies evaluating this inclusion in vivo are needed to further corroborate these results.

Author Contributions

Conceptualization, Â.M.Q.L., A.L.A. and R.M.M.; Data curation, S.P.-M., A.L.A. and R.M.M.; Formal analysis, S.P.-M.; Funding acquisition, Â.M.Q.L., H.L., A.L.A. and R.M.M.; Investigation, S.P.-M.; Methodology, S.P.-M., V.S.O. and R.M.M.; Project administration, A.L.A. and R.M.M.; Resources, Â.M.Q.L., H.L., A.L.A. and R.M.M.; Supervision, Â.M.Q.L., H.L., A.L.A. and R.M.M.; Writing—original draft, S.P.-M.; Writing—review and editing, S.P.-M., V.S.O., P.d.M.T.L., Â.M.Q.L., H.L., A.L.A. and R.M.M. All authors have read and agreed to the published version of the manuscript.

Funding

The authors would like to thank Coordenação de Aperfeiçoamento de Pessoal de Nível Superior (CAPES) (no 88882.380650/2019-0) for the financial and scholarship support. FAPEMIG, CNPq and IAEA projects CRP D31031 and RC 20760-RO.

Institutional Review Board Statement

All the procedures involving the use of animals in this study were approved by the Ethics Committee on Use of Animals of the Escola Superior de Agricultura “Luiz de Queiroz”—CEUA-ESALQ/USP (Protocol 008-2018).

Data Availability Statement

The data presented in this study are available on request from the corresponding author.

Conflicts of Interest

The authors declare no conflict of interest.

References

  1. Poore, J.; Nemecek, T. Reducing Food’s Environmental Impacts through Producers and Consumers. Science 2018, 360, 987–992. [Google Scholar] [CrossRef]
  2. Gerber, P.J.; Steinfeld, H.; Henderson, B.; Mottet, A.; Opio, C.; Dijkman, J.; Falcucci, A.; Tempio, G. Tackling Climate Change through Livestock—A Global Assessment of Emissions and Mitigation Opportunities; Food and Agriculture Organization of the United Nations (FAO): Rome, Italy, 2013; ISBN 9789251079201. [Google Scholar]
  3. Shukla, P.R.; Skea, J.; Buendia, E.C.; Masson-Delmotte, V.; Pörtner, H.-O.; Roberts, D.C.; Zhai, P.; Slade, R.; Connors, S.; van Diemen, R.; et al. (Eds.) IPCC Climate Change and Land: An IPCC Special Report on Climate Change, Desertification, Land Degradation, Sustainable Land Management, Food Security, and Greenhouse Gas Fluxes in Terrestrial Ecosystems; 2019; ISBN 9789291691548. Available online: https://www.ipcc.ch/srccl/ (accessed on 10 October 2023).
  4. Herrero, M.; Henderson, B.; Havlík, P.; Thornton, P.K.; Conant, R.T.; Smith, P.; Wirsenius, S.; Hristov, A.N.; Gerber, P.; Gill, M.; et al. Greenhouse Gas Mitigation Potentials in the Livestock Sector. Nat. Clim. Chang. 2016, 6, 452–461. [Google Scholar] [CrossRef]
  5. Zhang, L.; Tian, H.; Shi, H.; Pan, S.; Chang, J.; Dangal, S.R.S.; Qin, X.; Wang, S.; Tubiello, F.N.; Canadell, J.G.; et al. A 130-year Global Inventory of Methane Emissions from Livestock: Trends, Patterns, and Drivers. Glob. Chang. Biol. 2022, 28, 5142–5158. [Google Scholar] [CrossRef] [PubMed]
  6. Makkar, H. Recent Advances in the in Vitro Gas Method for Evaluation of Nutritional Quality of Feed Resoures. In Assessing Quality and Safety of Animal Feeds; FAO, Animal Production and Health; FAO: Rome, Italy, 2004; Volume 160, p. 155. ISBN 9251050465. Available online: https://www.fao.org/publications/card/en/c/85887fc8-94ee-5bc0-ba37-6e0c30cb9d5b (accessed on 10 October 2023).
  7. Maurício, R.; Ribeiro, R.S.; Silveira, S.R.; Silva, P.L.; Calsavara, L.; Pereira, L.G.R.; Paciullo, D.S. Tithonia diversifolia for Ruminant Nutrition. Trop. Grassl.-Forrajes Trop. 2014, 2, 82–84. [Google Scholar] [CrossRef]
  8. Calsavara, L.H.F.; Ribeiro, R.S.; Silveira, S.R.; Delarota, G.; Freitas, D.S.; Sacramento, J.P.; Paciullo, D.S.C.; Maurício, R.M. Potencial Forrageiro Da Tithonia diversifolia Para Alimentação de Ruminantes. Livest. Res. Rural Dev. 2016, 28, 17. [Google Scholar]
  9. Rodríguez García, I. Potencialidades de Tithonia diversifolia (Hemsl.) Gray En La Alimentación Animal. Livest. Res. Rural Dev. 2017, 29, 1–11. [Google Scholar]
  10. Mahecha, L.; Rosales, M. Valor Nutricional Del Follaje de Botón de Oro (Tithonia diversifolia [Hemsl]. Gray), En La Producción Animal En El Trópico. Livest. Res. For. Rural. Dev. 2005, 17, 1. [Google Scholar]
  11. Van Sao, N.; Mui, N.T.; van Binh, D. Biomass Production of Tithonia diversifolia (Wild Sunflower), Soil Improvement on Sloping Land and Use as High Protein Foliage for Feeding Goats. Livest. Res. Rural Dev. 2010, 8, 22. [Google Scholar]
  12. Verdecia, D.M.; Ramirez, J.L.; Leonard, I.; Alvarez, Y.; Bazán, Y.; Bodas, R.; Andrés, S.; Alvarez, J.; Giraldez, F.; Lopez, S. Nutritive Value of the Tithonia diversifolia in a Location of Valle Del Cauto. Rev. Electron. Vet. 2011, 12. Available online: https://digital.csic.es/handle/10261/108935 (accessed on 10 October 2023).
  13. Porsavatdy, P.; Preston, T.R.; Leng, R.A. Effect on Feed Intake, Digestibility, N Retention and Methane Emissions in Goats of Supplementing Foliages of Cassava (Manihot Esculenta Crantz) and Tithonia diversifolia with Water spinach (Ipomoea aquatica). Livest. Res. Rural Dev. 2016, 28. Available online: http://www.lrrd.org/lrrd28/5/phon28072.html (accessed on 10 October 2023).
  14. Cardona Iglesias, J.L.; Mahecha Ledesma, L.; Angulo Arizala, J.; Cardona, J.L.; Mahecha, L.; Angulo, J.; Cardona Iglesias, J.L.; Mahecha Ledesma, L.; Angulo Arizala, J. Efecto Sobre La Fermentación in Vitro de Mezclas de Tithonia diversifolia, Cenchrus Clandestinum y Grasas Poliinsaturadas. Agron. Mesoam. 2017, 28, 405. [Google Scholar] [CrossRef]
  15. Rutunga, V.; Karanja, N.K.; Gachene, C.K.K.; Palm, C. Biomass Production and Nutrient Accumulation by Tephrosia Vogelii (Hemsley) A. Gray and Tithonia diversifolia Hook F. Fallows during the Six-Month Growth Period at Maseno, Western Kenya. Biotechnol. Agron. Social. Environ. 1999, 3, 237–246. [Google Scholar]
  16. Guatusmal-Gelpud, C.; Escobar-Pachajoa, L.D.; Meneses-Buitrago, D.H.; Cardona-Iglesias, J.L.; Castro-Rincón, E. Producción y Calidad de Tithonia diversifolia y Sambucus Nigra En Trópico Altoandino Colombiano. Agron. Mesoam. 2020, 31, 193–208. [Google Scholar] [CrossRef]
  17. Mahecha, L.; Escobar, J.P.; Suarez, J.F.; Restrepo, L.F. Evaluación Del Uso de Tithonia diversifolia (Hemsl.) A. Gray ASTERACEAE, Como Suplemento Forrajero de Vacas Cruzadas. In Ganadería del Futuro: Investigación Para el Desarrollo; Murgueitio, E., Cuartas, C.A., Naranjo, J.F., Eds.; CIPAV: Cali, Colombia, 2008; p. 490. ISBN 978-958-9386-55-2. [Google Scholar]
  18. Rivera, J.E.; Cuartas, C.A.; Naranjo, J.F.; Tafur, O.; Hurtado, E.A.; Arenas, F.A.; Chará, J.; Murgueitio, E. Efecto de La Oferta y El Consumo de Tithonia diversifolia En Un Sistema Silvopastoril Intensivo (SSPi), En La Calidad y Productividad de Leche Bovina En El Piedemonte Amazónico Colombiano. Livest. Res. Rural Dev. 2015, 27. Available online: http://www.lrrd.org/lrrd27/10/rive27189.html (accessed on 10 October 2023).
  19. Ribeiro, R.S.; Terry, S.A.; Sacramento, J.P.; Silveira, S.R.E.; Bento, C.B.P.; da Silva, E.F.; Mantovani, H.C.; da Gama, M.A.S.; Pereira, L.G.R.; Tomich, T.R.; et al. Tithonia diversifolia as a Supplementary Feed for Dairy Cows. PLoS ONE 2016, 11, e0165751. [Google Scholar] [CrossRef]
  20. Pazla, R.; Jamarun, N.; Elihasridas, E.; Arief, A.; Yanti, G.; Ikhlas, Z. The Impact of Replacement of Concentrates with Fermented Tithonia (Tithonia diversifolia) and Avocado Waste (Persea Americana Miller) in Fermented Sugarcane Shoots (Saccharum Officinarum) Based Rations on Consumption, Digestibility, and Production Perform. Adv. Anim. Vet. Sci. 2023, 11, 394–403. [Google Scholar] [CrossRef]
  21. Garcia, R.; Guitierrez, D.; Chongo, B.; Gutierrez, O. Feeding of Cattle, Sheep and Goats with Tithonia diversifolia in Latin America and the Caribbean. In Mulberry, Moringa and Tithonia in Animal Feed, and Other Uses. Results in Latin America and the Caribbean; Savon Valdes, L.L., Guttierrez Borroto, O., Febles Perez, G., Eds.; FAO, ICA CUBA: San José de las Lajas, Cuba, 2017; pp. 237–248. [Google Scholar]
  22. Blümmel, M.; Makkar, H.P.S.; Becker, K. In Vitro Gas Production: A Technique Revisited. J. Anim. Physiol. Anim. Nutr. 1997, 77, 24–34. [Google Scholar] [CrossRef]
  23. Horwitz, W.; Latimer, G.W. (Eds.) AOAC Official Methods of Analysis of AOAC International, 18th ed.; Association of Official Analytical Chemists: Gaithersburg, MD, USA, 2011; ISBN 093558482X 9780935584820. [Google Scholar]
  24. van Soest, P.J.J.; Robertson, J.B.B.; Lewis, B.A.A. Methods for Dietary Fiber, Neutral Detergent Fiber, and Nonstarch Polysaccharides in Relation to Animal Nutrition. J. Dairy Sci. 1991, 74, 3583–3597. [Google Scholar] [CrossRef]
  25. Mertens, D.R.; Allen, M.; Carmany, J.; Clegg, J.; Davidowicz, A.; Drouches, M.; Frank, K.; Gambin, D.; Garkie, M.; Gildemeister, B.; et al. Gravimetric Determination of Amylase-Treated Neutral Detergent Fiber in Feeds with Refluxing in Beakers or Crucibles: Collaborative Study. J. AOAC Int. 2002, 85, 1217–1240. [Google Scholar]
  26. Makkar, H. Measurement of Total Phenolics and Tannins Using Folin-Ciocalteu Method. In Quantification of Tannins in Tree and Shrub Foliage; Springer: Dordrecht, The Netherlands, 2003; pp. 49–51. [Google Scholar]
  27. Lima, P.M.T.; Moreira, G.D.; Sakita, G.Z.; Natel, A.S.; Mattos, W.T.; Gimenes, F.M.A.; Gerdes, L.; McManus, C.; Abdalla, A.L.; Louvandini, H. Nutritional Evaluation of the Legume Macrotyloma Axillare Using in Vitro and in Vivo Bioassays in Sheep. J. Anim. Physiol. Anim. Nutr. 2018, 102, e669–e676. [Google Scholar] [CrossRef]
  28. Menke, K.H.; Steingass, H. Estimation of the Energetic Feed Value Obtained from Chemical Analysis and in Vitro Gas Production Using Rumen Fluid. Anim. Res. Dev. 1988, 28, 7–55. [Google Scholar]
  29. Mauricio, R.M.; Mould, F.L.; Dhanoa, M.S.; Owen, E.; Channa, K.S.; Theodorou, M.K. A Semi-Automated in Vitro Gas Production Technique for Ruminant Feedstuff Evaluation. Anim. Feed. Sci. Technol. 1999, 79, 321–330. [Google Scholar] [CrossRef]
  30. Bueno, I.C.S.; Cabral Filho, S.L.S.; Gobbo, S.P.; Louvandini, H.; Vitti, D.M.S.S.; Abdalla, A.L. Influence of Inoculum Source in a Gas Production Method. Anim. Feed. Sci. Technol. 2005, 123–124, 95–105. [Google Scholar] [CrossRef]
  31. Longo, C.; Bueno, I.C.S.; Nozella, E.F.; Goddoy, P.B.; Cabral Filho, S.L.S.; Abdalla, A.L. The Influence of Head-Space and Inoculum Dilution on in Vitro Ruminal Methane Measurements. Int. Congr. Ser. 2006, 1293, 62–65. [Google Scholar] [CrossRef]
  32. Wang, M.; Tang, S.X.; Tan, Z.L. Modeling in Vitro Gas Production Kinetics: Derivation of Logistic-Exponential (LE) Equations and Comparison of Models. Anim. Feed. Sci. Technol. 2011, 165, 137–150. [Google Scholar] [CrossRef]
  33. Goering, H.K.; van Soest, P.J. Forage Fiber Analyses; U.S. Department of Agriculture: Washington, DC, USA, 1975; pp. 387–598.
  34. Preston, T.R.; Leng, R.A. Matching Ruminant Production Systems with Available Resources in the Tropics and Sub-Tropics; Penanmbul Books: Armidale, AU, USA, 1987; ISBN 0958829012. [Google Scholar]
  35. Bergman, E.N.; Reid, R.S.; Murray, M.G.; Brockway, J.M.; Whitelaw, F.G. Interconversions and Production of Volatile Fatty Acids in the Sheep Rumen. Biochem. J. 1965, 97, 53. [Google Scholar] [CrossRef]
  36. Bergman, E.N. Energy Contributions of Volatile Fatty Acids from the Gastrointestinal Tract in Various Species. Physiol. Rev. 1990, 70, 567–590. [Google Scholar] [CrossRef]
  37. R Core Team. R: A Language and Enviroment for Statistical Computing; R Core Team: Vienna, Austria, 2021; Available online: https://www.R-project.org/ (accessed on 10 October 2023).
  38. Kuznetsova, A.; Brockhoff, P.B.; Christensen, R.H.B. LmerTest Package: Tests in Linear Mixed Effects Models. J. Stat. Softw. 2017, 82, 1–26. [Google Scholar] [CrossRef]
  39. Lenth, R. emmeans: Estimated Marginal Means, aka Least-Squares Means. R package version 1.8.8. 2021. Available online: https://CRAN.R-project.org/package=emmeans (accessed on 10 October 2023).
  40. Hothorn, T.; Bretz, F.; Westfall, P. Simultaneous Inference in General Parametric Models. Biom. J. 2008, 50, 346–363. [Google Scholar] [CrossRef]
  41. Wei, T.; Simko, V. R Package “Corrplot”: Visualization of a Correlation Matrix 2021. Available online: https://github.com/taiyun/corrplot (accessed on 10 October 2023).
  42. Wickham, H. Ggplot2; Springer International Publishing: Cham, Switzerland, 2016; ISBN 978-3-319-24275-0. [Google Scholar]
  43. Getachew, G.; Blümmel, M.; Makkar, H.P.S.; Becker, K. In Vitro Gas Measuring Techniques for Assessment of Nutritional Quality of Feeds: A Review. Anim. Feed. Sci. Technol. 1998, 72, 261–281. [Google Scholar] [CrossRef]
  44. France, J.; Lopez, S.; Kebreab, E.; Bannink, A.; Dhanoa, M.S.; Dijkstra, J. A General Compartmental Model for Interpreting Gas Production Profiles. Anim. Feed. Sci. Technol. 2005, 123–124, 473–485. [Google Scholar] [CrossRef]
  45. Adesogan, A.T. What Are Feeds Worth? A Critical Evaluation of Selected Nutritive Value Methods. In Proceedings of the 13th Annual Florida Ruminant Nutrition Symposium, Gainesville, FL, USA, 10–11 January 2002; pp. 33–47. Available online: https://animal.ifas.ufl.edu/apps/dairymedia/rns/2002/adesogan.pdf (accessed on 10 October 2023).
  46. Firsoni, F.; Sasongko, W.T.; Wahyono, T. Nutritive Value and Fermentation Characteristics of Tithonia diversifolia and Moringa Oleifera Evaluated by Gas Production Technique in Vitro. In Proceedings of the International Conference on Improving Tropical Animal Production for Food Security (ITAPS 2021), Kendari, Indonesia, 20–21 November 2021; Atlantis Press: Amsterdam, The Netherlands, 2022. [Google Scholar] [CrossRef]
  47. Rivera, J.; Chará, J.; Arango, J.; Barahona, R. Effect of Different Genotypes of Tithonia diversifolia on Fermentation of Feed Mixtures with Urochloa Brizantha Cv. Marandú. Crop Pasture Sci. 2021, 72, 850. [Google Scholar] [CrossRef]
  48. Makkar, H. Effects and Fate of Tannins in Ruminant Animals, Adaptation to Tannins, and Strategies to Overcome Detrimental Effects of Feeding Tannin-Rich Feeds. Small Rumin. Res. 2003, 49, 241–256. [Google Scholar] [CrossRef]
  49. Naumann, H.D.; Tedeschi, L.O.; Zeller, W.E.; Huntley, N.F. The Role of Condensed Tannins in Ruminant Animal Production: Advances, Limitations and Future Directions. Rev. Bras. De Zootec. 2017, 46, 929–949. [Google Scholar] [CrossRef]
  50. Frutos, P.; Hervás, G.; Ramos, G.; Giráldez, F.J.; Mantecón, A.R. Condensed Tannin Content of Several Shrub Species from a Mountain Area in Northern Spain, and Its Relationship to Various Indicators of Nutritive Value. Anim. Feed. Sci. Technol. 2002, 95, 215–226. [Google Scholar] [CrossRef]
  51. Siwaporn, P.; Anan, P.; Rayudika Aprilia Patindra, P.; Pramote, P. Protein-Binding Affinity of Various Condensed Tannin Molecular Weights from Tropical Leaf Peel. J. Appl. Pharm. Sci. 2021, 11, 114–120. [Google Scholar] [CrossRef]
  52. Mueller-Harvey, I. Unravelling the Conundrum of Tannins in Animal Nutrition and Health. J. Sci. Food Agric. 2006, 86, 2010–2037. [Google Scholar] [CrossRef]
  53. Ban, C.; Paengkoum, S.; Yang, S.; Tian, X.; Thongpea, S.; Purba, R.A.P.; Paengkoum, P. Feeding Meat Goats Mangosteen (Garcinia mangostana L.) Peel Rich in Condensed Tannins, Flavonoids, and Cinnamic Acid Improves Growth Performance and Plasma Antioxidant Activity under Tropical Conditions. J. Appl. Anim. Res. 2022, 50, 307–315. [Google Scholar] [CrossRef]
  54. Getachew, G.; Makkar, H.P.S.; Becker, K. Tropical Browses: Contents of Phenolic Compounds, in Vitro Gas Production and Stoichiometric Relationship between Short Chain Fatty Acid and in Vitro Gas Production. J. Agric. Sci. 2002, 139, 341–352. [Google Scholar] [CrossRef]
  55. Delgado, D.C.; Galindo, J.; González, R.; González, N.; Scull, I.; Dihigo, L.; Cairo, J.; Aldama, A.I.; Moreira, O. Feeding of Tropical Trees and Shrub Foliages as a Strategy to Reduce Ruminal Methanogenesis: Studies Conducted in Cuba. Trop. Anim. Health Prod. 2012, 44, 1097–1104. [Google Scholar] [CrossRef]
  56. Galindo, J.; Gonzales, N.; Marrero, Y.; Sosa, A.; Ruiz, T.; Febles, G.; Torres, V.; Aldana, A.I.; Achang, G.; Moreira, O.; et al. Effect of Tropical Plant Foliage on the Control of Methane Production and in Vitro Ruminal Protozoa Population. Cuba. J. Agric. Sci. 2014, 48, 359–364. [Google Scholar]
  57. Smith, A.H.; Zoetendal, E.; Mackie, R.I. Bacterial Mechanisms to Overcome Inhibitory Effects of Dietary Tannins. Microb. Ecol. 2005, 50, 197–205. [Google Scholar] [CrossRef]
  58. Asres, K.; Bucar, F.; Knauder, E.; Yardley, V.; Kendrick, H.; Croft, S.L. In Vitro Antiprotozoal Activity of Extract and Compounds from the Stem Bark of Combretum Molle. Phytother. Res. 2001, 15, 613–617. [Google Scholar] [CrossRef] [PubMed]
  59. Makkar, H. Treatment of Plant Material, Extraction of Tannins, and an Overview of Tannin Assays Presented in the Manual. In Quantification of Tannins in Tree and Shrub Foliage; Springer: Dordrecht, The Netherlands, 2003; pp. 43–48. [Google Scholar]
  60. Terry, S.A.; Ribeiro, R.S.; Freitas, D.S.; Delarota, G.D.; Pereira, L.G.R.R.; Tomich, T.R.; Maurício, R.M.; Chaves, A.V. Effects of Tithonia diversifolia on in Vitro Methane Production and Ruminal Fermentation Characteristics. Anim. Prod. Sci. 2016, 56, 437–441. [Google Scholar] [CrossRef]
  61. Hill, J.; McSweeney, C.; Wright, A.D.G.; Bishop-Hurley, G.; Kalantar-zadeh, K. Measuring Methane Production from Ruminants. Trends Biotechnol. 2016, 34, 26–35. [Google Scholar] [CrossRef]
  62. Greening, C.; Geier, R.; Wang, C.; Woods, L.C.; Morales, S.E.; McDonald, M.J.; Rushton-Green, R.; Morgan, X.C.; Koike, S.; Leahy, S.C.; et al. Diverse Hydrogen Production and Consumption Pathways Influence Methane Production in Ruminants. ISME J. 2019, 13, 2617–2632. [Google Scholar] [CrossRef]
  63. Morgavi, D.P.; Forano, E.; Martin, C.; Newbold, C.J. Microbial Ecosystem and Methanogenesis in Ruminants. Animal 2010, 4, 1024–1036. [Google Scholar] [CrossRef]
  64. Dijkstra, J. Production and Absorption of Volatile Fatty Acids in the Rumen. Livest. Prod. Sci. 1994, 39, 61–69. [Google Scholar] [CrossRef]
  65. Pazla, R.; Jamarun, N.; Zain, M. Arief Microbial Protein Synthesis and in Vitro Fermentability of Fermented Oil Palm Fronds by Phanerochaete chrysosporium in Combination with Tithonia (Tithonia diversifolia) and Elephant grass (Pennisetum purpureum). Pak. J. Nutr. 2018, 17, 462–470. [Google Scholar] [CrossRef]
  66. Jamarun, N.; Pazla, R.; Zain, M. Arief Comparison of in Vitro Digestibility and Rumen Fluid Characteristics between the Tithonia (Tithonia diversifolia) with Elephant grass (Pennisetum purpureum). IOP Conf. Ser. Earth Environ. Sci. 2019, 287, 012019. [Google Scholar] [CrossRef]
  67. Rivera, J.E.; Naranjo, J.F.; Cuartas, C.A.; Arenas, F.A. Fermentación in Vitro y Composición Química de Algunos Forrajes y Dietas Ofrecidas Bajo Un Sistema Silvopastoril En El Trópico de Altura. Livest. Res. for Rural Dev. 2013, 25. Available online: http://www.lrrd.org/lrrd25/10/rive25174.htm (accessed on 10 October 2023).
  68. Andries, J.I.; Buysse, F.X.; de Brabander, D.L.; Cottyn, B.G. Isoacids in Ruminant Nutrition: Their Role in Ruminal and Intermediary Metabolism and Possible Influences on Performances—A Review. Anim. Feed. Sci. Technol. 1987, 18, 169–180. [Google Scholar] [CrossRef]
  69. Liu, Q.; Wang, C.; Huang, Y.X.; Dong, K.H.; Yang, W.Z.; Zhang, S.L.; Wang, H. Effects of Isovalerate on Ruminal Fermentation, Urinary Excretion of Purine Derivatives and Digestibility in Steers. J. Anim. Physiol. Anim. Nutr. 2009, 93, 716–725. [Google Scholar] [CrossRef] [PubMed]
  70. Liu, Q.; Wang, C.; Yang, W.Z.; Zhang, B.; Yang, X.M.; He, D.C.; Zhang, P.; Dong, K.H.; Huang, Y.X. Effects of Isobutyrate on Rumen Fermentation, Lactation Performance and Plasma Characteristics in Dairy Cows. Anim. Feed. Sci. Technol. 2009, 154, 58–67. [Google Scholar] [CrossRef]
  71. Liu, Q.; Wang, C.; Pei, C.X.; Li, H.Y.; Wang, Y.X.; Zhang, S.L.; Zhang, Y.L.; He, J.P.; Wang, H.; Yang, W.Z.; et al. Effects of Isovalerate Supplementation on Microbial Status and Rumen Enzyme Profile in Steers Fed on Corn Stover Based Diet. Livest. Sci. 2014, 161, 60–68. [Google Scholar] [CrossRef]
  72. Liu, Q.; Wang, C.; Huang, Y.; Dong, K.; Wang, H.; Yang, W. Effects of Isobutyrate on Rumen Fermentation, Urinary Excretion of Purine Derivatives and Digestibility in Steers. Arch. Anim. Nutr. 2008, 62, 377–388. [Google Scholar] [CrossRef]
  73. Liu, Q.; Wang, C.; Zhang, Y.L.; Pei, C.X.; Zhang, S.L.; Wang, Y.X.; Zhang, Z.W.; Yang, W.Z.; Wang, H.; Guo, G.; et al. Effects of Isovalerate Supplementation on Growth Performance and Ruminal Fermentation in Pre- and Post-Weaning Dairy Calves. J. Agric. Sci. 2016, 154, 1499–1508. [Google Scholar] [CrossRef]
  74. Roman-Garcia, Y.; Mitchell, K.E.; Lee, C.; Socha, M.T.; Park, T.; Wenner, B.A.; Firkins, J.L. Conditions Stimulating Neutral Detergent Fiber Degradation by Dosing Branched-Chain Volatile Fatty Acids. III: Relation with Solid Passage Rate and PH on Prokaryotic Fatty Acid Profile and Community in Continuous Culture. J. Dairy Sci. 2021, 104, 9868–9885. [Google Scholar] [CrossRef]
  75. Roman-Garcia, Y.; Mitchell, K.E.; Denton, B.L.; Lee, C.; Socha, M.T.; Wenner, B.A.; Firkins, J.L. Conditions Stimulating Neutral Detergent Fiber Degradation by Dosing Branched-Chain Volatile Fatty Acids. II: Relation with Solid Passage Rate and PH on Neutral Detergent Fiber Degradation and Microbial Function in Continuous Culture. J. Dairy Sci. 2021, 104, 9853–9867. [Google Scholar] [CrossRef]
  76. Wang, C.; Liu, Q.; Zhang, Y.L.; Pei, C.X.; Zhang, S.L.; Wang, Y.X.; Yang, W.Z.; Bai, Y.S.; Shi, Z.G.; Liu, X.N. Effects of Isobutyrate Supplementation on Ruminal Microflora, Rumen Enzyme Activities and Methane Emissions in Simmental Steers. J. Anim. Physiol. Anim. Nutr. 2015, 99, 123–131. [Google Scholar] [CrossRef]
  77. Oluwasola, T.A.; Dairo, F.A.S. Proximate Composition, Amino Acid Profile and Some Anti-Nutrients of Tithonia diversifolia Cut at Two Different Times. Afr. J. Agric. Res. 2016, 11, 3659–3663. [Google Scholar] [CrossRef]
  78. Fasuyi, O.A.; Ibitayo, F.J. Preliminary Analyses and Amino Acid Profile of Wild Sunflower (Tithonia diversifolia) Leaves. Int. J. Biol. Chem. Sci. 2011, 5, 164–170. [Google Scholar] [CrossRef]
  79. Akanmu, A.M.; Hassen, A.; Adejoro, F.A. Gas Production, Digestibility and Efficacy of Stored or Fresh Plant Extracts to Reduce Methane Production on Different Substrates. Animals 2020, 10, 146. [Google Scholar] [CrossRef] [PubMed]
  80. Russell, J.B.; O’Connor, J.D.; Fox, D.G.; Van Soest, P.J.; Sniffen, C.J. A Net Carbohydrate and Protein System for Evaluating Cattle Diets: I. Ruminal Fermentation. J. Anim. Sci. 1992, 70, 3551–3561. [Google Scholar] [CrossRef]
  81. Slyter, L.L.; Satter, L.D.; Dinius, D.A. Effect of Ruminal Ammonia Concentration on Nitrogen Utilization by Steers. J. Anim. Sci. 1979, 48, 906–912. [Google Scholar] [CrossRef]
  82. Hristov, A.N.; Ropp, J.K. Effect of Dietary Carbohydrate Composition and Availability on Utilization of Ruminal Ammonia Nitrogen for Milk Protein Synthesis in Dairy Cows. J. Dairy Sci. 2003, 86, 2416–2427. [Google Scholar] [CrossRef] [PubMed]
  83. Galindo, J.; Gonzales, N.; Sosa, A.; Ruiz, T.; Torres, V.; Aldana, A.I.; Diaz, H.; Moreira, O.; Sarduy, L.; Noda, A.C. Efecto de Tithonia diversifolia (Hemsl.) A. Gray (Botón de Oro) En La Poblacion de Protozoos y Metanogénos Ruminales En Condiciones in Vitro. Rev. Cuba. Cienc. Agrícola 2011, 45, 33–37. [Google Scholar]
  84. Galindo, J.; González, N.; Scull, I.; Marrero, Y.; Sosa, A.; Aldana, A.I.; Moreira, O.; Delgado, D.; Ruiz, T.; Febles, G.; et al. Efecto de Samanea Saman (Jacq.) Merr., Albizia lebbeck (L.) Benth y Tithonia diversifolia (Hemsl.) Gray (Material Vegetal 23) En La Población de Metanógenos y En La Ecología Microbiana Ruminal. Rev. Cuba. Cienc. Agric. 2012, 46, 273–278. [Google Scholar]
Figure 1. Gas production profiles of four diets with increasing levels of TD inclusion. Lines are the model (30) estimated values; points are the observed values.
Agronomy 13 02768 g001
Figure 2. NDF degradability and in vitro gas production relationship of diets with TD inclusion at five incubation times.
Agronomy 13 02768 g002
Figure 3. Correlation plot for variables measured in the in vitro gas production. On the right axis is the scale for the correlation coefficient according to color. Blank squares indicate that the correlation between the variables was not significant (p > 0.05).
Agronomy 13 02768 g003
Table 1. Chemical composition of diet ingredients (g kg−1).
Nutrient ContentSoybean MealMaize GrainTifton 85 HayT. diversifolia Hay
Dry matter897.89887.00903.04887.07
Crude protein479.23127.14140.4578.84
Neutral detergent fiber a150.00111.48735.81677.71
Acid detergent fiber b110.9634.20360.23566.62
Total digestible nutrients832.25830.32550.15630.21
Ash69.1912.7998.96111.35
Total phenolic compounds c--7.143.94
Total tannins c--3.841.92
Condensed tannins d--0.180.19
a NDF—assayed with a heat-stable amylase and expressed exclusive of residual ash. b ADF—assayed exclusive of residual ash. c Values expressed in equivalent grams of tannic acid per kilogram of dry matter. d Values expressed in equivalent grams of leucocyanidin per kilogram of dry matter.
Table 3. Estimated fermentation kinetic parameters for four diets containing increasing levels of Tithonia diversifolia.
ParameterTD0TD9TD27TD45SEp-ValueRegression
LR2
Vf (mL g−1 OM)168.8167.7169.3167.86.180.90740.9754<0.01
k (h−1)0.0320.0330.0360.0380.00170.05320.09580.19
L (h)0.410.320.420.440.0410.18430.7652<0.01
T0.5 (h)21.721.721.120.80.490.24830.18240.12
V0.5 (mL g−1 OM)84.483.884.683.93.090.90740.9754<0.01
μ0.5 (h−1)0.0320.0320.0340.035 *0.00070.03660.11100.17
V96 (mL g−1 OM)161.3160.2163.0162.56.010.84650.8603<0.01
Vf—final asymptotic volume (mL per gram of incubated organic matter); k—fractional gas production rate; L—lagtime; T0.5—time at half the maximum gas production (half-time); V0.5—gas volume at half-time (mL per gram of incubated organic matter); μ0.5—fractional gas production rate at half-time. * Within the same line, differs significantly from TD0 using orthogonal contrasts at p < 0.05; SE—standard error; L—p-value for the linear response; R2—determination coefficient.
Table 4. In vitro gas production, in vitro degradability of organic matter, and in vitro methane production of four diets with increasing levels of TD at five incubation times.
Incubation Time (h)TD0TD9TD27TD45SEp-ValueRegression
LQR2
in vitro gas production (mL g −1 DOM)
22.192.411.641.832.8230.15370.1330.290-
69.249.5110.5410.800.18190.0060.1230.19
1020.7917.9418.4918.530.11360.1650.198-
2448.3341.7143.8144.180.51250.5550.468-
96104.46101.05106.9391.520.10540.4590.525-
in vitro degradability of organic matter (g kg −1)
2332.34323.08329.00368.4916.4120.07490.0280.1390.16
6370.20380.89398.13426.49 *0.01400.0090.0840.20
10448.67417.56437.03470.250.10680.0770.0330.21
24529.39508.12516.16547.760.25010.3270.146-
96686.77687.56703.20669.550.33440.4520.218-
in vitro methane production (mL g −1 DOM)
20.0540.0290.0560.0490.31550.93850.5710.768-
60.3870.2970.3350.3630.78550.9830.767-
101.5720.9421.2731.2510.09280.6620.435-
244.1622.980 *3.6493.5750.00960.6830.429-
965.5494.670 *4.9584.8370.03170.3400.428-
* Within the same row, differs significantly from 0%TD by orthogonal contrasts at p < 0.05; SE—standard error; L, Q—p-values for linear and quadratic responses, respectively; R2—determination coefficient. In vitro gas and methane production expressed as milliliters of gas per gram of degraded organic matter.
Table 5. SCFA concentration and pH values of four diets with increasing levels of TD at 5 incubation times.
Incubation Time (h)TD0TD9TD27TD45SEp-ValueRegression
LQR2
Total SCFA (μmol mL−1)
273.6975.2071.9067.92 *4.3210.00870.0490.1110.12
685.9985.6984.7877.72 *0.00150.0680.128-
10100.0998.5395.0689.50 *0.00030.0080.0310.21
24125.53125.38122.42114.75 *0.00300.0470.1120.13
96169.64171.59167.91162.670.19190.0980.198-
Acetate (mol 100 mol−1)
269.0668.2168.1768.03 *0.3730.03700.3210.525-
664.8863.8563.31 *64.230.01270.5090.215-
1060.2159.4759.8260.500.21970.5700.556-
2454.4653.9653.9554.240.46350.8940.859-
9649.6749.5749.8450.870.10520.1650.299-
Propionate (mol 100 mol−1)
216.0016.4715.9715.120.740.2090.1590.241-
618.4719.0018.9817.410.1670.1250.0520.18
1021.6222.1121.3119.910.0540.0060.0080.29
2424.8425.8125.0123.640.1680.0270.0130.26
9626.4427.4026.5725.060.1290.0230.0130.26
Butyrate (mol 100 mol−1)
211.5311.5711.7711.910.4940.5320.4340.741-
612.9112.9613.3113.040.4860.7230.813-
1014.0913.8714.2814.060.6560.8230.957-
2415.7514.9615.7216.370.1530.1330.165-
9616.0015.0616.0516.150.0900.2680.400-
A:P
24.344.204.324.520.1330.2410.3650.503-
63.523.43.363.690.2570.3180.116-
102.782.722.813.040.1000.0220.0310.21
242.192.092.172.300.4540.1310.124-
961.881.811.871.970.5090.0240.0180.24
Valerate (mol 100 mol−1)
20.880.920.941.06 *0.0830.0070.0040.0140.24
61.231.261.261.340.1110.1020.230-
101.461.511.441.490.4970.8750.961-
241.921.941.861.870.4610.4460.747-
963.253.012.85 *2.74 *0.0140.0070.0190.22
Isovalerate (mol 100 mol−1)
22.122.292.432.76 *0.2310.019<0.001<0.0010.43
62.222.452.502.95 *0.016<0.001<0.0010.45
102.262.542.523.08 *0.012<0.001<0.0010.38
242.652.922.943.190.075<0.0010.0040.32
963.814.033.904.030.5610.2730.542-
Isobutyrate (mol 100 mol−1)
20.420.540.711.80 *0.4300.016<0.001<0.0010.52
60.290.480.64 *1.62 *0.029<0.001<0.0010.56
100.380.500.621.34 *0.0140.0020.0060.29
240.370.420.521.02 *0.034<0.0010.0050.30
960.810.930.801.810.2410.0470.0570.12
pH
26.86.86.9 *7.0 *0.040.005<0.001<0.0010.39
66.76.86.9 *7.0 *0.005<0.001<0.0010.53
106.76.86.76.9 *0.008<0.0010.0070.26
246.36.46.46.50.0640.3450.345-
966.36.46.46.5 *0.0080.0040.0180.21
* Within the same row, differs significantly from TD0 by orthogonal contrasts at p < 0.05; SE—standard error; Linear, Quadratic—p-value for linear and quadratic responses, respectively; R2—determination coefficient.
Table 6. Ammonia nitrogen, partitioning factor, and microbial biomass of four diets with increasing levels of TD at 5 incubation times.
Incubation Time (h)TD0TD9TD27TD45SEp-ValueRegression
LQR2
Ammonia nitrogen (mg dL−1)
221.6122.1422.5719.022.0450.2520.2850.284-
623.2723.9423.5022.730.7530.5900.739-
1029.2428.6125.0623.55 *0.032<0.001<0.0010.45
2434.8036.9931.6731.810.0930.0140.0530.18
9654.7054.9853.8850.110.0650.0180.0220.23
Partitioning factor
211.8412.2813.3216.90 *0.441<0.001<0.001<0.0010.50
65.696.066.167.58 *0.001<0.001<0.0010.39
104.574.594.825.68 *0.043<0.001<0.0010.41
243.213.683.453.89 *0.0080.0060.0210.23
962.782.732.812.840.6710.5700.842-
Microbial biomass (mg)
2134.03132.26133.26180.02 *15.1950.0230.0030.0010.37
6151.82171.15179.38234.45 *0.001<0.001<0.0010.55
10207.12188.17205.19247.35 *0.0380.002<0.0010.42
24236.87226.96245.92279.62 *0.038<0.001<0.0010.40
96349.24317.01334.85319.260.0780.2710.510-
* Within the same row, differs significantly from TD0 by orthogonal contrasts at p < 0.05; SE—standard error; Linear, Quadratic—p-value for linear and quadratic responses, respectively; R2—determination coefficient.
Disclaimer/Publisher’s Note: The statements, opinions and data contained in all publications are solely those of the individual author(s) and contributor(s) and not of MDPI and/or the editor(s). MDPI and/or the editor(s) disclaim responsibility for any injury to people or property resulting from any ideas, methods, instructions or products referred to in the content.

