Article

Metabolome and Transcriptome Analyses Provide Insights into Glucosinolate Accumulation in the Novel Vegetable Crop Cardamine violifolia

1
School of Modern Industry for Selenium Science and Engineering, National R&D Center for Se-Rich Agricultural Products Processing Technology, Wuhan Polytechnic University, Wuhan 430048, China
2
Enshi Se-Run Material Engineering Technology Co., Ltd., Enshi 445000, China
*
Authors to whom correspondence should be addressed.
Agronomy 2023, 13(11), 2760; https://doi.org/10.3390/agronomy13112760
Submission received: 18 September 2023 / Revised: 26 October 2023 / Accepted: 1 November 2023 / Published: 2 November 2023

Abstract

:
Cardamine violifolia, a species belonging to the Brassicaceae family, is a novel vegetable crop that is rich in glucosinolates. However, the specific glucosinolate profiles in this species remain unknown. In the present study, four parts of C. violifolia were collected including central leaves (CLs), outer leaves (OLs), petiole (P), and root (R). The highest level of total glucosinolate was observed in the R. A total of 19 glucosinolates were found in C. violifolia. The predominant glucosinolate compounds were 3-methylbutyl glucosinolate, 6-methylsulfinylhexyl glucosinolate, Indol-3-ylmethyl glucosinolate, 4-methoxyglucobrassicin, and neoglucobrassicin. A transcriptome analysis showed that 16 genes, including BCAT1, BCAT3-6, CYP79A2, CYP79B2-3, CYP83A1, CYP83B1, and SOT17-18, and nine metabolites, such as valine, tryptophan, and 1-methylpropyl glucosinolate, were enriched in the glucosinolate biosynthesis pathway. These genes may be involved in the regulation of glucosinolate accumulation among the four parts. A weighted gene co-expression analysis showed that five genes were predicted to regulate glucosinolate accumulation, including ABC transporter G family member 19, 3-ketoacyl-CoA synthase 19, and pyruvate decarboxylase 1. This study deepens our understanding of the nutrient quality of C. violifolia and provides insights into the regulatory mechanism of glucosinolate accumulation in C. violifolia.

1. Introduction

Cardamine violifolia is a plant native to Enshi, Hubei province, China, and was approved to be a leafy vegetable crop by the National Health Commission of China in 2021. This plant is famous for its selenium accumulation capacity and is categorized as a selenium hyperaccumulator. Our previous study demonstrated that C. violifolia could accumulate selenium in more than 9000 mg/kg of dry material in laboratory conditions [1]. The selenium concentration in C. violifolia also was over 3000 mg/kg of dry material, even in its natural habitat [2]. The selenium species present in C. violifolia and its accumulation mechanism have garnered significant attention among researchers, resulting in an abundance of relevant studies in this field.
In addition to its selenium enrichment ability, C. violifolia is also rich in phytochemical substances. However, the available information regarding the bioactive compounds present in C. violifolia is still limited. In a recent study conducted by Rao et al. [3], it was found that the leaves of C. violifolia are particularly abundant in phenolic acids, such as sinapic acid and ferulic acid. The accumulation of these phenolic acids in C. violifolia leaves may be attributed to the activity of specific genes, including CYP84A1 and CYP84A4. Another study conducted by Ma et al. [4] reported that C. violifolia contains various volatile organic compounds, with a significant presence observed in its flowers. These volatile compounds primarily include esters, aldehydes, alcohols, and ketones. Moreover, our previous research demonstrated that C. violifolia leaves exhibit a high concentration of total glucosinolate [5]. Nonetheless, the specific composition of glucosinolates in C. violifolia remains unknown.
Glucosinolates, containing nitrogen and sulfur, are a class of crucial secondary metabolites found in cruciferous plants [6]. Typically, they consist of a β-D-glucose-linked sulfonate aldoxime group along with side chains derived from amino acids. Glucosinolates can be classified into three groups based on the source of amino acids in their side chains: aliphatic, aromatic, and indole types. Aliphatic glucosinolates are derived from methionine, isoleucine, leucine, or valine, whereas aromatic ones are transformed from phenylalanine or tyrosine. Indole glucosinolates originate from tryptophan [7]. For example, Arabidopsis primarily contains aliphatic and indole groups of glucosinolates [8]. Glucosinolates and their degradation products exhibit various biological activities, including participation in plant defense responses, anti-cancer effects, and antioxidant properties [6]. In broccoli, glucoraphanin (4-methylsulfinylbutyl glucosinolate) is the predominant glucosinolate [9]. Upon hydrolysis, glucoraphanin generates sulforaphane, a compound known to possess potent anti-cancer activity. Sulforaphane accomplishes this through multiple mechanisms, such as inhibiting histone deacetylase activity, inducing phase II antioxidant enzymes, coupling glutathione and phase I enzymes to restrict bioconversion and enhance metabolism, and promoting reactive oxygen levels to restrain cancer cell proliferation [10]. Thus, glucoraphanin is responsible for the anti-cancer properties attributed to broccoli.
The biosynthesis of glucosinolates consists of three stages: the side-chain elongation of precursor amino acids, the formation of core thioglycolate structures, and side-chain modification [11]. The elongation of the precursor amino acid side chain begins with the deamination by the branched-chain amino acid transaminases (BCATs). The genes that play important roles in this stage include the BCAT, methylthioalkylmalate synthase (MAM), isopropyl malate isomerase (IPMI), and isopropyl malate dehydrogenase (IPMDH) gene families. The second stage begins with the transformation of the precursor amino acids into acetaldoxime under the catalyzation of cytochrome P450 (CYP). Several CYP79, CYP83, S-alkyl-thiohydroximate lyase (SUR), and cytosolic sulfotransferase (SOT) gene families are involved in this stage. The third stage is the modification of the side chain, which determines the bioactivity of the glucosinolates and the abundance of the degradative substances. This stage mainly includes hydroxylation, methylation, glucosylation, desaturation, and sulfonation of the glucosinolates [8].
As a member of the Brassicaceae family, C. violifolia contains ample glucosinolates. But the glucosinolate profiles and underlying gene networks in glucosinolate biosynthesis are not revealed in this species. The present study aimed to detect the glucosinolates and identify the potential genes that are involved in the biosynthesis and accumulation of glucosinolate compounds in C. violifolia. To achieve this, C. violifolia plants were divided into four tissues: outer leaves (OLs), central leaves (CLs), petiole (P), and root (R). Then, metabolome and transcriptome technologies were employed to identify the glucosinolates and related genes. This study will provide rich information on glucosinolates and further help towards the understanding of the nutritional value of C. violifolia.

2. Materials and Methods

2.1. Plant Materials

The C. violifolia plants were harvested from the farm of Enshi Se-run Material Engineering Technology Co., Ltd. (Enshi, China). The farm was located in Erpo Village (30°21′48″ N, 109°33′36″ E, altitude 500 m above sea level, average temperature 16/10 °C at day/night in November), Longfeng Town, Enshi City, Hubei Province, China. The C. violifolia seedlings were two years old and in the rosette stage. The seedlings were harvested and divided into CLs, OLs, P, and R. The CLs refer to the three new leaves in the middle of the plants. The other leaves were recorded as OLs. The samples contained four biological replicates, and each replicate was composed of 20 seedlings. After the separation, the four tissues were frozen in liquid nitrogen and stored at −80 °C.

2.2. Total Glucosinolate Concentration

Total glucosinolate concentrations in the four tissues of C. violifolia were measured following the method recorded by Rao et al. [5]. Briefly, 280 μL of acidified methyl alcohol was added into 0.5 g of samples. The acidified methyl alcohol contained 40% methanol and 0.5% acetic acid and can disrupt the activity of endogenous myrosinase, thus prohibiting the degradation of glucosinolates. The samples obtained at this stage were recorded as blank. Then, another 0.5 g of the samples were weighed and added with 280 μL of deionized water. The mixture was water-bathed at 37 °C for 10 min. The glucosinolates in the sample performed with this step were completely hydrolyzed by the endogenous myrosinase, resulting in the equimolar of glucose. The reaction was terminated using 210 μL of methyl alcohol and 200 μg of activated carbon. The mixture was then centrifuged twice at 13,000 rpm for 10 min. The supernatant was collected and employed for glucose determination using a glucose detection kit (Solarbio Life Sciences, Beijing, China). The glucose content in the blank sample minus that in the completely hydrolyzed sample was the glucosinolate concentration of the sample.

2.3. Detection of Glucosinolates via Widely Targeted Metabolome

The samples were dried with a vacuum freeze-drier and crushed into a powder. One hundred mg of the lyophilized powder was mixed with 1.2 mL of 70% methanol and shaken six times on a vortex mixer for 30 s every 30 min. The samples were placed at 4 °C overnight and centrifuged at 12,000 rpm for 10 min. The supernatant was filtrated through a 0.22 μm filter membrane (Anpel, Shanghai, China) for ultra-high performance liquid chromatograph–mass/mass (UPLC-MS/MS; UPLC: Shimadzu Nexera X2; column: Agilent SB-C18, 1.8 μm particle size, 2.1 mm diameter, 100 mm length; MS: Applied Biosystem 4500 Q TRAP) detection at Metware Bio-Tech. Co. (Wuhan, China). The mobile phase consisted of pure water with 0.1% formic acid and acetonitrile with 0.1% formic acid. The flow velocity was 0.35 mL/min. The column oven was set to 40 °C. The injection volume was 4 μL. The effluent was alternatively connected to an ESI-triple quadrupole-linear ion trap (QTRAP)-MS. The identified metabolites were annotated using the KEGG Compound database (http://www.kegg.jp/kegg/compound/, accessed on 2 December 2021) and then mapped to the KEGG pathway database (http://www.kegg.jp/kegg/pathway.html, accessed on 3 December 2021). Significantly regulated metabolites (DRMs) were determined based on a VIP ≥ 1 and absolute log2 (Fold change) ≥ 1. The glucosinolates were screened from the integrative result files.

2.4. Transcriptome Sequencing and Analysis

Total RNAs in the tissues were extracted using an RNApre Pure Plant Kit (Tiangen Biotech, Beijing, China). The concentration and integrity of the total RNA were measured using a Qubit® RNA Assay Kit in a Qubit®2.0 Fluorometer (Life Technologies, Carlsbad, CA, USA) and a Bioanalyzer 2100 system (Agilent Technologies, Santa Clara, CA, USA), respectively. One μg of RNA was purified using poly-T oligo-attached magnetic beads to obtain mRNA, and was fragmented with divalent cations. The first-strand cDNA was synthesized using a random hexamer primer and an M-MuLVReverse transcriptase RNase H. Second-strand cDNA synthesis was subsequently performed using DNA Polymerase I and RNase H. The double-strand cDNAs were purified after the adenylation of the 3′ ends, adding a poly A tail and ligating adapter. The cDNA libraries were quantified and measured with insert size to evaluate the library quality. The libraries of qualified quality were employed for sequencing with an Illumina Novaseq 6000 system at Metware Bio-Tech. Co. (Wuhan, China). Clean reads were obtained after removing reads with adapters, paired reads, and low-quality reads in the raw data. The clean reads were then assembled using Trinity.2.11.0 to obtain unigenes. The coding sequences of the unigenes were predicted using TransDecoder (https://github.com/TransDecoder/, accessed on 8 December 2021) and the amino acid sequences were obtained in this step. The unigenes were annotated using the DIAMOND software (v0.9.24.125) through mapping to the following databases: Nr (NCBI non-redundant protein sequences); Swiss-Prot (a manually annotated and reviewed protein sequence database); Trembl (a variety of new documentation files and the creation of TrEMBL, a computer annotated supplement to SWISS-PROT); the KEGG (Kyoto Encyclopedia of Genes and Genomes); GO (Gene Ontology); and KOG/COG (COG: Clusters of Orthologous Groups of proteins; KOG: euKaryotic Ortholog Groups). The amino acid sequences were mapped to the Pfam (Protein family) database. The transcription levels of the unigenes were calculated using the RSEM software (v1.3.1) and the expression level was presented as an FPKM (fragments per kilobase of exon model per million mapped fragments) value. Differences between the tissues were evaluated using DESeq2 (v1.22.1). The significance between the tissues was set at p ≤ 0.05 and an absolute log2fold change of ≥1. Differentially expressed genes (DEGs) were performed with KEGG and GO enrichment analysis.

2.5. Conjoint Analysis of Transcriptome and Metabolome

The analysis of the integrative correlation between the glucosinolate compounds and unigenes was performed via a conjoint analysis of the transcriptome and metabolome. The DEGs and DRMs were mapped to the KEGG pathway database. The DRMs and DEGs that belonged to the glucosinolate biosynthesis pathway (Ko00966) were screened and employed for correlation analysis using the R package (v3.5.1). Expression heat maps of the DRMs and DEGs were plotted using TBtools (v1.09876).

2.6. Weighted Gene Correlation Network Analysis (WGCNA)

WGCNA was performed using the WGCNA R package (v1.69). The five most enriched glucosinolate compounds in C. violifolia were screened and subjected as trait substances for WGCNA in the present study. The expression file was from the genes which were enriched in glucosinolate biosynthesis, plant hormone signal transduction, photosynthesis, and the biosynthesis of secondary metabolism pathways. The weight values in the significant modules were used for gene network construction.

2.7. Validation of Transcriptome Data via Real-Time Quantitative PCR (RT-qPCR)

The DEGs enriched in the glucosinolate biosynthesis pathway were selected for an RT-qPCR experiment to validate the accuracy of the transcriptome data. The synthesis of the first-strand cDNAs and the amplified reaction were performed by using a Real-Time One Step RT-qPCR kit (FP313, SYBR Green, Tiangen Biotech, Beijing, China). The reaction conditions were as follows: RNA reverse transcription, 50 °C for 30 min; pre-denaturation of cDNA, 95 °C for 3 min; amplified reaction, 95 °C for 15 s and 60 °C for 30 s, 40 recycles. The primers were picked by using Primer3plus (http://www.primer3plus.com/cgi-bin/dev/primer3plus.cgi, accessed on 8 December 2021). The primer sequences are listed in Table S1. The relative expression of the unigenes was calculated following the 2−ΔΔCt method. The expression values of the genes were normalized to the reference gene β-actin3. The RT-qPCR experiment was performed with four biological replicates and triple technical replicates.

2.8. Statistical Analysis

All data are presented as the mean values representing the four biological triplicates ± standard errors. The data were analyzed using an SPSS22 (SPSS Inc., Chicago, IL, USA) one-way ANOVA. Multiple treatment groups were compared using Duncan’s honestly significant difference test at p ≤ 0.05.

3. Results

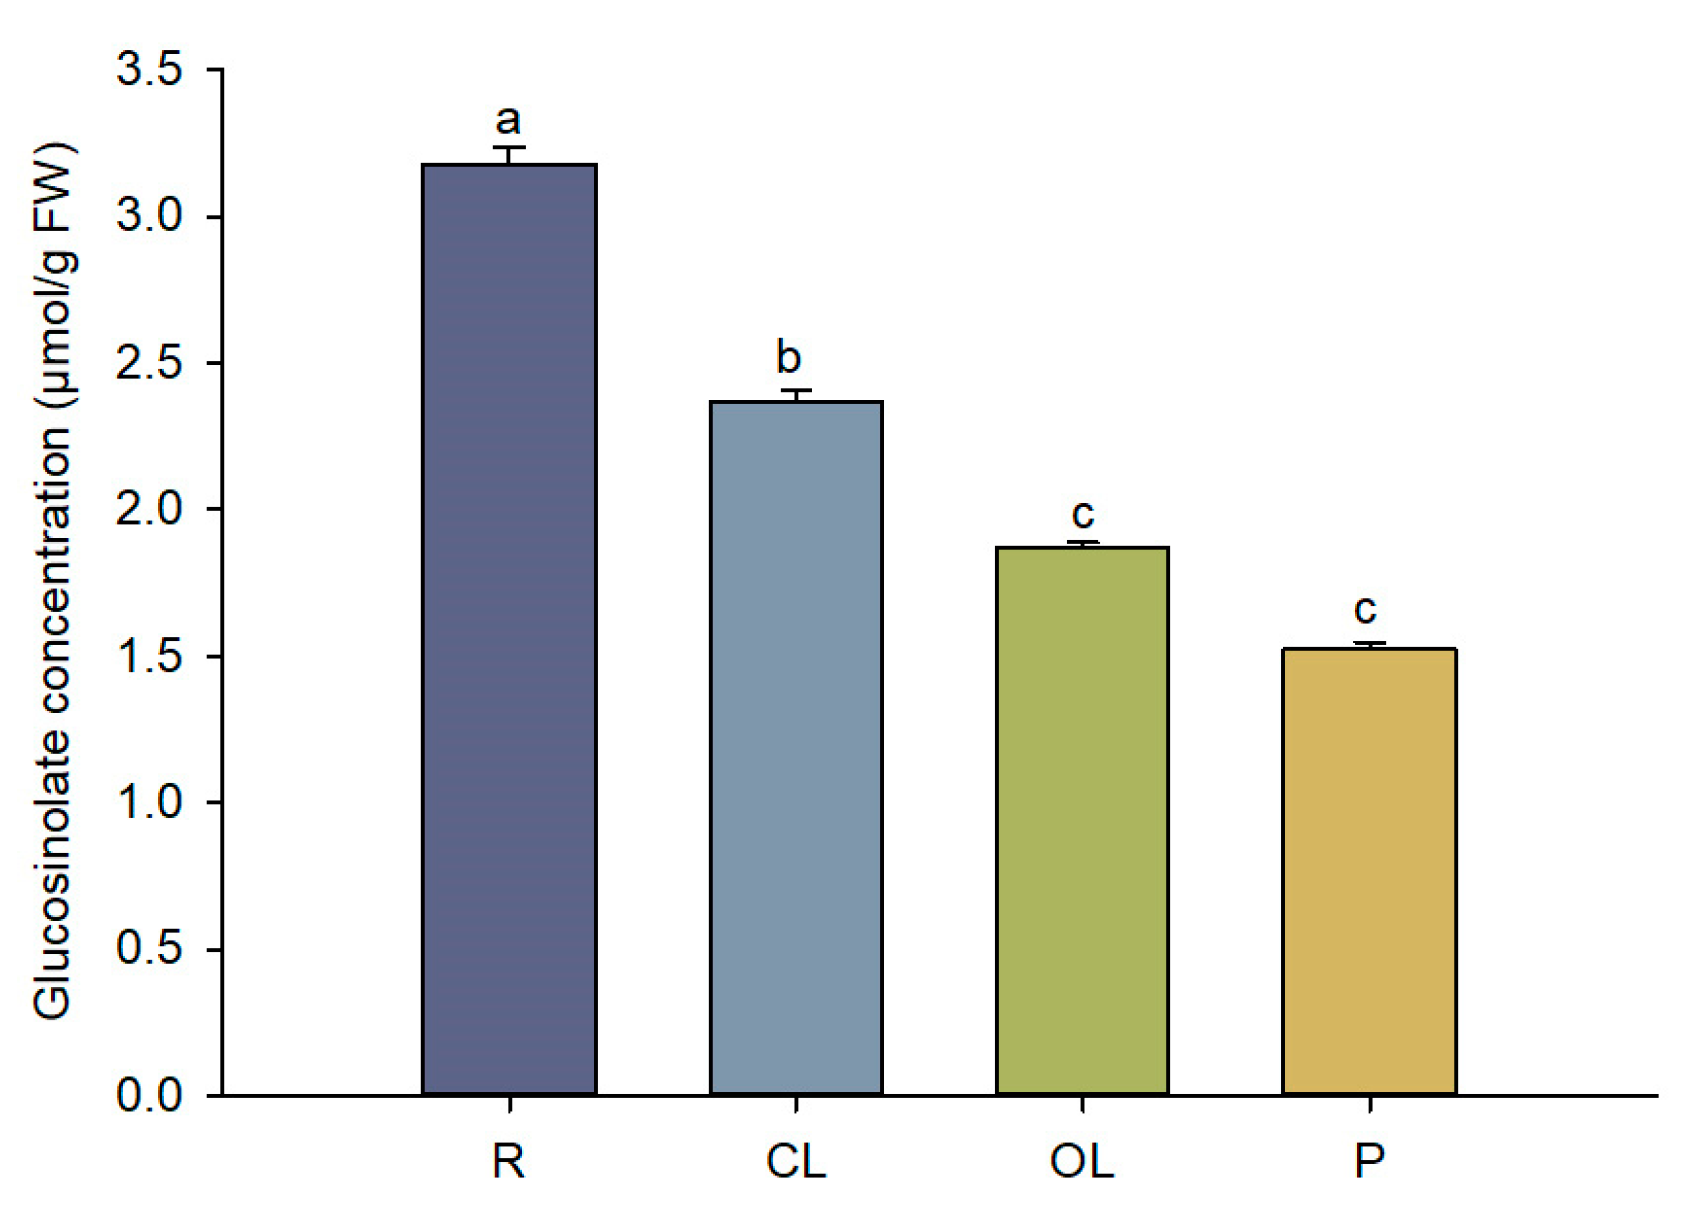
3.1. Total Glucosinolate Concentration in C. violifolia

The total glucosinolate concentrations significantly varied among the four tissues (Figure 1). The highest glucosinolate concentration was observed in the R, followed by the CLs and OLs. Petiole accumulated the lowest level of glucosinolates.

3.2. Glucosinolate Profiles of C. violifolia

A total of 19 glucosinolate components were found in C. violifolia, although they showed a tissue-specific manner (Table 1). Here, the metabolome revealed 15, 18, 16, and 17 glucosinolate compounds in the R, OLs, CLs, and P of C. violifolia, respectively. Interestingly, neoglucobrassicin (CAS 5187-84-8), 4-methoxyglucobrassicin (CAS 83327-21-3), 6-methylsulfinylhexyl glucosinolate (CAS 33049-17-1), indol-3-ylmethyl glucosinolate (CAS 4356-52-9), 6-(methylsulfonyl)hexyl glucosinolate (CAS 74542-18-0), and 3-methylbutyl glucosinolate (CAS 76265-22-0) ranked as the top six glucosinolate compounds in terms of relative abundance in the four tissues. Other common glucosinolates, such as sulforaphane, sinigrin, glucoraphanin, and 2-phenylethyl glucosinolate, were also detected in C. violifolia.
The relative abundance of the glucosinolate compounds varied among the four tissues. Neoglucobrassicin, 4-methoxyglucobrassicin, and indol-3-ylmethyl glucosinolate showed the highest level in the R, followed by the CLs, and the lowest in the P and OLs. By contrast, the concentration of 6-methylsulfinylhexyl glucosinolate was highest in the CLs, followed by the R, and the lowest in the OLs. The concentration level of sulforaphane in C. violifolia was relatively low but showed a difference between the tissues. The lowest sulforaphane level was observed in the OLs, whereas the concentration of sinigrin in the R or CLs was 2-fold that in the OLs or P. Notably, glucoraphanin revealed a similar level in the four tissues. 1-methylpropyl glucosinolate was only detected in the P and OLs of C. violifolia.

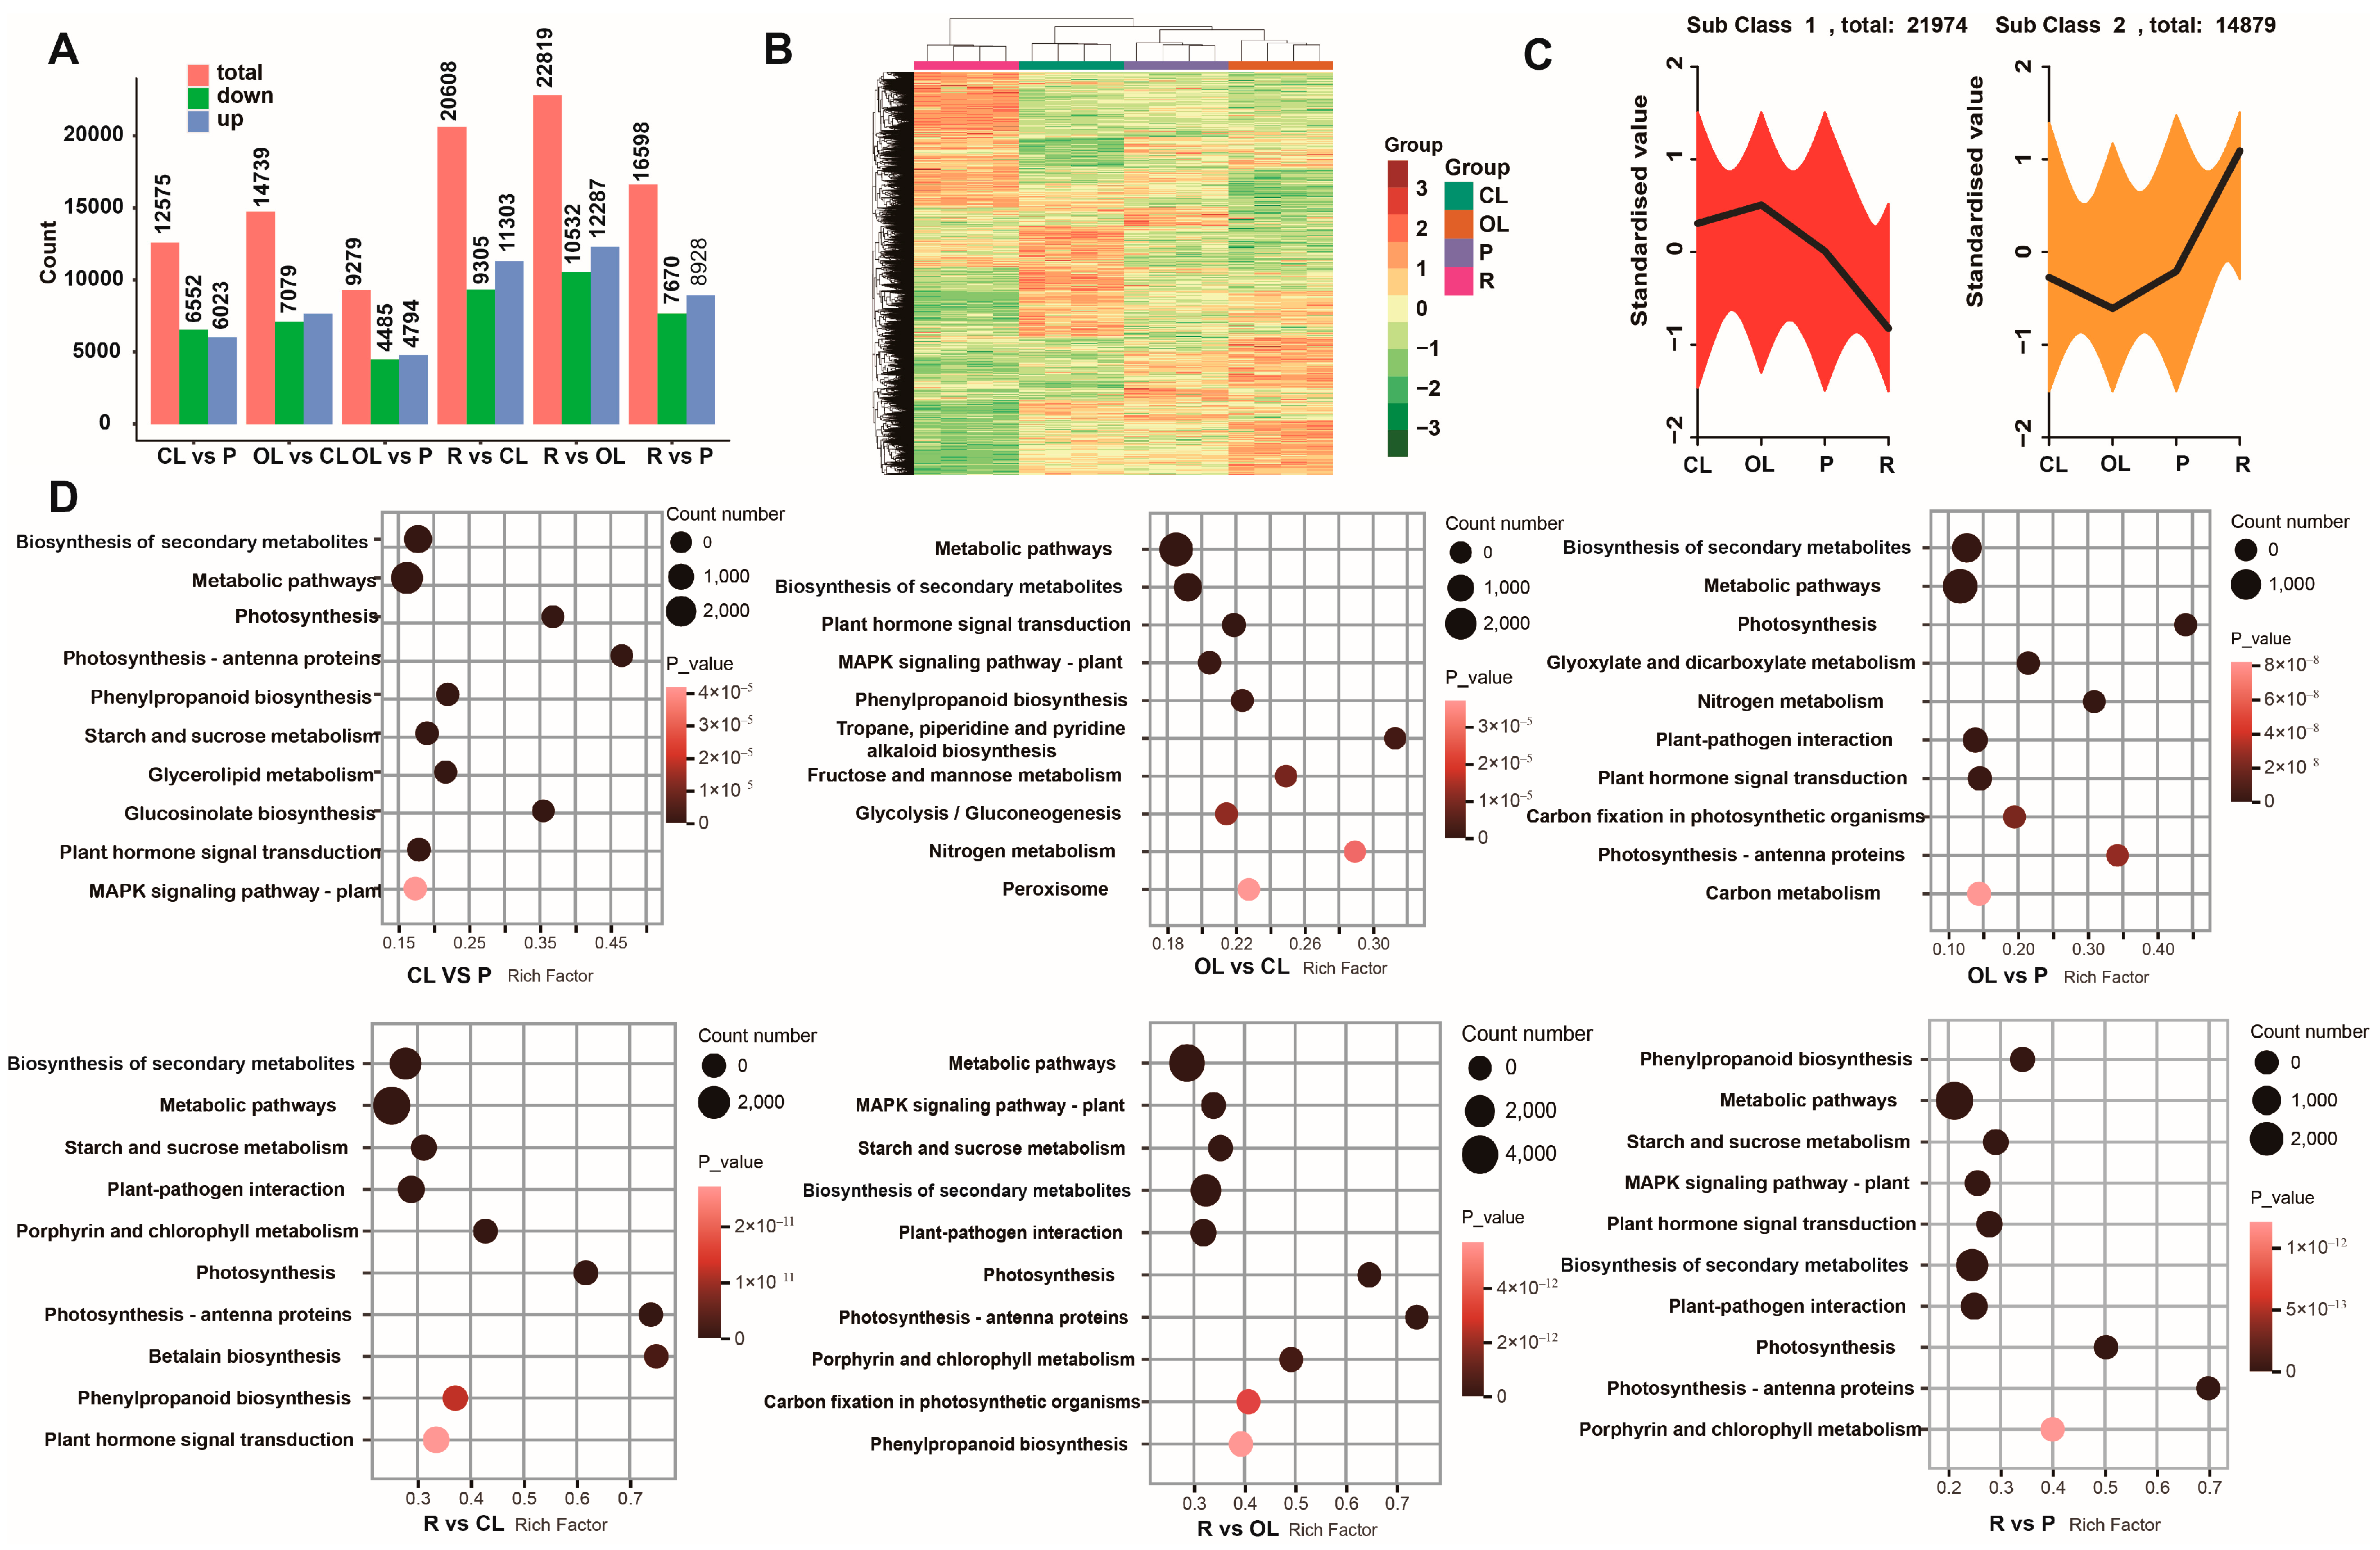
3.3. Transcriptome and DEG Analysis

The high-throughput sequencing generated a total of 148,852,692 nucleic acid bases. These bases were assembled into 119,939 unigenes with an average length of 1241 nucleotides. The unigenes were then mapped to the annotation databases. The results showed that there were 90,233 unigenes annotated in at least one database, which was 75.23% of the total unigenes. Specifically, the number of annotated genes in the seven databases were as follows: 64,314 in the KEGG; 88,597 in Nr; 67,350 in SwissProt; 88,360 in TrEMBL; 53,817 in KOG; 77,885 in GO; and 60,211 in Pfam (Table 2). The sequences were mapped to the Nr databases, and the similarity between C. violifolia and other species was estimated. The results showed that the highest similarity was observed between Arabidopsis lyrata subsp. lyrata, Arabidopsis thaliana, Camelina sativa, and Capsella rubella and C. violifolia (Figure S1A). An analysis of the GO enrichment showed that the unigenes were mainly enriched into the cell, organelle, and cell part terms in the cellular component category; the metabolic process and cellular process terms in the biological process category; and the catalytic activity and binding terms in the molecular function category (Figure S1B).
Correlations between the samples were calculated based on the FPKM value of the unigenes. The results showed that the samples had a high Pearson’s correlation coefficient within the group, indicating the high repeatability of the samples (Figure S1C). A principal component analysis (PCA) revealed that PC1 and PC2 accounted for 22.09% and 16.35% of the variance. The four groups of samples were distributed far away from each other in the PCA quadrant (Figure S1D), indicating differences between the four tissues.
A total of 36,853 DEGs were obtained through the comparisons. Notably, there were 20,608 (9305 down-regulating and 11,303 up-regulating) and 22,819 (10,532 down-regulating and 12,287 up-regulating) DEGs in the R vs. CL and R vs. OL comparison groups, respectively (Figure 2A). The DEG numbers in these two groups were larger than the other groups. The cluster analysis of the DEG expression levels showed that the expression levels of the DEGs varied in the CL, OL, R, and P samples (Figure 2B). The expression values of the DEGs were then normalized for K-means cluster analysis. The genes classified to the same cluster had similar expression models in the four tissues. As shown in Figure 2C, the DEGs were divided into two subclasses: 21,974 and 14,879 genes were contained in subclass 1 and subclass 2, respectively. But the two subclasses displayed an opposite changing trend. Here, the KEGG pathway enrichment analysis was performed, and the 10 most enriched KEGG pathways in each comparison group are shown in Figure 2D. The results revealed that the DEGs were significantly enriched in the plant hormone signal transduction, photosynthesis, and biosynthesis of the secondary metabolism pathways in the six comparison groups.

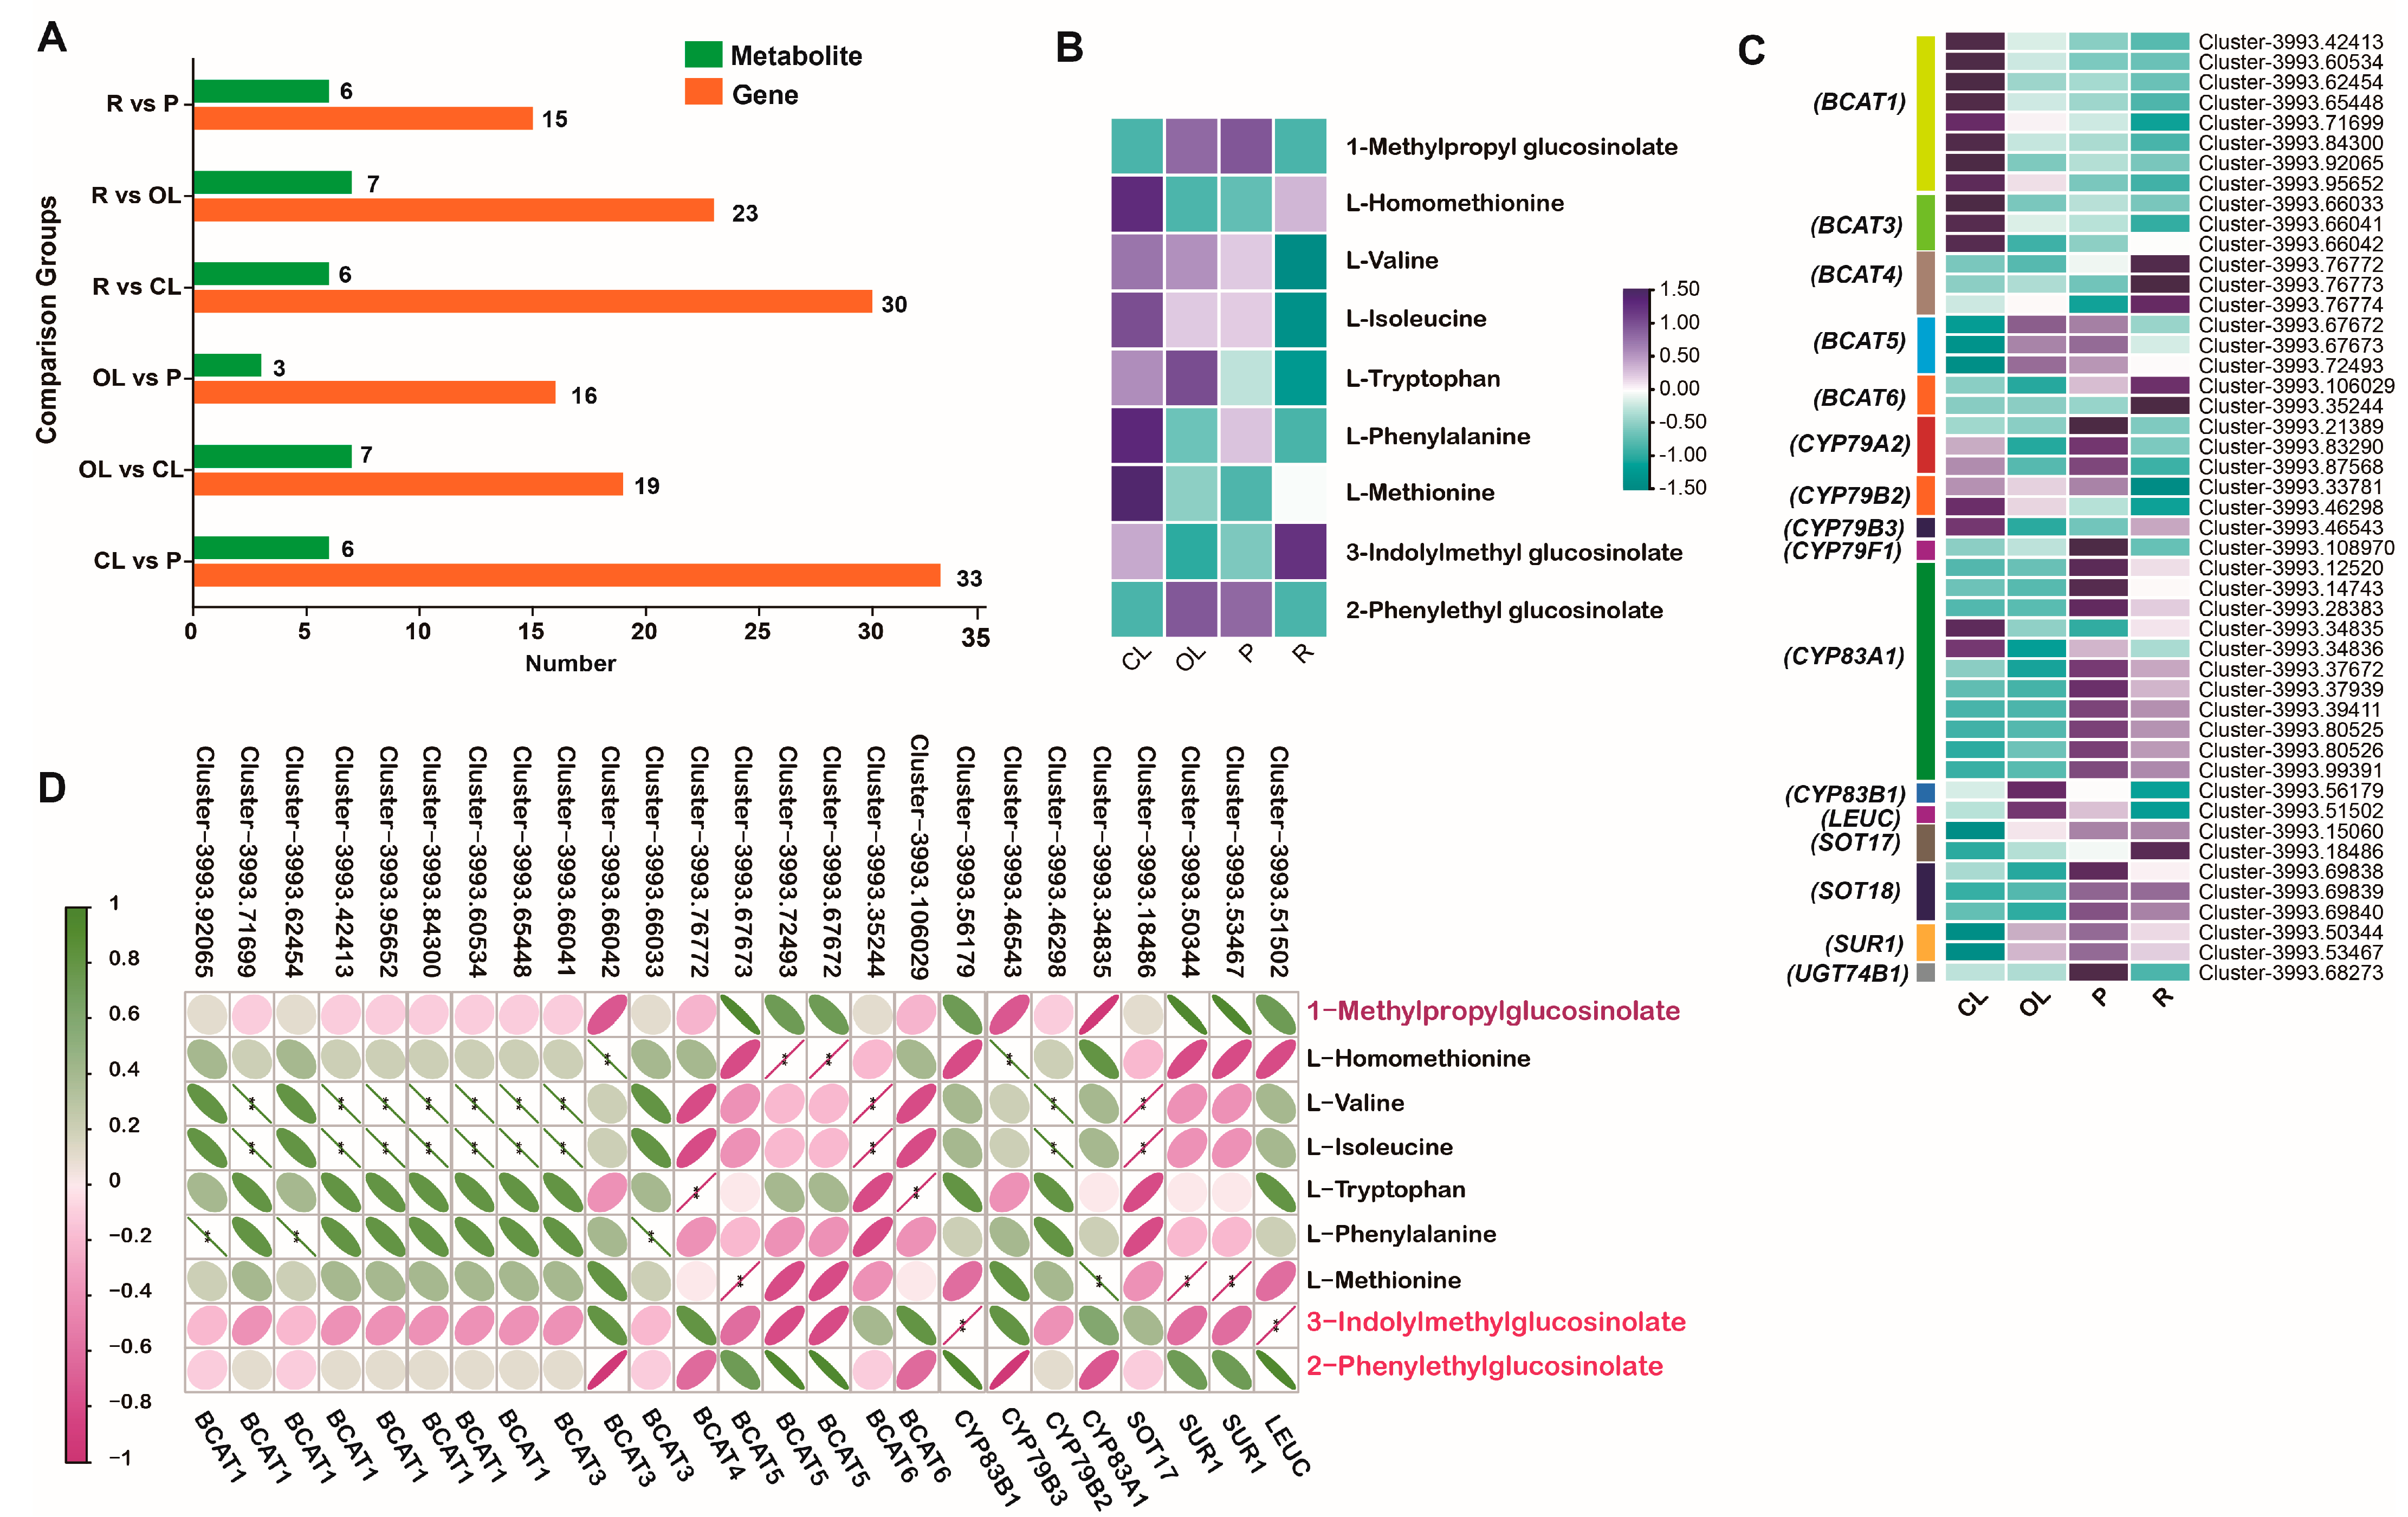
3.4. Correlation between the Metabolites and Genes in the Glucosinolate Biosynthesis Pathway

To reveal the potential mechanism of glucosinolate accumulation in the different tissues of C. violifolia, a conjoint analysis of the metabolome and transcriptome was carried out. The DRMs and DEGs enriched in the glucosinolate biosynthesis pathway (Ko00966) were then filtered out for further analysis. A total of nine metabolites and 47 unigenes were screened in this pathway. As shown in Figure 3A, the number of genes that belonged to the Ko00966 pathway greatly varied in the six comparison groups. There were 33 unigenes enriched in the Ko00966 pathway in the CL vs. P groups, which was two-fold that in the R vs. P groups or OL vs. P groups, whereas the number of metabolites belonging to the Ko00966 pathway changed a little among the six comparison groups, except for the OL vs. P groups, which only enriched three metabolites.
The nine metabolites were composed of three glucosinolates and six amino acids (Figure 3B). The OLs and P of C. violifolia accumulated more 1-methylpropyl and 2-phenylethyl glucosinolates than the CLs and R. Different from the former two glucosinolates, Indol-3-ylmethyl glucosinolate were more accumulated in the CLs and R of C. violifolia. By contrast, the six amino acids showed a particular accumulation manner, which was more accumulated in the CLs of C. violifolia.
The 33 unigenes were annotated into 16 enzyme genes, and they displayed varied expression patterns in the different tissues of C. violifolia (Figure 3C). BCAT1 and BCAT3 had the highest expression level in the CLs, whereas the transcription levels of BCAT4 and BCAT6 were the highest in the R. Interestingly, the expression level of BCAT5 was higher in the CLs and P than in the CLs and R. Most of the remaining genes revealed higher expression levels in the P and R of C. violifolia. Notably, six cytochrome P450 members were enriched in the Ko00966 pathway here. Three cytochrome P450 members, including CYP79A2, CYP79F1, and CYP83A1, were more expressed in the P of C. violifolia, whereas CYP79B2 and CYP79B3 had higher expression levels in the CLs.
The Pearson’s correlation coefficients between the metabolites and genes involved in the Ko00966 pathway were further investigated. As shown in Figure 3D, no significant correlation between 1-methylpropyl glucosinolate or 2-phenylethyl glucosinolate and the genes was observed. By contrast, indol-3-ylmethyl glucosinolate was significantly correlated with cluster-3993.56179 (CYP83B1) and cluster-3993.51502 (LEUC). Notably, the six amino acids were significantly correlated to several genes. For example, L-valine and L-isoleucine were positively and significantly correlated to BCAT1 and BCAT3 but negatively correlated to BCAT6 and SOT17. L-methionine was negatively correlated to SUR1 and BACT5 but positively correlated to CYP83A1.

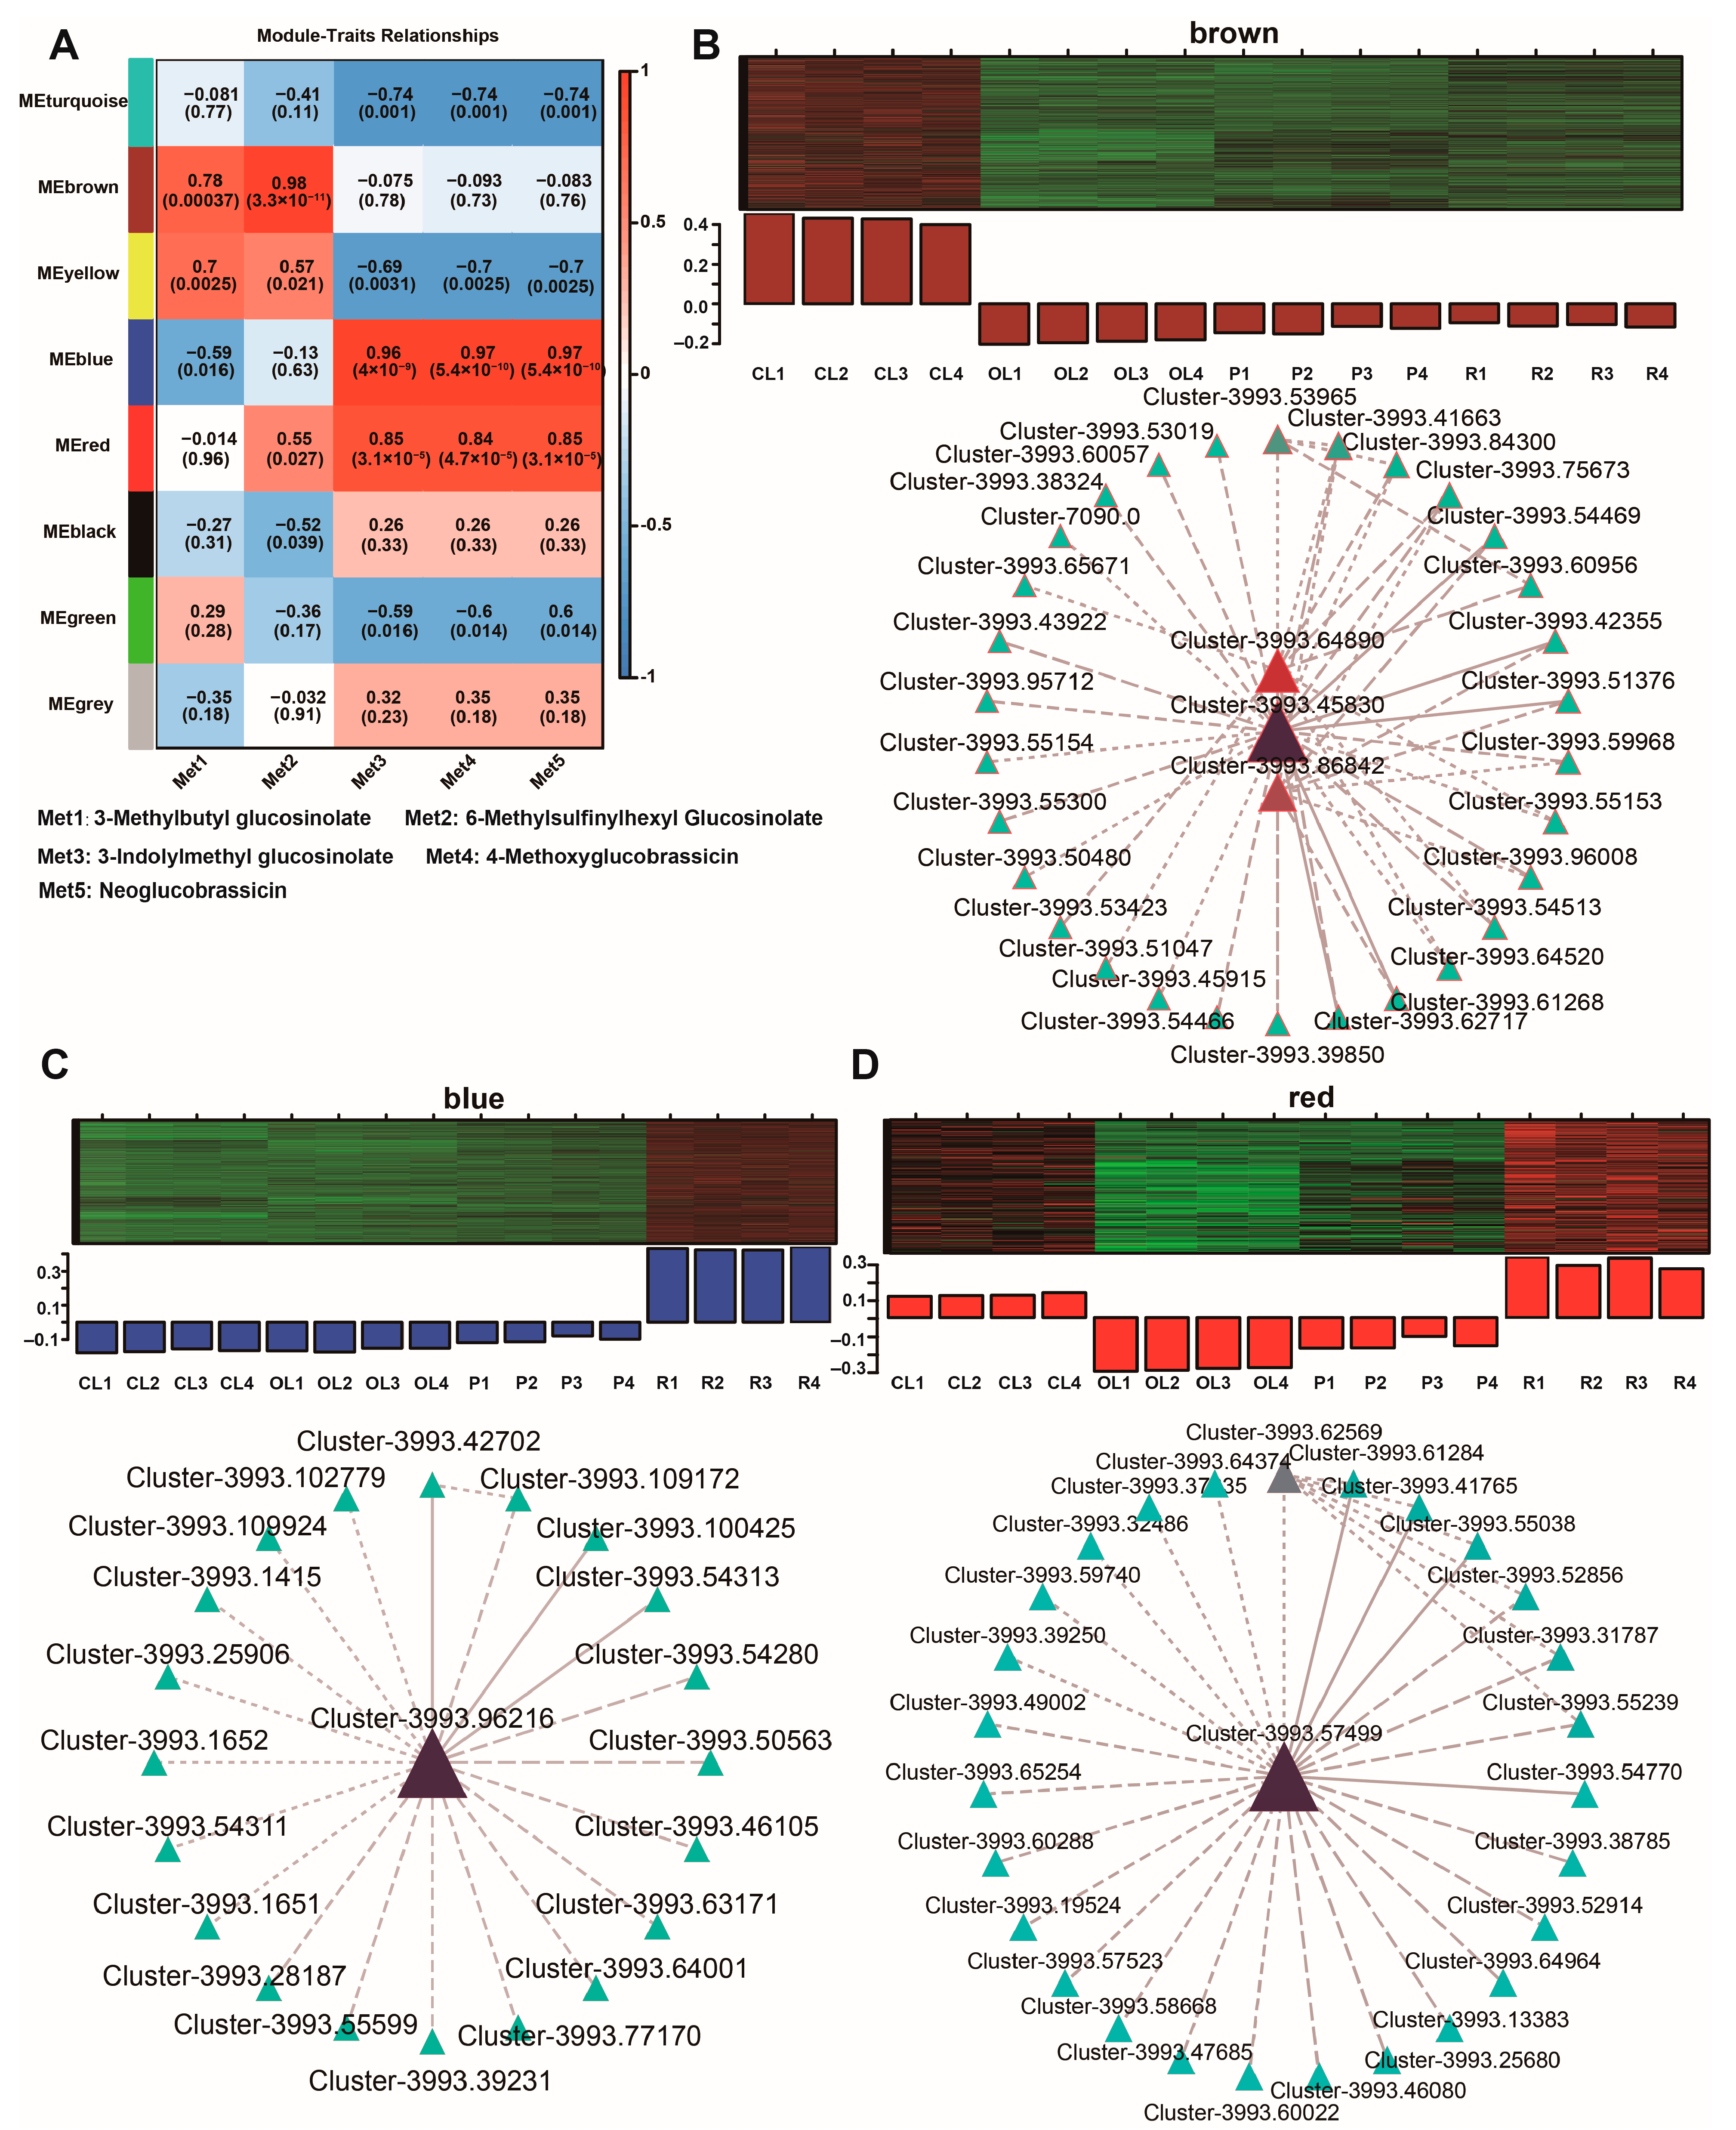
3.5. WGCNA Revealed Hub Genes Involved in the Accumulation of the Main Glucosinolates

The five most enriched glucosinolate compounds in C. violifolia were screened and subjected as trait substances for WGCNA in the present study. The expression file was from the genes which were enriched in glucosinolate biosynthesis, plant hormone signal transduction, photosynthesis, and the biosynthesis of the secondary metabolism pathways. The results showed that several modules significantly correlated to the glucosinolates (Figure 4A). The brown module significantly correlated to 3-methylbutyl glucosinolate and 6-methylsulfinylhexyl glucosinolate. The blue and red modules significantly correlated to indolylmethyl glucosinolate, 4-methoxyglucobrassicin, and neoglucobrassicin.
The genes clustered in the brown module exhibited higher expression levels in the CLs than in other tissues. To reveal the potential key genes involved in the brown module, a network was constructed based on the weight values between the genes. The results revealed that three hub genes were striking among the genes involved in the brown module and they were widely correlated with the other unigenes (Figure 4B). The three hub genes were annotated as alpha-hydroxynitrile lyase (HNL, Cluster-3993.64890), ABC transporter G family member 19 (ABCG19, Cluster-3993.45830), and 3-ketoacyl-CoA synthase 19 (KCS-19, Cluster-3993.86842), respectively.
The blue module contained 1050 unigenes. These unigenes showed the highest expression levels in the R and the lowest in the P. The weight values between the unigenes were analyzed and one hub was revealed in the blue module (Figure 4C). Here, the unigene Cluster-3993.96216 was annotated as peroxidase 53, which is involved in the biosynthesis of the secondary metabolites pathway.
There were 156 unigenes clustered into the red module. The highest transcription levels of these unigenes were observed in the R, followed by the CLs, and the lowest in the OLs. One hub gene was screened through the analysis of the weight value network (Figure 4D). This gene is annotated as pyruvate decarboxylase 1 (PDC1) and is involved in the biosynthesis of the secondary metabolite pathway.

3.6. Validation of the Transcriptome Data

A correlation analysis between the transcriptome and RT-qPCR data of the selected unigenes was performed (Figure S2). The results showed that the correlation was significant, indicating that the transcriptome data were reliable.

4. Discussion

Glucosinolates play important roles in the responses to biotic and abiotic stresses in plants, such as mitigating salt stress and deterring insects from feeding [6]. More than 130 glucosinolate compounds have been discovered in Brassicaceae plants, but only 90 of them have been structurally identified [7]. As a novel vegetable plant of the Brassicaceae family, C. violifolia also contains considerable glucosinolates. Interestingly, the highest total glucosinolate concentration was observed in the roots of C. violifolia, rather than in the leaves or petiole. This observation contrasts with that of horseradish, which displays a much higher concentration of total glucosinolates in its sprouts than in its roots [12]. Similar results were also observed in Sisymbrium officinale, with the roots exhibiting a significantly lower glucosinolate concentration compared to the leaves [13]. However, this study also reported that the total glucosinolate concentrations in the stems of Sisymbrium officinale collected from the Split and Krka areas were remarkably different (the former was four-fold that of the latter) [13]. This result indicates that the environment also affects glucosinolate accumulation in plants. Due to the lack of glucosinolate studies in C. violifolia parts, it is hard to know the exact reasons why C. violifolia has the highest glucosinolate concentrations in the roots. We suggest that it may be a result of the species' unique characteristics and the influence of the growth environment. A recent study also showed that the biosynthesis and transportation of glucosinolates contribute to their accumulation in Brassica rapa when the roots are exposed to herbivory [14]. Since the C. violifolia plants were two years old in the present study, they relied on their roots to remain dormant underground and survive the hot summer months. The roots probably accumulated glucosinolates from the previous growth season, resulting in the highest concentration being found in the roots. However, this deduction needs further investigation.
The present study first reports the glucosinolate profiles of C. violifolia. This study found that 3-methylbutyl glucosinolate, 6-methylsulfinylhexyl glucosinolate, indolyl-3-methyl glucosinolate, 4-methoxyglucobrassicin, and neoglucobrassicin were the dominant glucosinolates in C. violifolia. 3-Methylbutyl glucosinolate is derived from leucine and also exists in Arabidopsis thaliana [15] and broccoli [16]. Currently, information regarding the effects of 3-methylbutyl glucosinolate on humans and plants is limited. Nevertheless, it may potentially serve as a biomarker for consuming these foods. 6-Methylsulfinylhexyl glucosinolate, also known as glucohesperin, has been detected in the Brassicaceae family plant Dithyrea wislizenii [17]. A recent study demonstrated that glucohesperin has the potential to act as an anti-glycation agent by preserving the integrity of protein structures, suggesting its potential application in diabetes treatment [18]. Indol-3-ylmethyl glucosinolate, commonly called glucobrassicin, is one of the most common glucosinolate compounds and has been discovered in various Brassicaceae plants, such as A. thaliana [19], cabbage [20], radish [21], and broccoli [22]. Evidence showed that indol-3-ylmethyl glucosinolate is used for IAA biosynthesis in A. thaliana under drought stress [23], indicating that it is involved in the response to abiotic stress in plants. Moreover, 3,3′-diindolylmethane, a derivant of indol-3-ylmethyl glucosinolate, has also been found to prevent carcinogenesis [24]. There, indol-3-ylmethyl glucosinolate may be an important aspect of the nutrient value of C. violifolia. 4-methoxyglucobrassicin is an indolylmethylglucosinolic acid that is glucobrassicin bearing a methoxy substituent at position 4 on the indole ring. This compound may participate in plant defense, as it can be induced by methyl jasmonate and jasmonic acid in pak choi plants [25]. 4-Methoxyindole-3-carbinol is the degradation compound of 4-methoxyglucobrassicin and exhibits inhibiting power in the proliferation of colon cancer cells [26]. Similar to 4-methoxyglucobrassicin, neoglucobrassicin is an indolyl carbohydrate that is glucobrassicin-methoxy-substituted at position 1 of the indole moiety. It is also known as 1-methoxy-3-indolylmethyl glucosinolate. It can promote the generation of DNA adducts in rats, but whether similar effects would be induced in humans remains unclear [27]. Also, several common glucosinolates, including sinigrin, glucoraphanin, and glucocheirolin, were detected in C. violifolia. Sinigrin widely exists in Brassicaceae vegetables, such as cauliflower and cabbage [28]. Sinigrin has remarkably healthy effects on humans and displays potential for the treatment of hypertension-induced kidney damage [29] and diabetes management [30]. Despite the absence of a distinct flavor, the hydrolysis product of glucoraphanin, sulforaphane, is well known due to its significant accumulation in broccoli sprouts [9]. Sulforaphane now has been extensively investigated in cancer prevention and intervention [31]. In summary, the glucosinolate compounds in C. violifolia are analogues to other Brassicaceae plants, and these glucosinolates significantly contribute to the health-promoting properties of C. violifolia.
The present study revealed several genes that may be involved in the biosynthesis and accumulation of glucosinolate in C. violifolia. BCATs catalyze the conversion of specific amino acids into 2-oxonic acids through deamination [32]. This is the first step of glucosinolate biosynthesis in plants. Here, BCAT1 and BCAT3-6 were significantly correlated to several amino acids, such as valine and isoleucine, indicating that the different parts of C. violifolia have different glucosinolate synthesis efficiencies. This was related to differences in not only the transcription levels of the BCATs but also the amino acid concentrations in the four parts. As shown in Figure 3B, several amino acids that participate in glucosinolate biosynthesis, including homomethionine, valine, isoleucine, tryptophan, phenylalanine, and methionine, were more accumulated in the CLs. Notably, BCAT1 also exhibited a higher expression level in the CLs than in the other parts. In A. thaliana, BCAT1 locates in the mitochondria and can catalyze all the branched-chain amino acids in various tissues. AtBCAT1 is affinitive to isoleucine, leucine, and valine [33]. We suggest that C. violifolia BCAT1 may share a similar function with AtBCAT1, but mainly functions in new tissues. These genes were differentially expressed in the four parts of C. violifolia, contributing to the variations in glucosinolate abundance observed among the four parts. Here, several CYP family genes that may be involved in the formation of the core structure of glucosinolate were found. CYP79A2 can catalyze the conversion of phenylalanine into aromatic acetaldoxime [34]. The transformation of methionine derivatives into aliphatic acetaldoxime is catalyzed by CYP79F1 [35]. Acetaldoxime serves as a substrate to form acid nitro compounds and nitrile under the catalysis of CYP83A1 and CYP83B1 [36]. These genes showed higher expression levels in the petiole, indicating that the biosynthesis process of glucosinolate may occur in the petiole. The last step in the formation of glucosinolate core structures is mediated by SOTs [37]. The expression levels of SOT17 and SOT18 were higher in the petiole and root, implying that these genes contribute to the different accumulation of glucosinolates in the four parts of C. violifolia.
The present study identified several genes that may be involved in the regulation of glucosinolate accumulation via a WGCNA. For example, HNL participates in the biosynthesis of aldehydes or ketones, which are employed as building blocks for pharmaceutical and agrochemical intermediates [38]. ABCG19 belongs to the ABCG subfamily and is not well characterized currently. A previous study showed that ABCG19 provides kanamycin resistance for A. thaliana [39]. KCSs are involved in the biosynthesis of very-long-chain fatty acids in plants [40]. Up to date, no direct evidence has linked these genes to glucosinolate accumulation. However, these genes are involved in the important bioactivity in plant cells. The exchange and transformation of substances in plant cells are widely connected. Therefore, further investigations are needed to determine how these genes influence glucosinolate accumulation.

5. Conclusions

This study compared the glucosinolates in the CLs, OLs, P, and R of two-year-old C. violifolia seedlings. The results showed that the root accumulated the highest level of total glucosinolate, followed by the CLs, and the total glucosinolate concentration was the lowest in the petiole. Metabolome detection revealed a total of 19 glucosinolate compounds in C. violifolia. This study showed that 3-methylbutyl glucosinolate, 6-methylsulfinylhexyl glucosinolate, indol-3-ylmethyl glucosinolate, 4-methoxyglucobrassicin, and neoglucobrassicin were the dominant glucosinolates in C. violifolia. Several common glucosinolates in Brassicaceae family crops were also found in C. violifolia, such as sinigrin and glucoraphanin. The four parts exhibited remarkable variances in their glucosinolate compounds. These variances may be related to the expression changes for the key genes which are involved in the glucosinolate pathway, such as BCAT1, BCAT3-6, CYP79A2, CYP79B2-3, CYP83A1, CYP83B1, and SOT17-18. Moreover, five genes were predicted via a WGCNA to participate in the regulation of glucosinolate accumulation in the different parts of C. violifolia. This study enriches our understanding of healthy values in C. violifolia and provides insights into the glucosinolate regulation in various parts of C. violifolia.

Supplementary Materials

The following supporting information can be downloaded at https://www.mdpi.com/article/10.3390/agronomy13112760/s1: Figure S1: Overview of the transcriptome data; Figure S2 Correlation between the transcriptome data and RT-qPCR results; Table S1: Primers used for RT-qPCR.

Author Contributions

Conceptualization, S.R. and X.C.; methodology, J.G. and H.L.; software, H.L.; validation, J.G. and X.L.; formal analysis, J.G. and H.L.; investigation, H.C.; resources, J.G. and H.C.; writing—original draft preparation, S.R.; writing—review and editing, H.C. and X.C.; supervision, X.C. and S.C.; project administration, X.C. and S.C.; funding acquisition, S.R. All authors have read and agreed to the published version of the manuscript.

Funding

This research was funded by the Dawning Plan Project of the Knowledge Innovation Special Project of Wuhan City, grant number 2022020801020395, and the Doctoral Research Funding Project of Wuhan Polytechnic University, grant number 2022RZ053.

Institutional Review Board Statement

Not applicable.

Informed Consent Statement

Not applicable.

Data Availability Statement

The raw sequence data reported in this paper have been deposited in the Genome Sequence Archive in the National Genomics Data Center, China National Center for Bioinformation/Beijing Institute of Genomics, Chinese Academy of Sciences (GSA: CRA012954), and are publicly accessible at https://ngdc.cncb.ac.cn/gsa (accessed on 14 October 2023).

Acknowledgments

We would like to thank Wuhan Metaware Bio-tech Co., Ltd. for providing the data analysis platform.

Conflicts of Interest

The authors declare no conflict of interest.

References

  1. Rao, S.; Yu, T.; Cong, X.; Lai, X.; Xiang, J.; Cao, J.; Liao, X.; Gou, Y.; Chao, W.; Xue, H.; et al. Transcriptome, proteome, and metabolome reveal the mechanism of tolerance to selenate toxicity in Cardamine violifolia. J. Hazard. Mater. 2021, 406, 124283. [Google Scholar] [CrossRef]
  2. Both, E.B.; Shao, S.; Xiang, J.; Jókai, Z.; Yin, H.; Liu, Y.; Magyar, A.; Dernovics, M. Selenolanthionine is the major water-soluble selenium compound in the selenium tolerant plant Cardamine violifolia. Biochim. Biophys. Acta (BBA) Gen. Subj. 2018, 1862, 2354–2362. [Google Scholar] [CrossRef] [PubMed]
  3. Rao, S.; Cong, X.; Liu, H.; Hu, Y.; Yang, W.; Cheng, H.; Cheng, S.; Zhang, Y. Revealing the Phenolic Acids in Cardamine violifolia Leaves by Transcriptome and Metabolome Analyses. Metabolites 2022, 12, 1024. [Google Scholar] [CrossRef] [PubMed]
  4. Ma, Y.; Yin, J.; Wang, J.; Liu, X.; He, J.; Zhang, R.; Rao, S.; Cong, X.; Xiong, Y.; Wu, M. Selenium speciation and volatile flavor compound profiles in the edible flowers, stems, and leaves of selenium-hyperaccumulating vegetable Cardamine violifolia. Food Chem. 2023, 427, 136710. [Google Scholar] [CrossRef] [PubMed]
  5. Rao, S.; Yu, T.; Cong, X.; Zhang, W.; Zhu, Z.; Liao, Y.; Ye, J.; Cheng, S.; Xu, F. Effects of selenate applied at two growth stages on the nutrient quality of Cardamine violifolia. Sci. Hortic. 2021, 288, 110352. [Google Scholar] [CrossRef]
  6. Prieto, M.A.; López, C.J.; Simal-Gandara, J. Glucosinolates: Molecular structure, breakdown, genetic, bioavailability, properties and healthy and adverse effects. Adv. Food Nutr. Res. 2019, 90, 305–350. [Google Scholar] [CrossRef] [PubMed]
  7. Blažević, I.; Montaut, S.; Burčul, F.; Olsen, C.E.; Burow, M.; Rollin, P.; Agerbirk, N. Glucosinolate structural diversity, identification, chemical synthesis and metabolism in plants. Phytochemistry 2020, 169, 112100. [Google Scholar] [CrossRef] [PubMed]
  8. Harun, S.; Abdullah-Zawawi, M.R.; Goh, H.H.; Mohamed-Hussein, Z.A. A Comprehensive Gene Inventory for Glucosinolate Biosynthetic Pathway in Arabidopsis thaliana. J. Agric. Food Chem. 2020, 68, 7281–7297. [Google Scholar] [CrossRef]
  9. Vanduchova, A.; Anzenbacher, P.; Anzenbacherova, E. Isothiocyanate from Broccoli, Sulforaphane, and Its Properties. J. Med. Food 2019, 22, 121–126. [Google Scholar] [CrossRef]
  10. Elkashty, O.A.; Tran, S.D. Sulforaphane as a Promising Natural Molecule for Cancer Prevention and Treatment. Curr. Med. Sci. 2021, 41, 250–269. [Google Scholar] [CrossRef]
  11. Kim, J.I.; Zhang, X.; Pascuzzi, P.E.; Liu, C.J.; Chapple, C. Glucosinolate and phenylpropanoid biosynthesis are linked by proteasome-dependent degradation of PAL. New Phytol. 2020, 225, 154–168. [Google Scholar] [CrossRef] [PubMed]
  12. Agneta, R.; Lelario, F.; De Maria, S.; Möllers, C.; Bufo, S.A.; Rivelli, A.R. Glucosinolate profile and distribution among plant tissues and phenological stages of field-grown horseradish. Phytochemistry 2014, 106, 178–187. [Google Scholar] [CrossRef] [PubMed]
  13. Đulović, A.; Popović, M.; Burčul, F.; Čikeš Čulić, V.; Marijan, S.; Ruščić, M.; Anđelković, N.; Blažević, I. Glucosinolates of Sisymbrium officinale and S. orientale. Molecules 2022, 27, 8431. [Google Scholar] [CrossRef]
  14. Touw, A.J.; Verdecia Mogena, A.; Maedicke, A.; Sontowski, R.; van Dam, N.M.; Tsunoda, T. Both Biosynthesis and Transport Are Involved in Glucosinolate Accumulation During Root-Herbivory in Brassica rapa. Front. Plant Sci. 2020, 10, 1653. [Google Scholar] [CrossRef] [PubMed]
  15. Reichelt, M.; Brown, P.D.; Schneider, B.; Oldham, N.J.; Stauber, E.; Tokuhisa, J.; Kliebenstein, D.J.; Mitchell-Olds, T.; Gershenzon, J. Benzoic acid glucosinolate esters and other glucosinolates from Arabidopsis thaliana. Phytochemistry 2002, 59, 663–671. [Google Scholar] [CrossRef]
  16. Rao, S.; Gou, Y.; Yu, T.; Cong, X.; Gui, J.; Zhu, Z.; Zhang, W.; Liao, Y.; Ye, J.; Cheng, S.; et al. Effects of selenate on Se, flavonoid, and glucosinolate in broccoli florets by combined transcriptome and metabolome analyses. Food Res. Int. 2021, 146, 110463. [Google Scholar] [CrossRef]
  17. Montaut, S.; Grandbois, J.; Righetti, L.; Barillari, J.; Iori, R.; Rollin, P. Updated Glucosinolate Profile of Dithyrea wislizenii. J. Nat. Prod. 2009, 72, 889–893. [Google Scholar] [CrossRef]
  18. Cao, L.; Wang, Y.; Chen, X.; Deng, F.; Li, Z.; Wang, M.; Zhang, Y.; Su, R.; Kim, C.K. Discovery of novel glucosinolates inhibiting advanced glycation end products: Virtual screening and molecular dynamic simulation. Proteins 2023, 91, 1351–1360. [Google Scholar] [CrossRef]
  19. Agerbirk, N.; De Vos, M.; Kim, J.H.; Jander, G. Indole glucosinolate breakdown and its biological effects. Phytochem. Rev. 2009, 8, 101–120. [Google Scholar] [CrossRef]
  20. Renner, I.E.; Gardner, G.; Fritz, V.A. Manipulation of Continuous and End-of-Day Red/Far-Red Light Ratios Affects Glucobrassicin and Gluconasturtiin Accumulation in Cabbage (Brassica oleracea) and Watercress (Nasturtium officinale), Respectively. J. Agric. Food Chem. 2021, 69, 14126–14142. [Google Scholar] [CrossRef]
  21. Wang, Y.; Wang, Q.; Sun, H.; Zhang, Z.; Qian, H.; Zhao, X.; He, H.; Zhang, L. Glucosinolate Profiles in Different Organs of 111 Radish Accessions and Candidate Genes Involved in Converting Glucobrassicin to 4-Hydroxyglucobrassicin. J. Agric. Food Chem. 2022, 70, 488–497. [Google Scholar] [CrossRef]
  22. Li, Z.; Zheng, S.; Liu, Y.; Fang, Z.; Yang, L.; Zhuang, M.; Zhang, Y.; Lv, H.; Wang, Y.; Xu, D. Characterization of glucosinolates in 80 broccoli genotypes and different organs using UHPLC-Triple-TOF-MS method. Food Chem. 2021, 334, 127519. [Google Scholar] [CrossRef] [PubMed]
  23. Hornbacher, J.; Horst-Niessen, I.; Herrfurth, C.; Feussner, I.; Papenbrock, J. First experimental evidence suggests use of glucobrassicin as source of auxin in drought-stressed Arabidopsis thaliana. Front. Plant Sci. 2022, 13, 1025969. [Google Scholar] [CrossRef] [PubMed]
  24. Williams, D.E. Indoles Derived from Glucobrassicin: Cancer Chemoprevention by Indole-3-Carbinol and 3,3′-Diindolylmethane. Front. Nutr. 2021, 8, 734334. [Google Scholar] [CrossRef] [PubMed]
  25. Wiesner, M.; Hanschen, F.; Schreiner, M.; Glatt, H.; Zrenner, R. Induced Production of 1-Methoxy-indol-3-ylmethyl Glucosinolate by Jasmonic Acid and Methyl Jasmonate in Sprouts and Leaves of Pak Choi (Brassica rapa ssp. chinensis). Int. J. Mol. Sci. 2013, 14, 14996–15016. [Google Scholar] [CrossRef] [PubMed]
  26. Kronbak, R.; Duus, F.; Vang, O. Effect of 4-Methoxyindole-3-carbinol on the Proliferation of Colon Cancer Cells In Vitro, When Treated Alone or in Combination with Indole-3-carbinol. J. Agric. Food Chem. 2010, 58, 8453–8459. [Google Scholar] [CrossRef]
  27. Glatt, H.; Engst, W.; Florian, S.; Schreiner, M.; Baasanjav-Gerber, C. Feeding Brassica vegetables to rats leads to the formation of characteristic DNA adducts (from 1-methoxy-3-indolylmethyl glucosinolate) in many tissues. Arch. Toxicol. 2022, 96, 933–944. [Google Scholar] [CrossRef]
  28. Badenes-Pérez, F.R.; Cartea, M.E. Glucosinolate Induction and Resistance to the Cabbage Moth, Mamestra brassicae, Differs among Kale Genotypes with High and Low Content of Sinigrin and Glucobrassicin. Plants 2021, 10, 1951. [Google Scholar] [CrossRef]
  29. Cong, C.; Yuan, X.; Hu, Y.; Chen, W.; Wang, Y.; Tao, L. Sinigrin attenuates angiotensin II-induced kidney injury by inactivating nuclear factor-κB and extracellular signal-regulated kinase signaling in vivo and in vitro. Int. J. Mol. Med. 2021, 48, 161. [Google Scholar] [CrossRef]
  30. Zhang, J.; Wang, S. Antidiabetic Potential of Sinigrin Against Streptozotocin-Induced Diabetes via Modulating Inflammation and Oxidative Stress. Appl. Biochem. Biotechnol. 2022, 194, 4279–4291. [Google Scholar] [CrossRef]
  31. Kaiser, A.E.; Baniasadi, M.; Giansiracusa, D.; Giansiracusa, M.; Garcia, M.; Fryda, Z.; Wong, T.L.; Bishayee, A. Sulforaphane: A Broccoli Bioactive Phytocompound with Cancer Preventive Potential. Cancers 2021, 13, 4796. [Google Scholar] [CrossRef] [PubMed]
  32. Buffagni, V.; Vurro, F.; Janni, M.; Gullì, M.; Keller, A.A.; Marmiroli, N. Shaping Durum Wheat for the Future: Gene Expression Analyses and Metabolites Profiling Support the Contribution of BCAT Genes to Drought Stress Response. Front. Plant Sci. 2020, 11, 891. [Google Scholar] [CrossRef]
  33. Schuster, J.; Binder, S. The mitochondrial branched-chain aminotransferase (AtBCAT-1) is capable to initiate degradation of leucine, isoleucine and valine in almost all tissues in Arabidopsis thaliana. Plant Mol. Biol. 2005, 57, 241–254. [Google Scholar] [CrossRef] [PubMed]
  34. Wang, C.; Dissing, M.M.; Agerbirk, N.; Crocoll, C.; Halkier, B.A. Characterization of Arabidopsis CYP79C1 and CYP79C2 by Glucosinolate Pathway Engineering in Nicotiana benthamiana Shows Substrate Specificity toward a Range of Aliphatic and Aromatic Amino Acids. Front. Plant Sci. 2020, 11, 57. [Google Scholar] [CrossRef] [PubMed]
  35. Essoh, A.P.; Monteiro, F.; Pena, A.R.; Pais, M.S.; Moura, M.; Romeiras, M.M. Exploring glucosinolates diversity in Brassicaceae: A genomic and chemical assessment for deciphering abiotic stress tolerance. Plant Physiol. Biochem. 2020, 150, 151–161. [Google Scholar] [CrossRef] [PubMed]
  36. Nintemann, S.J.; Vik, D.; Svozil, J.; Bak, M.; Baerenfaller, K.; Burow, M.; Halkier, B.A. Unravelling Protein-Protein Interaction Networks Linked to Aliphatic and Indole Glucosinolate Biosynthetic Pathways in Arabidopsis. Front. Plant Sci. 2017, 8, 2028. [Google Scholar] [CrossRef] [PubMed]
  37. Ku, K.; Becker, T.M.; Juvik, J.A. Transcriptome and Metabolome Analyses of Glucosinolates in Two Broccoli Cultivars Following Jasmonate Treatment for the Induction of Glucosinolate Defense to Trichoplusia ni (Hübner). Int. J. Mol. Sci. 2016, 17, 1135. [Google Scholar] [CrossRef]
  38. Dadashipour, M.; Yamazaki, M.; Momonoi, K.; Tamura, K.; Fuhshuku, K.; Kanase, Y.; Uchimura, E.; Kaiyun, G.; Asano, Y. S-selective hydroxynitrile lyase from a plant Baliospermum montanum: Molecular characterization of recombinant enzyme. J. Biotechnol. 2011, 153, 100–110. [Google Scholar] [CrossRef]
  39. Dhara, A.; Raichaudhuri, A. ABCG transporter proteins with beneficial activity on plants. Phytochemistry 2021, 184, 112663. [Google Scholar] [CrossRef]
  40. Li, Z.; Ma, S.; Song, H.; Yang, Z.; Zhao, C.; Taylor, D.; Zhang, M. A 3-ketoacyl-CoA synthase 11 (KCS11) homolog from Malania oleifera synthesizes nervonic acid in plants rich in 11Z-eicosenoic acid. Tree Physiol. 2021, 41, 331–342. [Google Scholar] [CrossRef]
Figure 1. Total glucosinolate concentrations in the root (R), central leaves (CLs), outer leaves (OLs), and petiole (P) of C. violifolia. Letters above the boxes mean significant difference at p < 0.05.
Agronomy 13 02760 g001
Figure 2. Analysis of differentially expressed genes (DEGs). (A) Statistics of the DEGs in each comparison group; (B) expression profiles of the DEGs; (C) expression trends of the DEGs according to the K-means; (D) the ten most enriched KEGG pathways of the DEGs in each comparison group.
Agronomy 13 02760 g002
Figure 3. Analysis of the DEGs and metabolites enriched in the glucosinolate biosynthesis pathway (Ko00966). (A) Statistics of the DEGs and metabolites enriched in Ko00966; (B) abundance changes of the metabolites enriched in Ko00966; (C) expression profiles of the DEGs enriched in Ko00966; (D) correlation analysis of the DEGs and metabolites, ** in the box represent significant correlation at p < 0.01, respectively.
Agronomy 13 02760 g003
Figure 4. Weighted gene co-expression network analysis. (A) Correlations between the modules and traits. The numbers in each module include Pearson’s correlation coefficient and the p value. The significant threshold was set at p < 0.01; (B) expression pattern and network of the genes in the brown module; (C) expression pattern and network of the genes in the blue module; (D) expression pattern and network of the genes in the red module.
Agronomy 13 02760 g004
Table 1. Glucosinolates in C. violifolia and their relative abundances.
Peak Area
NumberCompoundsQ1/Q3 (Da)FormulaCASROLsNLP
1Sinigrin358.03/97.00C10H17NO9S23952-98-570,10738,76471,35929,282
21-Methylpropyl glucosinolate374.06/96.96C11H21NO9S2499-24-1--1,391,350--3,741,625
32-Hydroxy-3-butenyl glucosinolate388.04/96.96C11H18NO10S2585-95-547,79042,87934,74521,328
43-Methylbutyl glucosinolate388.07/96.96C12H23NO9S276265-22-0442,681849,3802,954,0001,790,425
54-Methylamyl Glucosinolate402.09/96.96C13H25NO9S2NR71,073412,570125,015114,490
63-Methylsulfinylpropyl glucosinolate422.02/96.96C11H21NO10S3554-88-1--130,84331,54764,189
72-Phenylethyl glucosinolate422.06/96.96C15H21NO9S2499-30-9--119,572--64,322
8Glucoraphanin436.04/96.96C12H23NO10S321414-41-519,85218,20723,12619,318
9Glucocheirolin438.02/96.96C11H21NO11S315592-36-624,60316,5923254--
10m-Methoxybenzyl glucosinolate438.05/96.96C15H21NO10S2111810-95-8--607,625157,487252,432
11Indol-3-ylmethyl glucosinolate (glucobrassicin)447.05/96.96C16H20N2O9S24356-52-981,295,750823,81514,810,3501,919,025
124-Methylsulfonyl-3-butenyl Glucosinolate450.02/96.96C12H20NO11S3-NR30,81313,23222,9927294
135-Methylsulfinylpentyl glucosinolate450.06/96.96C13H25NO10S3499-37-61,019,337--629214,157
146-Methylsulfinylhexyl Glucosinolate464.07/96.96C14H27NO10S333049-17-124,451,000306,35591,282,750780,712
15Neoglucobrassicin477.06/96.96C17H22N2O10S25187-84-8112,740,0002,294,70020,769,2502,774,300
164-Methoxyglucobrassicin477.06/96.96C17H22N2O10S283327-21-3115,092,5002,199,97519,990,2502,528,200
176-(Methylsulfonyl)Hexyl Glucosinolate480.08/96.96C14H27NO11S374542-18-02,201,85030,740306,29739,689
184-Benzoyloxybutyl glucosinolate494.08/96.96C18H24NO11S2NR1,734,9007819--34,278
191,4-Dimethoxyglucobrassicin507.08/476.06C18H24N2O11S2NR307,1202631150--
Sum 339,688,6489,307,520150,596,89714,202,011
NR: not recorded, --: not detected. R: root, P: petiole, CLs: central leaves, OLs: outer leaves. Q1: the molecular weight of the parent ion of a substance added with ions when it passed through the electrospray ion source; Q3: the molecular weight of the characteristic fragment ion.
Table 2. Annotation statistic of the unigenes in the databases.
DatabaseNumber of GenesPercentage (%)
KEGG64,31453.62
Nr88,59773.87
SwissProt67,35056.15
TrEMBL88,36073.67
KOG53,81744.87
GO77,88564.94
Pfam60,21150.2
Annotated in at least one database90,23375.23
Total Unigenes119,939100
Disclaimer/Publisher’s Note: The statements, opinions and data contained in all publications are solely those of the individual author(s) and contributor(s) and not of MDPI and/or the editor(s). MDPI and/or the editor(s) disclaim responsibility for any injury to people or property resulting from any ideas, methods, instructions or products referred to in the content.

