Abstract
Efficient collection of airborne spray is crucial to reduce environmental contamination and ensure effective pesticide application in agriculture. This study explored the efficacy of passive spray drift samplers, focusing on string collectors for capturing airborne spray droplets. String collectors were assessed in laboratory experiments using a spray drift tunnel. A notable average recovery rate of 82% was observed when string collectors were examined immediately after pesticide capture. Collection efficiency was found to increase with wind speed. Of all the string collectors, string #5, a yarn type, demonstrated consistent collection efficiency, meeting the criteria for passive samplers. This includes effective droplet capture at low wind speeds, a high recovery rate of 93.31%, and suitability for field experiments. Field evaluations further underlined the efficiency of string #5, showcasing its ability to capture spray drift across a wider area and varied heights with less effort and manpower compared to traditional nylon screens.
1. Introduction
In recent years, regulatory authorities worldwide have gravitated towards more stringent pesticide regulations, spurred by heightened awareness of the risks pesticides pose to both human health and the environment. For instance, the United States Environmental Protection Agency and the European Food Safety Authority have set maximum residue limits within their respective legislations. These limits dictate the maximum acceptable levels of pesticides and veterinary drugs in food and agricultural products [1,2]. Similarly, Republic of Korea and Japan have implemented the positive list system to achieve the same objectives, with the relevant policies now in effect [3,4].
Pesticide residues on agricultural products often arise from the overuse of pesticide chemicals [5]. This issue becomes more pronounced in agricultural areas due to the phenomenon known as pesticide spray drift. This involves pesticides, originally applied to one farmland, being dispersed by the wind, resulting in deposition on adjacent crops [6,7,8,9]. Thus, a pivotal factor in ensuring food safety is the mitigation of pesticide spray drift.
Modern farming trends are leaning towards operations on a larger scale, with the subsequent rise in the usage of modern pest control devices such as tractor sprayers and aerial drones. The use of these sprayers across large crop areas has accentuated the persistent challenge of spray drift, making monitoring of airborne drift a matter of serious concern. This is especially true when extensive cropland is considered, as monitoring relatively small amounts of pesticide is challenging [9,10,11,12]. Present-day methods to measure airborne spray drift in situ primarily rely on passive collectors such as pipe cleaners, ball-shaped collectors, tubes, plastic or nylon lines, and nylon screens [13]. However, these methods often fall short in their spatial resolution or collection efficiency, especially under field conditions [13,14].
In light of this, string collectors emerge as a viable alternative, offering the ability to intercept and capture airborne droplets dispersed over large areas at a relatively low cost. Historically, string collectors have been primarily employed in wind tunnel experiments [15,16,17,18] and field trials [19,20,21,22,23] to measure pesticide drift. String collectors in wind tunnel experiments offer controlled insights into pesticide droplet behaviour. In field trials, they capture real-world drift data under varying natural conditions. In both applications, string collectors have stood out due to their impressive spatial resolution, ease of deployment, and cost-effectiveness. However, various factors such as the shape, dimension, texture, and material of the collectors can significantly influence their collection efficiency [14]. Although some studies have examined the collection efficiency of string collectors, they often gauge this relative to the maximum value obtained [16]. While informative within the confines of a specific experiment, this method may be limiting when extrapolating results to diverse settings or conditions. In a more precise context, studies assessing collection efficiency have primarily been directed at nylon screen collectors [13,24], leaving a noticeable research gap regarding string collectors.
This study aims to evaluate the collection efficiency of various string collectors in capturing airborne pesticide drift and to assess their applicability in crop field settings. We gauged collection efficiency within a compact spray drift tunnel, modelled on the design utilised by Park et al. [13], evaluating the change in collection efficiency under varying wind speed conditions. The selected string collector was subsequently tested in field trials, contrasting its efficacy against the nylon screen collector, renowned for its collection efficiency. This methodology enabled us to evaluate the practical utility of the string collector comprehensively.
2. Materials and Methods
2.1. String Collectors
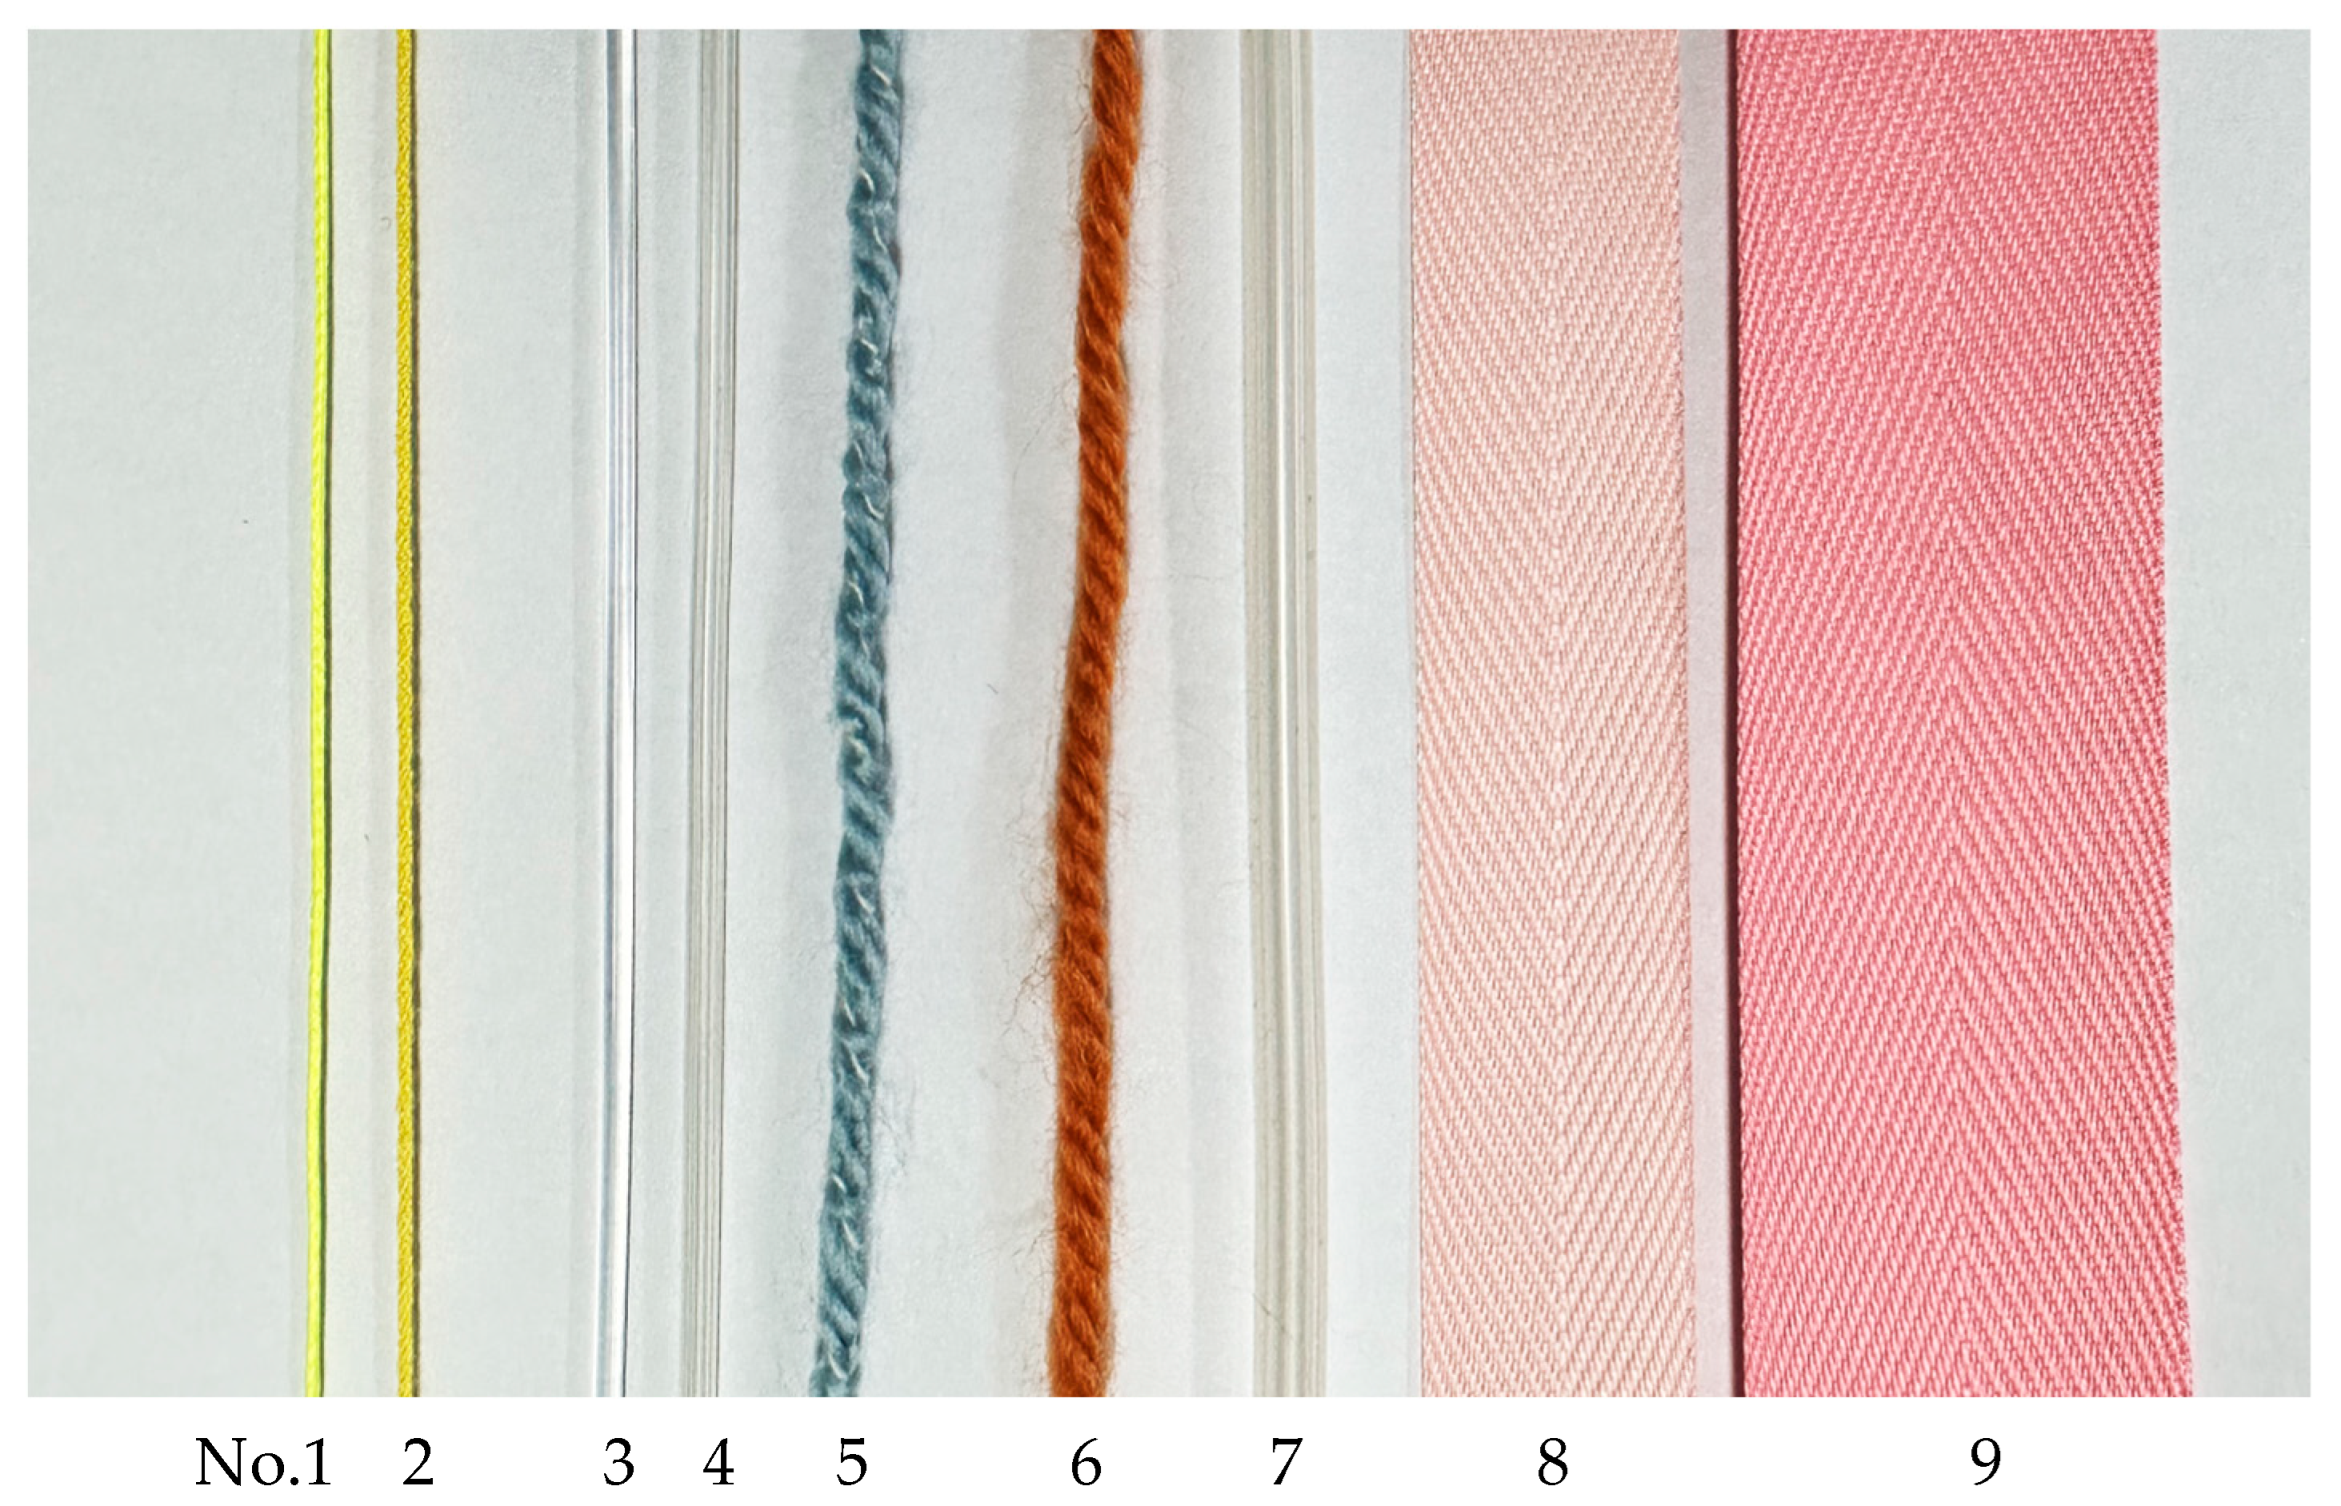
String collectors serve as a type of passive sampler designed to measure spray drift. As per guidelines by the International Organisation for Standardisation (ISO 22866), string collectors exhibit high collection efficiency [25]. Certain materials, such as polythene, PTFE (polytetrafluoroethylene) and metal, offer a defined sampling area, making data collection straightforward. In contrast, materials like cotton and woollen strings can be problematic due to their ill-defined collection area. A survey of previous studies showcases the utilisation of various materials for string collectors, encompassing polythene [26,27], polyester [28], cotton ribbon [29,30], nylon, and acrylic [31]. In this study, nine distinct types of string collectors were used to evaluate their efficacy in capturing airborne droplets. As depicted in Table 1 and Figure 1, these string collectors are distinguished by both material and diameter.

Table 1.
Detailed specifications of nine string collectors used in this study.

Figure 1.
Picture of nine string collectors used in this study.
The string collectors were sequentially numbered from 1 to 9 based on increasing diameter. For yarn strings like #2, #5, and #6, the diameter was not immediately clear due to their hairiness [32]. As such, the diameter was determined excluding the hair. Nonetheless, considering spray droplet collection, hairiness might significantly influence results. Therefore, we measured the diameter, including the hair, on nine occasions and then calculated the average, which we termed the “converted diameter”.
2.2. Spray Drift Tunnel Setup and Collection Efficiency
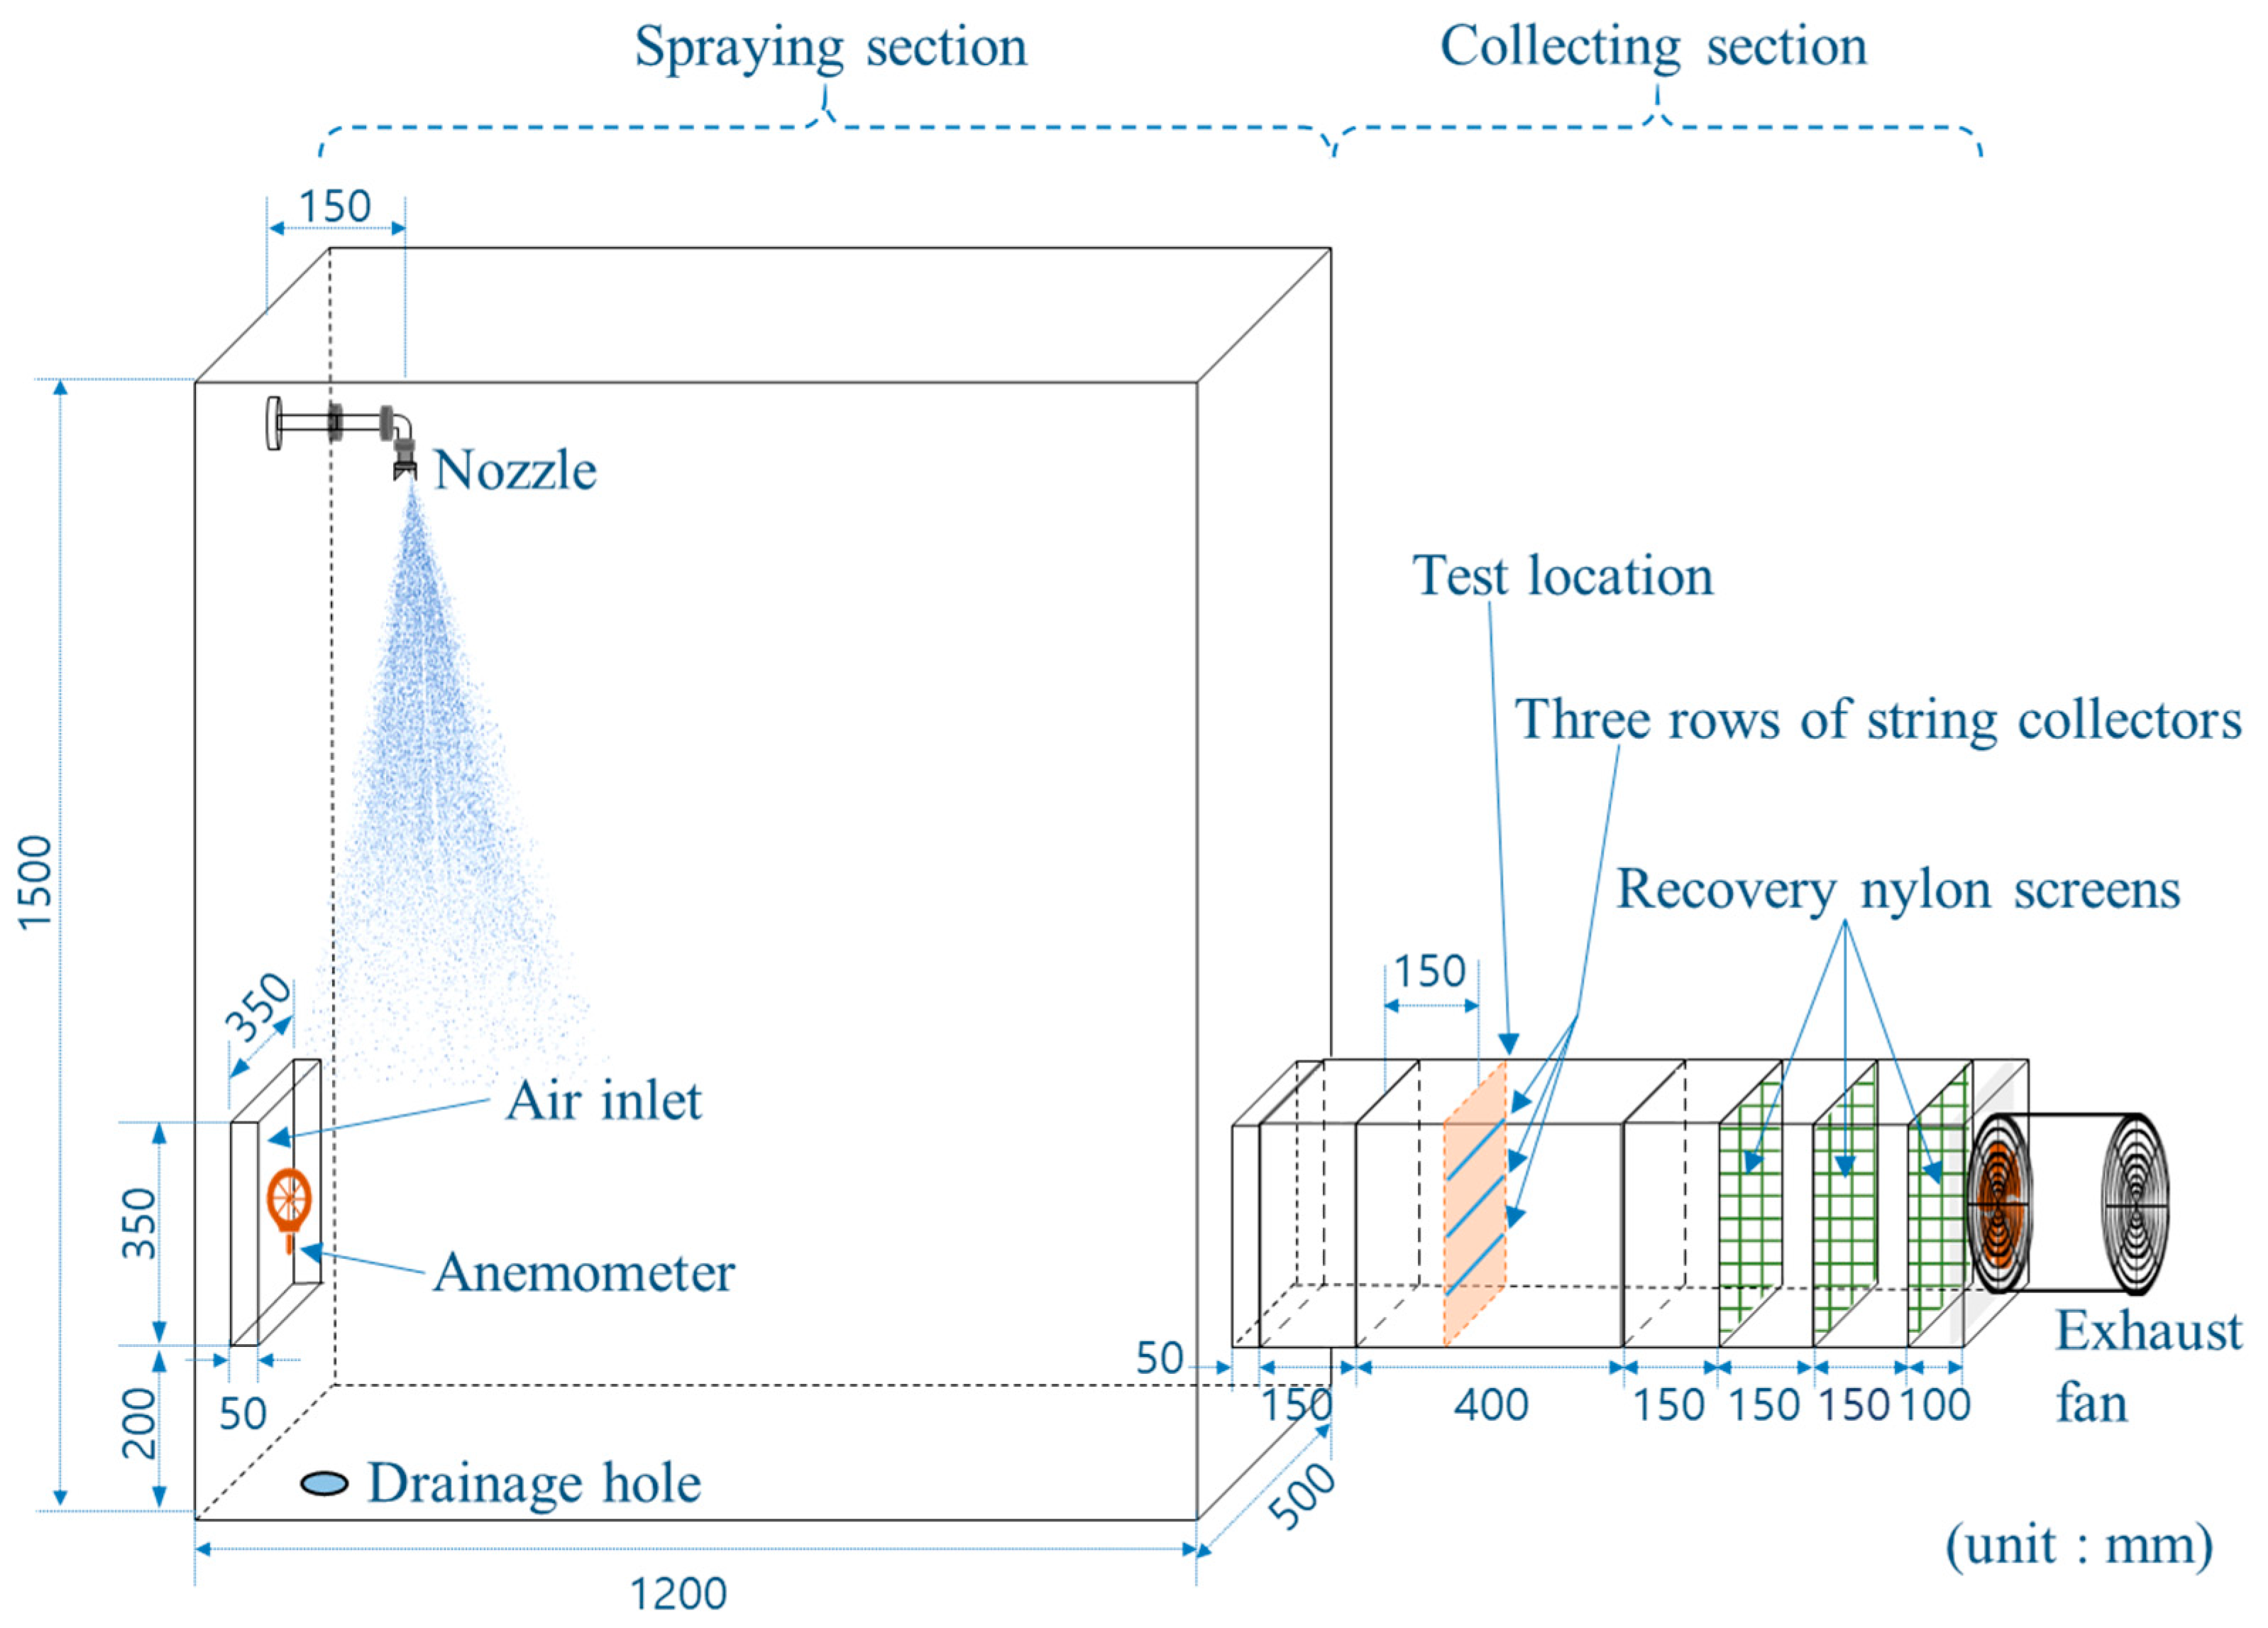
A small spray drift tunnel developed by Park et al. [13] was used to assess the collection efficiency of the string collectors (Figure 2). The spray drift tunnel consists of a spraying section and a collecting section. In the spraying section, a flat-fan nozzle (XR11002, Teejet Technologies, Springfield, IL, USA) is mounted on the ceiling, dispensing liquid droplets downward at a pressure of 0.25 MPa. Simultaneously, a fan (SLF-300D, Sung IL E-B Corp., Seoul, Republic of Korea) situated on the side propels the wind horizontally. Consequently, smaller, driftable droplets are carried by the wind into the collecting section, while the larger droplets settle on the spraying section’s floor.
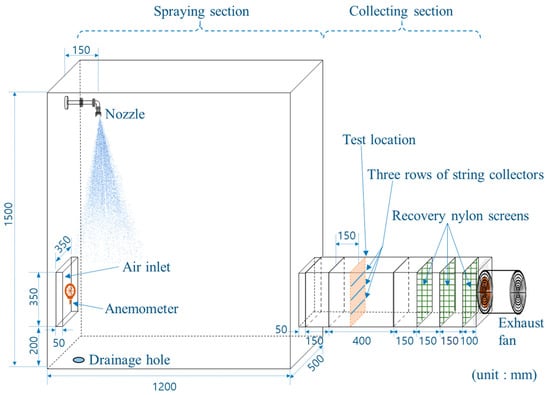
Figure 2.
Experimental setup of the small spray drift tunnel with string collectors. Reprinted/adapted with permission from [13]. Copyright 2022, Park et al.
The collecting section has a tunnel shape with a cross-section measuring 350 mm × 350 mm. At the test site within this section, string collectors were positioned for the experiment. These string collectors were arranged in three evenly spaced rows at the test location to analyse the number of droplets captured on the strings.
In front of the fan, three recovery nylon screens with a mesh number of 100 are positioned to prevent droplets from exiting the experimental apparatus and to maintain consistent pressure in the collecting section, ensuring a uniform wind speed distribution. Before testing the string collectors, a preliminary experiment was conducted: the recovery nylon screens were relocated to the test site, and the amount of water droplets captured on them was analysed. This value represented the total volume of spray liquid droplets drifting at the test location. Thus, the collection efficiency was calculated as the volume of droplets captured by the string collector divided by the total volume of drifting droplets at the same location, as detailed in Equation (1):
where is the collection efficiency of the collector; is the amount of spray liquid deposited on the collector (mL cm−2); and is the total airborne drift (mL cm−2).
2.3. Spray Deposit Analysis
The amount of spray liquid deposited on both the string collectors and recovery nylon screens was analysed using the total organic carbon (TOC) analysis method. This method, proposed by Park et al., was validated by comparing it with measurements made through liquid chromatography [13].
Upon concluding the experiment, the strings and screens were separately rinsed with deionised ultrapure water. The TOC concentration of the rinse water was gauged using a TOC analyser (Multi N/C® 3100, Analytik Jena, Jena, Germany), employing the non-purgeable organic carbon method. Moreover, strings and screens that were not part of the experiment underwent the same process to ascertain the blank TOC concentrations, which were subsequently factored into the analysis. The TOC concentration of the spray liquid within the tank was also determined. Ultimately, the volume of spray liquid captured by the collector or screen was deduced using Equation (2):
where is the amount of spray liquid deposited on the string or screen (mL cm−2); and are the TOC concentrations of the washing water for the tested string/screen and blank string/screen, respectively (mg L−1); is the TOC concentration of the spray liquid in the tank (mg mL−1); is the volume of the test liquid including the washing water and the deposited spray liquid (L); and is the projection area of the string or screen on a plane perpendicular to the wind direction and calculated by multiplying the diameter (or the converted diameter in the case of yarn strings) by the length (cm2).
2.4. Experimental Procedure
Experiments were conducted on the nine string collectors. The collection efficiency of each string collector was measured under four wind speed conditions (0.5, 1, 2, and 3 m s−1) within the collecting section of the spray drift tunnel. A wind speed of 3 m s−1 is proximate to the maximum permissible wind speed, commonly recommended to prevent damage from pesticide drift during spray applications [33]. After mounting the string collector at the test location, the fan and spray nozzle were activated, and a drift experiment was carried out for 10 s. The spray deposit on the collector was then analysed. This procedure was repeated three times for each string collector and wind speed. The pesticide solution used was a suspension concentrate formulation (SC), typically used for both ground and aerial application of insecticides. For the safety of the experiment, a specially formulated pesticide product, devoid of the active, was used.
Statistical analysis was conducted using the non-parametric Kruskal–Wallis test [34] and Dunn’s test [35] to assess differences in collection performance with respect to the type of string collectors. A p-value below 0.05 was set as the criterion for statistical significance, while instances with a p-value below 0.1 were considered to present marginal evidence of significance.
2.5. Size of Airborne Drift Droplets
The size of airborne drift droplets can vary based on wind speed, which can influence their collection on the string. In our study, we gauged the size of droplets drifting in the air at the test location using a particle/droplet image analyser (PDIA), specifically the VisiSize P15 (Oxford Lasers, Imaging Division, Oxford, UK). The PDIA operates by illuminating the target area with LED lighting, capturing shadow images of the droplets with a high-quality digital camera, and subsequently analysing these images. The PDIA was positioned at the test location within the spray drift tunnel. Upon activating the fan and spray nozzle, we measured the diameter distribution of the airborne drift droplets. This diameter distribution was assessed thrice at the site where the three rows of string collectors were placed.
2.6. Recovery Test for String Collectors
To enhance accuracy and minimise errors in measuring the amount of drift, it is imperative to trust the recovery rate during the analytical process of string collectors. A specific amount of 50 μL pesticide solution was administered to the string collectors using a micropipette. The amount of pesticide solution applied was then re-measured using the TOC analysis method. The recovery rate was deduced by comparing the measured amount from the string collector with the originally applied amount.
During field experiments, analysis of the employed string collectors is typically conducted after they are transported to the laboratory, rather than immediately post-experiment. Therefore, the recovery rate was analysed considering the delay time. After administering the pesticide solution to the string collectors, analyses were performed promptly (within 5 min) and following intervals of 3 and 10 h. Each test was conducted three times. Consequently, the variance in recovery rate, influenced by the delay time, was determined.
2.7. Selection of String Collectors
Based on the experimental results, the optimal string collector was selected based on three criteria. (a) The collector must effectively capture small airborne spray droplets with high efficiency, even under low wind speed conditions. (b) The spray liquid captured on the collector should be consistently and accurately recoverable during the analysis phase. (c) The collector should be cost-effective and convenient for use in field drift experiments.
Criteria a and b adhere to the conditions prescribed for acceptable airborne spray drift sampling in ISO22866 [25], whilst criterion c was proposed in this study to gauge field usability. For multiple measurements across vast spaces and leeward distances, the string collector should be cost effective. Additionally, the string must be flexible enough to be coiled and placed inside a glass bottle without losing any of the adhered spray solution.
2.8. Field Evaluation
In this research, the string collector, identified as the most suitable through laboratory experiments, was used for field testing to assess its applicability and dependability in real-world scenarios. Its performance was compared to that of nylon screens, which are routinely employed to measure airborne drift in the field and have been evaluated for their collection efficiency in earlier studies [13,24].
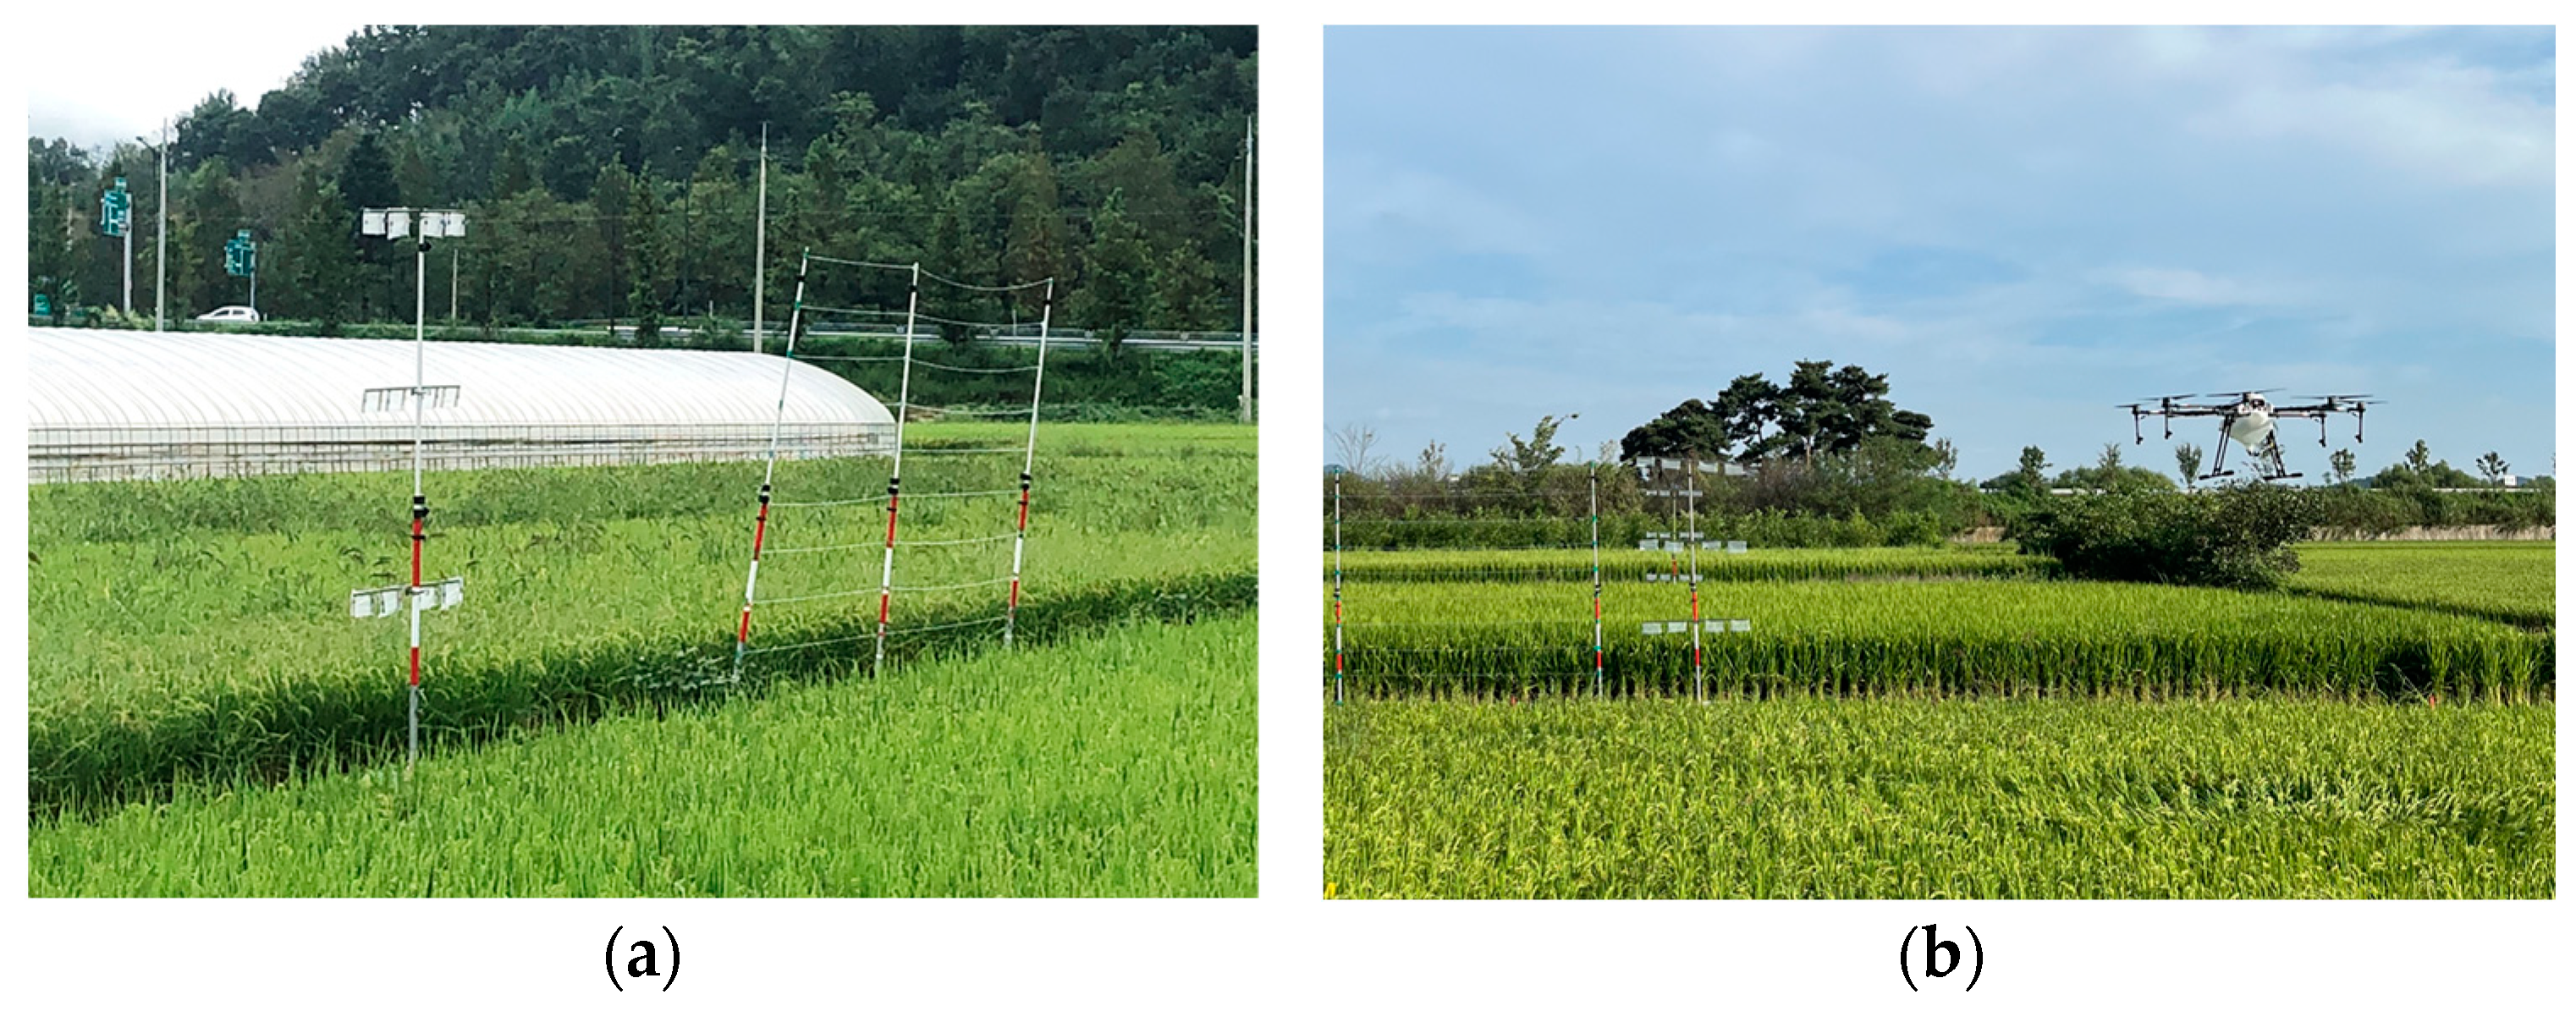
Experiments took place in two distinct paddy fields, with each site being tested on two occasions. Both the nylon screens and the string collector were erected at identical positions along the periphery of the fields (Figure 3). Post pesticide application using a drone, the volume of pesticide drift gathered on each sampler was quantified and contrasted. Nylon screens (0.1 × 0.2 m) were positioned at heights of 1, 2, and 3 m above the soil, with four screens per height to compute a mean value. Conversely, the string collector was laid out horizontally, extending over 5 m, with ten strings arranged at varied heights from 0.15 to 2.85 m above the earth, spaced at intervals of 0.3 m. Comprehensive data regarding all four trials is presented in Table 2. Given the discrepancies in factors like wind speed and spray volume between each trial, the relative efficacy of the nylon screen versus the string collector was examined under multiple conditions and environments.
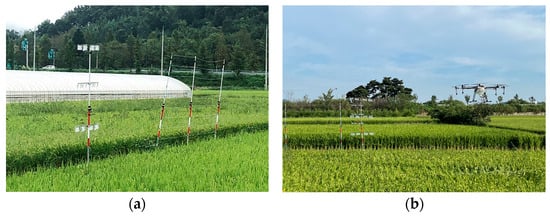
Figure 3.
Experimental photos. (a) Nylon screens and string collector installed at the boundary of the paddy field. (b) Pesticide spraying using a drone.
Table 2.
Experimental conditions for the four field evaluation tests of the string collector.
3. Results and Discussion
3.1. Airborne Spray Droplet Size
The diameter distribution of the airborne droplets traversing the collecting section, as gauged by the PDIA, is detailed in Table 3. As the wind speed increased, the median size of the airborne droplets increased from 86.4 μm to 145.1 μm. This suggests that heightened wind speeds exert a stronger momentum, causing airborne droplets to drift more readily. The size of these airborne droplets was recorded as being between 56–84 μm smaller than the size outlined by Park et al. [13], attributable to the limitations of the water-sensitive paper in detecting diminutive droplets. From a methodological standpoint, the non-destructive assessment rendered by the PDIA is likely more precise. The droplets in the air were found to be smaller than those emitted from the nozzle (Dv10: 88 μm, Dv50: 166 μm, Dv90: 296 μm as observed by Park et al. [13]). Based on our data, the largest drift droplet size is estimated to lie between 130 and 200 μm, contingent on the prevailing wind speeds.
Table 3.
Size distribution of airborne droplets drifting in the collecting section.
3.2. Recovery of String Collectors
The average recovery rate of the string collectors was approximately 82% when analysed immediately following pesticide capture. This percentage reduced to around 71% when assessed 3 h after the capture and further decreased to approximately 66% upon a 10 h interval post-capture, as depicted in Table 4. As the interval after the pesticide capture extended, a decline in the recovery rate was evident, albeit the rate of this decline progressively diminished. Hence, it is advisable to rinse and store the string collectors promptly after drift experiments in the field, where feasible.
Table 4.
Recovery rate of string collectors based on the washing delay time.
Among the various collectors, string #5 exhibited the top recovery rate at 93.31%, with string #6 trailing at 87.45%. Both, identified as yarn strings, registered high recovery rates when rinsed immediately post-experiment. However, upon a delay of 3 or 10 h post-experiment, their recovery rates markedly decreased to figures in the vicinity of 65–69%, rendering them on par with, or slightly below, other collectors. In separate research endeavours, pipe brushes employed to gauge airborne spray drift were reported to have recovery rates oscillating between 72.5% and 78.5% [36], whilst the monofilament line recorded a recovery rate of 74% [37]. In light of these benchmarks, the recovery rates noted for string collectors within this study are deemed to be operationally acceptable.
3.3. Collection Efficiencies of String Collectors
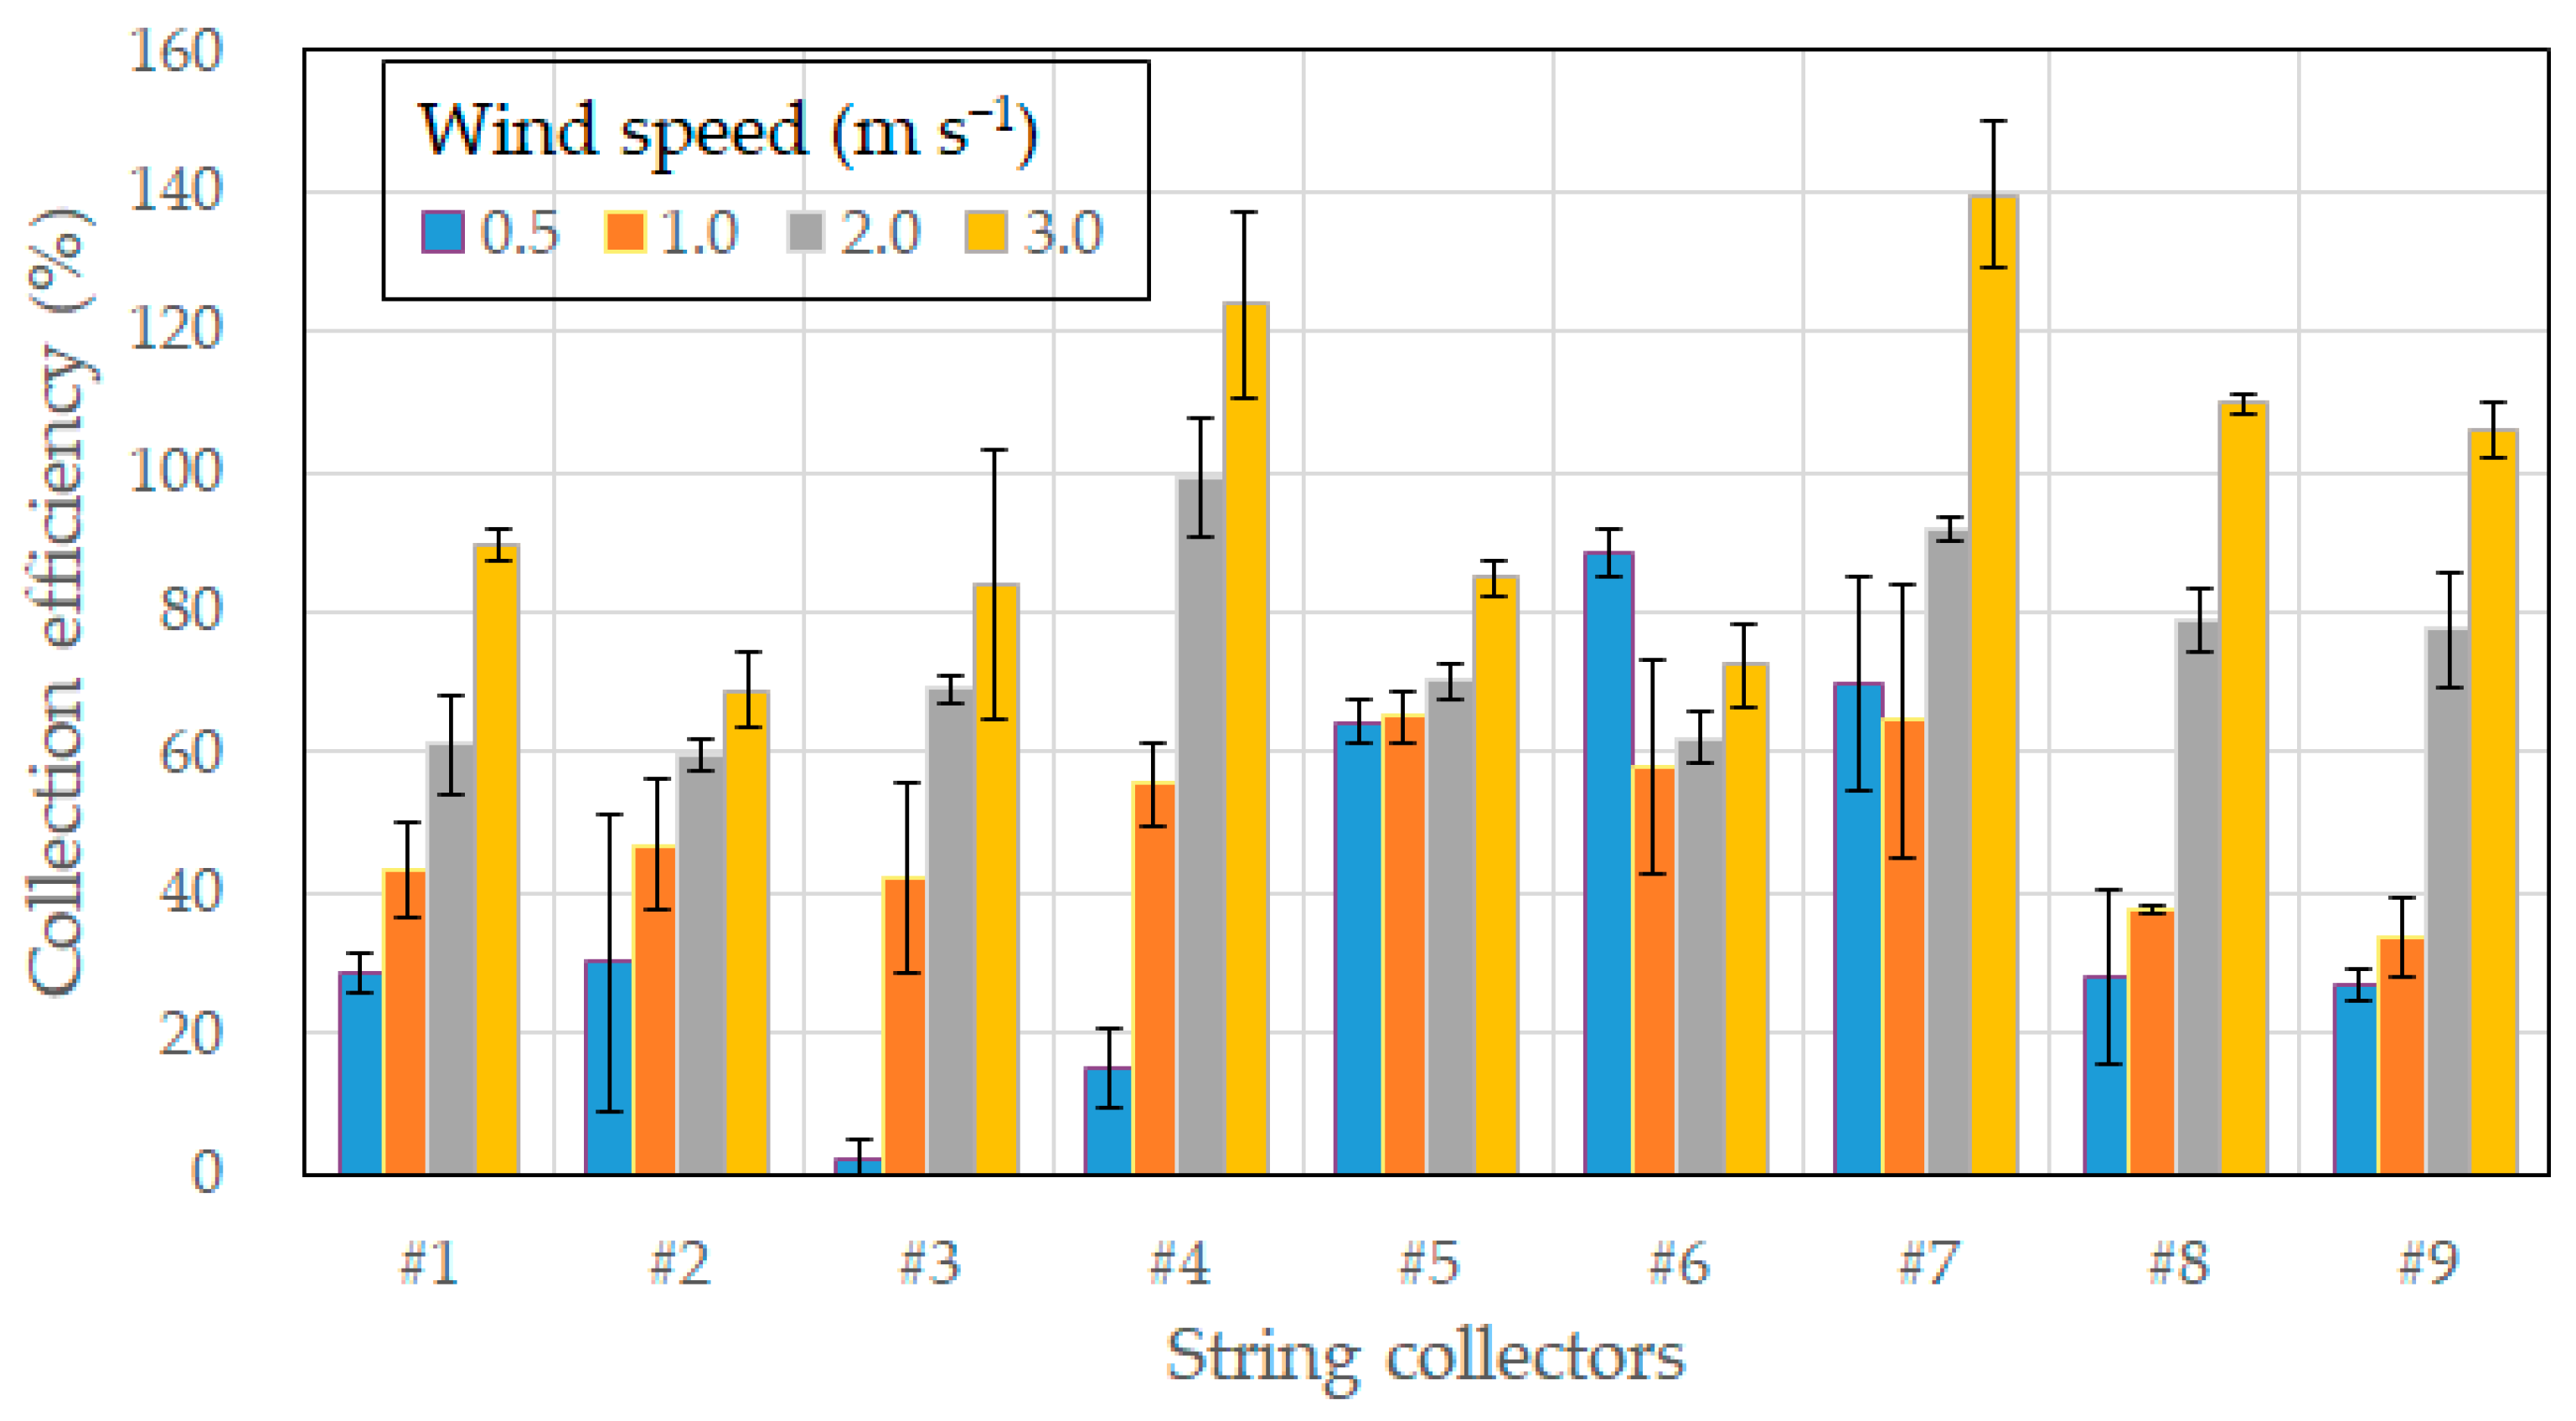
Table 5 illustrates the volume of spray droplets captured by the nine string collectors under varying wind speeds. With the increase in wind speed, there was an increase in the number of airborne spray droplets, leading to a corresponding increase in the number of droplets intercepted by all the strings. This translated into an enhanced collection efficiency for all nine string collectors, as shown in Table 6 and Figure 4. Coinciding with the increase in wind speed, the collection efficiency for all strings increased, mirroring findings consistently highlighted in prior research [13,24,31]. These studies suggest that at higher wind speeds, the kinetic energy of droplets increases allowing them to adhere more effectively to the surface of the string collector.
Table 5.
Spray deposition of the nine string collectors with respect to the wind speed. The unit is μL cm−2.
Table 6.
Collection efficiencies of the nine string collectors with respect to wind speed. The unit is %.
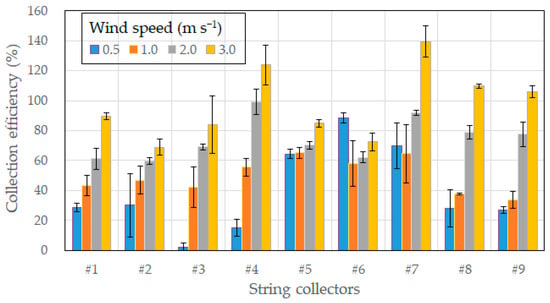
Figure 4.
Mean (bars) and standard deviation (error lines) of the collection efficiency for the nine string collectors under different wind speeds.
The nine string collectors were categorised by their type, and a Kruskal–Wallis test was carried out to determine if there was a notable disparity in collection efficiency among threads, yarns, tubes, and ribbons. The resulting p-values from the Kruskal–Wallis test stood at 0.279, 0.088, 0.088, and 0.073 for wind speeds of 0.5, 1.0, 2.0, and 3.0 m s−1, respectively. At a wind speed of 0.5 m s−1, the collection performance across the various string types displayed no significant distinction. Nevertheless, with rising wind speeds, a pattern of variable collection efficiency based on the string type began to emerge, albeit with only marginal evidence (p < 0.1). This implies that the selection of string type bears significance in terms of its efficacy as an airborne spray collector.
Dunn’s test was executed for wind speeds of 1.0 m s−1 and beyond, where there was statistical significance as per string type, to pinpoint which string types exhibited variations. The results from Dunn’s test are detailed in Table 7. The most prominent variations in string types were evident between yarn and tube; the distinction presented weak evidence at a wind speed of 2.0 m s−1 but became statistically significant when the wind speed increased to 3.0 m s−1. Yarns possess fibres on their surface, whereas tubes are of a sleek contour. In addition, yarns are crafted from acrylic-based materials, while tubes are made of silicone. The marked contrasts in both morphology and composition between yarns and tubes appear to underlie the disparities in their collection efficiency. In a similar vein, when juxtaposed with ribbons, yarns demonstrated distinctions, likely attributed to the ribbons’ distinctive form. Conversely, threads did not manifest any discernible variations when set against other varieties (ribbon, tube, yarn).
Table 7.
p-values of Dunn’s test for string types.
As highlighted in the statistical analysis, yarn strings exhibited unique collection performance when contrasted with other string types. As illustrated in Figure 4, the yarn strings (#5 and #6) demonstrated a fairly consistent collection efficiency across varying wind speeds. In contrast, the other strings showcased significant fluctuations in their collection efficiency as wind speed altered. The rationale behind the yarn strings’ superior collection efficiency, even at a modest wind speed of 0.5 m s−1, can be attributed to the delicate fibres on their surface, which adeptly ensnare even minuscule droplets [31].
3.4. Selection of Acceptable String Collector
The primary criterion for a passive sampler is its ability to efficiently collect droplets ranging in diameter from 10 to 100 μm at subdued wind speeds of 1 m s−1 or below [32]. In line with these stipulations (criterion a), yarn strings #5 and #6, along with tube #7, appear to be the most fitting. Additionally, considering the findings from the recovery test, yarn strings #5 and #6, as well as thread string #3, seem to meet criterion b. In terms of cost and practicality (criterion c), yarn strings #2, #5, #6, and thread string #1 are deemed suitable for field deployment. Therefore, yarn strings #5 and #6, which fulfil all three criteria, are identified as the optimal string collectors. Between the two, string #5, displaying marginally superior collection efficiency and recovery rate, was chosen as the most apt for field testing.
3.5. Field Evaluation
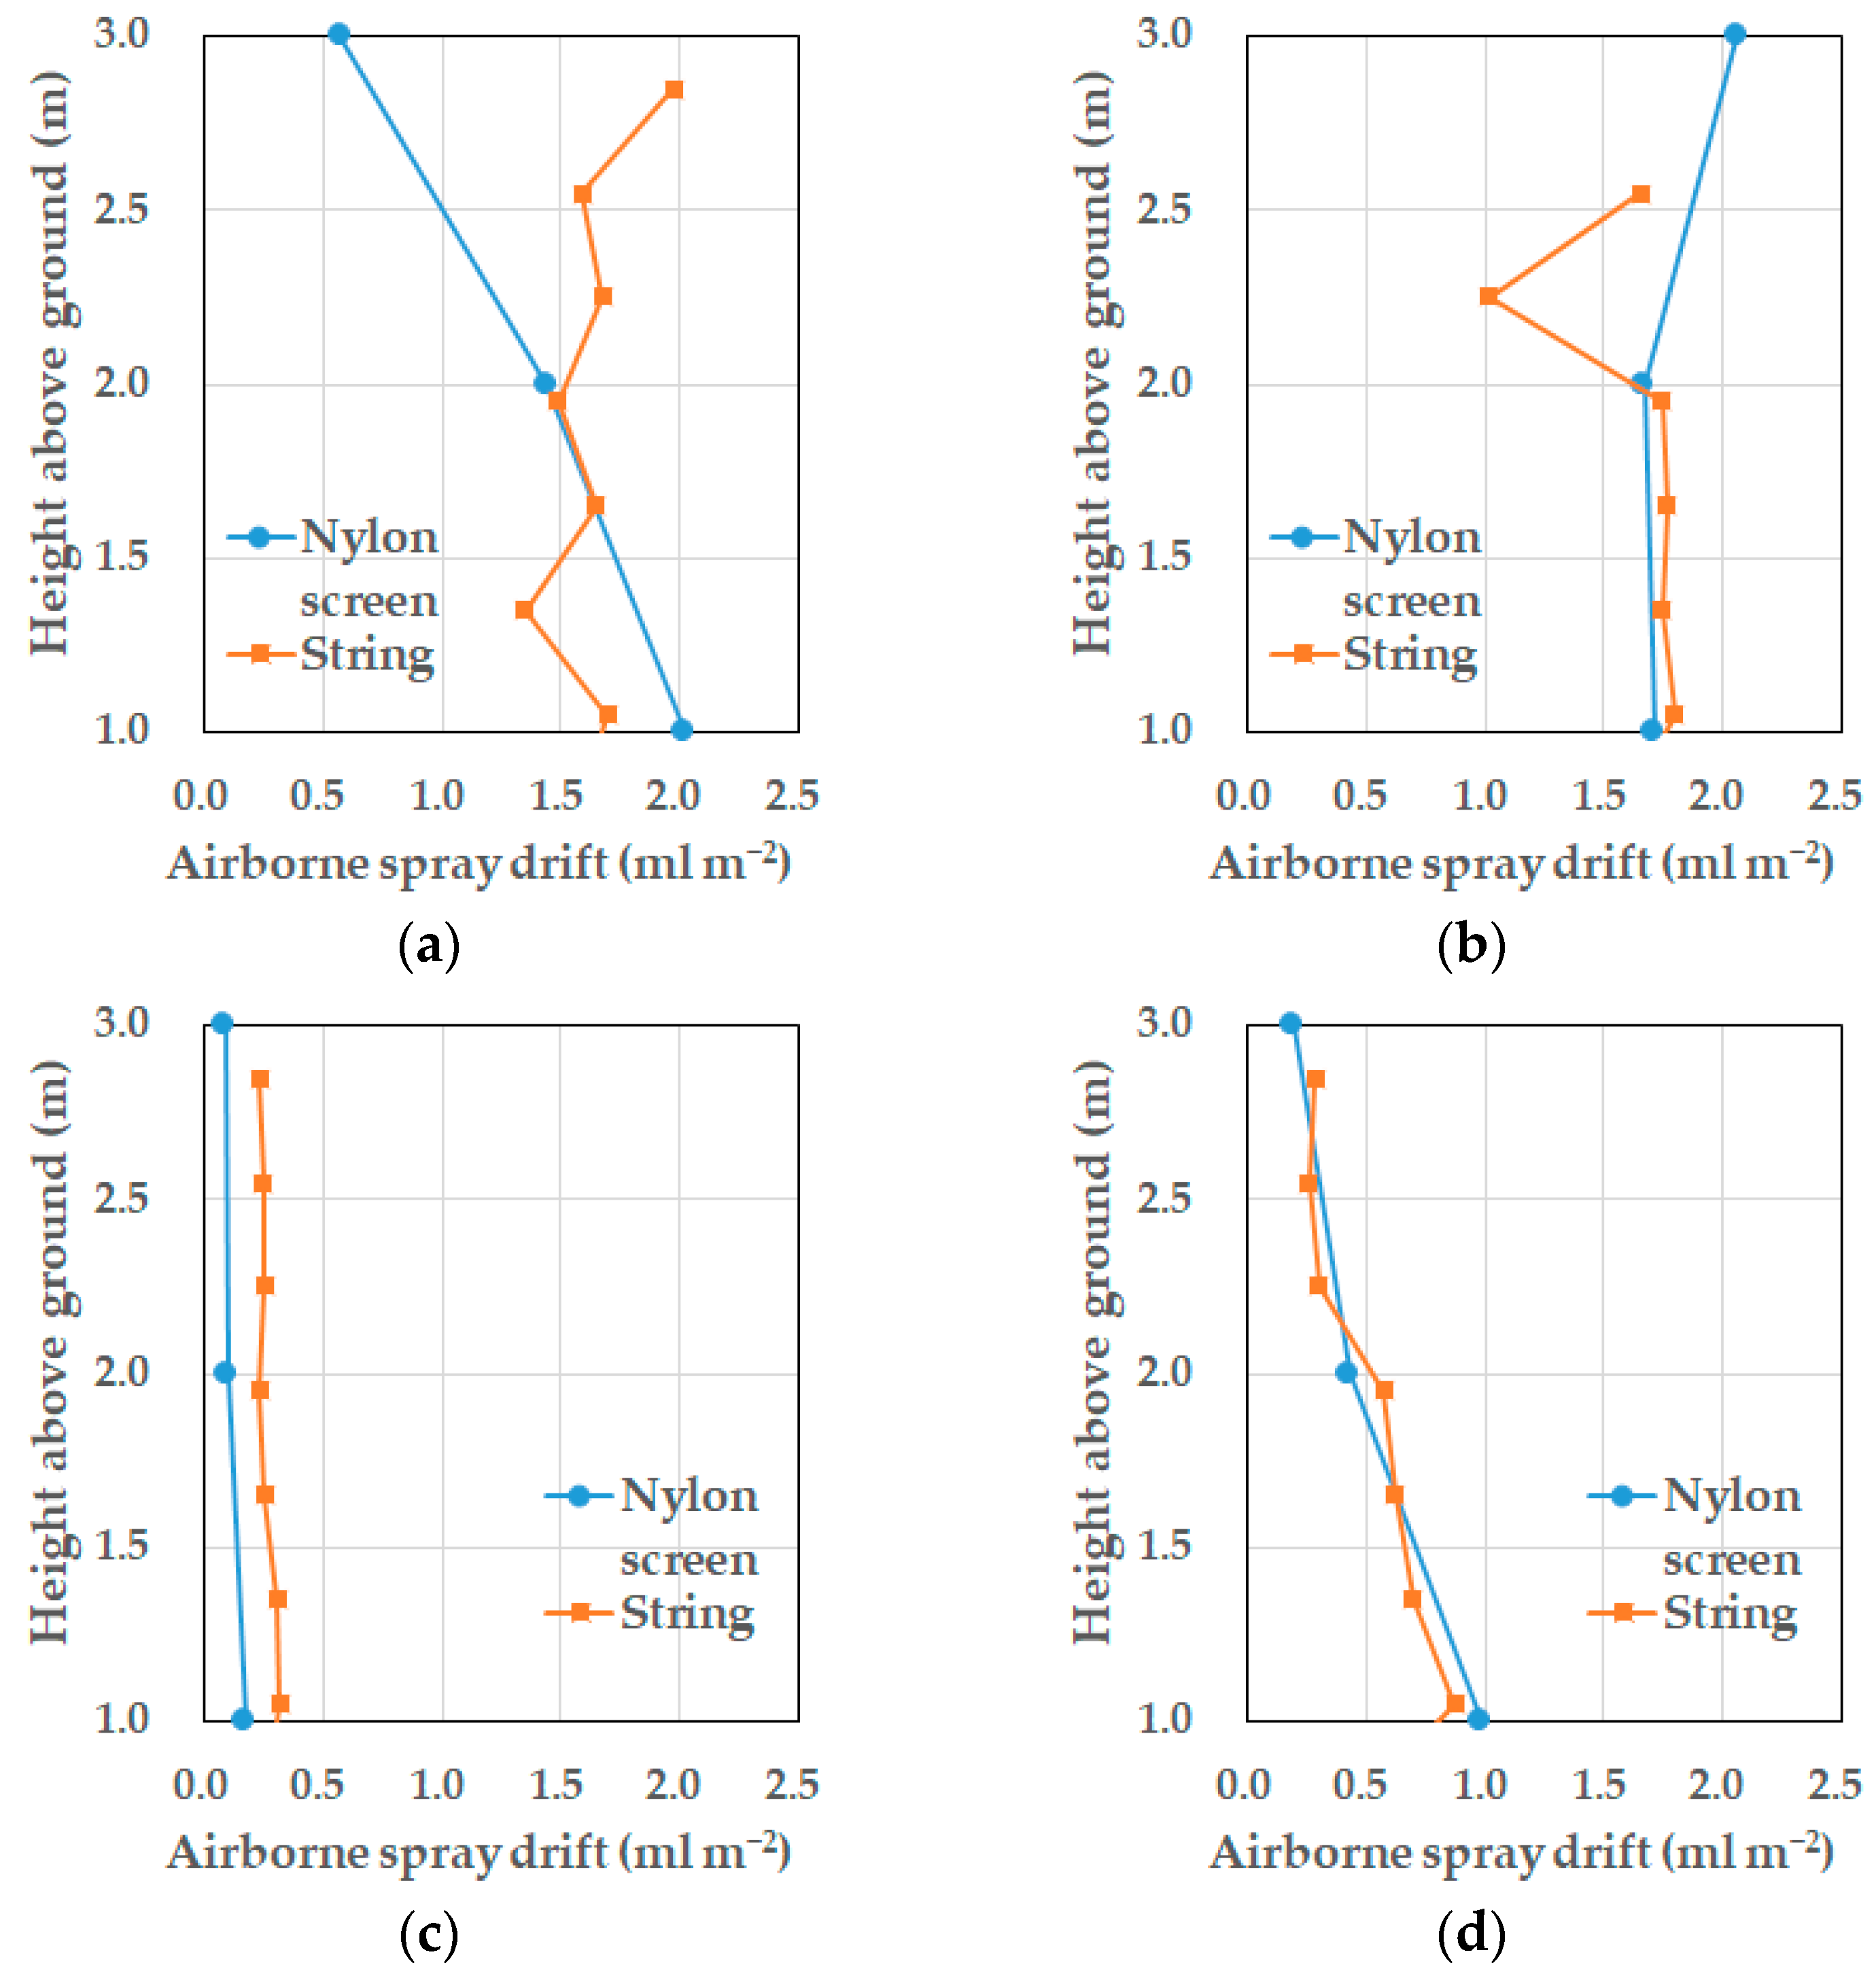
The field test was conducted using String #5, comparing its measurements of airborne spray drift to those from nylon screens, as illustrated in Figure 5. The vertical distribution of drift measured by both the nylon screens and the string collector exhibited similar patterns. Notably, Test 4 showed nearly identical trends. In Test 1, however, as the height increased, the drift captured by the nylon screens diminished, while the string collector retained a more consistent value.
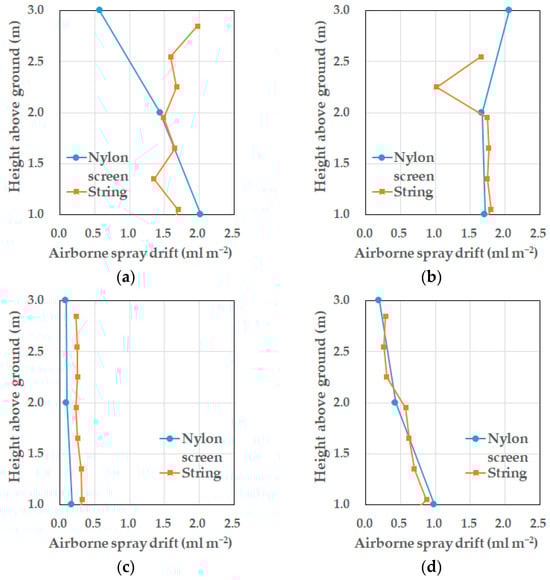
Figure 5.
Comparison of airborne spray drift measured by nylon screens and string collectors in four field evaluation tests: (a) Test 1, (b) Test 2, (c) Test 3, and (d) Test 4. Note: Data from the string positioned at 2.85 m in Test 2 were excluded due to a measurement error.
Although the precise heights of the two collectors do not match perfectly, drift values from the nylon screens at 1, 2, and 3 m can be contrasted with those from strings at 1.05, 1.95, and 2.85 m. Assuming the nylon screen’s data is accurate, the string collector’s results at these heights yielded a root-mean-square error (RMSE) of 0.45 mL m−2. By excluding data at the 3 m height from Test 1—where the most significant discrepancy was noted—the RMSE drops to a more acceptable 0.15 mL m−2, especially considering the overall drift range.
Although the basic cross-sectional areas of the two samplers might seem comparable, their total drift capture areas differ. The nylon screens, comprised of 12 screens, cover a height of 3 m and a width of 1.2 m. In contrast, the string collector spans a larger region, with ten strings covering a height of 2.85 m and a width of 5 m. Additionally, while nylon screens sample at three distinct heights, the string collector covers ten. This greater granularity offers more robust validation through cross-referencing values across different heights. For example, in Test 2, the drift recorded at 2.25 m was notably less than at adjacent heights of 1.95 m and 2.55 m. Such a variation could be plausible, but it does pose questions about the measurement’s accuracy. While it is feasible to deploy additional nylon screens over a broader area to match the string collector, this method demands more effort and resources. In summary, the string collector provides a more efficient and equally reliable means of measuring airborne spray drift than the nylon screens.
4. Conclusions
This study examined the efficiency and suitability of string collectors for capturing airborne spray droplets. The recovery rate of these collectors was highest at 82% immediately after pesticide capture, although it gradually decreased over time. Notably, yarn string #5 showcased the highest recovery rate, highlighting the exceptional performance of yarn-based strings.
The efficiency with which the string collectors captured droplets increased as wind speeds increased, a finding consistent with prior research. A Kruskal–Wallis test showed consistent performance across various string types at lower wind speeds. However, there was a slight indication of performance differences at higher speeds. Subsequent analysis via Dunn’s test pinpointed significant disparities between yarn and tube strings, likely stemming from their unique structural and material differences.
Yarn strings, especially #5 and #6, demonstrated consistent performance across diverse wind conditions, thanks in part to their fine surface hairs. These particular strings satisfied essential criteria for passive samplers, including their ability to effectively collect droplets of specific sizes at low wind speeds, their impressive recovery rates, and their practicality and affordability for field tests. Ultimately, string #5 was deemed the most apt for field usage.
Field tests further solidified the reliability of string #5, indicating similar drift measurements between nylon screens and string collectors, albeit with minor variations at certain heights. Moreover, string collectors captured data over a more extensive area and across different heights, providing a richer dataset with less effort than their nylon screen counterparts.
Author Contributions
Conceptualisation, J.P. and S.-w.H.; Methodology, S.-y.L., J.P. and S.-w.H.; Experiment, S.-y.L., L.-y.C., K.F.D., J.P., H.H.N. and S.-H.Y.; Formal analysis, S.-y.L., J.P. and S.-w.H.; Resources, S.-w.H., H.H.N. and S.-H.Y.; Writing—original draft preparation, S.-y.L. and S.-w.H.; Writing—review and editing, S.-w.H.; Visualisation, S.-y.L., L.-y.C. and J.P.; Project administration, S.-w.H.; Funding acquisition, S.-w.H. All authors have read and agreed to the published version of the manuscript.
Funding
This research was supported by the Basic Science Research Program through the National Research Foundation of Korea (NRF) funded by the Ministry of Education (grant number: 2019R1I1A3A01055863) and Research Program for Agricultural Science and Technology Development, National Institute of Agricultural Sciences, Rural Development Administration, South Korea (grant number: PJ017065012023). This work was also supported by the BK21 FOUR project of the Ministry of Education, Republic of Korea.
Data Availability Statement
Not applicable.
Conflicts of Interest
The authors declare no conflict of interest.
References
- EFSA; Carrasco Cabrera, L.; Medina Pastor, P. The 2020 European Union report on pesticide residues in food. EFSA J. 2022, 20, e07215. [Google Scholar] [CrossRef] [PubMed]
- USEPA. Maximum Residue Limits (MRL) Database, United States Environmental Protection Agency. Available online: https://www.fas.usda.gov/maximum-residue-limits-mrl-database (accessed on 14 July 2023).
- MHLW-Japan. Introduction of the Positive List System for Agricultural Chemical Residues in Foods, Department of Food Safety, Ministry of Health, Labour and Welfare, Japan. Available online: https://www.mhlw.go.jp/english/topics/foodsafety/positivelist060228/introduction.html (accessed on 14 July 2023).
- MAFRA-Korea. Introduction to the Positive List System (PLS), Ministry of Agriculture, Food and Rural Affairs, Republic of Korea. Available online: https://www.mafra.go.kr/PLS/2066/subview.do (accessed on 14 July 2023).
- Aktar, M.W.; Sengupta, D.; Chowdhury, A. Impact of pesticides use in agriculture: Their benefits and hazards. Interdiscip. Toxicol. 2009, 2, 1. [Google Scholar] [CrossRef] [PubMed]
- Bolz, H.; Sieke, C.; Michalski, B.; Schäfer, R.B.; Kubiak, R. Spray drift-based pesticide residues on untreated edible crops grown near agricultural areas. J. Consum. Prot. Food Saf. 2022, 17, 21–31. [Google Scholar] [CrossRef]
- Lazzaro, L.; Otto, S.; Zanin, G. Role of hedgerows in intercepting spray drift: Evaluation and modelling of the effects. Agric. Ecosyst. Environ. 2008, 123, 317–327. [Google Scholar] [CrossRef]
- Hong, S.-W.; Zhao, L.; Zhu, H. SAAS, a computer program for estimating pesticide spray efficiency and drift of air-assisted pesticide applications. Comput. Electron. Agric. 2018, 155, 58–68. [Google Scholar] [CrossRef]
- Jensen, P.K.; Olesen, M.H. Spray mass balance in pesticide application: A review. Crop Prot. 2014, 61, 23–31. [Google Scholar] [CrossRef]
- Hong, S.W.; Park, J.; Jeong, H.; Lee, S.; Choi, L.; Zhao, L.Y.; Zhu, H.P. Fluid Dynamic Approaches for Prediction of Spray Drift from Ground Pesticide Applications: A Review. Agronomy 2021, 11, 1182. [Google Scholar] [CrossRef]
- Marrs, R.H.; Frost, A.J. A microcosm approach to the detection of the effects of herbicide spray drift in plant communities. J. Environ. Manag. 1997, 50, 369–388. [Google Scholar] [CrossRef]
- Gregorio, E.; Torrent, X.; Planas de Marti, S.; Solanelles, F.; Sanz, R.; Rocadenbosch, F.; Masip, J.; Ribes-Dasi, M.; Rosell-Polo, J.R. Measurement of Spray Drift with a Specifically Designed Lidar System. Sensors 2016, 16, 499. [Google Scholar] [CrossRef]
- Park, J.; Lee, S.-y.; Choi, L.-y.; Hong, S.-w.; Noh, H.; Yu, S.-H. Airborne-Spray-Drift Collection Efficiency of Nylon Screens: Measurement and CFD Analysis. Agronomy 2022, 12, 2865. [Google Scholar] [CrossRef]
- Donkersley, P.; Nuyttens, D. A meta analysis of spray drift sampling. Crop Prot. 2011, 30, 931–936. [Google Scholar] [CrossRef]
- Torrent, X.; Garcera, C.; Molto, E.; Chueca, P.; Abad, R.; Grafulla, C.; Roman, C.; Planas, S. Comparison between standard and drift reducing nozzles for pesticide application in citrus: Part I. Effects on wind tunnel and field spray drift. Crop Prot. 2017, 96, 130–143. [Google Scholar] [CrossRef]
- Arvidsson, T.; Bergstrom, L.; Kreuger, J. Comparison of collectors of airborne spray drift. Experiments in a wind tunnel and field measurements. Pest Manag. Sci. 2011, 67, 725–733. [Google Scholar] [CrossRef]
- Alves, G.S.; Kruger, G.R.; da Cunha, J.P.A.; Vieira, B.C.; Henry, R.S.; Obradovic, A.; Grujic, M. Spray drift from dicamba and glyphosate applications in a wind tunnel. Weed Technol. 2017, 31, 387–395. [Google Scholar] [CrossRef]
- Zhang, H.; Gary, D.; Zheng, J.; Zhou, H.; Yu, J. Wind tunnel experiment and regression model for spray drift. Trans. Chin. Soc. Agric. Eng. 2015, 31, 94–100. [Google Scholar]
- Gregorio, E.; Rosell-Polo, J.R.; Sanz, R.; Rocadenbosch, F.; Solanelles, F.; Garcerá, C.; Chueca, P.; Arnó, J.; Del Moral, I.; Masip, J. LIDAR as an alternative to passive collectors to measure pesticide spray drift. Atmos. Environ. 2014, 82, 83–93. [Google Scholar] [CrossRef]
- Kasner, E.J.; Fenske, R.A.; Hoheisel, G.A.; Galvin, K.; Blanco, M.N.; Seto, E.Y.W.; Yost, M.G. Spray Drift from a Conventional Axial Fan Airblast Sprayer in a Modern Orchard Work Environment. Ann. Work Expo. Health 2018, 62, 1134–1146. [Google Scholar] [CrossRef]
- Baio, F.H.R.; Antuniassi, U.R.; Castilho, B.R.; Teodoro, P.E.; Silva, E.E.D. Factors affecting aerial spray drift in the Brazilian Cerrado. PLoS ONE 2019, 14, e0212289. [Google Scholar] [CrossRef] [PubMed]
- Caldwell, D.M.; Wolf, T. Quantification of spray drift from aerial applications of pesticide. In Proceedings of the Soils and Crops Workshop. Available online: https://www.google.com.hk/url?sa=t&rct=j&q=&esrc=s&source=web&cd=&ved=2ahUKEwjF-a_as52CAxVuilYBHfXjCmEQFnoECA8QAQ&url=https%3A%2F%2Fcore.ac.uk%2Fdownload%2Fpdf%2F226129663.pdf&usg=AOvVaw36W4UBkJxRPtWqw-sP2on7&opi=89978449 (accessed on 14 July 2023).
- Cotteux, E.; Rombaut, M.; Douzals, J. Comparison of vertical and horizontal collecting methods for spray deposits in crop canopy and airborn spray drift assessment. In Proceedings of the Suprofruit 2013: 12th workshop on Spray Application techniques in Fruit Growing, Valencia, Spain, 26–28 June 2013; pp. 5–7. [Google Scholar]
- Fox, R.D.; Derksen, R.C.; Zhu, H.; Downer, R.A.; Brazee, R.D. Airborne spray collection efficiency of nylon screen. Appl. Eng. Agric. 2004, 20, 147–152. [Google Scholar] [CrossRef]
- ISO 22866:2005; Equipment for Crop Protection-Methods for Field Measurement of Spray Drift. ISO: Geneva, Switzerland, 2005.
- Qi, L.; Miller, P.; Fu, Z. The classification of the drift risk of sprays produced by spinning discs based on wind tunnel measurements. Biosyst. Eng. 2008, 100, 38–43. [Google Scholar] [CrossRef]
- Wang, C.L.; Zeng, A.J.; He, X.K.; Song, J.L.; Herbst, A.; Gao, W.L. Spray drift characteristics test of unmanned aerial vehicle spray unit under wind tunnel conditions. Int. J. Agric. Biol. Eng. 2020, 13, 13–21. [Google Scholar] [CrossRef]
- Salyani, M.; Farooq, M. Drift potential of citrus air-carrier sprayers. Proc. Fla. State Hortic. Soc. 2014, 117, 130–135. [Google Scholar]
- Farooq, M.; Salyani, M. Spray penetration into the citrus tree canopy from two air-carrier sprayers. In Proceedings of the 2002 ASAE Annual Meeting, Jaipur, India, 18–20 October 2002; p. 1. [Google Scholar]
- Salyani, M.; Whitney, J. Ground speed effect on spray deposition inside citrus trees. Trans. ASAE 1990, 33, 361–0366. [Google Scholar] [CrossRef]
- Cooper, J.F.; Smith, D.N.; Dobson, H.M. An evaluation of two field samplers for monitoring spray drift. Crop Prot. 1996, 15, 249–257. [Google Scholar] [CrossRef]
- Miller, P. The measurement of spray drift. Pestic. Outlook 2003, 14, 205–209. [Google Scholar] [CrossRef]
- NIAS. Manual of Unmanned Aerial Vehicle for Crop Protection; National Institute of Agricultural Sciences: Jeonju, Republic of Korea, 2018. [Google Scholar]
- Kruskal, W.H.; Wallis, W.A. Use of Ranks in One-Criterion Variance Analysis. J. Am. Stat. Assoc. 1952, 47, 583–621. [Google Scholar] [CrossRef]
- Dunn, O.J. Multiple comparisons using rank sums. Technometrics 1964, 6, 241–252. [Google Scholar] [CrossRef]
- Zhao, H.; Xie, C.; Liu, F.; He, X.; Zhang, J.; Song, J. Effects of sprayers and nozzles on spray drift and terminal residues of imidacloprid on wheat. Crop Prot. 2014, 60, 78–82. [Google Scholar] [CrossRef]
- Fritz, B.; Hoffmann, W.; Bagley, W.; Hewitt, A. Field scale evaluation of spray drift reduction technologies from ground and aerial application systems. J. ASTM Int. 2011, 8, 103457. [Google Scholar] [CrossRef]
Disclaimer/Publisher’s Note: The statements, opinions and data contained in all publications are solely those of the individual author(s) and contributor(s) and not of MDPI and/or the editor(s). MDPI and/or the editor(s) disclaim responsibility for any injury to people or property resulting from any ideas, methods, instructions or products referred to in the content. |
© 2023 by the authors. Licensee MDPI, Basel, Switzerland. This article is an open access article distributed under the terms and conditions of the Creative Commons Attribution (CC BY) license (https://creativecommons.org/licenses/by/4.0/).