Article

The Changes in Cropland Pattern Enhanced Carbon Storage in Northwest China

1
College of Landscape Architecture, Zhejiang A&F University, Hangzhou 311300, China
2
Linze Inland River Basin Research Station, Chinese Ecosystem Research Network, Key Laboratory of Eco-Hydrology of Inland River Basin, Northwest Institute of Eco-Environment and Resources, Chinese Academy of Sciences, Lanzhou 730000, China
*
Author to whom correspondence should be addressed.
Agronomy 2023, 13(11), 2736; https://doi.org/10.3390/agronomy13112736
Submission received: 8 October 2023 / Revised: 25 October 2023 / Accepted: 25 October 2023 / Published: 30 October 2023

Abstract

:
Northwest China has experienced dramatic changes in agricultural land area in recent years. The effects of these changes on carbon storage are unknown, and this ambiguity hinders land development policies related to carbon emissions. In this study, we evaluated the effects of annual cropland changes (expansion and abandonment) during 2000 to 2020 on carbon storage in Northwest China by using land use data, carbon density data, and statistical yearbooks using the Intergovernmental Panel on Climate Change (IPCC) method. The results indicated that the area of cropland increased by 1.47 × 10⁶ ha from 2000 to 2020, in that the area of cropland expansion and abandonment are 3.58 × 10⁶ and −2.11 × 10⁶ ha, respectively. Cropland expansion was mainly from other land and grassland, and the conversion of cropland to grassland made up the largest proportion of cropland abandonment, followed by built-up land. The cropland changes resulted in a total carbon sequestration of 4.05 Tg (0.20 Tg C year−1), including a 17.66 Tg decrease and 21.71 Tg increase in carbon storage due to, respectively, cropland expansion and cropland abandonment, in which the conversion of forest to cropland (−8.60 Tg) and cropland to forest (11.16 Tg) were the main causes of the increase and decrease in carbon storage. Specifically, regional carbon storage due to cropland changes exhibited an increasing variation characteristic during 2000 to 2007, a gradually decreasing variation characteristics during 2007 to 2014, and fluctuated stabilization since then (during 2014 to 2020). In addition, the highest carbon emission was found in Xinjiang (−3.68 Tg), followed by Ningxia (−0.21 Tg) province, while Shanxi (3.44 Tg), Gansu (3.17 Tg) and Qinhai (1.33 Tg) had carbon accumulation. Overall, cropland changes acted as a carbon sink in Northwest China from 2000 to 2020. We suggest that the development of high-carbon-density lands or the conversion of low-carbon-density lands are critical to increasing future carbon sequestration due to cropland change.

1. Introduction

Land-use and cover change (LUCC), as the direct driver of human activities disturbing natural ecosystems [1], is one of the critical sources of greenhouse gas emissions to the atmosphere, with direct or potential impacts on global climate [2]. It is estimated that LUCC lead to 145 ± 16 Pg C of carbon emissions between 1850 and 2020 and accounts for approximately 10% of all anthropogenic carbon emissions [3]. The change of agricultural land area is the most widespread form of LUCC [4]. It is reported that global cropland expansion accelerated over the past two decades, with a near doubling of the annual expansion rate [5]. Furthermore, cropland abandonment has become a universal phenomenon of the economic development in the world [6]. It can clearly be seen the cropland patterns have changed substantially, and these changes consequently affected the carbon balance in terrestrial ecosystems [7,8]. For example, it is reported that greenhouse gas emissions due to cropland expansion accounted for about 25% of global greenhouse gas emissions [9].
Over the last 20 years in China, large areas of cropland have been lost due to urban expansion because of rapid industrialization and urbanization that began in 1980s [10,11]. Further, agricultural expansion claimed additional areas, including those in arid regions, due to the increasing demand for food [12]. The effects of this later expansion on carbon emissions cannot be ignored. It estimated that the total carbon emissions from cropland expansion in China ranged from 2.94 to 5.61 × 10³ Tg during the past 300 years [13]. However, China’s carbon emissions have risen sharply with rapid industrialization over the past 30 years, making it the world’s largest emitter of CO2 [14,15]. At present, China is facing global pressure to reduce carbon emissions, and it pledged to strive for the reversal of increasing carbon emissions by approximately the year 2030. Therefore, it is of critical importance that the impact of cropland changes over the past 20 years or so on carbon stocks in terrestrial ecosystems is clearly determined, as it will serve as the baseline for the future optimization of the agricultural land-use structure that will be used to relieve the present pressure of carbon emissions.
Uncertainty characterizes current estimates of impacts of cropland changes on carbon budgets for distinct types of conversions alike, due to the diversity of associated environmental and anthropogenic factors [16,17]. For example, conversion from forest and grassland to cropland often leads to a major loss of carbon because carbon density decreases [18,19]. Nevertheless, there are also rare cases in which converting natural land to cropland can actually increase carbon storage if the productivity of the ensuing cropland is substantially greater than that of the prior natural land cover. For example, the conversion from sparsely-covered grassland (e.g., desert grassland) to cropland may lead to an increase in carbon pool [20]. However, the current literatures to date tends to concentrate exclusively on the effects of a single type of cropland expansion or abandonment on carbon budgets. Additionally, research to assess the effects of LUCC on carbon budgets at varying scales has resulted in the development of some commonly used methods [3,21]. At regional or global spatial scales, empirical statistical models (e.g., bookkeeping), remote sensing models (e.g., CASA) or process-based ecosystem models (e.g., TEM and LPJ) are usually used for evaluating the effects of LUCC on carbon budgets [22,23,24,25]. However, the accuracy of the representation of both the temporal evolution and spatial heterogeneity of carbon storage with modeling approaches is limited by the availability of land use data, and most of the estimates of carbon storage are based on long time intervals rather than annual intervals [22]. Hence, more precise and annual information on LUCC is needed to analyze the annual temporal evolution of carbon budgets.
Northwest China, characterized by an arid and semi-arid climate, is known for its long history of irrigation dependence [26]. Over the past 20 years, the use of agricultural water and soil resource reached unprecedented levels in Northwest China to accommodate population growth and the continuous expansion of urbanization [27,28]. For instance, the process of oasis development was greatly promoted, resulting in the expansion of artificial oasis areas (cropland landscape with large-scale desert background) from 2.1 × 10⁵ to 10.4 × 10⁵ ha [29]. However, carbon budget estimates of land cover change in arid and semi-arid areas at regional scales are still under-represented in these efforts. Therefore, in this study, LUCC data from 2000, 2010 and 2020 were selected due to the cropland transition phenomenon having been very apparent in Northwest China over the last 20 years or so. Land use data and annual statistical yearbook data were combined to quantify temporal and spatial dynamics in cropland expansion and abandonment throughout Northwest China. Then, we calculated annual carbon storage induced by cropland expansion and abandonment from 2000 to 2020 by matching different vegetation carbon density and soil carbon density of soil types to the annual area of cropland conversion. The aim of the present research was to analyze annual temporal evolution and spatial variability in carbon storage induced by cropland expansion and abandonment in Northwest China, and provide an example to calculate land-use change data year by year when there are no more time-frequency land use data available. We hypothesized that the cropland biomass carbon after cropland expansion was zero since crops are harvested each year as their carbon is quickly returned to the atmosphere via oxidation (burning or decomposition), which does not represent a permanent C stock [8], and the changes in cropland pattern would therefore result in a carbon sequestration. The results of this study can provide a reference for rational land-use management based on assessment of annual regional carbon storage in areas that may have previously been overlooked, which is conducive to stable and sustainable development in arid and semi-arid regions.

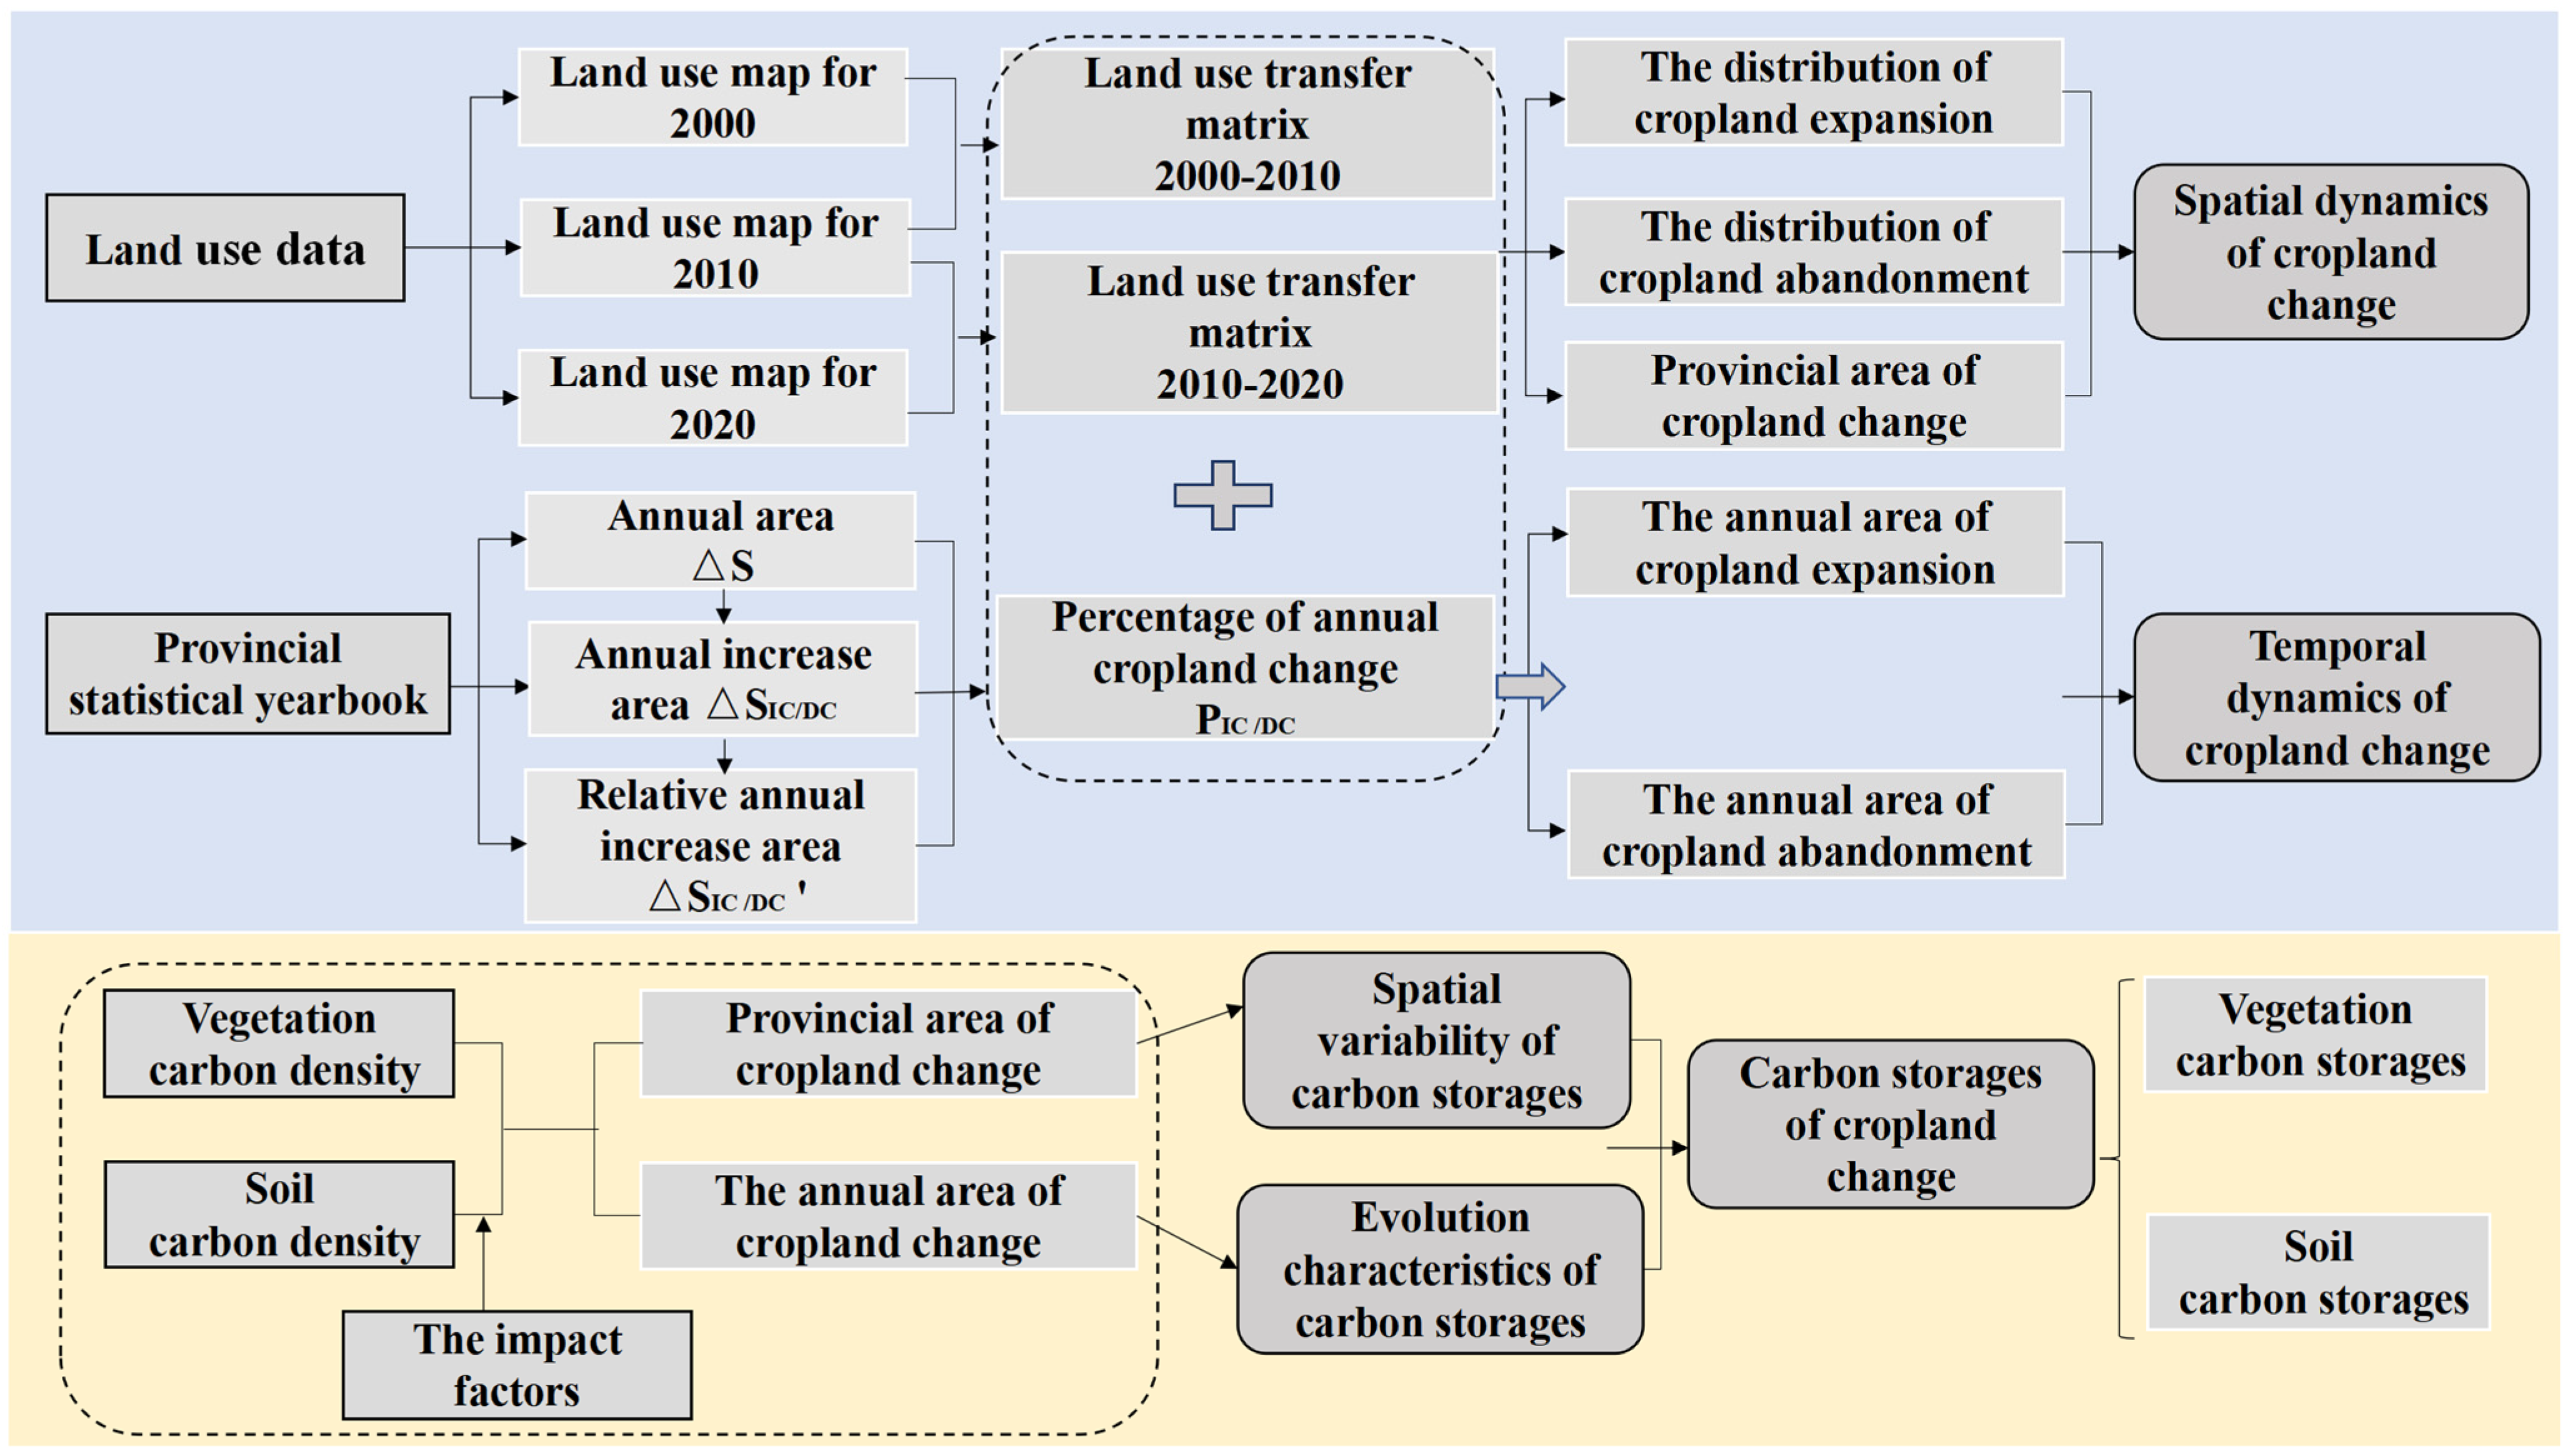
2. Materials and Methods
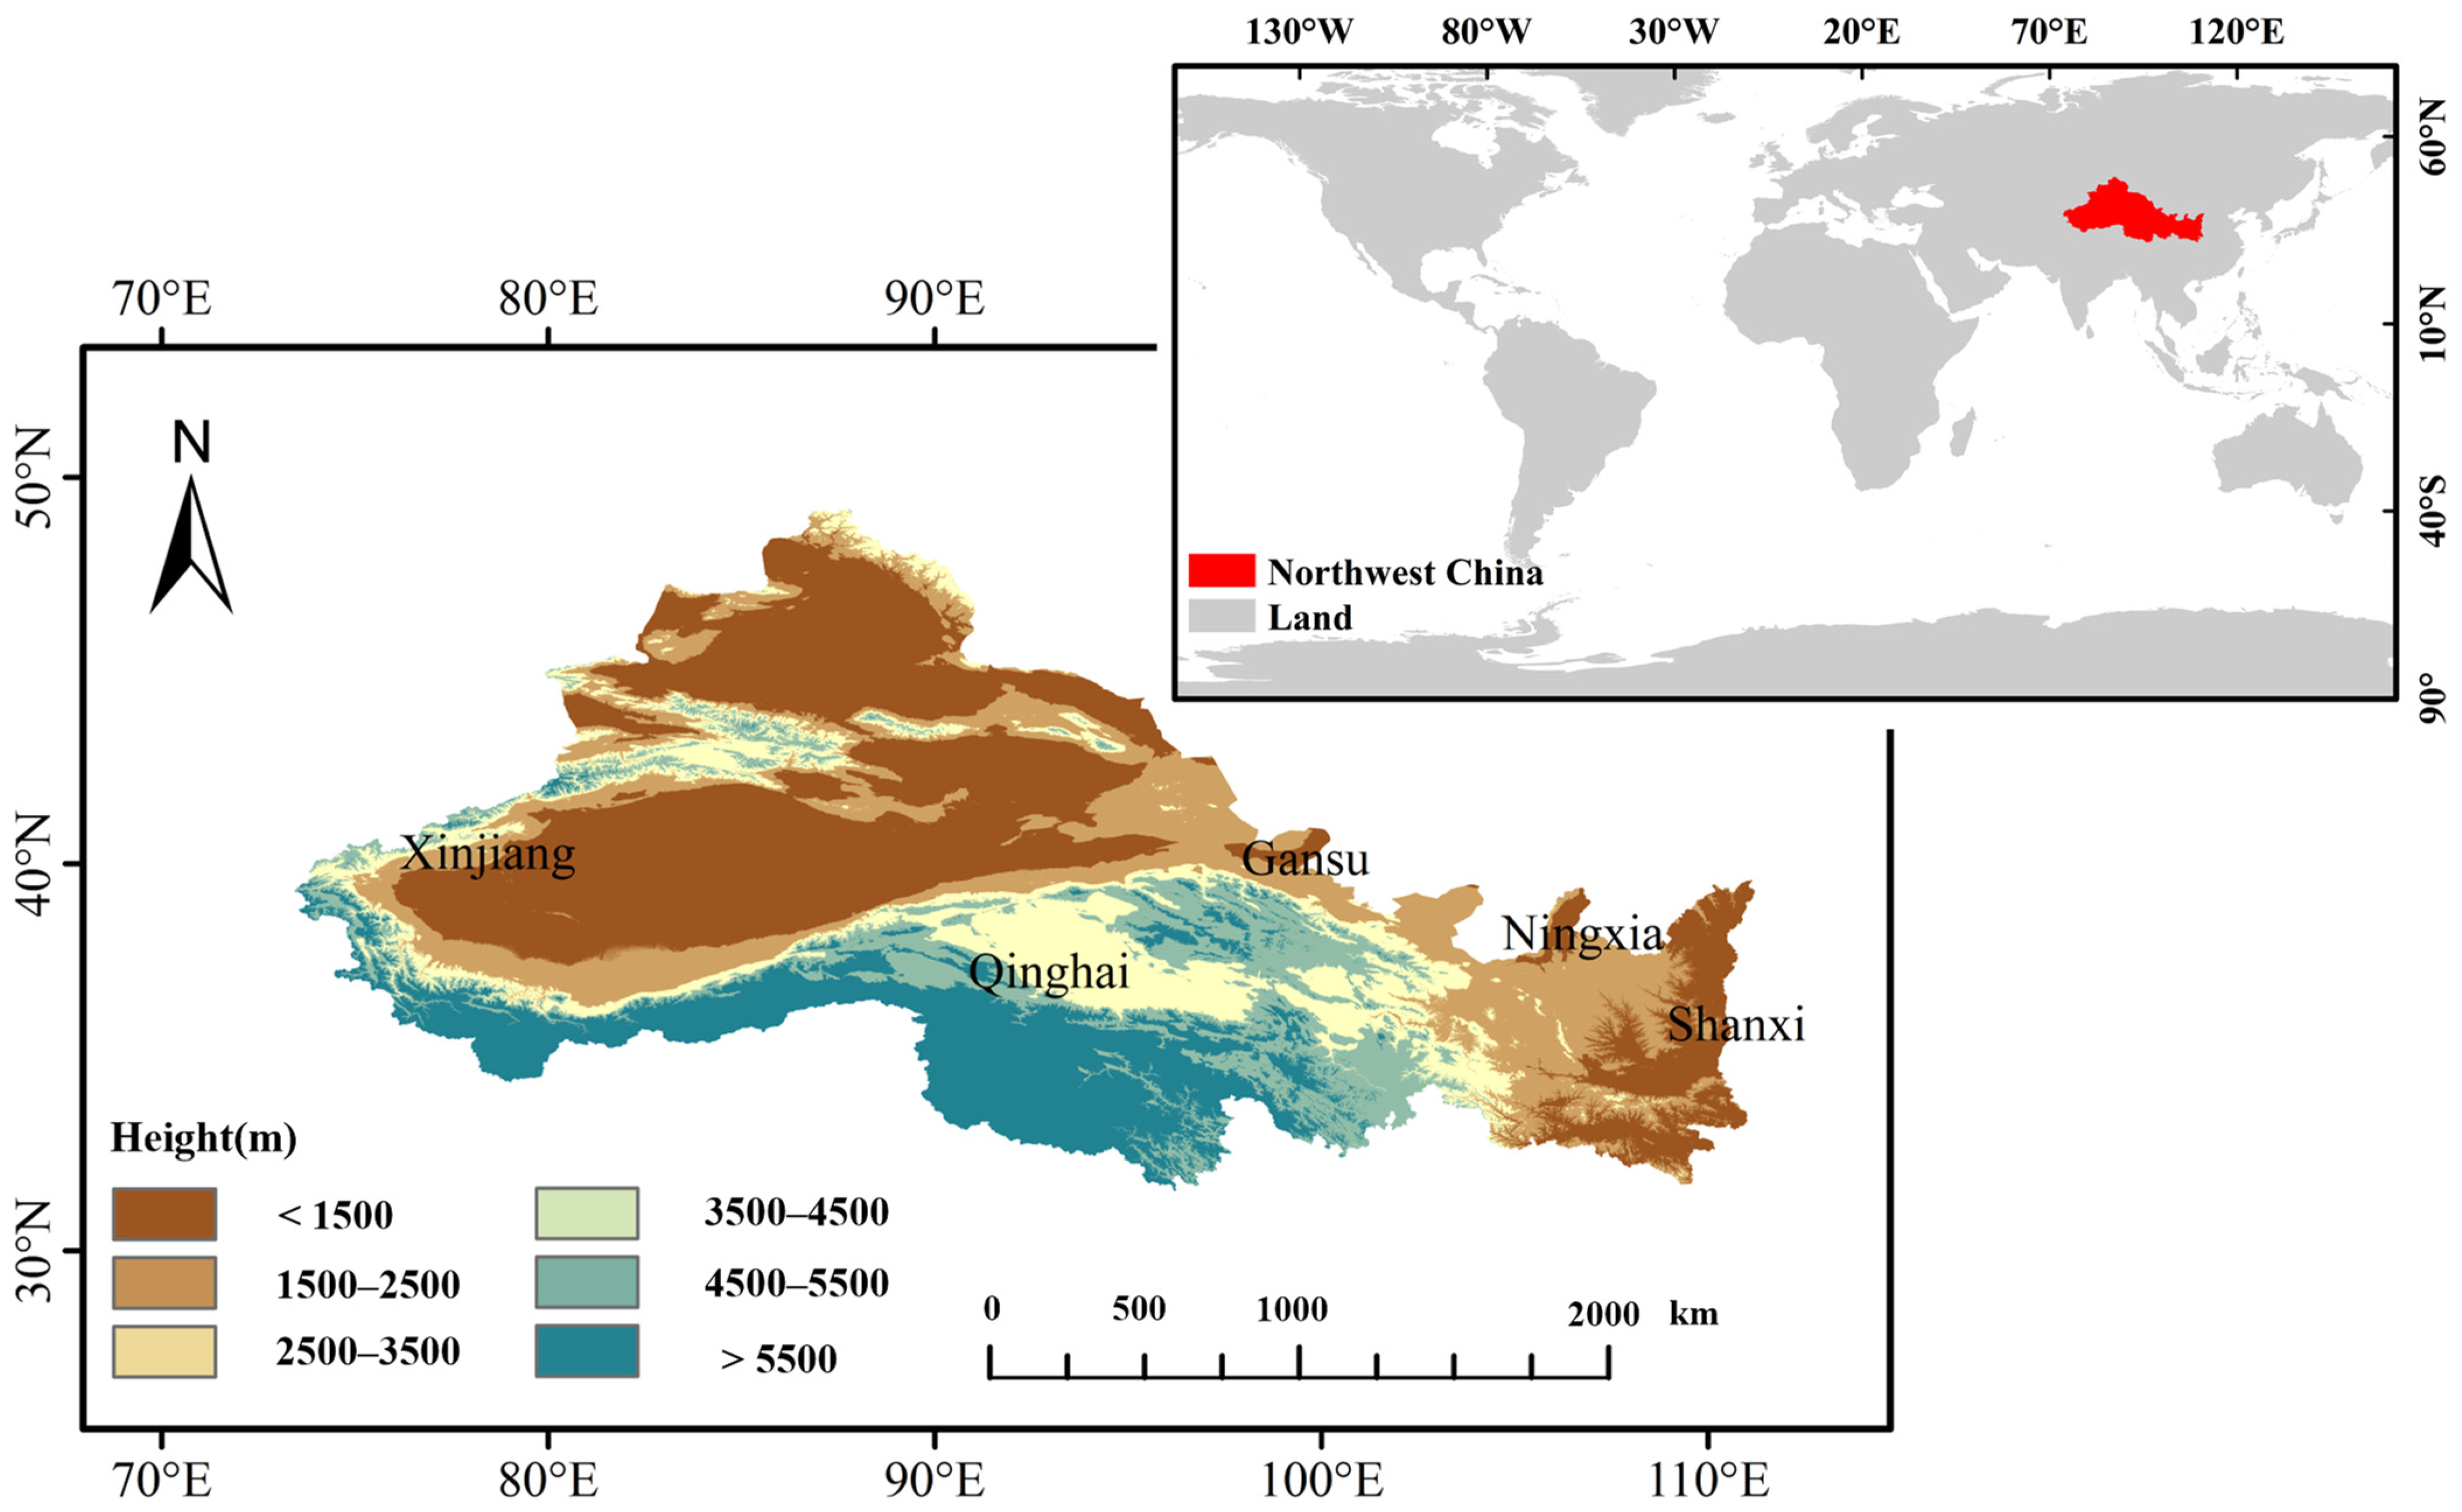
The overall approach used in this study consisted of two parts. The first part includes land use data and provincial statistical yearbooks for calculating annual area of cropland change, and mapping spatial distribution. The second part involves vegetation and soil carbon density data combined with the area of annual change in cropland for calculating carbon storage. The structure of this study is shown in Figure 1.

2.1. Study Area

This study was performed in Northwest China (73°15′ E–111°15′ E, 31°32′ N–49°10′ N), located in the innermost part of the Eurasian continent [30]. Administrative divisions in this area include Xinjiang, Qinghai, Gansu, Ningxia and Shanxi provinces, accounting for 32.2% of the total land area of China, and an area of approximately 3.10 million km2 (Figure 2). In Northwest China, there are four climate types from south to north: subtropical monsoon climate, temperate monsoon climate, temperate continental arid climate and plateau mountain climate. Most of the area exhibits a typical continental climate, with very low mean annual precipitation (below 250 mm), mean annual temperature from −2 to 19 °C [31], and annual evapotranspiration ranging from 225 to 285 mm [32]. The main land cover types in this region consist of temperate evergreen forest (i.e., Picea spp., Abies sibirica, etc.), temperate deciduous forest (i.e., Populus, Betula, etc.), temperate shrub land (i.e., Haloxylon, etc.), grassland (i.e., alpine meadow and desert steppe), cropland (i.e., oasis, etc.), built-up lands, bare land and basins [33]. The natural landscape changes from east to west from forest and typical grassland, to a grassland-desert and desert; vegetation cover shows a gradually decreasing trend. Most of the rivers are inland rivers, including the Tarim River, Irtysh River, Ili River, Manas River, Heihe, etc., of which the Tarim River is the largest inland river in China. The development of agriculture is mainly for irrigated agriculture with the famous Hetao Plain, Ningxia Plain, and Hexi Corridor, etc.

2.2. Data Sets and Pre-Processing

2.2.1. Land-Use Category and Area

We used a land-use dataset for 2000, 2010 and 2020, derived from the Land Cover (LC) project of the European Space Agency (ESA) Climate Change Initiative (CCI) Climate Research Data Package (CRDP) (https://www.esa-landcover-cci.org/ (accessed on 1 January 2022)), with a spatial resolution of 300 m. The Land Cover Classification System (LCCS) proposed by the Food and Agriculture Organization (FAO) of the United Nations was adopted. The land-use dataset was used as follows: (1) The change is detected between CCI land cover classes (the original 22 land-use types) grouped into the six IPCC land categories according to Land Cover CCI product user guide: cropland, forest, grassland, water, built-up land, and other land (see Table S1). (2) Two land-cover transition matrixes were derived from three periods (2000, 2010 and 2020) of land-use images (Figure S1) for the purpose of calculating the area of cropland expansion and abandonment during 2000 to 2010 and 2010 to 2020. (3) The spatial analysis tool “overlay” in Arcgis 10.2 was used to visualize and analyze the distribution of cropland expansion and abandonment for the years 2000 to 2010 and 2010 to 2020. (4) Accuracy assessment was quantitatively described by sub-pixel fractional error matrices and Kappa coefficient. In this study, 600 sample points were randomly selected in the study area and superimposed with the images in Google Earth Pro to verify the properties of land-use types and establish accuracy assessment in Northwest China. For 2000, 2010 and 2020, the accuracy of the main types of cropland in Northwest China is 83.2%, 85.1% and 84.6%, respectively, and the overall accuracy is 70.2%, 71.1% and 70.9%, respectively, while the Kappa coefficient is 0.753, 0.769 and 0.786, respectively, which meet the requirements of this study.

2.2.2. Annual Area of Cropland Change

Land use data acquired from remote sensing images can reflect the spatial and temporal patterns of LUCC, but not the annual area of LUCC. Therefore, in this study, the annual provincial statistical yearbooks (http://data.cnki.net/ (accessed on 1 January 2022); see Table S2) were combined with remote sensing data with high spatial resolution to obtain the annual cropland reclamation and transfer area in five northwestern provinces from 2000 to 2020.
The annual cropland expansion and abandonment area (annual cropland expansion area was defined as a positive value; annual abandonment area was defined as negative values) in the study period was calculated using the following equations:
Δ S = ( S 1 , S 2 , S 3 , S n )
where Δ S is annual cropland area matrixes, S i is annual cropland area (ha), and i = 1 … n.
Δ S I C = ( Δ S 1 , Δ S 2 , Δ S 3 , Δ S n 1 )
where Δ S I C is the annual increase in cropland area due to expansion, Δ S I C i = Δ S i + 1 Δ S i (ha), and i = 1 … n − 1. Considering that Δ S I C may be <0, and annual increase in cropland area was defined as positive values, it was necessary to smooth and revise the annual increase in cropland:
Δ S I C = ( Δ S 1 + Δ S I C min , Δ S 2 + Δ S I C min , Δ S 3 + Δ S I C min , Δ S n 1 + Δ S I C min )
P I C = ( Δ S I C 1 / s u m ( Δ S I C ) , Δ S I C 2 / s u m ( Δ S I C ) , Δ S I C n 1 / s u m ( Δ S I C ) )
where PIC (%) is the coefficient of annual increase in cropland area due to expansion. The calculation method of PDC (%) (the coefficient of annual decrease in cropland area due to abandonment) is similar to PIC (%), except that the Formula (2) is changed to the following:
Δ S D C = ( Δ S 1 , Δ S 2 , Δ S 3 , Δ S n 1 )
where Δ S D C is the annual decrease in cropland area due to abandonment, and Δ S D C i = Δ S i Δ S i + 1 (ha). The subsequent calculation method is the same as in Formulas (3) and (4).
The annual area of cropland expansion or abandonment (ha) was obtained by multiplying PIC (%) or PDC (%) by cropland expansion or abandonment area (ha) from two land cover transition matrixes for the years 2000 to 2010 and 2010 to 2020. The annual area of different types of cropland conversion was obtained by multiplying PIC (%) or PDC (%) by different types of cropland conversion area (ha) from two land cover transition matrixes for the years 2000 to 2010 and 2010 to 2020.

2.3. Calculation of Changes in Carbon Storage Induced by Cropland Change

Carbon storage induced by cropland change was calculated with the following equation [34]:
Δ C = Δ V C + Δ S O C
where Δ C (Tg) represents the change in carbon storage caused by cropland change; Δ V C (Tg) represents change in biomass carbon storage; Δ S O C (Tg) represents the change in soil organic carbon (SOC).

2.3.1. Calculation of Change in Biomass Carbon Storage

We obtained vegetation carbon density information for each land-use type (Table 1) from published literature [35]. Changes in biomass carbon storage caused by cropland change was calculated with the following formula [34], and belowground biomass was not included in the calculation:
Δ V C = 1 i ( V D A f t e r i V D B e f o r e i ) × Δ A T o o t h e r i
where V D A f t e r i and V D B e f o r e i (t C ha−1) represent carbon density in vegetation for land use i after and before the conversion, and Δ A T o o t h e r i (ha) represents the area of land use i converted to another land type.

2.3.2. Calculation of Changes in Soil Carbon Storage

For analytical purposes all land in a given stratum should have common biophysical conditions (e.g., soil type). We obtained the soil carbon density of each soil type from the 1:1,000,000 soil-type map of the China Second National Soil Survey (Table S3). Based on soil carbon density and the impact factors for soil carbon change [36] (Table 2), we applied the Tier 1 method from IPCC (2006) to calculate soil carbon storage caused by cropland change using the following formula [34]:
Δ S O C = i , s ( S D i , s × F i m p a c t i , s × Δ A t o o t h e r i , s )
where S D i , s represents soil carbon density for land-use type i with soil type s; Δ A T o o t h e r i , s represents the transformed area of land-use type i with soil type s; and F i m p a c t i , s represents the impact factors of SOC change during cropland change (Table 2) [36].

3. Results

3.1. Spatio-Temporal Dynamics of Cropland Change

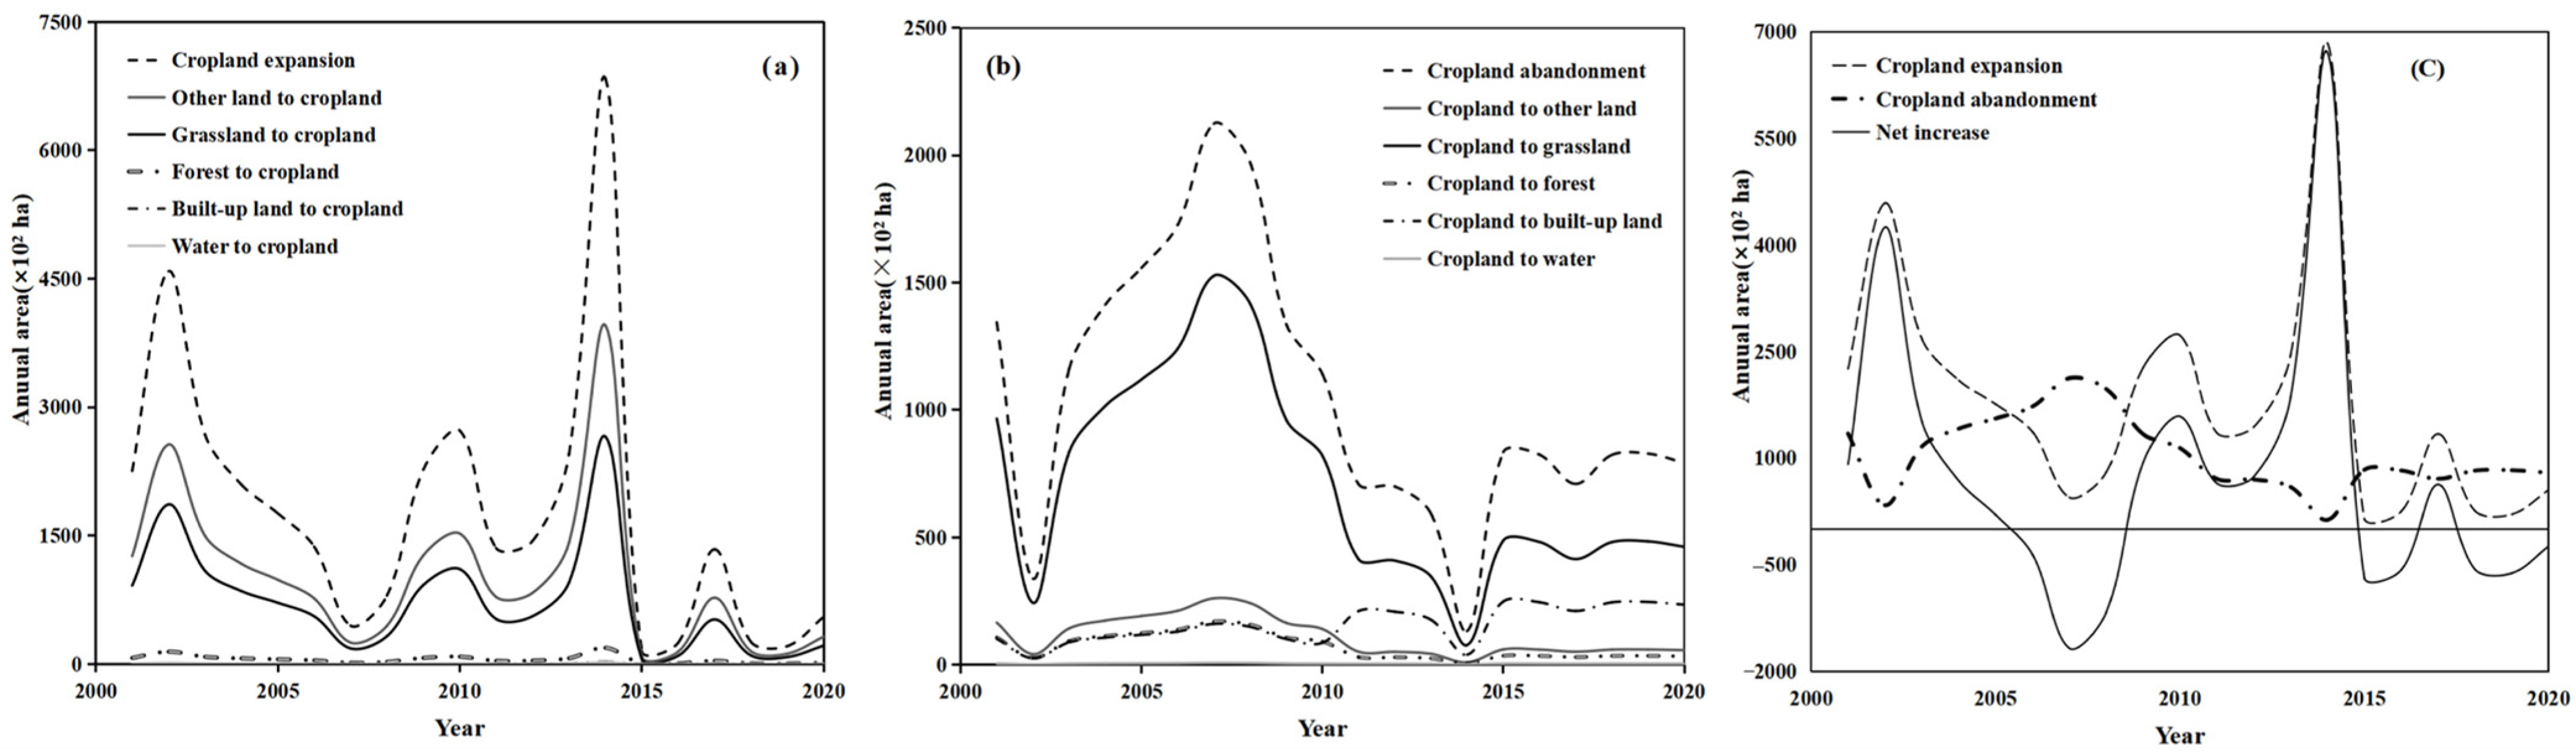
3.1.1. Temporal Dynamics of Cropland Change

Northwest China has experienced continuous cropland changes during the period from 2000 to 2020 (Table 3). Overall, the total area of cropland in Northwest China increased by 1.47 × 10⁶ ha (4.2%) between 2000 and 2020, in that the area of cropland expansion and abandonment increased by 3.58 × 10⁶ and 2.11 × 10⁶ ha, respectively, from 2000 to 2020. Separately, the net increase in cropland area from 2010 to 2020 was 1.01 × 10⁵ ha more than in the previous period. However, the area of cropland expansion and abandonment decreased by 29.33% and 50.79%, respectively, from 2010 to 2020. Cropland expansion was mainly from other land and grassland, contributing, respectively 56.68 and 39.88% of the reclaimed cropland. Meanwhile, the conversion of cropland to grassland made up the largest proportion of cropland abandonment, followed by built-up land, then other land. The three LUCC, respectively accounted for 67.44, 14.86 and 10.58% of the area of cropland abandonment. Except for the increase in the conversion of built-up land to cropland (slightly) and cropland to built-up land, the conversion of other land uses showed a decreasing trend from 2010 to 2020 over the previous period.
The trend in cropland expansion was contrary to the trend in cropland abandonment (Figure 3). The area of cropland expansion exhibited a downward trend from 2000 to 2007 (−1.68 × 10⁵ ha), then a gradual increase from 2007 to 2014, with a peak in 2014 (6.71 × 10⁵ ha). Since then, the area of cropland expansion has been on a downward trend. However, the area of cropland abandonment gradually increased from 2000 to 2007 (2.12 × 10⁵ ha), then gradually decreased after 2007, and reached an all-time low in 2014 (1.32 × 10⁴ ha). Since then, the area of cropland abandonment fluctuated. The trend in cropland expansion was consistent with the trend in other land, grassland and forest conversion, while the trend in cropland abandonment was consistent with the trend of cropland to grassland from 2000 to 2020.

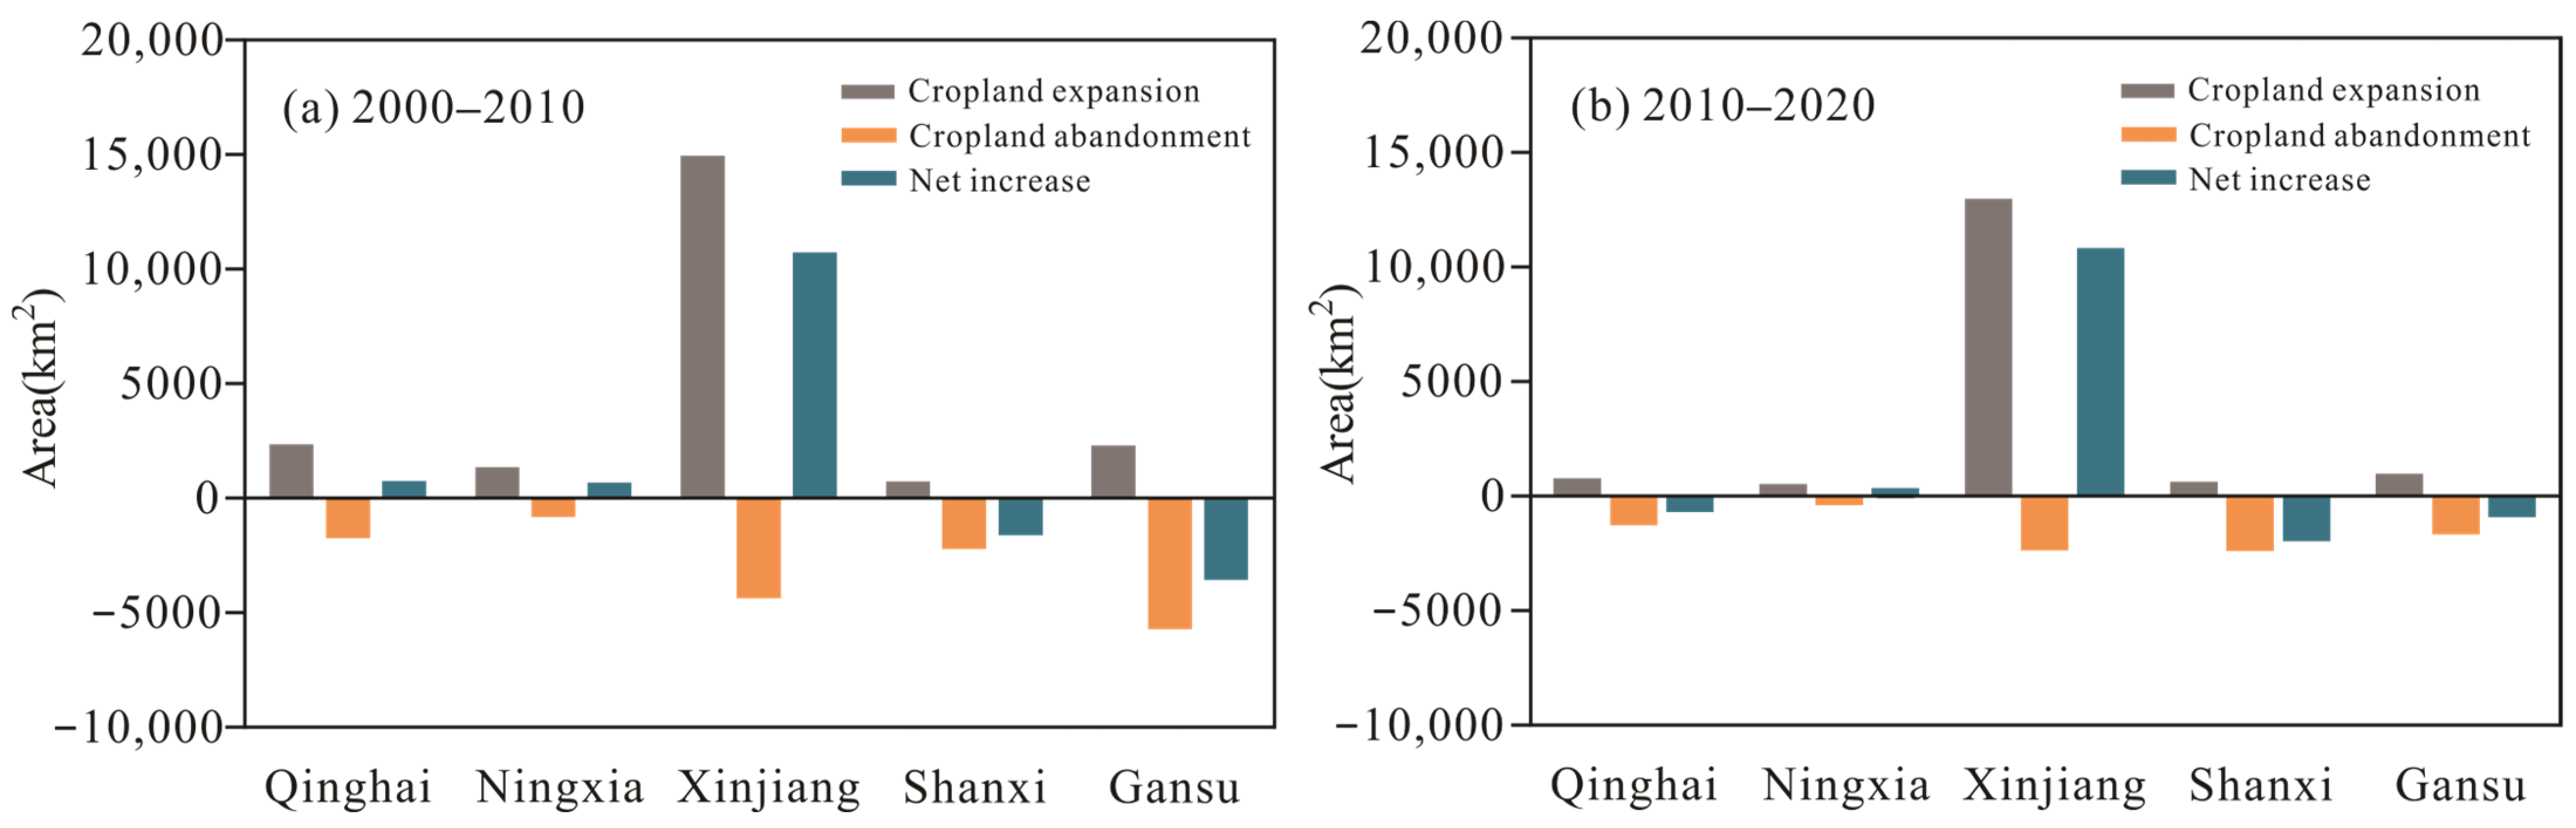
3.1.2. Spatial Variability in Cropland Change

Cropland change across Northwest China exhibited spatial variability (Figure 4). During the period of 2000–2020, the cropland area in Xinjiang, Ningxia and Qinghai provinces increased by 2.10 × 10⁶, 6.93 × 10⁴ and 1.50 × 10⁴ ha, respectively, while that in Shanxi and Gansu provinces decreased by 3.20 × 10⁵ and 4.09 × 10⁵ ha, respectively. Specifically, Qinghai province exhibited an increase (6.22 × 10⁴ ha) in the early period, and then a decrease (−4.72 × 10⁴ ha) in the later period, while trends in Shanxi and Gansu provinces continued to show a steadily decreasing trend, and Xinjiang and Ningxia provinces continued to show an increasing trend between 2010 to 2020.
The spatial distribution of cropland change was similar for both periods (Figure 5). The most dramatic changes took place in Xinjiang province, especially in its northern part. Cropland change in Qinghai province, which is mainly covered by grassland, occurred mainly in areas of that cover type. Additionally, cropland changes were notable in the northern part of Ningxia and Shanxi provinces in both periods. Cropland change in Gansu province occurred mainly in the southeastern part.

3.2. Effects of Cropland Change on Carbon Storage

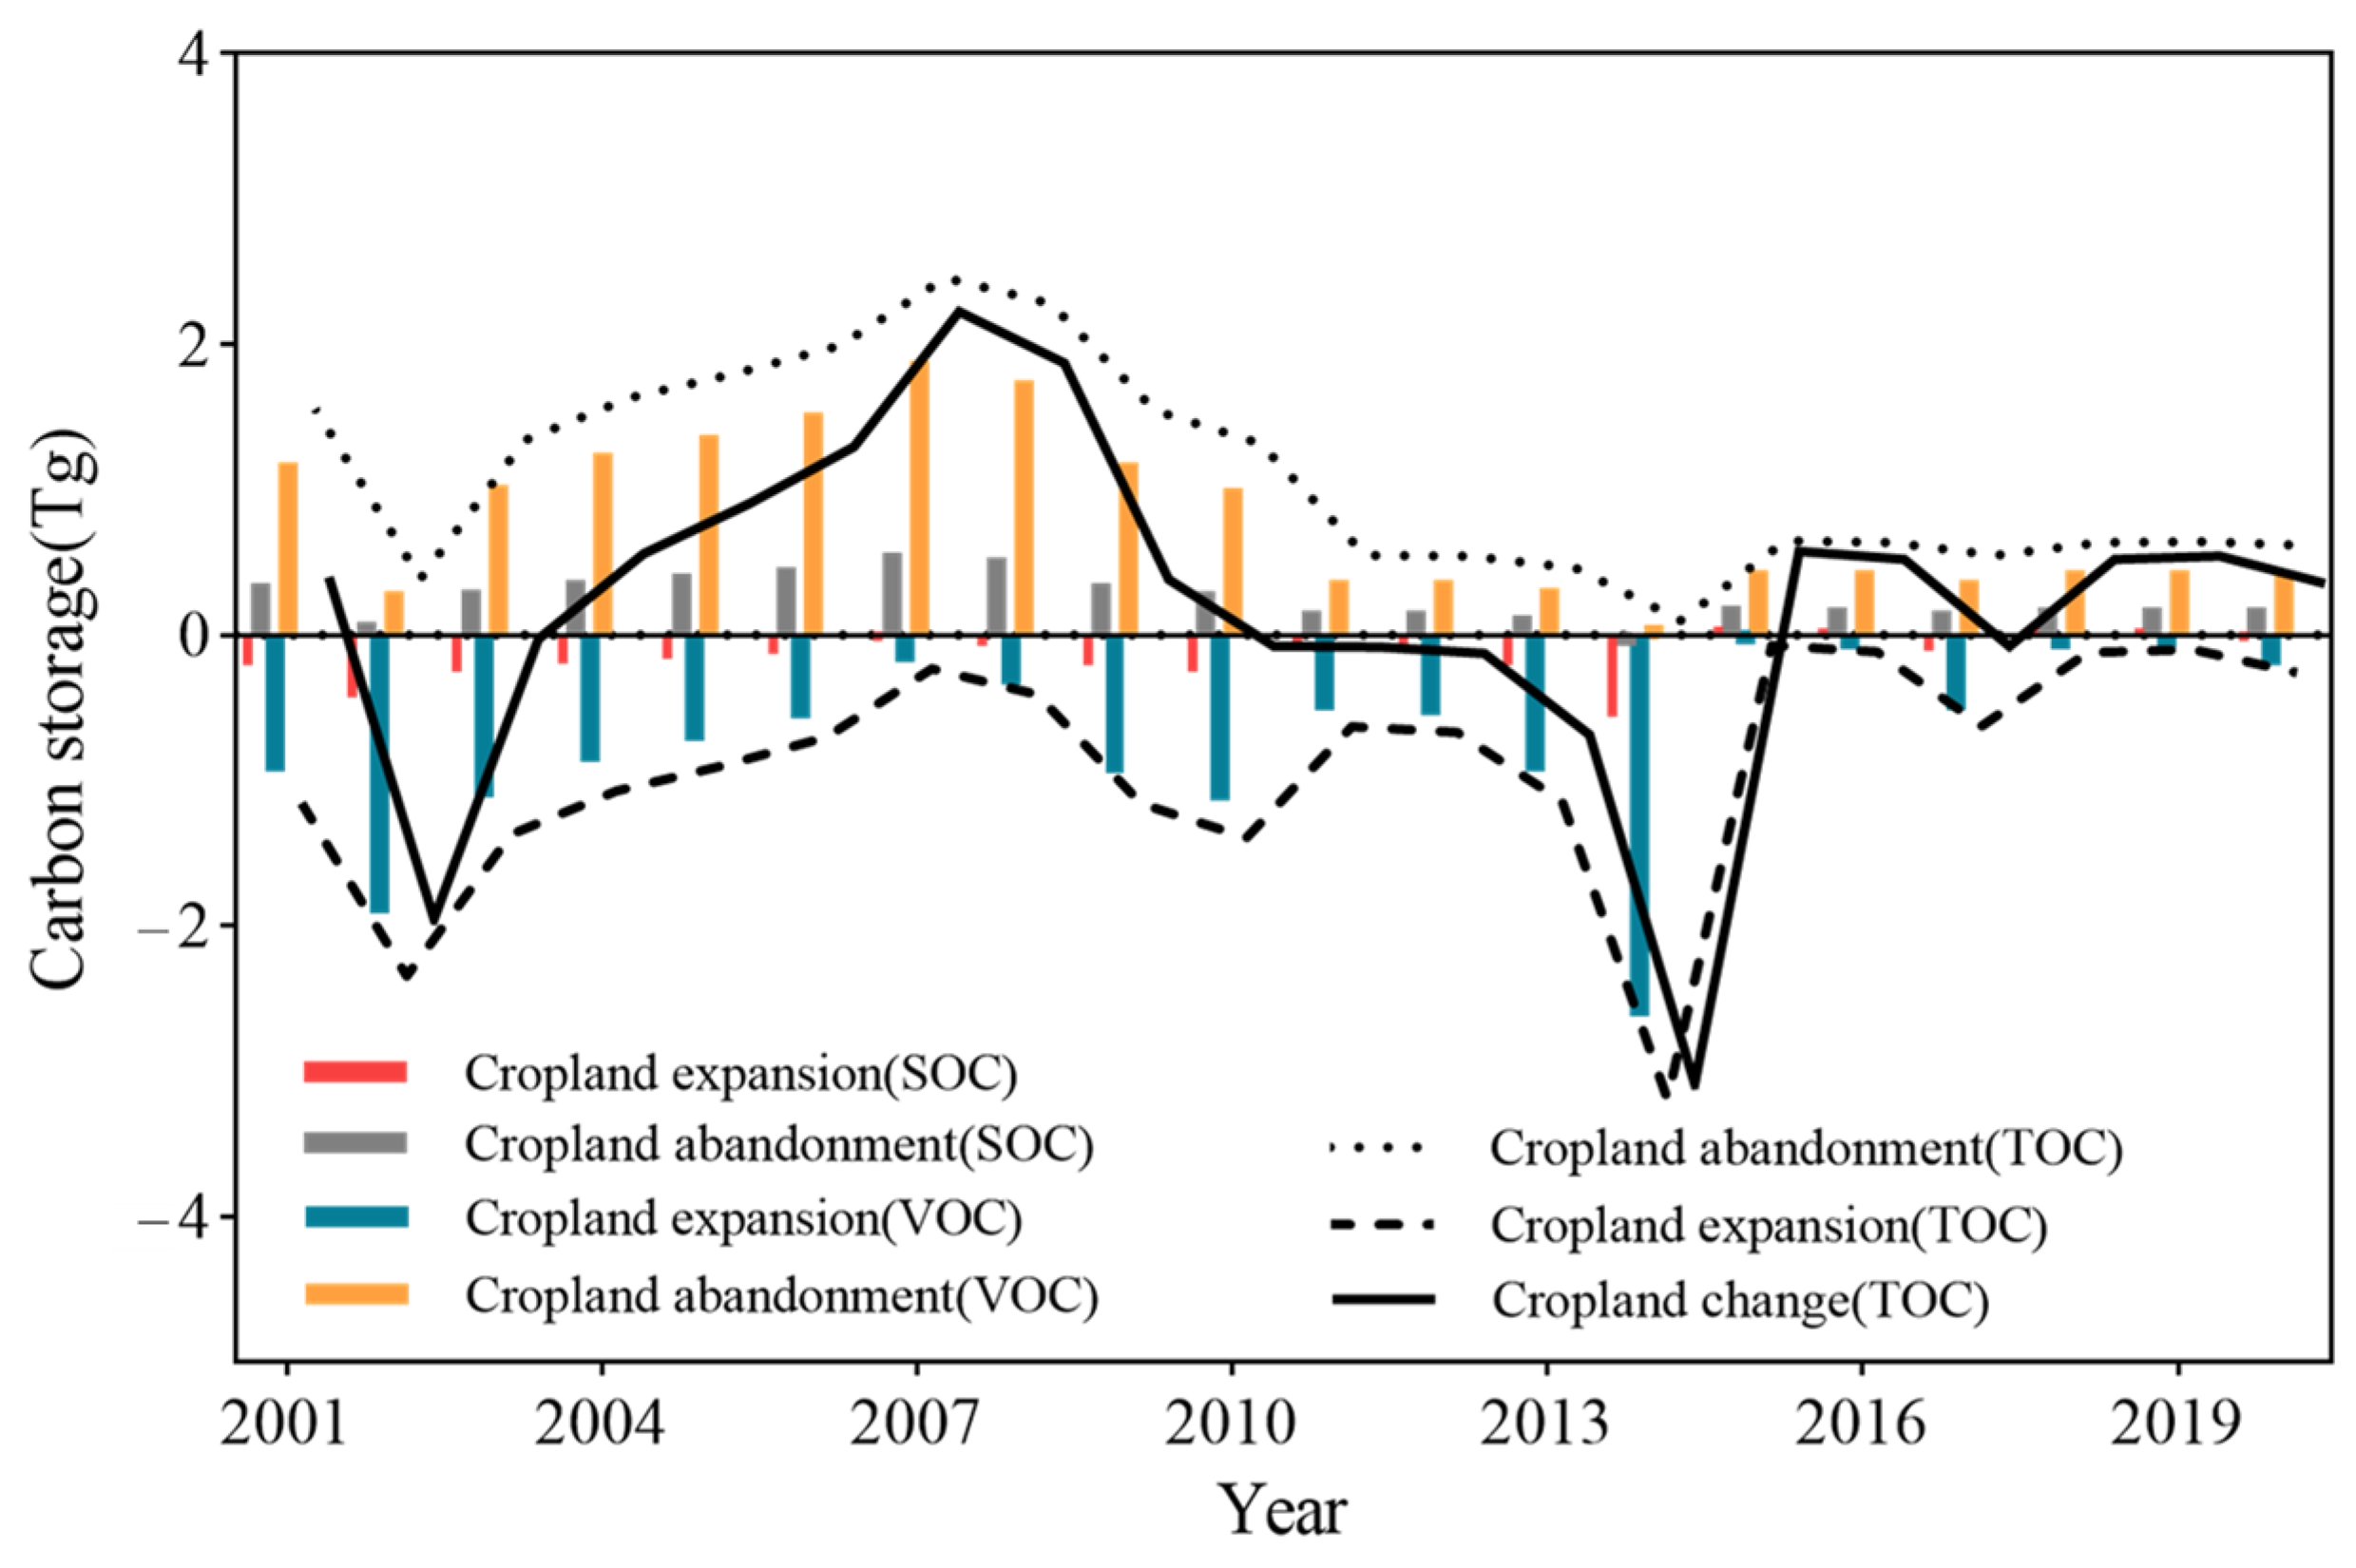
3.2.1. Changes in Carbon Storage over Time

Calculated changes in carbon storage suggested that during 2000 to 2020, cropland changes led to about 4.05 Tg (2.46 Tg in 2000–2010 and 5.49 Tg in 2010–2020) of total carbon accumulation, including a 2.28 and 1.76 Tg increase due to, respectively, soil and vegetation carbon storage, corresponding to an increase in storage rates of approximately 0.20 Tg yr−1. Meanwhile, carbon storage due to cropland expansion decreased by 17.66 Tg from 2000 to 2020, which corresponds to a decrease of 3.16 Tg in soil and 14.50 Tg in vegetation. Moreover, carbon storage induced by cropland abandonment increased by 21.71 Tg from 2000 to 2020, in which carbon storage in soil and vegetation increased by 5.45 and 16.26 Tg, respectively.
Overall, variation characteristics in carbon storage caused by cropland change over time in Northwest China was affected by carbon storage caused by cropland abandonment and expansion over time (Figure 6). Overall, the carbon storage caused by cropland changes showed an increasing variation characteristic from 2000 to 2007, reached a maximum in 2007 (2.22 Tg), gradually decreased after 2007, reached a minimum in 2014 (−3.09 Tg), and fluctuated since then. Specifically, carbon storage caused by cropland expansion and abandonment over time both exhibited an increasing variation characteristic from 2000 to 2007 (−0.23 and 2.46 Tg), a gradual decrease from 2007 to 2014, a minimum in 2014 (−3.19 and 0.10 Tg), and a gradual increase with fluctuations since then (2014–2020).

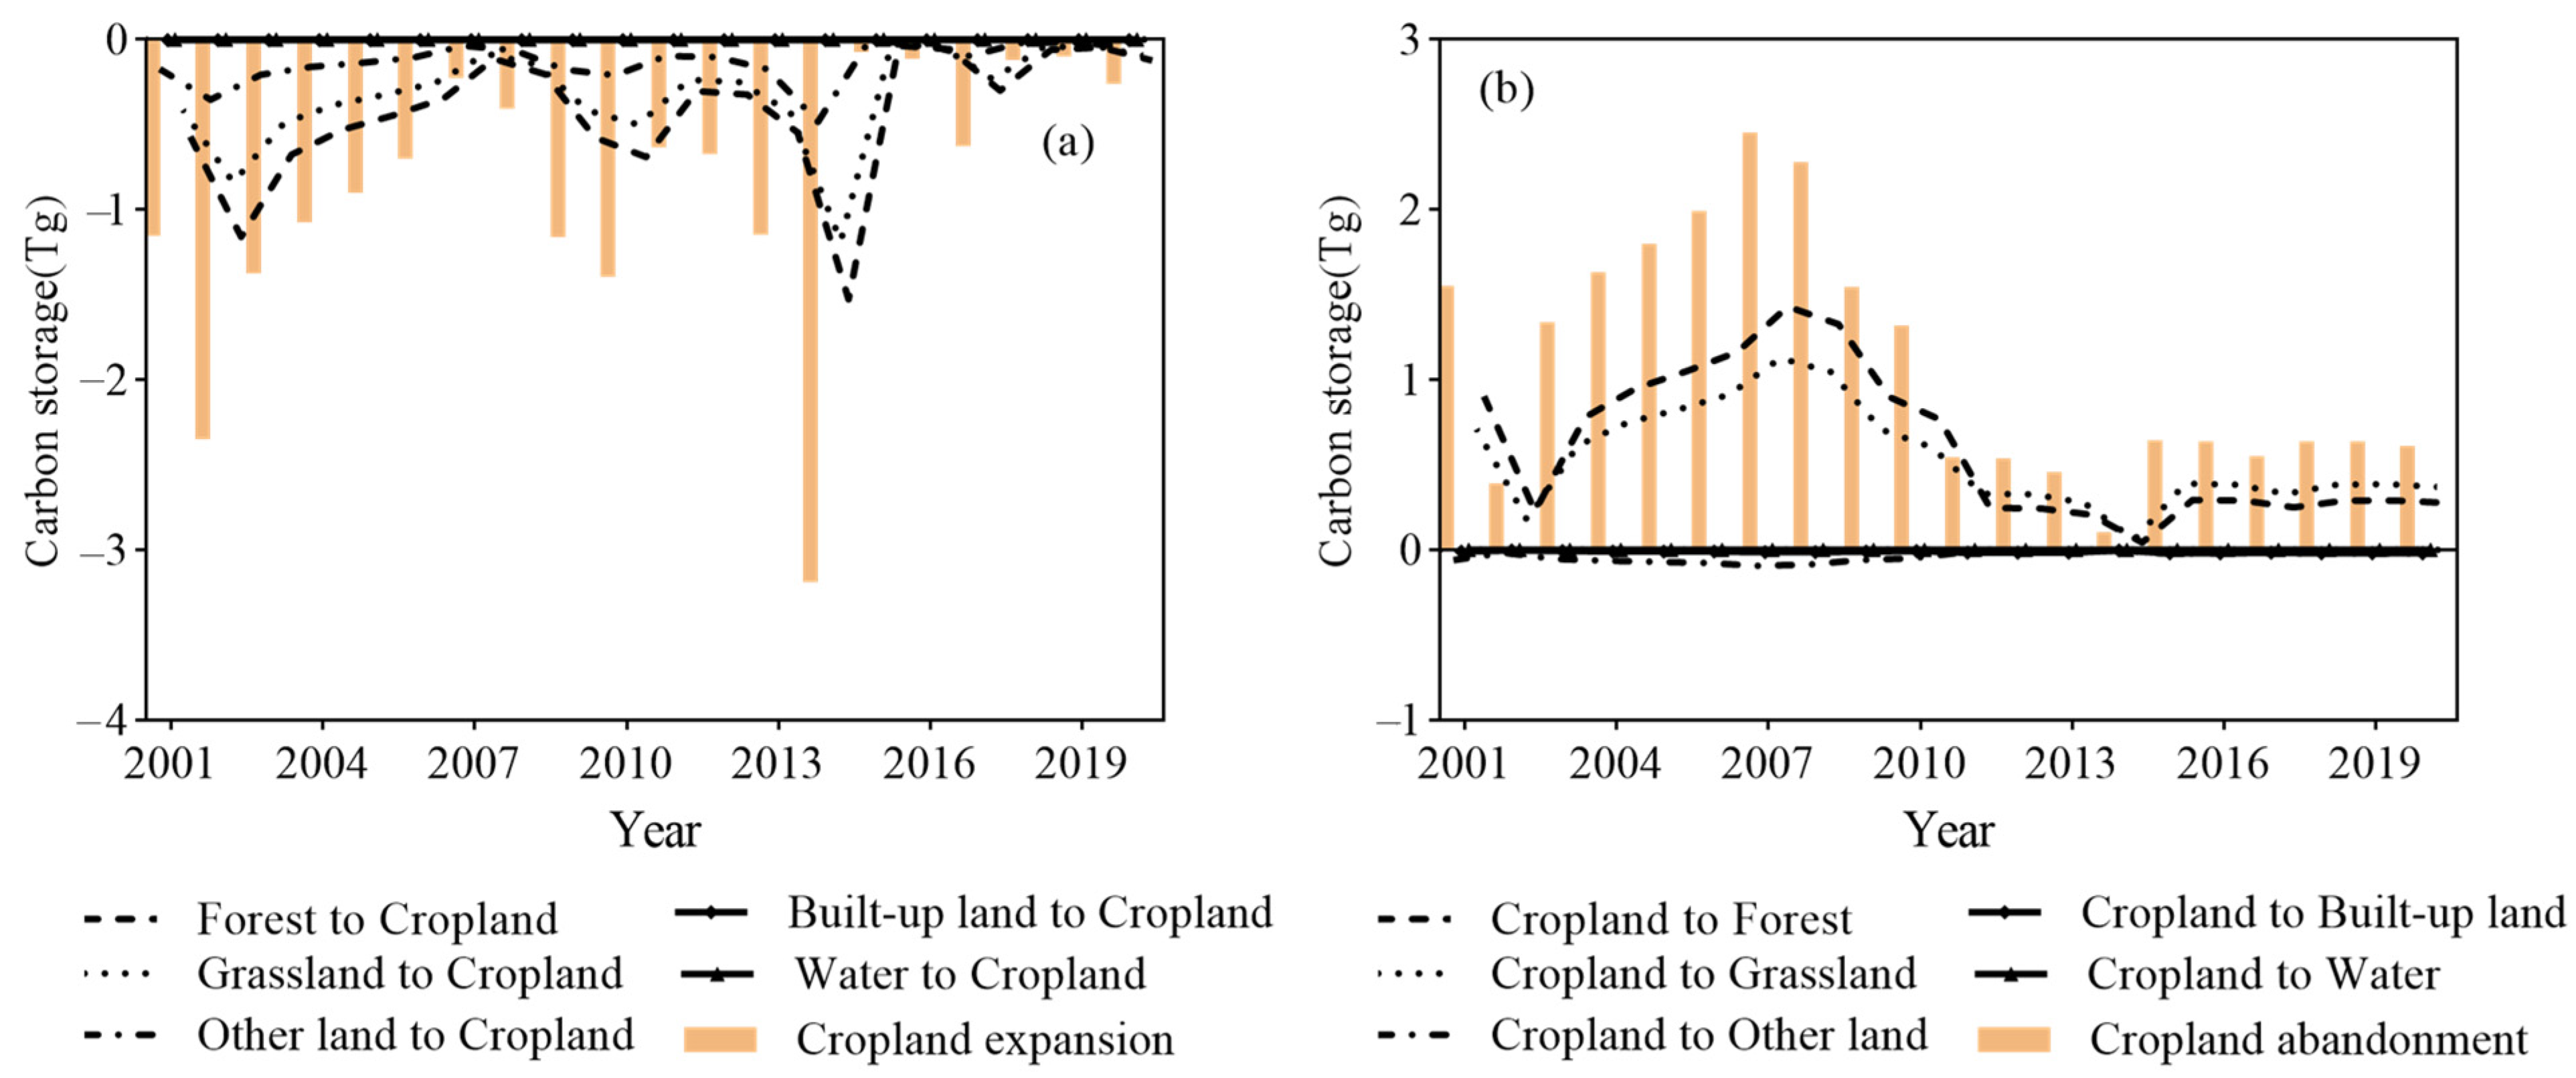
3.2.2. Carbon Storage in Different Types of Cropland Conversion

The effects on carbon storage differed across different types of cropland expansion in Northwest China (Figure 7a). The decrease in carbon storage was mainly from forest, grassland and other land expansion. Specifically, the conversion of forest to cropland had the greatest impact, a 8.60 Tg decrease in carbon storage, accounting for 48.73% of the decrease in carbon storage due to cropland expansion. Carbon storage induced by the conversion of grassland and other land to cropland decreased by 6.40 and 2.65 Tg, accounting for 36.25% and 14.90% of the decrease in carbon storage due to cropland expansion.
Effects on carbon storage differed across different types of cropland abandonment in Northwest China (Figure 7b). The increase in carbon storage was mainly from the conversion of cropland to forest and grassland; the conversion of cropland to built-up land and other land led to a decrease in carbon storage. Specifically, the conversion of cropland to forest had the greatest impact, with an 11.16 Tg increase in carbon storage, accounting for 50.48% of the increase in carbon storage caused by cropland abandonment. Carbon storage changed upon the abandonment of cropland to grassland, other land, or built-up land by 10.74; −0.76; and −0.24 Tg, respectively, accounting for 62.33; 3.2; and 1.01% of the increase in carbon storage caused by cropland abandonment.

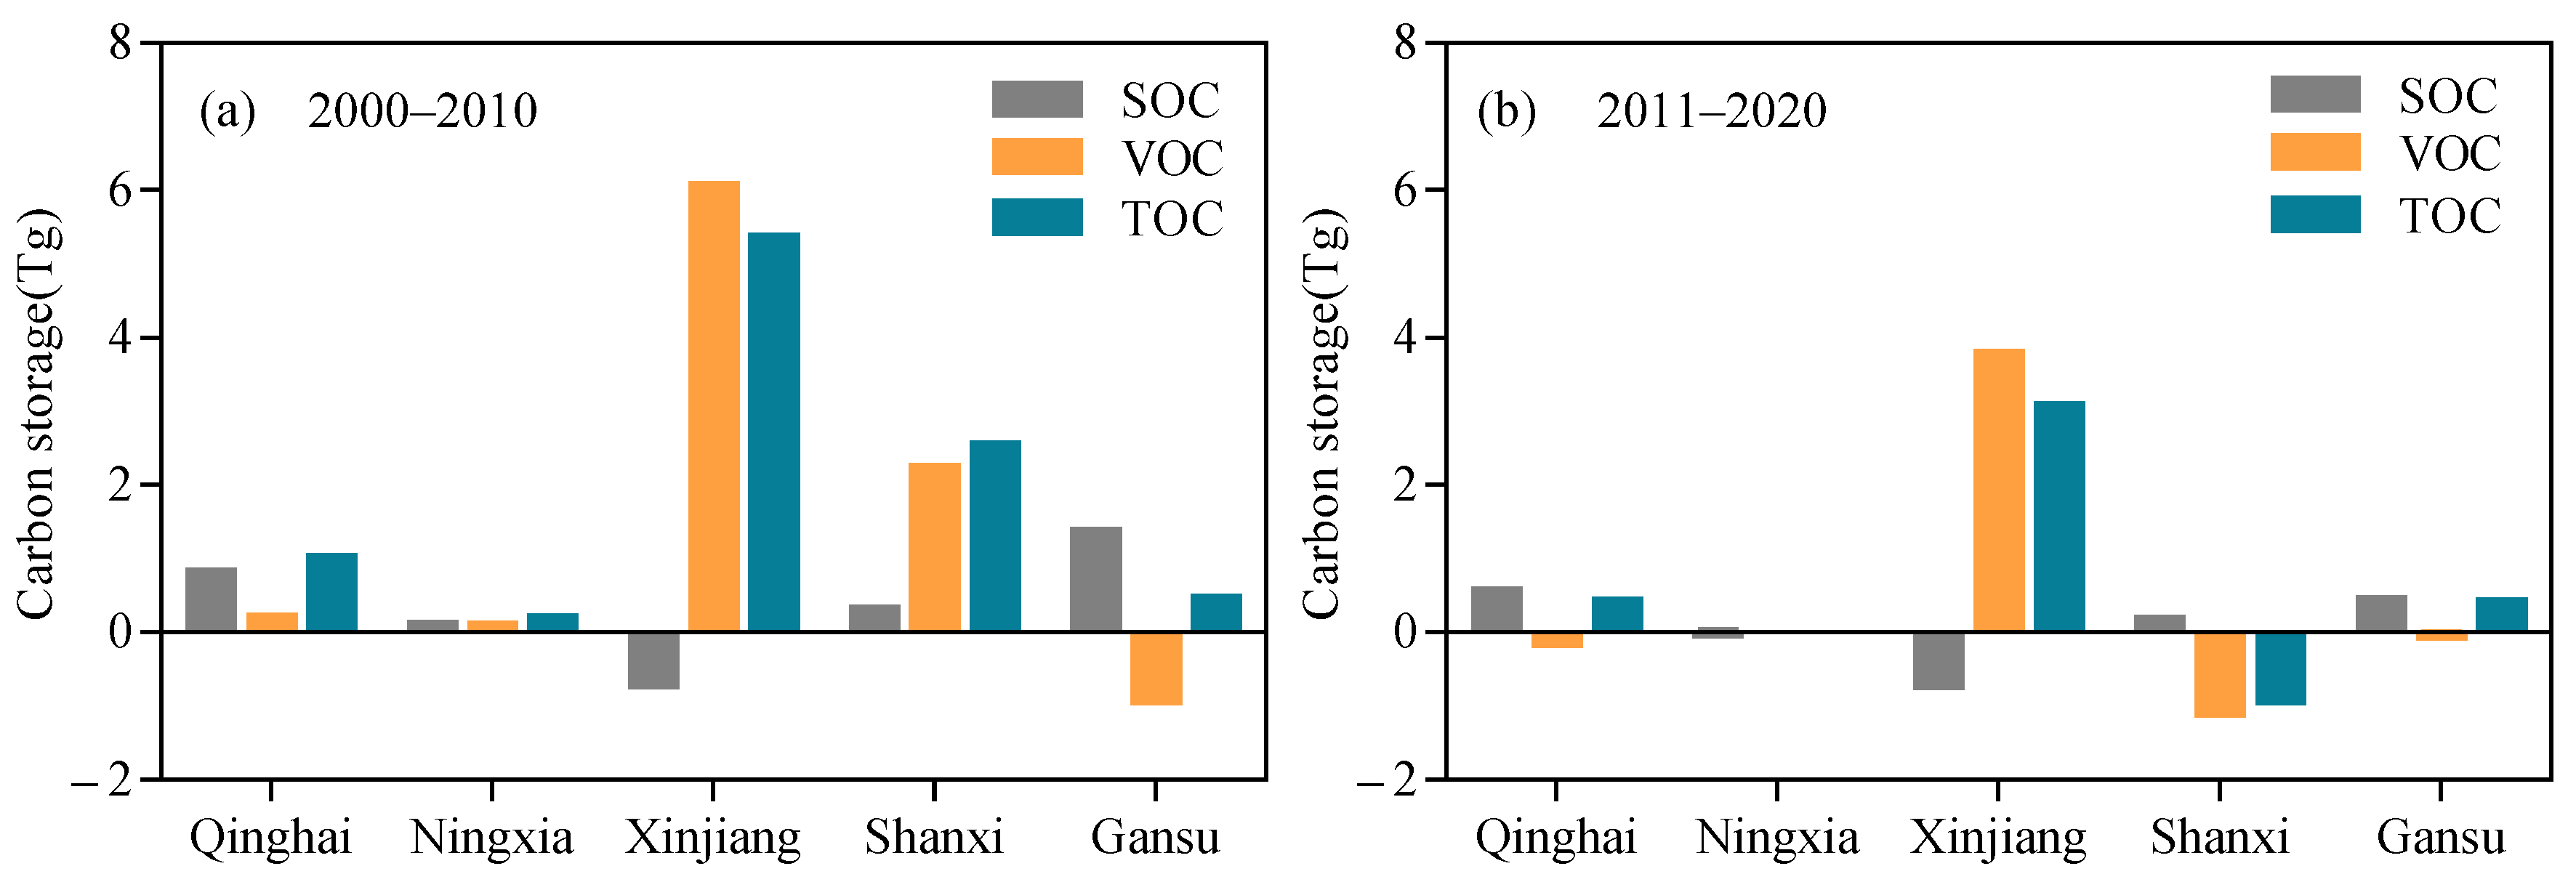
3.2.3. Spatial Variability in Carbon Storage

The changes in area and carbon storage caused by cropland changes were relatively consistent in spatial characteristics for both periods of study (Figure 8). In general, the highest carbon emission was found in Xinjiang (−3.68 Tg), followed by Ningxia (−0.21 Tg) province, while Shanxi (3.44 Tg), Gansu (3.17 Tg) and Qinhai (1.33 Tg) had carbon accumulation. Specifically, the largest decrease in carbon storage in Xinjiang province was −0.69 Tg from 2000 to 2010, and −2.99 Tg from 2010 to 2020. The smallest amount of carbon emissions occurred in Ningxia province with a decrease of 0.13 Tg from 2000 to 2010, and 0.08 Tg from 2010 to 2020. Additionally, vegetation carbon storage in Shanxi and Xinjiang provinces increased in the first period (3.06 and 0.01 Tg) and decreased in the second period (−0.09 and −2.28 Tg).

4. Discussion

4.1. Characteristics of Cropland Change from 2000 to 2020

Over the last several decades, the area and distribution of cropland in Northwest China has changed because of social and economic transitions (e.g., urbanization, population growth, etc.) [25,26]. Our results indicated that the area of cropland in Northwest China increased by 1.48 × 10⁶ ha during the period of 2000–2020, with a mean increase of 7.4 × 10⁴ ha per year. However, expansion and abandonment resulted in fluctuations in cropland area in different periods. During the first period from 2000 to 2007, cropland was mostly abandoned. With rapid urbanization and the expiration of new land contract periods, cropland occupation became more prominent, leading to land encroachment by urbanization. Meanwhile, farmers abandon land-use rights to other farmers or economic organizations, also contributing to a decrease in cropland area [26,37]. During the second period, from 2007 to 2014, cropland was reclaimed at a large-scale. The Chinese government successively established the strict boundaries for cropland (120 million ha), and increased the protection of cropland. At the same time, advancements in technologies (e.g., sprinkler and drip irrigation) improved the utilization efficiency of water and soil resources [38], enabling a gradual increase in cropland area from 2007 to 2014. Finally, with the improvement of cropland protection policy and ecological engineering programs (promoting the conversion of cropland to forest and to grassland) [39], the change in cropland area stabilized when cropland expansion and abandonment reached an equilibrium from 2014 to 2020. Considering the role of socio-economic factors in different stages of cropland change together with a numerical evaluation can help determine the change characteristics of annual cropland area. In summary, agricultural land development in Northwest China was likely to increase and be affected by socio-economic factors during 2000 to 2020.
Even though the area of cropland land has steadily increased over time due to the balance of cropland expansion and abandonment, the occupation of cropland by built-up land still showed an increasing trend in 2010–2020 over the previous period in our study. As we know, cropland abandonment driven by rapid urbanization is an irreversible trend across the globe. At the global scale, Huang et al. (2020) showed that the global urban expansion occupied a total of 159,170 km2 of cropland, in which China witnessed the largest cropland losses from urban expansion, accounting for 15.5‰ of the total cropland area from 1992 to 2016 (about 0.65‰/a; our study was 0.43‰/a) [12]. At the national scale, Liu et al. (2019) also found that croplands were the primary contributor to urban expansion in China since the 1970s [40], and Ju et al. (2018) found that 42,822 km2 of cropland was converted to built-up land in China, accounting for 43.8% of total cropland area loss during 1987 to 2010 (about 1.9%/a; our study was 0.74%/a) [11]. The above illustrates that compared to the expansion of cities on a national scale in China, urban expansion occupies only a small portion of cropland area in Northwest China in the present. However, the increasing occupation of cropland by urban expansion may increase the vulnerability of food security in Northwest China due to the importance of cropland resource for food production [41]. In the future, Northwest China should balance urban expansion with cropland protection by severely restricting the occupation of cropland.

4.2. Effects of Cropland Change on Carbon Storage

In arid and semiarid regions, cropland change (including expansion and abandonment) has been shown to have an important effect on carbon storage in both the biosphere and the pedosphere [42]. Our results demonstrated that cropland change from 2000 to 2020 resulted in a cumulative carbon sequestration of 4.05 Tg or 0.20 Tg yr−1, of which 2.28 Tg and 1.76 Tg were in soil and vegetation, respectively. This is consistent with other studies that have demonstrated that Northwest China is a sink for carbon as a result of cropland change [27].
Carbon storage caused by cropland expansion decreased by 17.66 Tg (0.88 Tg yr−1/0.24 × 10−6 Tg ha−1 yr−1) from 2000 to 2020. Similar results also have been found in many studies regarding the considerable losses of carbon storage caused by cropland expansion [13]. Globally, cropland is predicted to expand by 21% during 2010–2050 [43]. Cropland expansion is expected to lead to biomass and soil carbon emission of 13.7% and 4.6% during 2010–2050, respectively [7]. Of course, the loss of total carbon storage caused by cropland expansion is noticeable at national scales. For example, in China, cropland expansion was shown to result in annual carbon emissions of approximately 5.04 × 10⁻⁵ Tg ha−1 yr−1 [44]. In the United States, cropland expansion resulted in total carbon emissions of 1.38 × 10⁻⁵ TgC ha−1 yr−1 [8]. At regional scales, carbon emissions caused by cropland expansion in Hubei China were 3.31 × 10⁻⁶ TgC ha−1 yr−1 [45]. These indicated that carbon emissions per unit area caused by cropland expansion in Northwest China are lower than those in previous studies in different scales. In arid and semi-arid area, water resources are the main natural factors restricting the development of agriculture [28]. Crop irrigation presumably requires ground- or surface-water pumping, which entails additional fossil carbon emissions, and these emissions should be attributed to cropland given their dependence [46]. Also, the impact of other agricultural management, such as tillage and fertilization, on carbon emissions is not calculated in our study. Future improvements could reduce the uncertainty associated with this part of the carbon emission and facilitate more accurate assessments.
Carbon emission caused by cropland expansion in Northwest China was due mainly to the conversion of forest into cropland. The conversion of forest with high carbon density to cropland has also resulted in a major decline in carbon storage of about 8.60 Tg, accounting for 48.73% of the decrease in carbon storage due to cropland expansion. The loss of forest due to cropland expansion is noticeable not only in Northwest China but worldwide. It is reported that deforestation largely driven by cropland expansion have been the second largest source of anthropogenic greenhouse gas emissions globally [47]. Thus, if measures are taken to control deforestation in specified regions, the rate of carbon loss could be reduced. Meanwhile, carbon storage induced by the conversion of grassland to cropland decreased by 6.40 Tg, accounting for 36.25% of the decrease in carbon storage due to cropland expansion. Many studies have also shown that grassland conversion to cropland can cause sizable carbon emissions although it has often received less attention than deforestation [8,20]. This estimate may reflect the transition trend of relatively carbon-rich grassland or sensitive grassland. Although the carbon intensity is lower than that of forest conversion to cropland, the carbon loss caused by extensive grassland conversion to cropland in Northwest China cannot be ignored. In addition, desert-grassland, sandy and other lands occupy a large fraction of the area of Northwest China; with their low carbon density, these land types were reclaimed into cropland, changing the carbon cycle of desert ecosystem [48,49]. Thus, the carbon loss caused by large areas of other lands conversion in Northwest China also cannot be ignored. Of course, the new Chinese Environmental Protection Law proposed by the Chinese government has also emphasized the conservation of forests, grasslands and other natural ecosystems [50]. Over all, we think that further land-use policies to effectively support reasonable and restricted cropland expansion (such as deforestation, grassland and other land reclamation) will be able to potentially relief pressure on carbon emission caused by cropland expansion.
Meanwhile, it is worth noting that 3.13 × 10⁵ ha of cropland was occupied by built-up area, with a loss of approximately 0.24 Tg (0.012 Tg yr−1) of carbon storage. A preliminary estimate suggested that the occupied cropland was the source of carbon storage loss during the process of built-up land expansion [51]. However, the indirect emission effects of urbanization (such as waste products, population migration and land degradation) should attract our attention more than the variability in carbon storage caused by the conversion of built-up land into cropland [52]. These indirect emissions are likely to increase the uncertainty of carbon emissions. In terms of this issue, the New Urbanization policy proposed by the Chinese government highlighted the reduction in natural disturbance and the promotion of the reasonable development of land use [53]. Therefore, measures should be taken to balance urban expansion with the cropland protection policy in Northwest China, as the rate of carbon emission could be slowed in the future.
In addition, only 1.41 × 10⁵ ha of cropland was converted to forest, becoming the main source of carbon storage (11.16 Tg) in cropland change. These changes can be attributed to the implementation of a series of ecological engineering programs by the Chinese government in Northwest China, including the Natural Forest Conservation Program and Grain for Green Program. These programs promoted the conversion of cropland to forest and to grassland, and significantly affected carbon storage [37,54]. This indicates that the implementation of ecological engineering programs in Northwest China can promote the development of land cover types with high carbon density (forest and grassland) increasing regional carbon storage [55]. Undoubtedly, ecological engineering can play an important role in efforts to address environmental crises, improve human well-being, and achieve sustainability, and these effects will gradually expand as investment in ecological engineering continues to grow [37]. Above all, we propose that the capacity for carbon sequestration in our study area will benefit from the optimization of land-use structure with land-use policies (i.e., ecological engineering programs). This can be accomplished especially by increasing the area of ecologically valuable land with high capacity for carbon storage such as forest, limiting or decreasing deforestation, and restricting the abandonment of cropland to low-carbon-density land use, such as built-up land. Thus, we should also focus on the trade-off relationship between cropland protection and ecological construction.

4.3. Strengths and Limitations of This Study

This study used a novel approach to investigate carbon storage changes caused by cropland change (cropland expansion and abandonment) in Northwest China by combining land use data, carbon density data, and statistical yearbooks between 2000 and 2020. This is the first attempt to concentrate on the effect of both cropland expansion and cropland abandonment on the carbon storage in Northwest China. Compared to previous studies, this study mainly focused on annual the evaluation of carbon storage caused by annual cropland expansion or abandonment, a few arbitrary time points of land use data (2000, 2010 and 2020) combined with a series of provincial statistical yearbooks to obtain the annual cropland expansion and abandonment area in five northwestern provinces from 2000 to 2020, which provide an example to calculate land-use change data year by year when there are no more time-frequency land use data available. In addition, the results of this study can provide a reference for rational land-use management based on the assessment of annual regional carbon storage in areas that may have previously been overlooked, which is conducive to stable and sustainable development in arid and semi-arid regions.
Several uncertainties in this study will be the focus in future research. First, remote sensing data with spatial detail and statistical data with temporal frequency were used to obtain the annual area of cropland expansion and abandonment; this may not accurately reflect the annual area in cropland change. Thus, obtaining high-resolution land-use data with shorter time intervals may be a more effective method. Second, this study only involved aboveground biomass, and carbon emissions brought by agricultural management, such as tillage, fertilization and irrigation, on carbon emissions are not calculated. Belowground biomass and carbon emissions brought by agricultural management should be considered in the evaluation in such regional studies. Third, the carbon density data are set at a fixed level in this study, and those adopted in this study were from published studies and not from a sampling method varies from region to region. Furthermore, the time interval of 10 years used in this study may be insufficient to detect changes and stabilization in soil carbon density due to carbon density varying from time to time [56]. For future research, it is better to consider the spatio-temporal heterogeneity of carbon density if the data are accessible [42].
More importantly, in arid and semi-arid areas, water resources are the main natural factors restricting the utilization of land resources and the development of agriculture and forestry [29]. Although the conversion of cropland to forest and grassland are the most important sources of carbon sinks in cropland changes, the potential impact of an increase in vegetation cover on water demand needs to be considered. Thus, in the future, there is a need to consider how to make cropland changes result in reasonable carbon sinks within the confines of limiting water resources. Cropland changes over the long term can be simulated based on water resource limitation scenarios, which can provide valuable information for decision making processes involved in cropland change in Northwest China.

5. Conclusions

These results indicate that cropland changes acted as a carbon sink (4.05 Tg) in Northwest China, despite the dominance of cropland expansion area, carbon sequestration from the conversion of cropland to forest (11.16 Tg, affected by ecological engineering programs) contributed to the most increase. Thus, it is essential to promote the development of the area of ecologically valuable land with a high capacity for carbon storage, such as forests, or limit the conversion of low-carbon-density lands to cropland, such as by deforestation. More importantly, this is the first attempt to evaluate inter-annul carbon storage change due to both cropland expansion and cropland abandonment by combining land use data, carbon density data, and statistical yearbooks with IPCC method in Northwest China that area may have previously been overlooked.

Supplementary Materials

The following supporting information can be downloaded at: https://www.mdpi.com/article/10.3390/agronomy13112736/s1, Figure S1: Land cover maps: (a) 2000, (b) 2010, (c) 2020; Table S1: Land-use categories; Table S2: Annual cropland area in five northwestern provinces; Table S3: SOC density of different soil types (arranged alphabetically).

Author Contributions

J.K. performed the laboratory experiments, analyzed the data, coordinated the study, participated in conceptual design and prepared the manuscript. L.C. performed most of the work for conceptual design and prepared the manuscript. All authors have read and agreed to the published version of the manuscript.

Funding

This study was funded by the Second Tibetan Plateau Scientific Expedition and Research (STEP) program (Grant No. 2019QZKK0303), the National Natural Science Foundation of China (Grant No. 32301561) and the National Office for Philosophy and Social Sciences (Grant No. 21BGL058).

Data Availability Statement

Data are included in the manuscript or will be available upon request.

Conflicts of Interest

The authors declare no conflict of interest.

References

  1. Lembi, R.C.; Cronemberger, C.; Picharillo, C.; Koffler, S.; Sena, P.H.A.; Felappi, F.C.; Moraes, A.R.; Arshad, A.; Santos, J.P.; Mansur, A.V. Urban expansion in the Atlantic Forest: Applying the Nature Futures Framework to develop a conceptual model and future scenarios. Biota Neotrop. 2020, 20, e20190904. [Google Scholar] [CrossRef]
  2. Friedlingstein, P.; O’sullivan, M.; Jones, M.W.; Andrew, R.M.; Zaehle, S. Global carbon budget 2020. Earth Syst. Sci. Data 2020, 12, 3269–3340. [Google Scholar]
  3. Houghton, R.A.; Nassikas, A.A. Global and regional fluxes of carbon from land use and land cover change 1850–2015. Glob. Biogeochem. Cycles 2017, 31, 456–472. [Google Scholar] [CrossRef]
  4. IPBES. Global Assessment Report on Biodiversity and Ecosystem Services of the Intergovernmental Science-Policy Platform on Biodiversity and Ecosystem Services; Brondizio, E.S., Settele, J., Díaz, S., Ngo, H.T., Eds.; IPBES Secretariat: Bonn, Germany, 2019; p. 28. [Google Scholar]
  5. Potapov, P.; Turubanova, S.; Hansen, M.C.; Tyukavina, A.; Zalles, V.; Khan, A.; Song, X.P.; Pickens, A.; Shen, Q.; Cortez, J. Global maps of cropland extent and change show accelerated cropland expansion in the twenty-first century. Nat. Food. 2022, 3, 19–28. [Google Scholar] [CrossRef]
  6. Huang, Y.; Li, F.; Xie, H. A scientometrics review on farmland abandonment research. Land 2020, 9, 263. [Google Scholar] [CrossRef]
  7. Molotoks, A.; Stehfest, E.; Doelman, J.; Albanito, F.; Fitton, N.; Dawson, T.P.; Smith, P. Global projections of future cropland expansion to 2050 and direct impacts on biodiversity and carbon storage. Glob. Chang. Biol. 2018, 24, 5895–5908. [Google Scholar] [CrossRef] [PubMed]
  8. Spawn, S.A.; Lark, T.J.; Gibbs, H.K. Carbon emissions from cropland expansion in the United States. Environ. Res. Let. 2019, 14, 045009. [Google Scholar] [CrossRef]
  9. Johnson, B.G.; Zuleta, G.A. Land-use land-cover change and ecosystem loss in the Espinal ecoregion, Argentina. Agric. Ecosyst. Environ. 2013, 181, 31–40. [Google Scholar] [CrossRef]
  10. Liu, F.; Zhang, Z.; Zhao, X.; Wang, X.; Zuo, L.; Wen, Q.; Ling, J.; Bin, S. Chinese cropland losses due to urban expansion in the past four decades. Sci. Total Environ. 2019, 650, 847–857. [Google Scholar] [CrossRef]
  11. Ju, H.; Zhang, Z.; Zhao, X.; Wang, X.; Wu, W.; Yi, L.; Wen, Q.; Liu, F.; Xu, J.; Hu, S. The changing patterns of cropland conversion to built-up land in China from 1987 to 2010. J. Geogr. Sci. 2018, 28, 1595–1610. [Google Scholar] [CrossRef]
  12. Huang, Q.; Liu, Z.; He, C.; Gou, S.; Bai, Y.; Wang, Y.; Shen, M. The occupation of cropland by global urban expansion from 1992 to 2016 and its implications. Environ. Res. Lett. 2020, 15, 084037. [Google Scholar] [CrossRef]
  13. Yang, X.; Jin, X.; Xiang, X.; Fan, Y.; Liu, J.; Shan, W.; Zhou, Y. Carbon emissions induced by farmland expansion in China during the past 300 years. Sci. China Earth Sci. 2019, 62, 423–437. [Google Scholar]
  14. He, Q.; Zeng, C.; Xie, P.; Liu, Y.; Zhang, M. An assessment of forest biomass carbon storage and ecological compensation based on surface area: A case study of Hubei Province, China. Ecol. Indic. 2018, 90, 392–400. [Google Scholar]
  15. Shi, L.; Sun, J.; Lin, J.; Zhao, Y. Factor decomposition of carbon emissions in Chinese megacities. J. Environ. Sci. 2019, 75, 209–215. [Google Scholar] [CrossRef] [PubMed]
  16. Liu, S.; Li, F.; Zhang, Q.; Li, Z.; Tian, C.; Qiao, Y.; Qiao, Y.; Du, K.; Cheng, H.; Chen, G.; et al. Soil Quality Improvement with Increasing Reclamation Years in the Yellow River Delta. Agronomy 2023, 13, 2576. [Google Scholar] [CrossRef]
  17. Wang, Y.; Yang, J.; Duan, C. Research on the Spatial-Temporal Patterns of Carbon Effects and Carbon-Emission Reduction Strategies for Farmland in China. Sustainability 2023, 15, 10314. [Google Scholar]
  18. Li, Z.; Tang, Q.; Wan, X.; Chen, B.; Sun, C.; Xin, X. Grassland carbon change in Northern China due to contemporary and future land use and land cover change. Agronomy 2023, 13, 2180. [Google Scholar] [CrossRef]
  19. Qiu, L.; Wei, X.; Zhang, X.; Cheng, J.; Long, T. Soil organic carbon losses due to land use change in a semiarid grassland. Plant Soil. 2012, 355, 299–309. [Google Scholar]
  20. Li, X.; Li, Y.; Li, F.; Ma, Q.; Zhang, Q.; Yin, P. Changes in soil organic carbon, nutrients and aggregation after conversion of native desert soil into irrigated arable land. Soil Tillage Res. 2009, 104, 263–269. [Google Scholar]
  21. Fu, C.; Yu, G.; Fang, H.; Wang, Q. Effects of Land use and cover change on terrestrial carbon balance of China. Prog. Geogr. 2012, 31, 88–96. (In Chinese) [Google Scholar]
  22. Oelbermann, M.; Voroney, R.P. An evaluation of the century model to predict soil organic carbon: Examples from Costa Rica and Canada. Agroforest Syst. 2011, 82, 37–50. [Google Scholar] [CrossRef]
  23. Qin, Z.; Zhuang, Q.; Zhu, X. Carbon and nitrogen dynamics in bioenergy ecosystems: 1. Model development, validation and sensitivity analysis. GCB Bioenergy 2014, 6, 740–755. [Google Scholar] [CrossRef]
  24. Sitch, S.B.; Prentice, I.C.; Arneth, A.; Bondeau, A.; Cramer, W.; Kaplan, J.O.; Levis, S.; Lucht, W.; Sykes, M.T.; Thonicke, K.; et al. Evaluation of ecosystem dynamics, plant geography and terrestrial carbon cycling in the LPJ dynamic global vegetation model. Glob. Chang. Biol. 2010, 9, 161–185. [Google Scholar] [CrossRef]
  25. Zhao, Y.; Wang, M.; Hu, S.; Zhang, X.; Ouyang, Z.; Zhang, G.; Huang, B.; Zhao, S.; Wu, J.; Xie, D.; et al. Economics-and policy-driven organic carbon input enhancement dominates soil organic carbon accumulation in Chinese croplands. Proc. Natl. Acad. Sci. USA 2018, 115, 4045–4050. [Google Scholar] [CrossRef]
  26. Zhang, Y.; Li, C.; Wang, T.; Cai, C.; Bao, Y. County-level patterns of cropland and their relationships with socio-economic factors in northwestern China. Agric. Ecosyst. Environ. 2015, 203, 11–18. [Google Scholar] [CrossRef]
  27. Zhang, M.; Huang, X.J.; Chuai, X.W.; Yang, H.; Lai, L.; Tan, J.Z. Impact of land use type conversion on carbon storage in terrestrial ecosystems of China: A spatial-temporal perspective. Sci. Rep. 2015, 5, 10233. [Google Scholar] [CrossRef]
  28. Wang, Y.J.; Qin, D.H. Influence of climate change and human activity on water resources in arid region of Northwest China: An overview. Adv. Clim. Chang. Res. 2017, 8, 268–278. [Google Scholar] [CrossRef]
  29. Wang, T. Review and prospect of research on oasification and desertification in arid regions. J. Desert. Res. 2014, 29, 1–9. (In Chinese) [Google Scholar]
  30. Pan, X.; Zhang, L.; Huang, C. Future climate projection in northwest china with regcm4.6. Earth Space Sci. 2020, 7, e2019EA000819. [Google Scholar]
  31. Yang, P.; Xia, J.; Zhang, Y.; Hong, S. Temporal and spatial variations of precipitation in Northwest China during 1960–2013. Atmos. Res. 2017, 183, 283–295. [Google Scholar] [CrossRef]
  32. Deng, X.; Liu, Y.; Liu, Z. Temporal-spatial dynamic change characteristics of evapotranspiration in arid region of Northwest China. Acta Ecol. Sin. 2017, 37, 2994–3008. (In Chinese) [Google Scholar]
  33. Chen, Y.; Luo, G.; Maisupova, B.; Chen, X.; Mukanov, B.M.; Wu, M.; Mambetov, B.T.; Huang, J.; Li, C. Carbon budget from forest land use and management in Central Asia during 1961–2010. Agric. For. Meteorol. 2016, 221, 131–141. [Google Scholar] [CrossRef]
  34. IPCC. Good Practice Guidance for Land Use, Land-Use Change and Forestry. In IPCC Guidelines for National Greenhouse Gas Inventories (Prepared by the National Greenhouse Gas Inventories Programme); IPCC: Geneva, Switzerland, 2006. [Google Scholar]
  35. Fang, J.; Guo, Z.; Piao, S.; Chen, A. Terrestrial vegetation carbon sinks in China, 1981–2000. Sci. China Ser. D 2007, 50, 1341–1350. [Google Scholar] [CrossRef]
  36. IPCC. Good Practice Guidance for Land Use, Land Use Change and Forestry; Institute for Global Environmental Strategies: Hayama, Japan, 2003; p. 617. [Google Scholar]
  37. Ye, X.; Chuai, X. Carbon sinks/sources’ spatiotemporal evolution in China and its response to built-up land expansion. J. Environ. Manag. 2022, 321, 115863. [Google Scholar] [CrossRef]
  38. Wang, X.F.; Hao, L.; Qin, H.B.; Su, L.Y.; Liu, Z. Textual quantitative analysis of cultivated land ecological management and protection policies in China from the perspective of policy tools. China Land Sci. 2018, 32, 15–23. [Google Scholar]
  39. Lichtenberg, E.; Ding, C. Chapter 5: Assessing Farmland Protection Policy in China. Land Use Policy 2008, 25, 59–68. [Google Scholar] [CrossRef]
  40. Liu, X.; Wang, S.; Wu, P. Impacts of urban expansion on terrestrial carbon storage in China. Environ. Sci. Technol. 2019, 53, 6834–6844. [Google Scholar] [CrossRef]
  41. EIU. Global Food Security Index 2018: Building Resilience in the Face of Rising Food-Security Risks. Economist Intelligence Unit, Ed. 2018. Available online: https://nonews.co/wp-content/uploads/2018/10/GFSI2018.pdf (accessed on 1 May 2022).
  42. Ke, S.; Wu, Y.; Cui, H.; Lu, X. The mechanisms and spatial-temporal effects of farmland spatial transition on agricultural carbon emission: Based on 2018 counties in China. Environ. Sci. Pollut. Res. 2023, 30, 107716–107732. [Google Scholar] [CrossRef]
  43. Mogollón, J.M.; Beusen, A.H.; Van Grinsven, H.J.M.; Westhoek, H.; Bouwman, A.F. Future agricultural phosphorus demand according to the shared socioeconomic pathways. Glob. Environ. Chang. 2018, 50, 149–163. [Google Scholar] [CrossRef]
  44. Yang, F.; He, F.; Li, S.; Li, M.; Wu, P. A new estimation of carbon emissions from land use and land cover change in China over the past 300 years. Sci. Total Environ. 2023, 863, 160963. [Google Scholar] [CrossRef]
  45. Tang, L.; Ke, X.; Zhou, T.; Zheng, W.; Wang, L. Impacts of cropland expansion on carbon storage: A case study in Hubei, China. J. Crop. Improv. 2020, 265, 110515. [Google Scholar] [CrossRef]
  46. Dubey, A.; Lal, R. Carbon footprint and sustainability of agricultural production systems in Punjab, India, and Ohio, USA. J. Crop. Improv. 2014, 23, 332–350. [Google Scholar] [CrossRef]
  47. Li, Y.; Brando, P.; Morton, D.; Lawrence, D.; Yang, H.; Randerson, J. Deforestation-induced climate change reduces carbon storage in remaining tropical forests. Nat. Commun. 2022, 13, 1964. [Google Scholar] [CrossRef]
  48. Su, Y.Z.; Yang, R.; Liu, W.J.; Wang, X.F. Evolution of soil structure and fertility after conversion of native sandy desert soil to irrigated cropland in arid region, China. Soil. Sci. 2010, 175, 246–254. [Google Scholar] [CrossRef]
  49. Yang, H.; Huang, X. Enforcement key to China’s environment. Science 2015, 347, 834–835. [Google Scholar] [CrossRef] [PubMed]
  50. Molotoks, A.; Henry, R.; Stehfest, E.; Doelman, J.; Smith, P. Comparing the impact of future cropland expansion on global biodiversity and carbon storage across models and scenarios. Philos. Trans. R. Soc. B 2020, 375, 20190189. [Google Scholar] [CrossRef] [PubMed]
  51. Xie, E.; Zhang, X.; Lu, F.; Peng, Y.; Zhao, Y. Spatiotemporal changes in cropland soil organic carbon in a rapidly urbanizing area of southeastern china from 1980 to 2015. Land Degrad. Dev. 2022, 9, 33. [Google Scholar] [CrossRef]
  52. Bai, X.; Shi, P.; Liu, Y. Society: Realizing China’s urban dream. Nature 2014, 509, 158. [Google Scholar] [CrossRef] [PubMed]
  53. Wang, Z.; Xu, L.; Shi, Y.; Ma, Q.; Wu, Y.; Lu, Z.; Mao, L.; Pang, E.; Zhang, Q. Impact of Land Use Change on Vegetation Carbon Storage during Rapid Urbanization: A Case Study of Hangzhou, China. Chin. Geogr. Sci. 2021, 31, 209–222. [Google Scholar] [CrossRef]
  54. Yuan, J.; Ouyang, Z.; Zheng, H.; Su, Y. Ecosystem carbon storage following different approaches to grassland restoration in south-eastern Horqin Sandy Land, northern China. Glob. Ecol. Conserv. 2021, 26, e01438. [Google Scholar] [CrossRef]
  55. Lei, L.; Li, Y.; Zhou, Z.; Li, N.; Zhao, C.; Li, Q. Cropland abandonment alleviates soil carbon emissions in the North China Plain. Environ. Monit. Assess. 2023, 34, 1859–1868. [Google Scholar] [CrossRef] [PubMed]
  56. Jiang, W.; Deng, Y.; Tang, Z.; Lei, X.; Chen, Z. Modelling the potential impacts of urban ecosystem changes on carbon storage under different scenarios by linking the CLUE-S and the InVEST models. Ecol. Model. 2017, 345, 30–40. [Google Scholar] [CrossRef]
Figure 1. Research framework for calculations of carbon storage induced by cropland changes.
Agronomy 13 02736 g001
Figure 2. Location of Northwest China and its administrative divisions.
Agronomy 13 02736 g002
Figure 3. Temporal dynamics of cropland expansion and abandonment. (a) annual area of cropland expansion; (b) annual area of cropland abandonment; (c) annual area of net increase.
Agronomy 13 02736 g003
Figure 4. Provincial area of cropland changes from 2000 to 2010 (a), 2011 to 2020 (b).
Agronomy 13 02736 g004
Figure 5. Spatial distribution of cropland change from 2000 to 2010 (a), 2011 to 2020 (b). The red fields represent cropland expansion and abandonment, the last fields represent other types of land-use change. Others represent the lands remaining unchanged.
Agronomy 13 02736 g005
Figure 6. Changes in soil, vegetation and total carbon storage over time.
Agronomy 13 02736 g006
Figure 7. Changes in carbon storage due to different cropland conversion types. (a) changes in carbon storage in cropland expansion; (b) changes in carbon storage in cropland abandonment.
Agronomy 13 02736 g007
Figure 8. Carbon storage due to cropland change in each province from 2000 to 2010 (a), and 2011 to 2020 (b).
Agronomy 13 02736 g008
Table 1. Vegetation carbon density in each land cover type.
Land-Use TypeForestGrasslandCroplandWaterBuilt-Up LandOther Land
vegetation carbon density (t C ha−1)79.223.465.70000.55
Table 2. The impact factors of SOC change in cropland change.
ItemsForestGrasslandOther LandCropland
Forest-- −27%
Grassland-- −20%
Other land 80%
Cropland90%100%−20%-
Table 3. Changes in cropland area and type in Northwest China for different time periods (×102 ha).
Type2000–2005Proportion (%)2005–2020Proportion (%)2000–2020Proportion (%)
Forest to cropland656.15 3.13 408.85 2.761065.00 2.97
Grassland to cropland8527.23 40.63 5757.72 38.8214,284.95 39.88
Water to cropland64.20 0.31 39.12 0.26103.32 0.29
Built-up land to cropland12.510.0650.350.3462.860.18
Other land to cropland11,725.91 55.87 8575.27 57.8220,301.18 56.68
Cropland expansion20,986.00 100.0014,831.31 100.0035,817.31 100.00
Cropland to forest1125.01 7.97 291.65 4.20 1416.66 6.73
Cropland to grassland10,144.49 71.88 4056.76 58.42 14,201.25 67.44
Cropland to water47.83 0.34 33.78 0.49 81.61 0.39
Cropland to built-up land1064.67 7.54 2064.12 29.72 3128.79 14.86
Cropland to other land1730.52 12.26 498.38 7.18 2228.90 10.58
Cropland abandonment14,112.53 100.006944.70 100.0021,057.23 100.00
Net increase6873.48 7886.61 14,760.08
Disclaimer/Publisher’s Note: The statements, opinions and data contained in all publications are solely those of the individual author(s) and contributor(s) and not of MDPI and/or the editor(s). MDPI and/or the editor(s) disclaim responsibility for any injury to people or property resulting from any ideas, methods, instructions or products referred to in the content.

