Article

Wild Oats Offer New Possibilities for Forage Because of the Higher Nutrition Content and Feed Value

1
Key Laboratory of Coarse Cereal Processing, Ministry of Agriculture and Rural Affairs, Sichuan Engineering & Technology Research Center of Coarse Cereal Industralization, College of Food and Biological Engineering, Chengdu University, Chengdu 610106, China
2
Sichuan Liangshan Yi Autonomous Prefecture Agricultural Science Research Institute, Xichang 615099, China
3
Institute of Evolution, University of Haifa, Haifa 31905, Israel
*
Authors to whom correspondence should be addressed.
Agronomy 2023, 13(10), 2575; https://doi.org/10.3390/agronomy13102575
Submission received: 28 August 2023 / Revised: 19 September 2023 / Accepted: 25 September 2023 / Published: 7 October 2023

Abstract

:
Oats (Avena sativa L.) are mostly used as a germplasm resource for forage. This experiment showed the differences in the nutrient composition and the forage quality of five wild leather oat populations from Israel and one cultivated leather oat population from China. It also showed the correlation of the indicators with the geo-environmental factors in the places of origin of the six populations that were analysed. Three replicated experiments were conducted during a three-year period from 2018.10 to 2020.03, mainly from 11 indicators of nutrient composition and forage quality. In this experiment, Spearman’s correlation was used to analyse the differences between different groups (p < 0.05), the relationship between components was analysed by principal component analysis (PCA), and the kinship relationship between six groups was also analysed based on the data of 11 components. In terms of nutrient content, the cultivated group Hu had significantly lower ash (8.92%), crude protein (11.96%), and soluble sugar content (10.51%) than the wild oat groups. In terms of forage quality, the lignin content (3.31%) of the Hu population was 2.3 times higher than that of Evolution Canyon, and the fibre content was 8 times higher than that of Sede Boqer. This indicates that wild oats have better nutritional value and palatability. Following the correlation analysis, it was found that the environmental factors of the origin had a significant effect on the indexes of ash, crude protein, and soluble sugar of oat straw, but had less effect on the content of crude fat, total phosphorus, and total potassium. Meanwhile, the annual rainfall and the number of rainfall days in the origin had a significant effect on the fibre content. In conclusion, the higher variability of wild oat populations due to the influence of different environmental and geographical factors may be a new possibility brought by forage oats.

1. Introduction

Oats are an important annual forage and food crop of the genus oats in the family Gramineae, divided into two types: naked oats (Avena nuda L.) and leather oats (A. Sativa L.), which are grown all over the world. Oat cultivation in China is mainly distributed in the northeast, north, and southwest [1], and is recognized as one of the world’s eight major food crops and an excellent forage crop [1,2]. Oat seeds are very rich in protein, fat, and other nutrients and can be an excellent dietary product, with a protein content of more than 15.0% and a fat content of 8.8% [1,3]. Oats do not have harsh growing conditions, and can be grown in poor and arid areas, but also because of its advantages, a high yield is often planted in pasture or high Beit-Orenude areas as livestock feed [4,5,6]. It is also often grown as a livestock feed in pastoral areas or at high Beit-Orenudes for its high yield. About 73% of the world’s oat production is forage, mainly for processing, and eating is only 12%, so oats are an important forage quality raw material in the world [7,8,9,10].
The nutritional content of crude protein, crude fat, starch, and β-glucan varied somewhat between oat varieties, and the starch-pasting characteristics and thermodynamic properties were influenced by different source environments [11,12,13]. The forage quality of oats is influenced by different factors, and the available studies show that: oats require a large amount of water during the growing period, and the water supply status has an important influence on the growth and development, yield, and quality formation of oats [14,15] The water requirements of oats are different in different fertility stages [16]. Fixed drip irrigation can effectively increase the crude protein, crude fat, and glucan content of oats [17,18,19,20]. It has also been shown that the selection of the appropriate sowing stage has a positive impact on the quality of oats. Moreover, the selection of suitable sowing and mowing periods can improve the yield and nutritional quality of oats [21,22,23,24,25]. The increase in cumulative temperature during the growing period had a significant effect on the growth of oat forage [26,27,28], and the increase in cumulative temperature from nodulation to tiller was not conducive to the formation of oat forage yield and quality [29], but the increase in cumulative temperature between the seedling and tiller could improve the content of crude fat and acidic detergent fibre [30,31,32]. However, the increase in temperature between the seedling and tillering increased the crude fat and acidic detergent fibre content. Israel is one of the origins of wheat crops (including oats), and its wild oats have rich genetic diversity and are excellent genetic resources for improving forage oat varieties. Previous studies have shown that oats from Israel vary greatly in nutritional composition between groups, presumably due to their genetics and differences in the growth environment [33,34,35,36]. However, further research is needed on the differences in nutrients such as ash, crude fat, etc., between groups.
Currently, there are many studies on the nutritional quality of oat forage, but there are fewer studies on the nutritional composition and forage quality of different oat populations in their places of origin. In this study, we analysed the nutritional composition and forage quality of 18 genotypes of oats from six oat populations and explored the potential relationship between them based on the environmental factors of different populations’ origins to provide a reference for oat forage quality improvement and breeding.

2. Materials and Methods

2.1. Test Materials

A total of six oat (Avena sativa L.) populations were used in this experiment (Table 1). Five wild oat populations were collected from Israel by Prof. Yan Jun of Chengdu University, and one cultivated oat population was provided by Prof. Hu Yinguang of Northwest Agriculture and Forestry University of Science and Technology, respectively. The ecogeographic data of different populations are shown in Table 2.

2.2. Test Methodology

The experiment was conducted on October 2018–March 2019, October 2019–March 2020, and October 2020–March 2021 in a same plot in Chengdu. Eighteen wild oat genotypes of six cultivated oat varieties were used to randomly partition the genotypes, and 60 seeds of uniform size and complete shape were selected for each genotype. The experiment was sown in strips, with a row length of 1.5 m, a row spacing of 50 cm, 20 seeds per row, three replications, a total of 54 rows, and protected rows were designed.
The oats were mowed in January 2019–January 2021 during the tasselling period, harvested and killed at 105 °C for 15 min, dried at 75 °C to a constant weight, crushed with a plant grinder, passed through a 40 mesh sieve, and stored in self-sealing bags at room temperature, protected from light.

2.3. Measurement Indicators and Methods

The crude protein (CP), crude fat (Ether extract, EE), ash content (Ash) [37,38], neutral detergent fibre (NDF) [39], and acid detergent fibre (ADF) [39] of oats were The content of crude fat (EE) [37], ash content (Ash), neutral detergent fibre (NDF), and acid detergent fibre (ADF) were determined using a FOSS NIR quality analyser.
Water soluble carbohydrates (WSC) were extracted by anthrone colorimetry and then measured by UV spectrophotometer, total phosphorus (TP) was measured by ammonium molybdate spectrophotometry, and total calcium (TK) was measured by atomic absorption spectrometry. Total phosphorus (TP) was determined by ammonium molybdate spectrophotometry, total kalium (TK) was determined by atomic absorption spectrometry [40] and inorganic phosphorus (IP) was measured spectrophotometrically [41].
Relative feeding quality is calculated using the equations Equations (1) and (2) [42].
Relative Feeding Quality (RFQ)
RFQ = TDN(%DW) × DMI(%BW)/1.23
The prediction model equation for total digestible nutrients (TDN) is.
TDN (%DM) = 82.38 − (0.7515 × ADF)

2.4. Data Analysis

Data were collated using Excel, Turkey–Kramer HSD (p < 0.05) using JMP Pro to detect the significance of differences, and Spielman’s rank correlation coefficient and ANOVA were used to analyse the correlation between oat nutrient content, forage quality, and place of origin. All experiments on each oat tested with 18 genotypes of the six populations were performed in three replicates. MS Excel 2016 was used to estimate the mean, cumulative variability (C.V), range, and other statistics. Pearson’s correlation coefficients were estimated using SPSS 27.
The mean data across three years of 11 indices of nutritional content and forage quality were subjected to cluster analysis with Origin 2022. Principal component analysis was performed using Origin 2022.

3. Results and Analysis

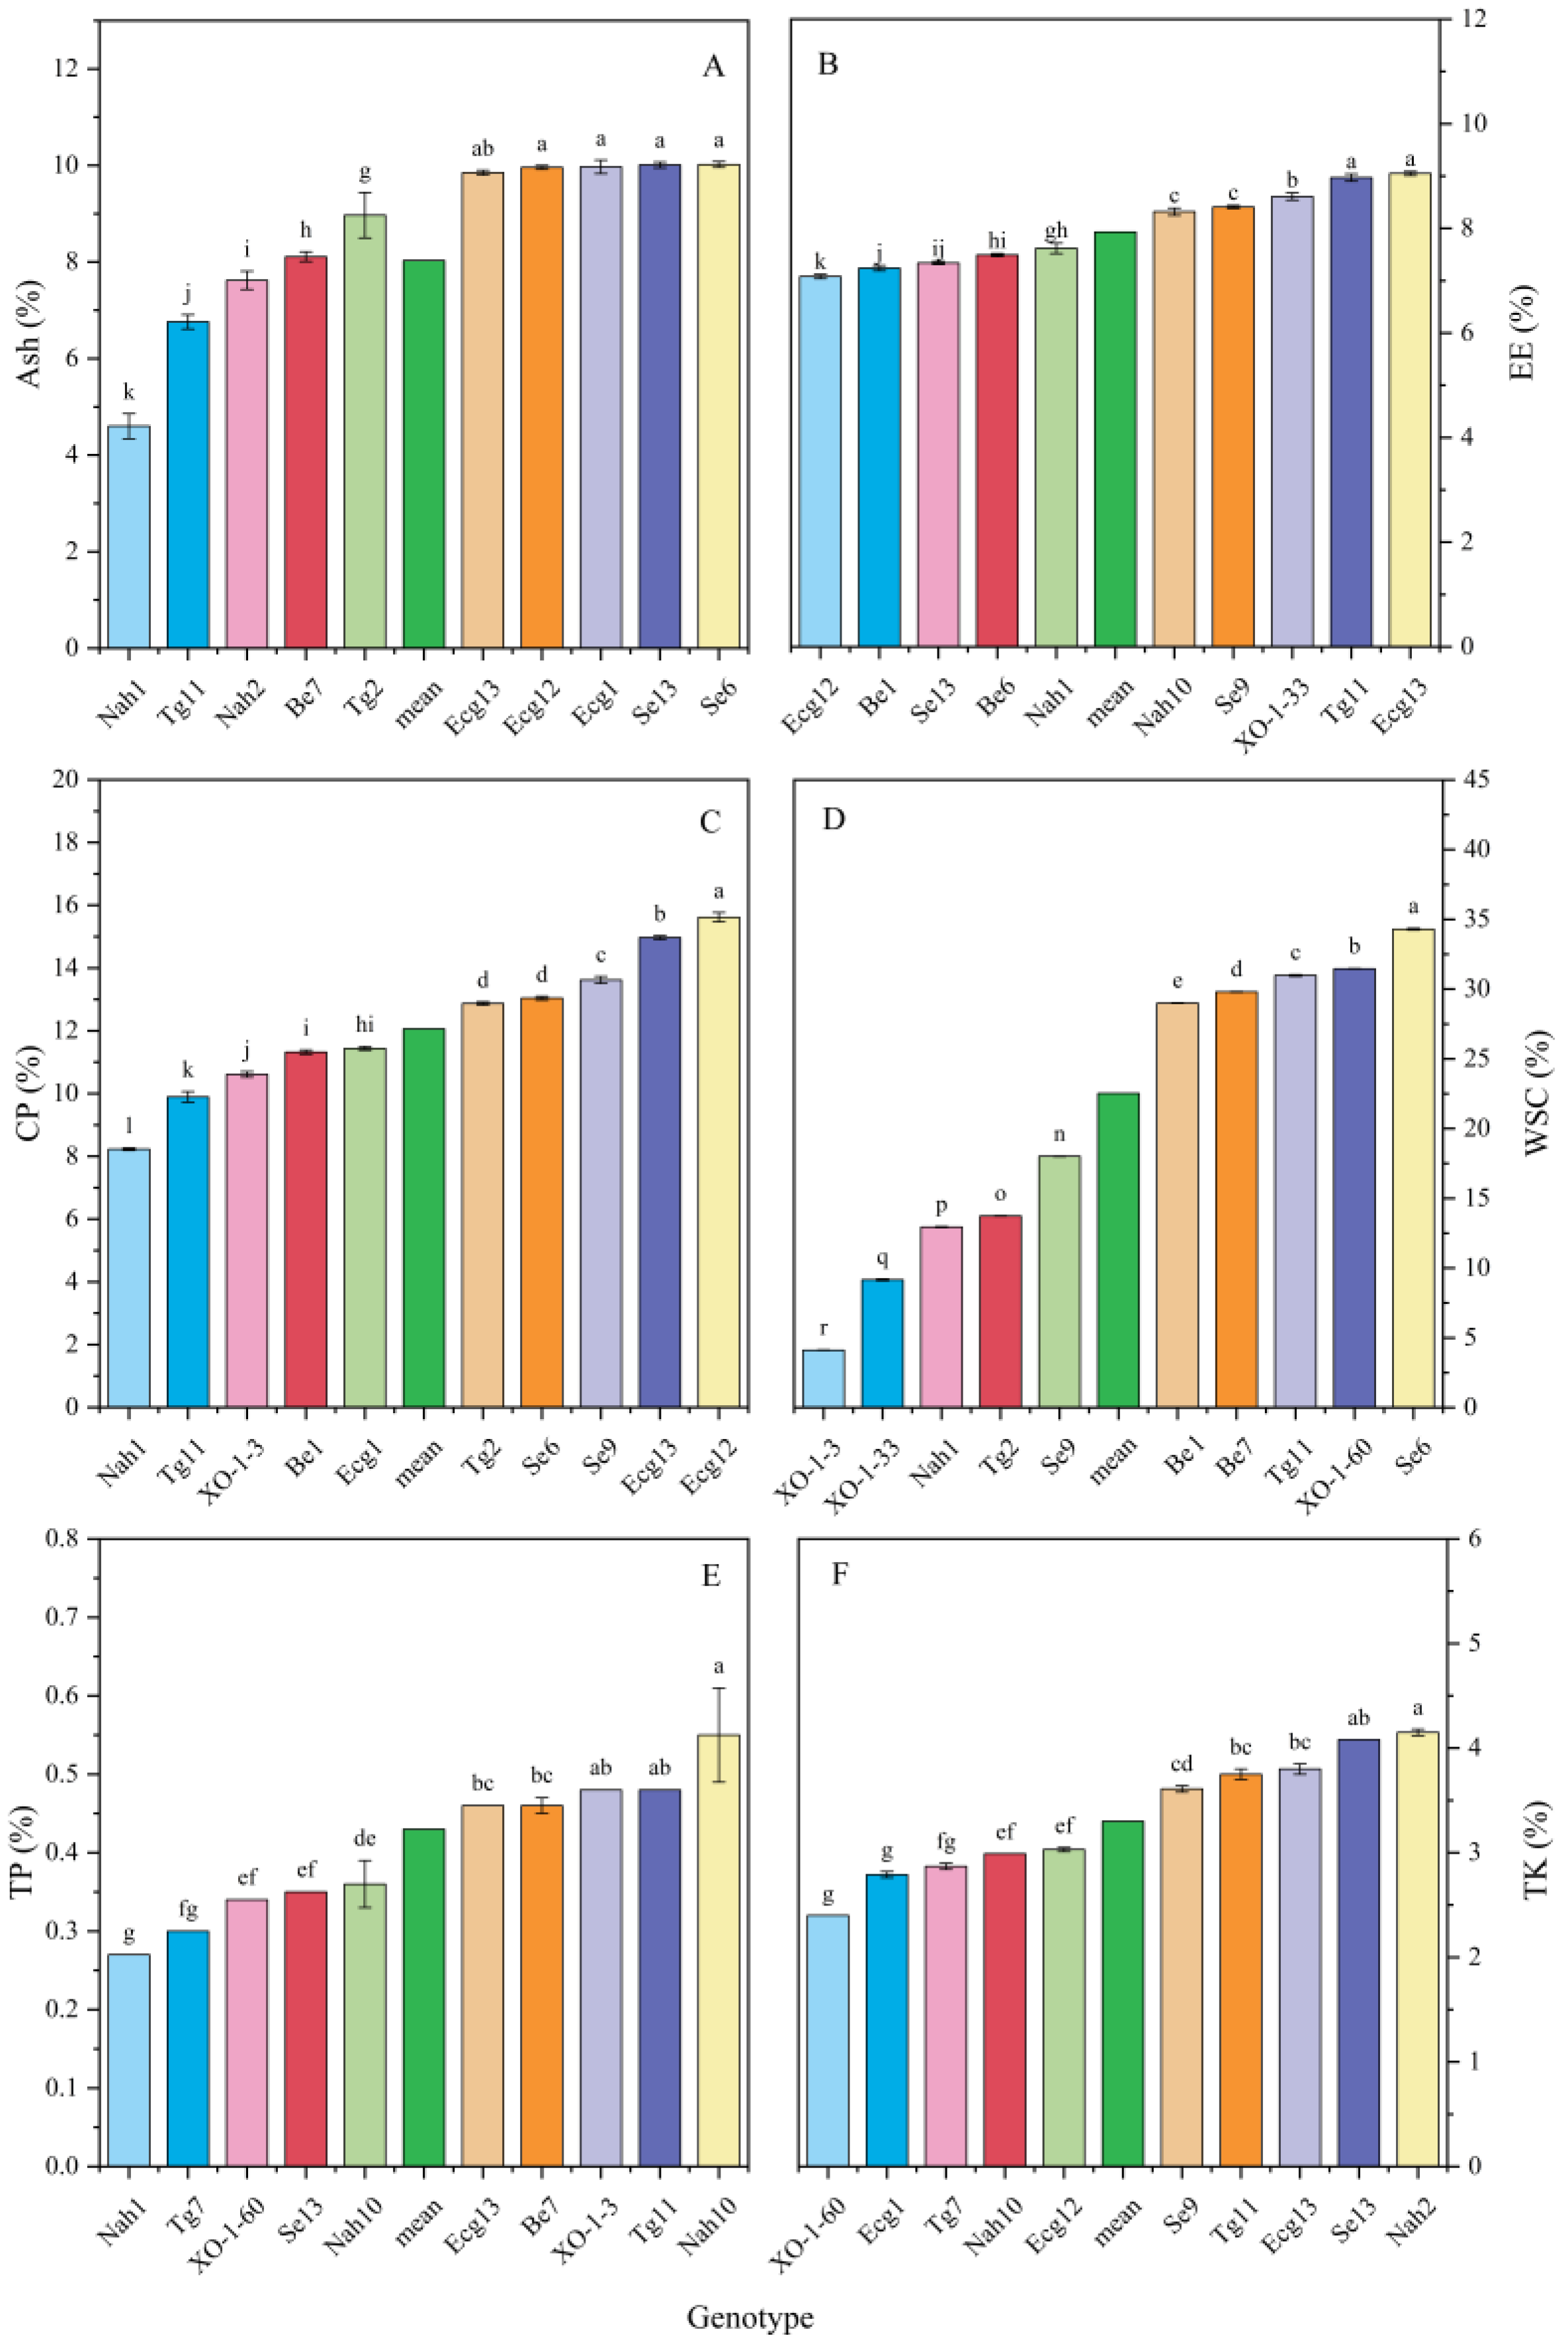
3.1. Nutritional Content Analysis of Different Oat Populations

In this study, six oat populations with 18 genotypes sown in fall 2018, fall 2019, and fall 2021 were tested for nutrients such as ash, crude fat, crude protein, soluble sugars, total phosphorus, and total potassium (Supplementary Table S1). The results showed that the ash content of the Sede Boqer and Evolution Canyon oat populations was significantly higher than the other populations, reaching 9.25% and 9.04% (average data of 3 years), respectively. The crude fat content of the Beit-Oren (9.82%) was significantly lower than the other five populations, differing by 8.24% from the Tabigh, which had the highest crude fat content. The crude protein content of Hu, Nahef was lower, differing by 11.96% and 18.96% from the Evolution Canyon population, which had the highest content. In terms of soluble sugars, the Tabigha population had the highest content of 21.39%; Hu had the lowest content of 10.51%, with a difference of 50.87% and a significant difference between populations. In terms of total phosphorus, the Nahef population had the lowest total phosphorus content of 0.31%. The total potassium and total phosphorus contents did not differ significantly among the six populations. The breeding components of evolved canyon oat populations differed significantly among the six populations with the highest content of each indicator, which could be potentially useful.
To investigate the differences in nutrient composition among populations in more depth, the genotypic nutrient composition among populations was studied. Eighteen genotypes from six populations were analysed for nutrient content, and the data were analysed for the five genotypes with the highest mean and the five genotypes with the lowest mean (Figure 1). The results showed that the five genotypes with a higher ash content, Ecg13, Ecg12, Ecg1, Se13, and Se16, were all around 10%, about 1.07% higher than the mean. The ash content of the wild oats Evolution Canyon and Sede Boqer was higher. There was no significant difference in the crude fat content of oats, suggesting that the effect of stock origin on crude fat may be minimal. Nah1, which had the lowest crude protein content, was 7.39% lower than Ecg12. The crude protein content between Be1 and Ecg1 was close, at 11.32% and 11.44%, respectively. The XO-1-3 genotype of oats had a nearly 40% lower soluble sugar content than the highest Se6. Nah10 had 0.89% total phosphorus content, much higher than the average value of 0.43%. XO-1-60 had a lower total potassium content of 2.4%, while Nah2 had the highest total potassium content of 4.15%.

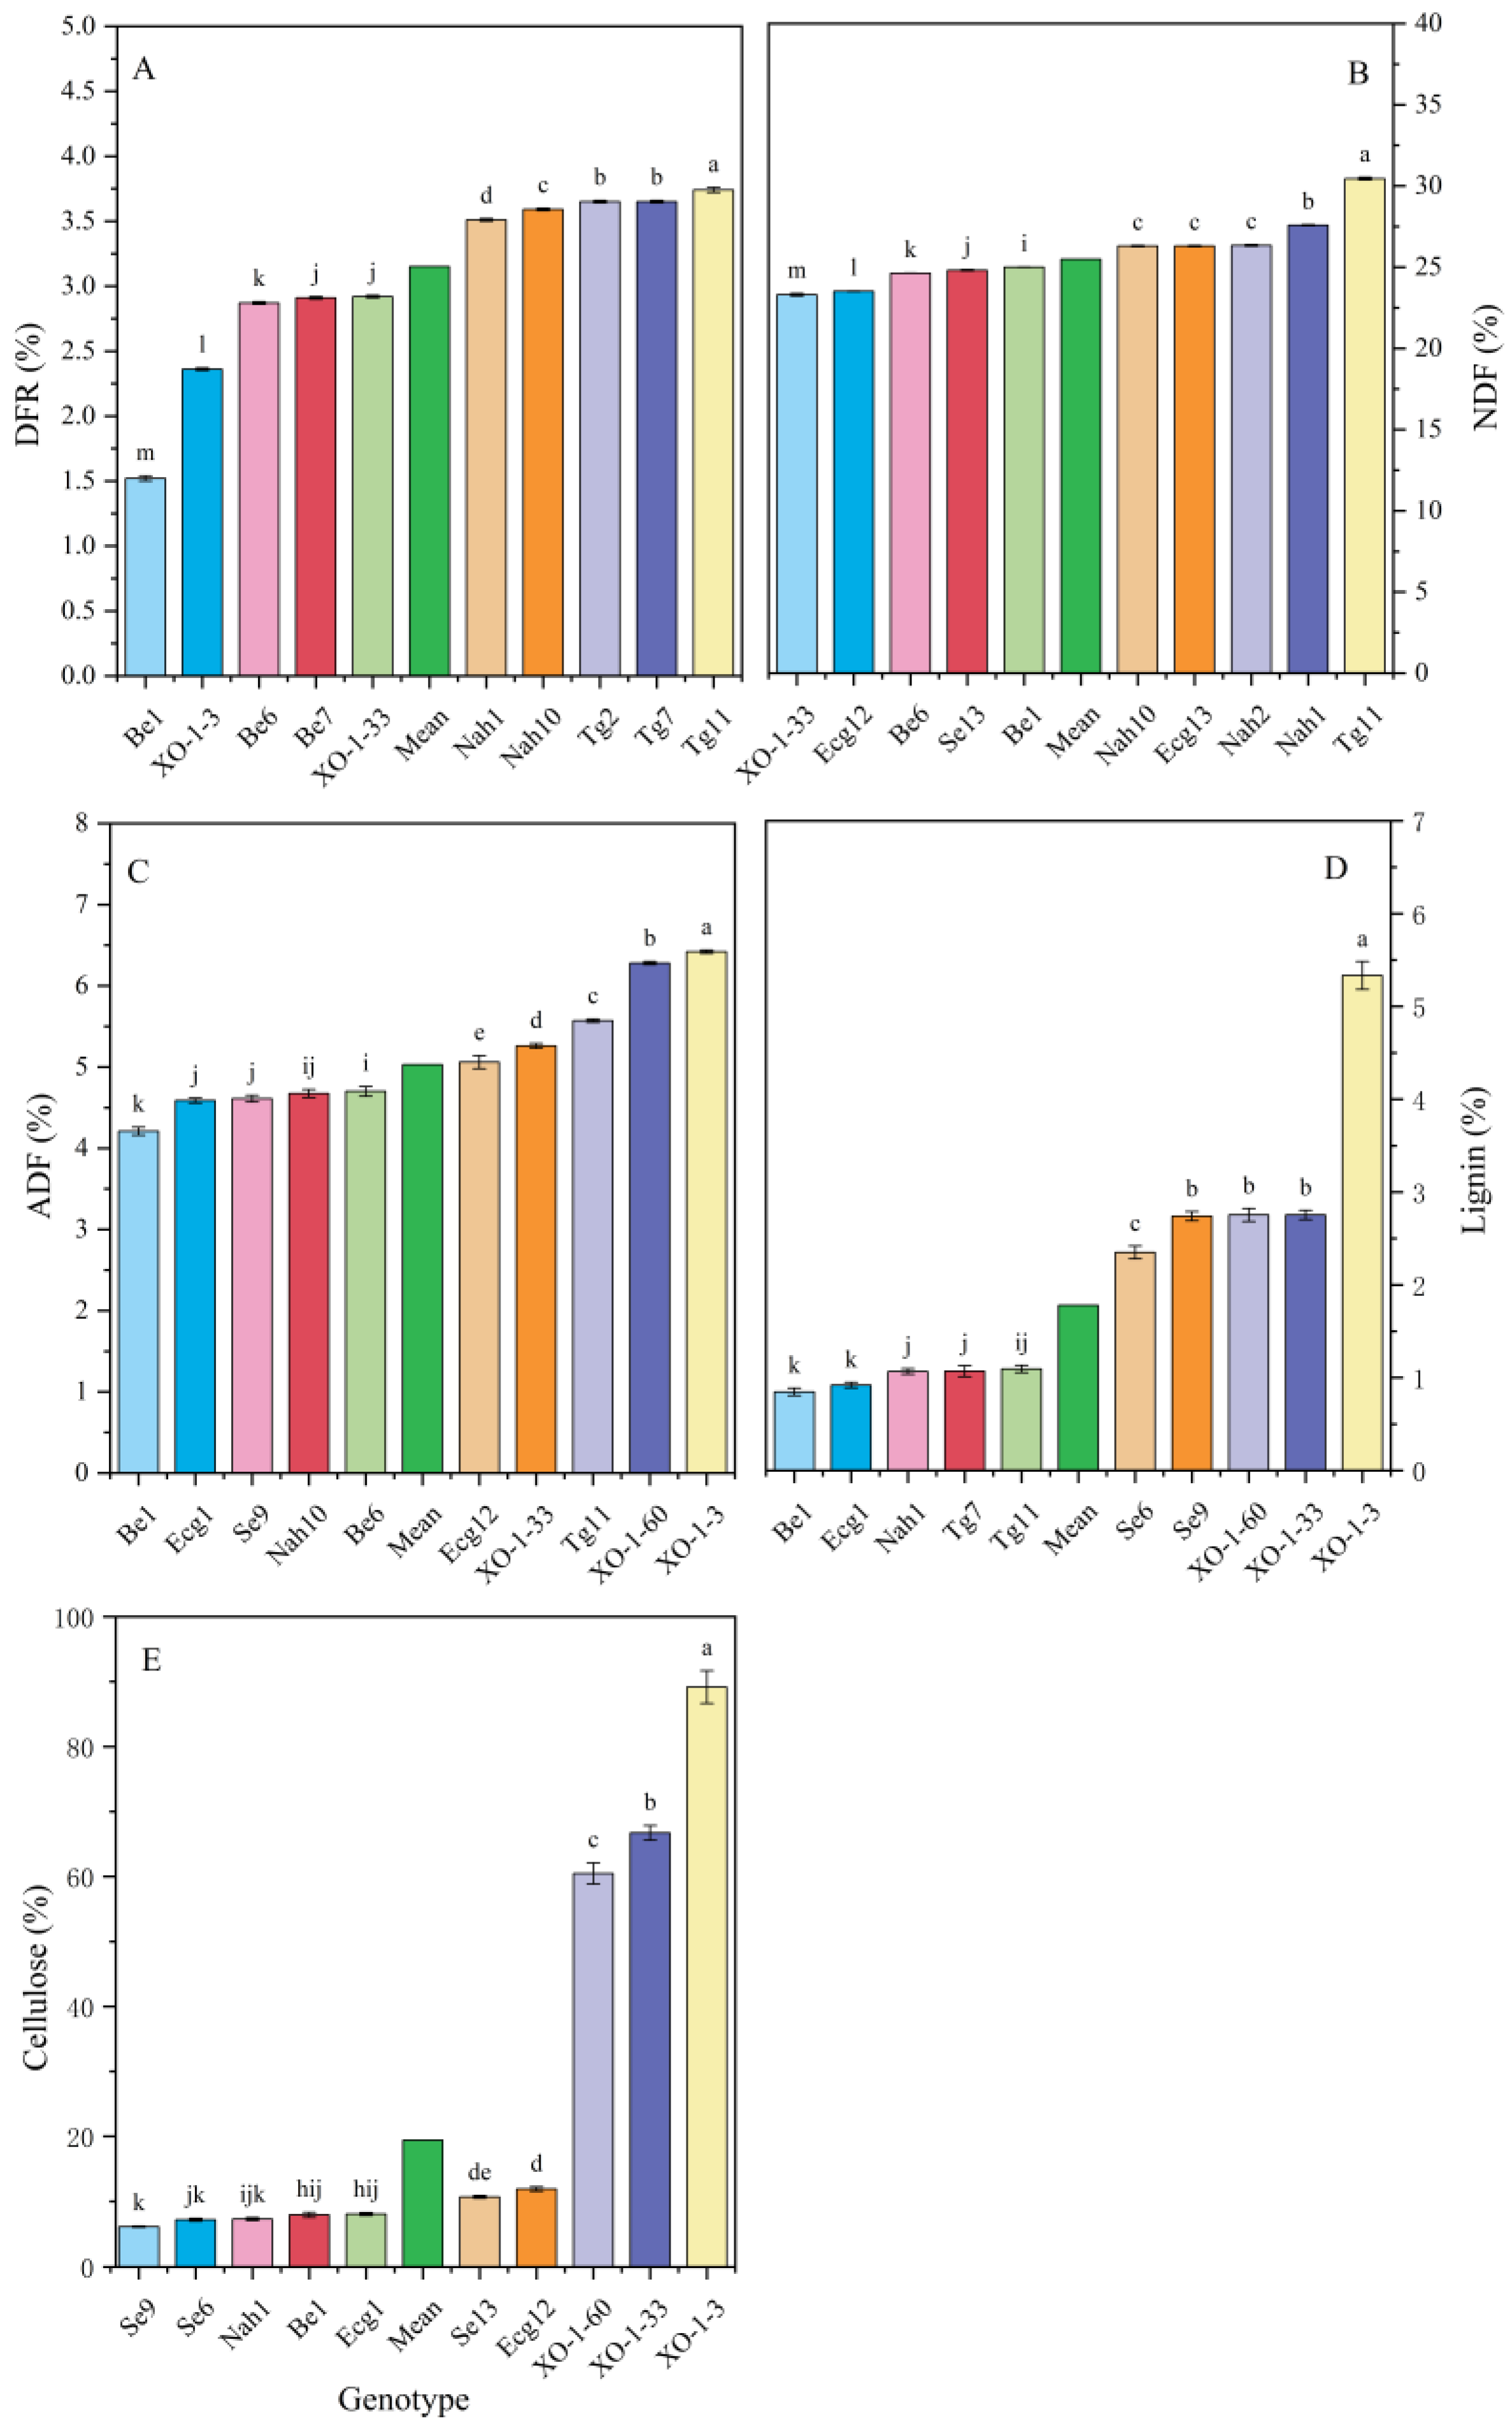
3.2. Feed Value Analysis of Different Oat Populations

The fresh-to-dry ratio, neutral detergent fibre, acid detergent fibre, lignin, and cellulose are five important indicators of oat forage quality. The analysis of forage quality data from six populations of oats (Supplementary Table S2) revealed that. In terms of the first fresh-to-dry ratio, the Tabigha population had a significantly higher fresh-to-dry ratio than the other populations at 4.76% (average data of three years). The difference data of Hu (20.7%) which is the lowest neutral detergent fibre content and the Tabigha (26.61%) with the highest neutral detergent fibre content is 5.91%. The acidic detergent fibre of the artificially cultivated oat population Hu was significantly higher than other wild oat populations in all three years, reaching 5.99%, 29.93%, and 27.39%, respectively. In terms of lignin content, the Evolution Canyon population had the same amount as the Tabigha population at 1.15% in 2018, and Hu had the highest amount in three years at 3.31% (average data). In terms of cellulose content, Hu had a significantly higher content than the other five populations at 71.88% (average data of three years), which was about eight times higher than the lowest content Sede Boqer. It is noteworthy that there was no variability among the Tabigha, Nahef, Sede Boqer, and Evolution Canyon in lignin and cellulose in 2018 and 2019.
The forage quality of the 18 genotypes was analysed (Figure 2) and the results showed that, in terms of moisture, the Se13 genotype had the highest content of 75.28%, while the XO-1-3 genotype had the lowest content of 59.05%. The fresh-to-dry ratio of the Be1 genotype of oats was 1.52%, which was significantly lower than the other 17 genotypes, while the Tg11 genotype had the highest content of 3.74%. In terms of lignin content, the XO-1-3 genotype had the highest content of 5.34%, while the Be1 genotype had the lowest content, with a difference of 4.49% between the two genotypes. The XO-1-3 genotype had the highest cellulose content of 89.15%, and its cellulose content was 4.6 times higher than the mean value; the Se 9, XO-1-3, and XO-1-60 genotypes of lignin content were close to each other, roughly 2.75%. This shows that the oat origin has a greater effect on lignin and cellulose and a smaller effect on other forage quality indicators. The six targets of XO which is planted by a human is the smallest compared with the other populations. The forage value of cultivated oats is the lowest, and wild oats may have great forage potential.

3.3. The Nutritional Content of Oat Populations Correlated with a Place of Origin

Analysis of the oat population and ecogeographical factors revealed (as in Table 3) that nutrients such as crude protein, ash, and soluble sugars were significantly influenced by factors such as origin mile. Among them, crude protein was significantly positively correlated with Hul14, Huan, Tj, and Tm; while it was significantly negatively correlated with Ln, Td, and Tdd. Ash showed a significant positive correlation with Huan, while there was a significant negative correlation with Ev, Ln, Td, and Tdd. Soluble sugars showed significant positive correlations with Hul14, Ta, and Tm, and significant negative correlations with Al, Ln, and Lt. However, it is noteworthy that no significant correlations were observed for crude fat, total phosphorus, and total potassium in oats with factors such as ground mile of origin. The temperature at the origin of the oat population has a large effect on the crude protein, ash, and soluble sugar, after which breeding can control seasonal temperature differences and diurnal temperature differences to enhance the nutrient content.

3.4. Correlation between Feed Value and Place of Origin in Oat Populations

The analysis of oat populations and ecogeographic factors revealed (as in Table 4) that the indicators of lignin, cellulose, acidic detergent fibre, neutral detergent fibre, moisture, and the fresh-to-dry ratio of oat populations may be influenced by geographic environmental factors at the place of origin. Among them, lignin was significantly positively correlated with Ln, Lt, Al, and Td, while it was significantly negatively correlated with Tm, Tj, and Rn. Cellulose was negatively correlated with Tm, Tj, Ev, Rn, Ta, Rd, Hul14, and Huan, and positively correlated with Ln, Lt, Td, and Tdd. The acid detergent fibre was positively correlated with Lt and Al and negatively correlated with Rn and Rd, while the neutral detergent fibre content was significantly influenced by only two geographic environmental factors, Rn and Rd, in a significant positive correlation, and was not significantly related to other influencing factors. In addition, we found that the plant moisture and fresh-to-dry ratio could be influenced by Tm, Ta, Td, and other factors.

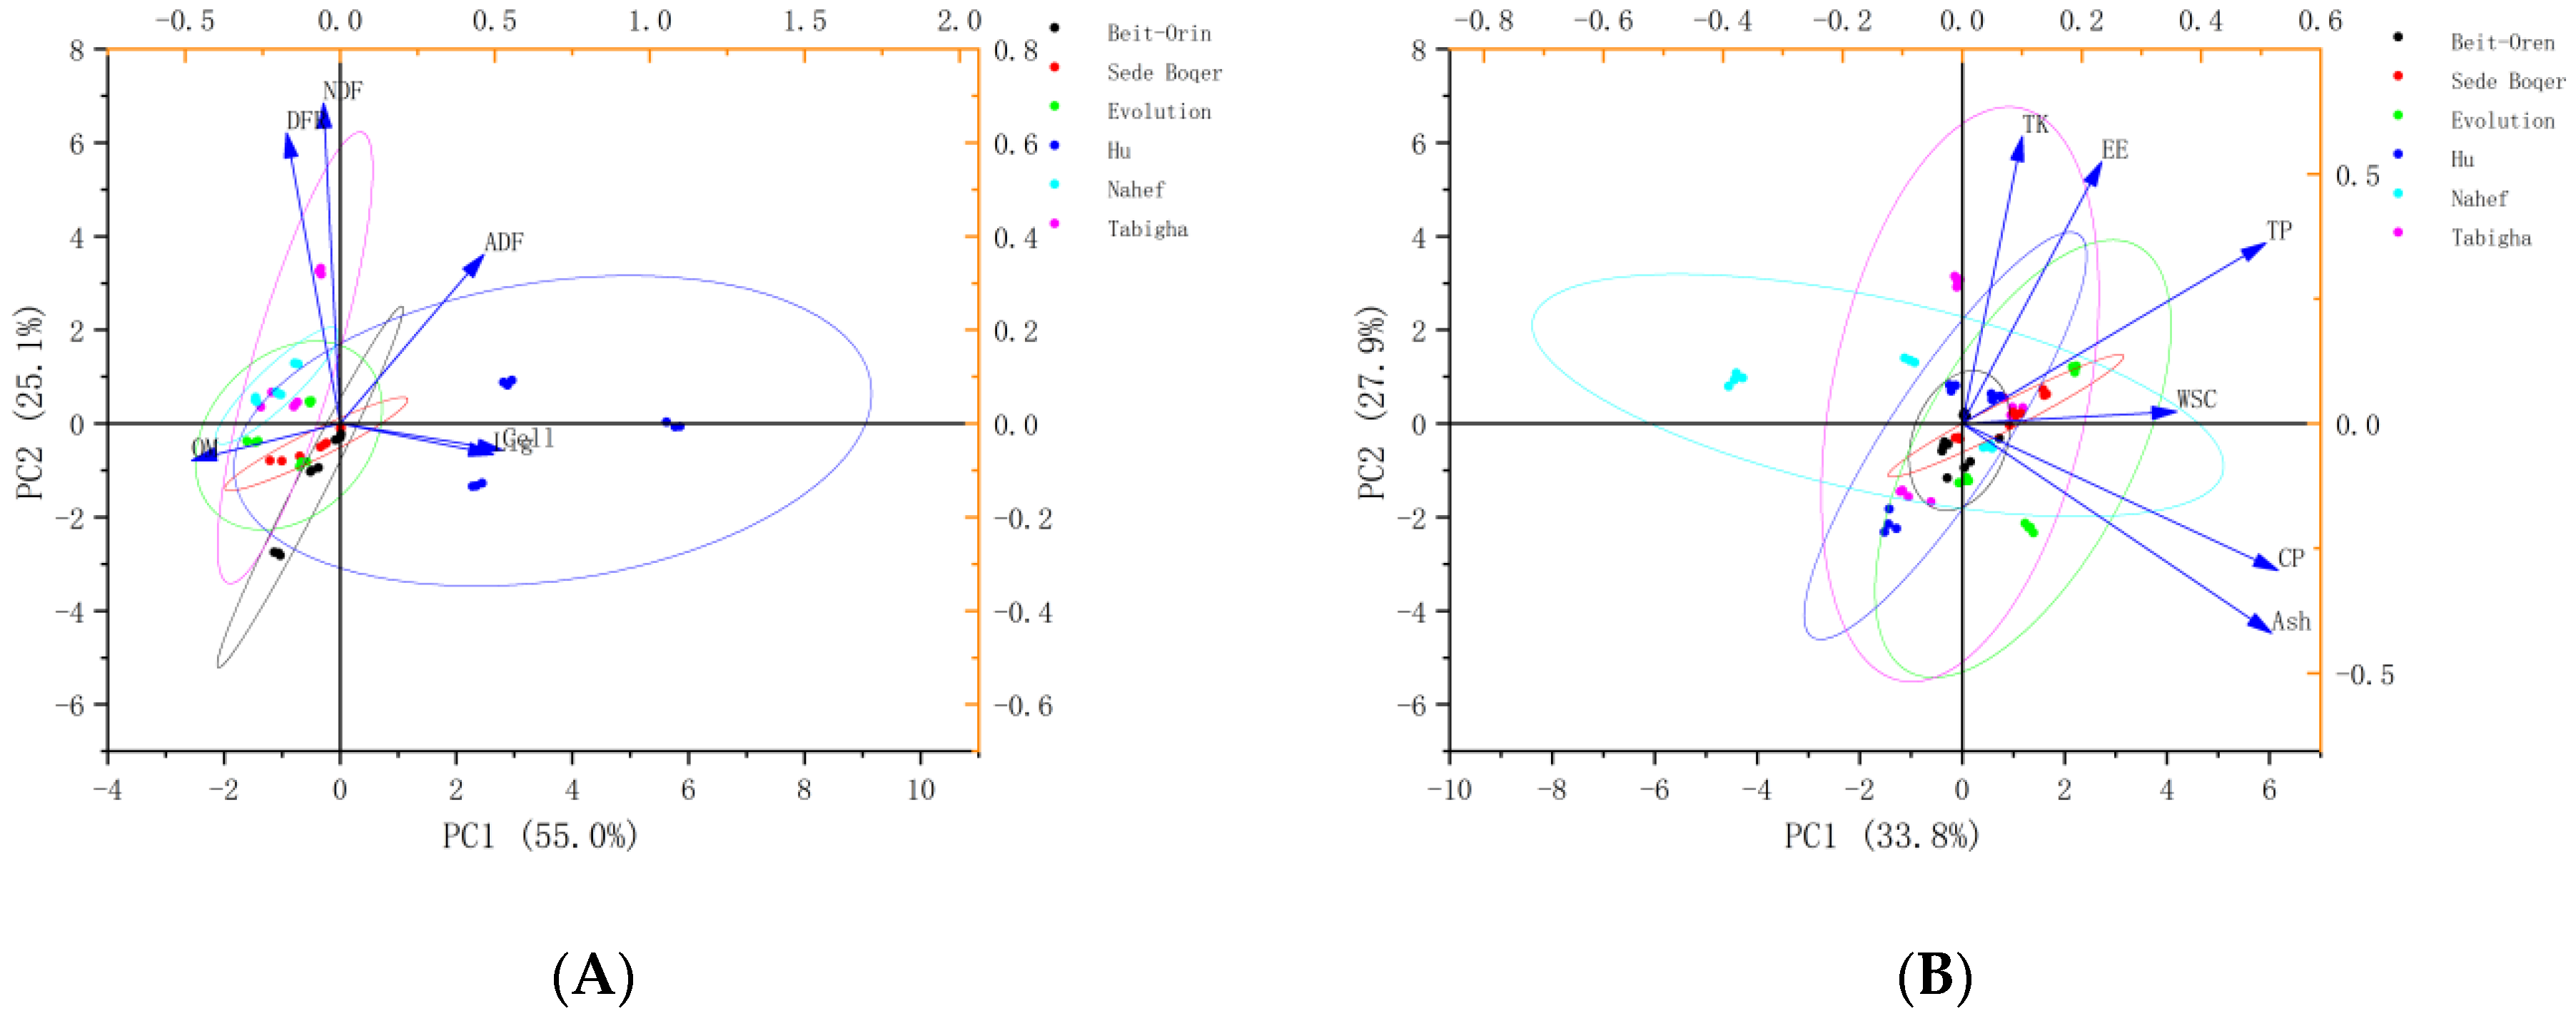
3.5. Principle Component Analysis (PCA)

Principal component analysis (PCA) helps to study the analysis of the nutritional content and forage quality among different populations, to select the best oat population, and to analyse the variability of oat population genes in the nutritional content and forage quality in different origins. Figure 3A shows the PCA of six oat populations in six nutritional content parameters studied, and Figure 3B examines the populations in six forage quality parameters.
In the PCA analysis of feed value, the Hu population was significantly different from the other five populations, with the three genotypes XO-1-3, XO-1-33, and XO-1-60 of the Hu population positively correlated with the variability in component 1 and the remaining five populations negatively correlated. In PC1, the total variability was 55.50% and they were positively correlated with acidic detergent fibre (0.47) and lignin (0.50 and cellulose (0.52) and negatively correlated with primary moisture (−0.48), fresh-to-dry ratio (−0.17), and neutral detergent fibre (−0.05). The PC2 total variability was 25.1% and they were positively correlated with the neutral detergent fibre, acidic detergent fibre, and fresh-to-dry ratio, at 0.36, 0.62, and 0.68, respectively, and negatively correlated with primary moisture (−0.08), lignin (−0.07), and cellulose (−0.06).
From the analysis of the nutritional content, there was no significant variability in forage quality among the five groups except for the Nahef group. The contribution of PC1 and PC2 was 33.75% and 61.63%, respectively, with a total coefficient of variation of 33.8% and PC2 of 27.9%. In PC1, the Evolution population genotype was positively correlated with variability, and the remaining five population genotypes were partly negatively and partly positively correlated. In PC1, there was a positive correlation with the nutritional content in all six oat populations. PC2 was negatively correlated with Ash and CP, −0.42 and −0.29, respectively, but positively correlated with EE (0.52), WSC (0.02), TP (0.36), and TK (0.58).
The forage quality of the cultivated oats Hu and the other five wild oats groups were far apart in Figure 4A, and the five wild oats groups were more similar. Moreover, in the components of PC1, the variability of cultivated oats showed a positive correlation and the variability of wild oats showed a negative correlation. In terms of the nutritional value, Figure 4B, there is little convergence between cultivated and wild oats. The variability of the Nah and Tab groups is greater, and the Hu variability is less. Therefore, the nutritional value of wild oats probably has more potential to be explored. The genetic diversity of the cultivated oat population decreased and was more homogeneous; however, the diversity and coefficient of the variation were richer in the wild.

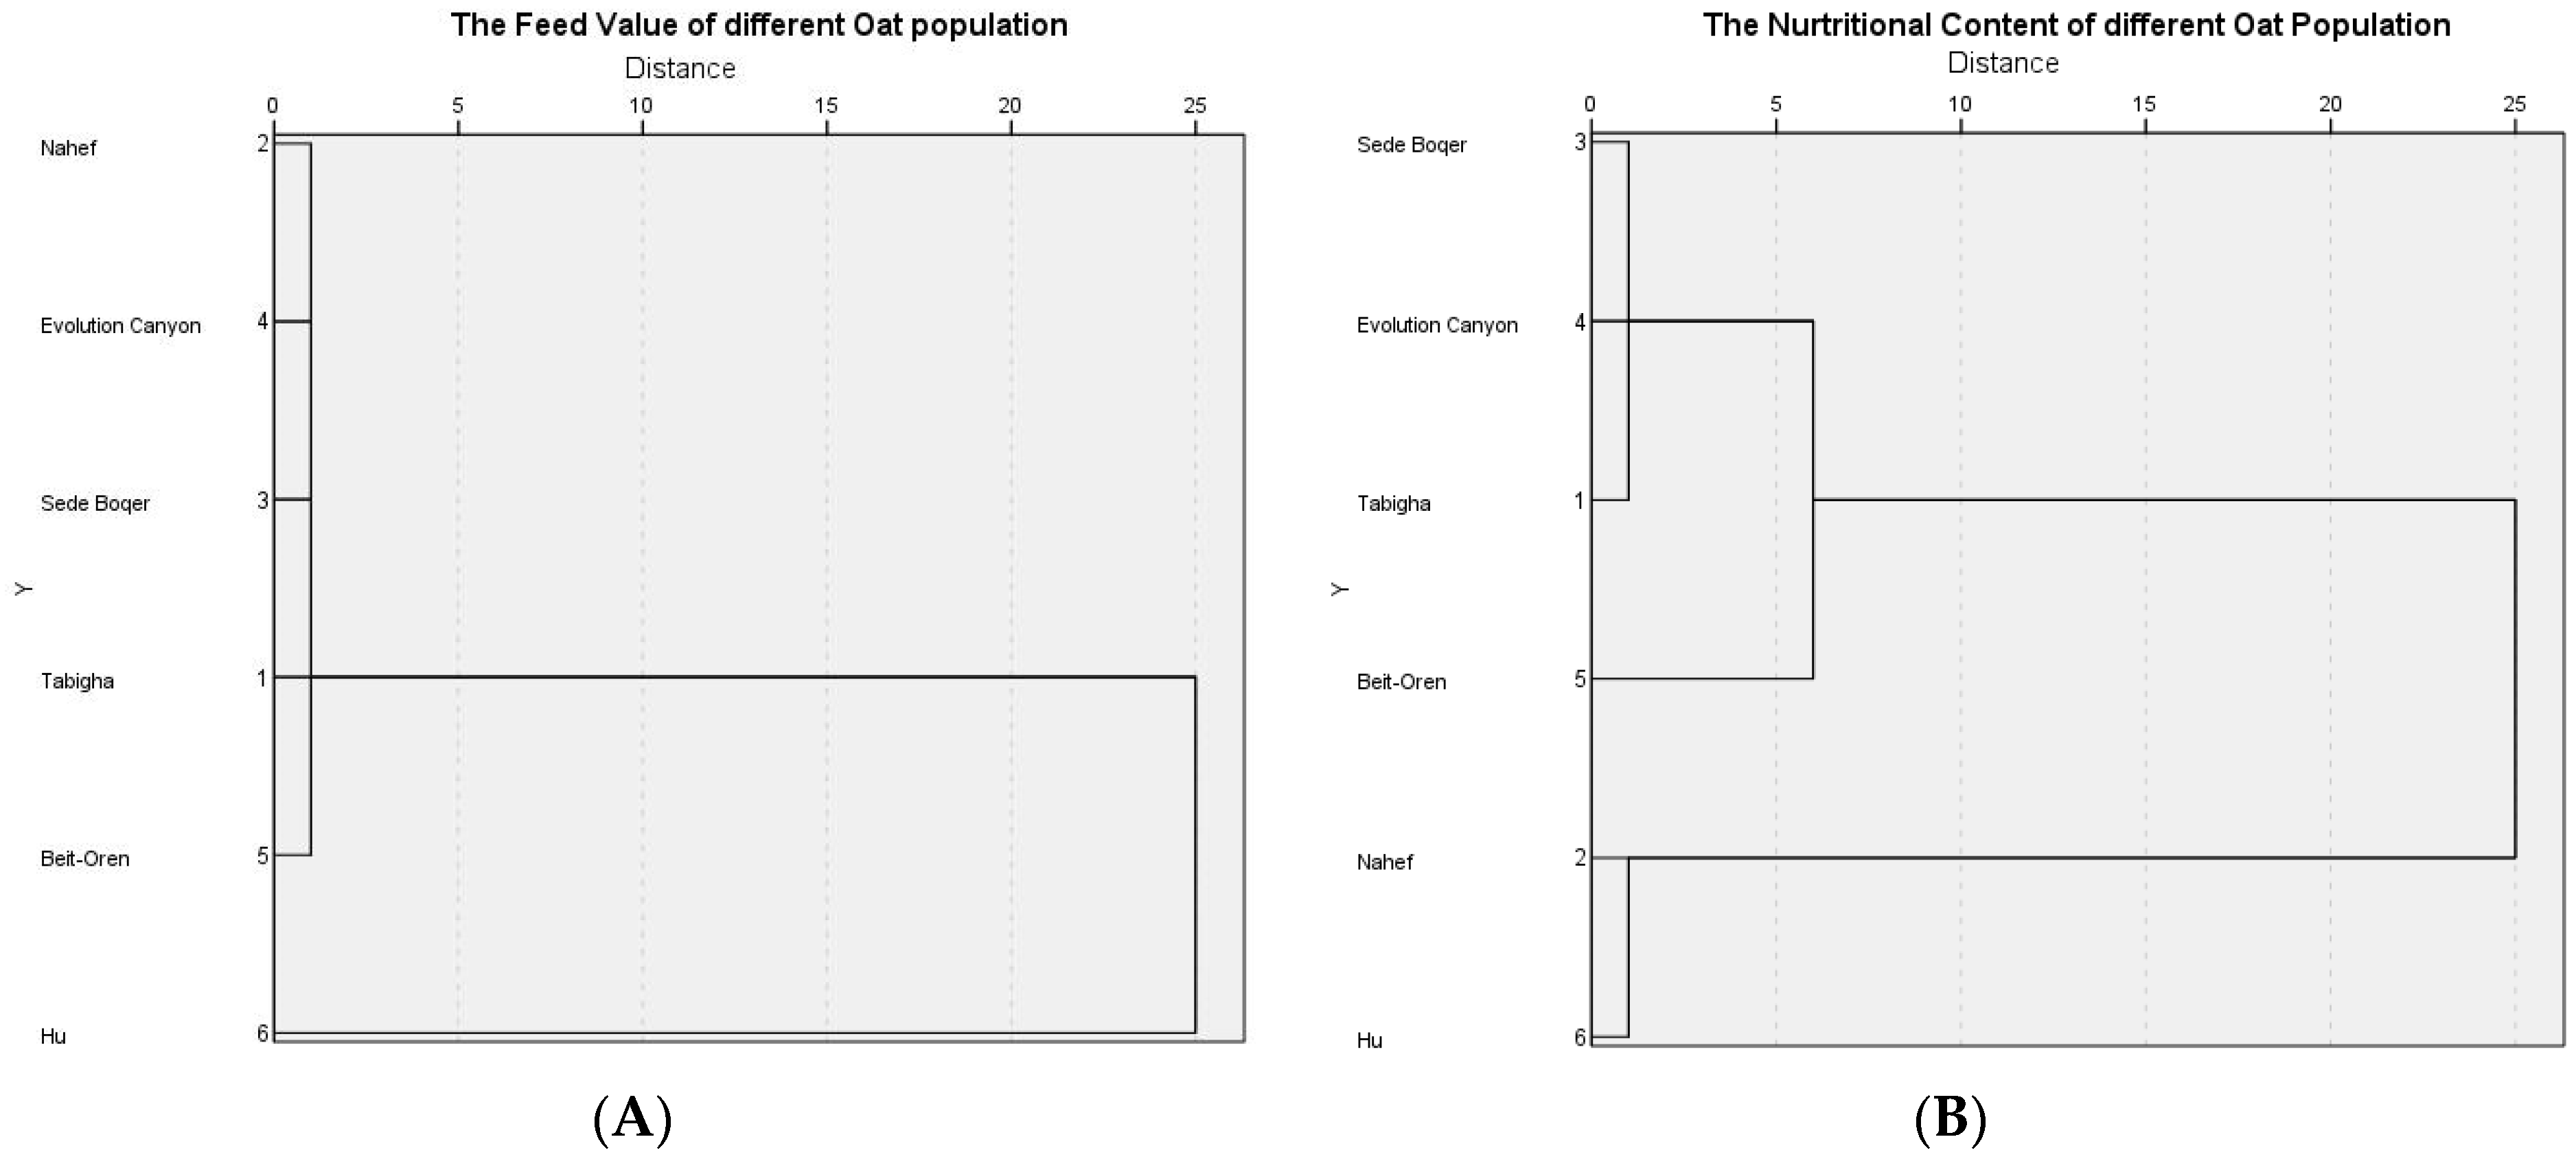
3.6. Cluster Plotting

The Wards method was used in performing the clustering analysis. From the feed value analysis, at a distance of 25%, the six oat populations were divided into two lineages, a Hu population from Zhangjiakou in Hebei, and five populations from Israel (Tabigha, Nahef, Sede Boqer, Evolution Canyon, and Beit-Oren). Within a distance of about 1.00%, they were further subdivided into five sub-clusters. The clustering results of the feeding value of the six groups are very clear, and wild oats have closer relatives and are completely independent of Chinese cultivated oats, which indicates that the feeding value of wild oats is unique.
In terms of nutritional content, there are two line segments at 25% dividing the six oat groups into two parts, one for Nahef and another part with four groups (Sede Boqer, Evolution Canyon, and Beit-Oren). The distance was further subdivided into two subgroups at 6.02%, except for Beit-Oren, where there was variability in the other three groups at very small distances. However, the Hu oat group from China was less differentiated from Nahef at a 1% distance. Therefore, it is speculated that the nutritional structure of the Nahef oat population may be closer to that of cultivated oats, which is consistent with Figure 4.

4. Discussion

Wild oats are an important grass crop that is widely distributed in natural ecosystems around the world. Compared with cultivated oats, wild oats have a higher nutritional quality and forage potential and therefore have received increasing attention [43,44]. In this article, we discussed the higher nutritional quality and forage potential of wild oats in the protein content, crude fat, fibre content, and acid-detergent fibre.
Firstly, wild oats are rich in high-quality protein. A study found that the protein content and quality of wild oats were significantly better than that of cultivated oats. In a study, Australian scientists Harris and Mares found that the protein content of wild oats was higher than that of cultivated oats and that the amino acid composition of wild oats was more complete [45]. Among them, wild oats have a higher content of essential amino acids, such as lysine, tryptophan, and isoleucine. These results indicate that wild oats have higher nutritional quality and can provide better nutritional security for humans. The experimental results of this study showed that the content indexes of various nutrients in the Evolution Canyon oat group from Israel were significantly higher than those in the other five oat groups, indicating that this wild group has a higher nutritional quality and may have potential value in forage utilization. The difference between the Tg11 genotype with the highest total potassium content and the Nah1 genotype with the lowest content was 0.21%, while the difference between the Nah2 genotype with the highest total phosphorus content and the XO-1-60 genotype with the lowest content was 1.77%. The present study further used Spearman’s rank correlation analysis to conclude that the geographical environmental factors of the origin of the oat population had less influence on the nutrient composition of oats, and mainly had a more significant effect on ash, crude protein, and soluble sugars (p < 0.05) Crude protein was significantly positively correlated with Hu14, Huan, Tj, and Tm; while it was significantly negatively correlated with Ln, Td, and Tdd, which is consistent with Liu Wenting et al.’s study [46,47,48,49]. However, there was no significant correlation between the total potassium, total phosphorus, and ecogeographic factors of the place of origin for oats, suggesting that these indicators may be less influenced by the environment.
Secondly, the cellulose content in wild oats is also relatively high. One study found that wild oats had a higher cellulose content than cultivated oats, with a relatively low content of neutral detergent fibre and a higher content of acid detergent fibre. This implies that wild oats are more digestible and can provide better feed value for animals [50,51,52]. In addition, wild oats also contain higher levels of polyphenolic compounds, which are important for the prevention of intestinal diseases and the protection of cardiovascular health [53,54]. In this study, it was found that there were large differences between the forage quality of the oat groups, and the moisture, fresh-to-dry ratio, and neutral detergent fibre contents of the Hu group was significantly lower than those of the other five wild groups, indicating that the five oat groups from Israel had higher forage value. The Hu cellulose content and lignin content were both higher than those of the other groups, at 71.88% and 3.11% (average data of three years), respectively. This suggests that the water use efficiency of wild oats in Israel may be higher. The genotypes with significantly higher cellulose content were all from the Hu population in Zhangjiakou, Hebei, suggesting that cultivated oats may be more “chewy” and less palatable. This study showed that the fibre content of different genotypes differed significantly, so the selection of forage oats for different groups should be carefully screened. The Spearman’s rank significant correlation analysis revealed that several forage quality components were significantly influenced by geographic environmental factors of origin, and the cellulose content was significantly influenced by 12 geographic environmental factors, which were negatively correlated with Tm, Tj, Ev, Rn, Ta, Rd, Hul14, and Huan; and positively correlated with Ln, Lt, Td, and Tdd, which is consistent with the study [55]. In this study, the higher nutritional quality and forage potential of wild oats were investigated in terms of initial moisture, fresh-to-dry ratio, cellulose lignin content, neutral detergent fibre, and acid detergent fibre.
The forage potential of wild oats is also of interest. One study found that wild oats have a higher forage potential than cultivated oats. An Australian study found that wild oats grow faster and can produce high-quality forage in a short period. In addition, the biomass and nutritional value of wild oats were higher than that of cultivated oats [29]. Comparative studies have shown that the dry matter yield and forage dry matter yield of wild oats are about 30% higher than that of cultivated oats [56,57], while wild oats have higher crude protein, neutral detergent fibre, and acid detergent fibre content [58]. In addition, wild oats have other physiological functions and nutritional values. For example, wild oats are rich in a variety of bioactive components, such as polyphenols, alkaloids, and flavonoids, which have various physiological functions such as antioxidant, antitumor, hypoglycaemic, and hypolipidemic [59]. These physiological functions and nutritional values make wild oats a natural resource with wide application value. In this experiment, we found that the differences between different genotypes of wild oats were greater than those of cultivated varieties, and the genetic diversity and population structure of wild oats were richer than those of cultivated ones [60,61,62]. This indicates that wild oats have greater potential for exploration.
In conclusion, wild oats have higher nutritional quality and forage potential compared to cultivated oats. Exploring protein content, amino acid composition, fibre content, and acid detergent fibre, wild oats have a higher protein content, more complete amino acid composition, and higher fibre content, which can provide better feed value for animals. Wild oats also have a variety of physiological functions and nutritional values, so it has a wide range of application prospects in the field of food, medicine, and health products.

5. Conclusions

Hulled oats are mainly grown as a raw material for forage, but most of the leather oats in China are cultivated varieties that lack superior genetic resources. In this experiment, we introduced wild hulled oats with genetic diversity in Israel, and determined the nutrient composition and forage quality indexes of 11 oats, and then carried out a Spearman’s rank correlation of climatic factors and 11 indexes from the place of origin of the population. The results showed that cultivated oats Hu had the lowest soluble sugar content and crude protein content, which were significantly lower than those of the wild oats Tabigha and Evolution Canyon, respectively. The correlation analyses revealed that these two indicators were related to Ev, Huan, Ln, Td, Tdd, and Al, Hu14, Ln, Lt, Ta, and Tm respectively. In terms of forage quality, the population Hu had the lowest neutral detergent fibre content and also the highest lignin content, making wild oats more suitable for forage. Neutral detergent fibre and lignin were analysed to be significantly affected by the origin of Rn, Rd and Ln, Lt, Al, Tm, Tj, Td, and Rn. It is known that wild oats have a higher nutrient content and better forage quality compared to cultivated oats. This study provides important original materials for the development and utilisation of wild hulled oats as forage of the selection in oats breeding.

Supplementary Materials

The following supporting information can be downloaded at: https://www.mdpi.com/article/10.3390/agronomy13102575/s1, Table S1: Analysis of nutritional content of different oat populations; Table S2: Analysis of feed value of different oat populations.

Author Contributions

Conceptualization, J.Z. and Y.F.; methodology, J.Z. and Y.F.; software, X.L.; validation, Y.W. and Y.F.; formal analysis, J.Z.; investigation, Q.Y. and L.Y.; resources, E.N. and J.Y.; data curation, J.Z.; writing—original draft preparation, J.Z.; writing—review and editing, Y.F.; visualization, Y.F. and J.W.; supervision, L.Z.; project administration, Y.F. and L.Z.; funding acquisition, D.X., Y.F. and L.Z. All authors have read and agreed to the published version of the manuscript.

Funding

National Natural Science Foundation of China (31860412), Talent Initiation Funding Project of Chengdu University (2081923007), Open Project Program of Irradiation Preservation Technology Key Laboratory of Sichuan Province, Sichuan Institute of Atomic Energy (FZBC206704), Ministry of Finance and Ministry of Agriculture and Rural Affairs: National Oat Buckwheat Industry Technology System (CARS-07-B-1).

Data Availability Statement

Data are available from the corresponding author on reasonable request.

Acknowledgments

The authors thank Chengdu University for technical assistance and the Institute of Evolution, the University of Haifa for providing oat seed resources, and especially Liang Zou and Yu Fan for their role in facilitating this research. We thank Li Xiaolong, Wang Junzhen, Li Yang, Yang Qiaohui, Xiang Dabing, Wan Yan, Eviatar Nevo, and Yan Jun for their work in the field and laboratory.

Conflicts of Interest

The authors declare no conflict of interest.

References

  1. Masood, S.B.; Tahir-Nadeem, M.; Khan, M.K.; Shabir, R.; Butt, M.S. Oat: Unique among the cereals. J. Eur. J. Nutr. 2008, 47, 68–79. [Google Scholar]
  2. Hoffmann, L.A. World production and use of oats. In The Oat Crop—Production and Utilization; Springer: Dordrecht, The Netherland, 1995; pp. 34–61. [Google Scholar]
  3. Meen Narayan, J.B.R.K. Oat is a multifunctional cereal crop. Innov. Farm. 2017, 2, 114–116. [Google Scholar]
  4. Li, Y.; Mao, P. Progress of research on germplasm resources of oats. Anhui Agric. Sci. 2013, 41, 72–76. [Google Scholar]
  5. Li, Y.; Zhai, Y.; Mu, L. Comparative trials of oat introduction. Inn. Mong. Agric. Sci. Technol. 2010, 6, 30. [Google Scholar]
  6. Xiao, X.; Zhou, Q.; Chen, Y. Effect of seed sowing on the production performance and photosynthetic characteristics of Linnaean oats in alpine grazing areas. Grass Sci. 2017, 34, 761–771. [Google Scholar]
  7. Biel, W.; Kazimierska, K.; Bashutska, U. Nutritional value of wheat, triticale barley, and oat grains. Acta Sci. Pol. Zootech. 2020, 19, 19–28. [Google Scholar] [CrossRef]
  8. Suttle, J.M.; Reynolds, S.G. Fodder Oats: A World Overview; Publishing Management Service: Rome, Italy, 2004. [Google Scholar]
  9. Varma, P.; Bhankharia, H.; Bhatia, S. Oats: A multi-functional grain. J. Clin. Prev. Cardiol. 2016, 5, 9–17. [Google Scholar] [CrossRef]
  10. Wang, S.; Wang, Y.; Schnug, E.; Haneklaus, S.; Fleckenstein, J. Effects of nitrogen and sulphur fertilization on oats yield, quality and digestibility and nitrogen and Sulphur metabolism of sheep in the Inner Mongolia Steppes of China. Nutr. Cycl. Agroecosyst. 2002, 62, 195–202. [Google Scholar] [CrossRef]
  11. Chen, J.Z.; Wang, M.; Chen, L.; Lu, Y.; Wang, Y. Analysis of nutritional composition attributes of oat varieties of different origins. Agric. Prod. Process. 2020, 24, 43–45+48. [Google Scholar]
  12. John, V. Naked oatsin the oat crop. Prod. Util. 1995, 504–532. [Google Scholar] [CrossRef]
  13. Webster, F.H.; Wood, P.J. Oats: Chemistry and technology. J. Cereal Sci. 2011, 53, 10–51. [Google Scholar]
  14. Sojka, R.E.; Lentz, R.D.; Westerman, D.T. Water and erosion man-agement with multiple application of polvacrylamide in furow irriation. Soil Sci. Soc. Am. 1998, 62, 1672–1680. [Google Scholar] [CrossRef]
  15. Sui, H.; Dong, J.; Li, X.; Liu, Q.; Sun, X.; Zheng, S.; Xing, P. Effects of drolght-control and water-retention agent on wheat growth. Tianin Agric. Univ. 2018, 15, 11–13. [Google Scholar]
  16. Xu, C. Comparative study on growth characteristics of different oat varieties in alpine pasture. J. Grass Ind. 2012, 21, 280–285. [Google Scholar]
  17. Enciso, U.Y.; Wiedenteld, B. Subsurface drip irrigation of on-ons: Effects of drip tape emitter spacing on yield and quality. Agric. Water Manag. 2007, 92, 126–130. [Google Scholar] [CrossRef]
  18. Ngouajio, M.; Wang, G.; Goldy, R. Withholding of drip irrigation between transplanting and flowering increases the vield offield-arown tomato under plastic mulch. Agric Water Manag. 2007, 87, 285–291. [Google Scholar] [CrossRef]
  19. Oktem, A.; Simsek, M.; Oktem, A.G. Deficit irrigation efects on sweet corn(Zea mays saccharata Sturt)with drip irigation system ina semi-arid region. Agric. Water Manag. 2003, 61, 63–74. [Google Scholar] [CrossRef]
  20. Wu, N.; Zhao, B. Effect of water retention agent dosage on yield and quality of naked oats under two types of irrigation. J. Crop Sci. 2009, 35, 1552–1557. [Google Scholar]
  21. Li, F.; Song, L. Study on the suitable sowing period of oats in alpine pasture in Qinghai. Grass Sci. 1996, 13, 32–34. [Google Scholar]
  22. Li, S.; An, P.; Wang, F.; Li, X.; Liu, Y. Farmers’ initiative on adaptation to climate change in the Northern Agro-pastoral Ecotone. Int. J. Disaster Risk Reduct. 2015, 12, 278–284. [Google Scholar] [CrossRef]
  23. Ma, X.; Zhao, G.; Gong, J. Effect of sowing date and nitrogen fertilization on growth characteristics of oats in alpine pasture. Grass Sci. 2010, 4, 63–67. [Google Scholar]
  24. Ma, X.; Zhao, G.; Gong, J. Effect of sowing date and nitrogen fertilizer on the components of oat seed yield. Grass Sci. 2010, 27, 88–92. [Google Scholar]
  25. Zhang, Y.; Zhang, L.; Yang, N.; Huth, N.; Wang, E.; van der Werf, W.; Evers, J.B.; Wang, Q.; Zhang, D.; Wang, R.; et al. Optimized sowing time windows mitigate climate risks for oats production under cool semi-arid growing condition. Agric. For. Meteorol. 2019, 266–267, 184–197. [Google Scholar] [CrossRef]
  26. Akhtar, M.; Cheema, M.S.; Jamil, M. Effect of sowing time on wheat wheat genotypes for important traits in wheat. Agric. Res. 2006, 44, 255–259. [Google Scholar]
  27. Costa, R.P.; Pinheirom, N.; Almeida, A.S.; Gomes, C.; Coutinho, J.; Coco, J.; Costa, A.; Macas, B. Effect of sowing date and seeding rate on bread wheat yield and test weight under Mediterranean conditions. J. Food Agric. 2014, 25, 951–961. [Google Scholar]
  28. Du, Y.; Ma, J.; Chang, K. Cultivation techniques for productive naked oats in the southern Ningxia mountains. Inn. Mong. Agric. Sci. Technol. 2008, 12, 103–104. [Google Scholar]
  29. Robertson, M.J.; Holland, J.F.; Bambach, R. Response of canola and Indian mustard to sowing in the grain belt of northeastern Australia. Aust. Exp. Agron. J. 2004, 44, 43–52. [Google Scholar] [CrossRef]
  30. Li, X.; Yang, L.; Zhang, G. Effect of different sowing periods on the production characteristics of oats in “circle nests” in highland family pastures. Grass Sci. 2001, 18, 14–17. [Google Scholar]
  31. Zhang, G.; Li, X.; Ma, Z. Study on the effect of sowing period and sowing density on the yield of oats in the “circle nest”. Grass Sci. 2002, 19, 21–24. [Google Scholar]
  32. Zhou, L.; Wang, L.; Zhao, B.; Mi, J.; Wang, F.; Liu, J.; Zhang, D.; Liu, Y.-K. Effects of different sowing and mowing periods on yield and quality of oat forage in the northern agro-pastoral interlacing area. Grass Sci. 2021, 29, 2363–2365. [Google Scholar]
  33. Loskutov, I.G.; Shelenga, T.; Konarev, A.V.; Shavarda, A.; Blinova, E.V.; Dzubenko, N.I. The metabolomic approach to the comparative analysis of wild and cultivated speries of oats (Avena L.). Russ. J. Genet. Appl. Res. 2017, 12, 501–508. [Google Scholar] [CrossRef]
  34. Welch, R.W.; Leggett, J.M. Nitrogen content, oil content and oil composition of oat Cultivars (A. sativa) and wild avian species in relation to nitrogen fertility yield and partitioning of assimilates. J. Cereal Sci. 1997, 26, 321–328. [Google Scholar] [CrossRef]
  35. Xu, X.; Luo, J.; Wang, M.; Yu, L.; Liu, S.; Cheng, X.; Zhao, G.; Yan, J. Analysis of wild oats forage value and ecogeographic factors of origin in Israel. Feed Res. 2020, 43, 102–106. [Google Scholar]
  36. Zheng, D.; Zhang, Z. Foreign introduction and utilization of oat germplasm resources in China. J. Plant Genet. Resour. 2017, 18, 1001–1005. [Google Scholar]
  37. Li, Y.; Zhang, L. Feed Analysis and Feed Quality Testing Technology; China Agricultural University Press: Beijing, China, 2016. [Google Scholar]
  38. Yuan, C.; Hee, X.; Ma, L. Research progress of phytic acid and its detection method. Food Ind. 2021, 42, 396–400. [Google Scholar]
  39. Rohweder, D.A.; Barnes, R.F.; Proposed, J.N. Hay grading standards based on laboratory analyses for evaluating quality. J. Anim. Sci. 1978, 47, 747–759. [Google Scholar] [CrossRef]
  40. Zhong, G. Determination of inorganic and organic phosphorus in feedstuffs. Feed Ind. 2003, 7, 33–34. [Google Scholar]
  41. Zheng, M.; Li, Y.; Liang, X.Z. Grey correlation analysis and comprehensive evaluation of introduced alfalfa varieties in northern Jinjiang. Grass Sci. 2017, 22, 631–637. [Google Scholar]
  42. Zhu, H.; Wang, L.; Lin, Y. Research on the production performance and feeding value of foreign forage sorghum varieties in Ningxia Yellow Irrigation Region. Chin. J. Grassl. 2019, 41, 40–46. [Google Scholar]
  43. Nevo, E.; Beiles, A.; Gutterman, Y.; Storch, N.; Kaplan, D. Genetic resources of wildcereals in lsrael and the vicinity: Phenotypic variation within andbetween populations of wid barley Hordeum spontaneum. Euphvtica 1984, 33, 737–756. [Google Scholar] [CrossRef]
  44. Turpeinen, T.; Tenhola, T.; Manninen, O.; Nevo, E.; Nissilä, E. Manninen Microsatellite diversity associated with ecological factors in Hordeum spontaneum populations in lsrael. Mol. Ecol. 2001, 10, 1577–1591. [Google Scholar] [CrossRef]
  45. Harris, P.J.; Mares, D.J. The content and composition of the protein of oats and barley. J. Sci. Food Agric. 1974, 25. [Google Scholar]
  46. Gao, X.; Tian, Z. Effect of different N and K fertilizer ratios on yield and quality of oats. Qinghai Agric. For. Technol. 2015, 4, 5–8. [Google Scholar]
  47. Liu, W.; Yang, C.; Zhang, X.; Bai, J.; Yang, X.; Li, T.; Zhou, H. Nutritional quality and correlation analysis of oat in different regions of China. Quat. Res. 2019, 12, 151–155. [Google Scholar]
  48. Peterson, D. Oat: A Mulifunctional Grainlal. Biology 2004, 51, 21–26. [Google Scholar]
  49. Peltonen-Sainio, P.; Kontturi, M.; Rajala, A. Impact dehuling oat grain to improve quality of on-farm produced feed: 1. Hullability and associated changes in nutritive value and energy content. Agric. Food Sci. 2004, 13, 18–28. [Google Scholar] [CrossRef]
  50. Shi, J.; Xue, Y.; Guo, W.; Yu, S.; Lu, W.; Yu, L. Evaluation of forage yield and nutritional value of introduced oat germplasm resources. J. Triticeae Crop. 2019, 39, 1063–1071. [Google Scholar]
  51. Zhang, G.Y.; Wang, J.; Zhang, H. Comparative study on production performance and nutritional quality of eight importeooat varieties in the Shioatse redion of Tibet. China Pratacult. Sci. 2019, 36, 1117–1125. [Google Scholar]
  52. Zheng, X.; We, Z.; Wu, Z.N. Adaptability evaluation of different Avena sativa varieties in the Yangzhou Area. Grass Sci. 2013, 21, 272–279. [Google Scholar]
  53. Demirbas, A. β-Glucan and mineral nutrient contents of cereals grown in Turkey. Food Chem. 2005, 90, 773–777. [Google Scholar] [CrossRef]
  54. Martínez, M.F.; Arelovich, H.M.; Wehrhahne, L.N. Grain yield, nutrient content and lipid profile of oat genotypes grown in a semiarid environment. Field Crop. Res. 2010, 116, 92–100. [Google Scholar] [CrossRef]
  55. Zhang, Y.; Chen, Z.; Zhang, X.; Song, S.; Yang, Z.; Yang, Y. Effect of different mowing periods on hay yield and quality of spring and autumn sown oats. Grass Sci. 2016, 25, 124–135. [Google Scholar]
  56. Kaur, A.; Goyal, M.; Kaur, M.; Mahal, A.K. Interactive effect of planting dates and development stages on digestibility, qualitative traits and yield of forage oat (Avena sativa L.) genotype. Cereal Res. Commun. 2022, 50, 1237–1247. [Google Scholar] [CrossRef]
  57. Buttar, P.S.; Kingra, P.K.; Singh, S.P. Effect of sowing dates, irrigation, and mulching on growth and yield of wheat. J. Agric. Res. 2018, 55, 243–250. [Google Scholar] [CrossRef]
  58. Bhatta, R.; Shinde, A.K.; Vaithiyanathan, S.; Ravindra, J.P.; Singh, D. In vitro ruminal fermentation and in sacco evaluation of tropical feedstuffs: I. Forage biomass and tree leaves. Anim. Feed Sci. Technol. 2003, 109, 173–187. [Google Scholar]
  59. Qin, X.; Li, Y.; Li, L.; Zhang, Y.; Song, Y.; Shi, X. The comparison of the phytochemical profiles and antioxidant activities of different parts of oats. J. Food Sci. Technol. 2019, 56, 4738–4747. [Google Scholar]
  60. Montilla-Bascón, J.S.-M.; Rispail, N.; Rubiales, D.; Mur, L.; Langdon, T.; Griffiths, I.; Howarth, C.; Prats, E. Genetic Diversity and Population Structure among Oat Cultivars and Landraces. Plant Mol. Biol. Rep. 2013, 31, 1305–1314. [Google Scholar] [CrossRef]
  61. Kshitiz Pokhrel, L.K.; Pazderů, K.; Capouchova, I.; Bozik, M. Lipid content and fatty acid profile of various European and Canadian hulled and naked oat genotypes. J. Cereal Sci. 2022, 108, 103580. [Google Scholar] [CrossRef]
  62. Ihsan, M.; Nisar, M.; Nazir, N.; Zahoor, M.; Khalil, A.A.K.; Ghafoor, A.; Khan, A.; Mothana, R.A.; Ullah, R.; Ahmad, N. Genetic diversity in nutritional composition of oat (Avena sativa L.) germplasm reported from Pakistan. Saudi J. Biol. Sci. 2022, 29, 1487–1500. [Google Scholar] [CrossRef] [PubMed]
Figure 1. Average nutrient contents in 3 years of different genotypes of oat. Note: higher 5 genotypes, lower 5 genotypes ash content and 18 genotype means (A); higher 5 genotypes, lower 5 genotypes crude fat content and 18 genotype means (B); higher 5 genotypes, lower 5 genotypes crude protein content and 18 genotype means (C); higher 5 genotypes, lower 5 genotypes water soluble carbohydrates and 18 genotype means (D); higher 5 genotypes, lower 5 genotypes total phosphorus and 18 genotype means (E) and higher 5 genotypes, lower 5 genotypes total kalium and 18 genotype means (F). Different letters indicate significant differences at p < 0.05.
Agronomy 13 02575 g001
Figure 2. Average data of feed value in 3 years of different oat genotypes. Note: higher 5 genotypes, lower 5 genotypes dry fresh ratio and 18 genotype means (A); higher 5 genotypes, lower 5 genotypes neutral detergent fibre content and 18 genotype means (B); higher 5 genotypes, lower 5 genotypes acid detergent fibre content and 18 genotype means (C); higher 5 genotypes, lower 5 genotypes lignin content and 18 genotype means (D) and higher 5 genotypes, lower 5 genotypes cellulose content and 18 genotype means (E). Different letters indicate significant differences at p < 0.05.
Agronomy 13 02575 g002
Figure 3. Principle component analysis (PCA). PCA of feed value (A) and PCA of nutritional content (B).
Agronomy 13 02575 g003
Figure 4. Cluster plotting of different communication. Feed value of the different oat population (A) and nutritional content of different oat population (B).
Agronomy 13 02575 g004
Table 1. Oat material and its origin.
PopulationTypePlace of OriginGenotypes
TabighaWild oatsIsraeliTg2
Tg7
Tg11
NahefWild oatsIsraeliNah1
Nah2
Nah10
Sede BoqerWild oatsIsraeliSe6
Se9
Se13
Evolution CanyonWild oatsIsraeliEcg1
Ecg12
Ecg13
Beit-OrenWild oatsIsraeliBe1
Be6
Be7
HuCultivated oatsHebei, ChinaXO-1-3
XO-1-33
XO-1-60
Table 2. Ecogeographic data on the origin of the six oats.
PopulationLn/°Lt/°Al/mTm/°CTa/°CTj/°CTd/°CTdd/°CEv/mmRn/mmRd/dHu14/%Huan/%
Tabigha35.532.90.023.631.914.317.410.3164.0437.049.043.858.2
Nahef35.332.9275.015.323.58.315.78.9156.4662.053.050.062.1
Sede Boqer34.932.510.020.125.913.413.58.9132.0539.045.066.272.3
Evolution Canyon34.632.490.022.727.214.113.29.2144.0602.050.265.965.4
Beit-Oren35.032.750.020.226.212.713.09.0133.0507.048.265.572.5
Hu114.540.51300.09.223.3−8.231.214.218.731.96.413.015.2
Note: Ln: longitude; Lt: latitude; Al: Beit-Orenude; Tm: three-year annual mean temperature; Ta: three-year August mean temperature; Tj: three-year January mean temperature; Td: three-year seasonal temperature difference; Tdd: three-year diurnal temperature difference; Ev: three-year annual evaporation; Rn: three-year annual rainfall; Rd: three-year annual number of days of rainfall; Hu14%: three-year 14:00 mean fitness; Huan: three-year annual mean humidity, same below.
Table 3. Significant Spearman’s rank correlation between nutritional content and ecogeographic factors in oat populations.
Nutrient ContentGeographical
Environmental Factors
RelevanceProb > |ρ|
CPHu140.49650.0001
Huan0.39830.0029
Ln−0.50030.0001
Td−0.44650.0007
Tdd−0.37260.0055
Tj0.27410.0449
Tm0.28320.0380
AshEv−0.34170.0115
Huan0.31660.0197
Ln−0.50340.0001
Td−0.34490.0106
Tdd−0.34380.0109
WSCAl−0.42270.0015
Hu140.27000.0483
Ln−0.27870.0413
Lt−0.35580.0083
Ta0.48930.0002
Tm0.49160.0002
Note: Ln: longitude; Lt: latitude; Al: Beit-Orenude; Tm: three-year annual mean temperature; Ta: three-year August mean temperature; Tj: three-year January mean temperature; Td: three-year seasonal temperature difference; Tdd: three-year diurnal temperature difference; Ev: three-year annual evaporation; Rn: three-year annual rainfall; Rd: three-year annual number of days of rainfall; Hu14%: three-year 14:00 mean fitness; Huan: three-year annual mean humidity, same below.
Table 4. Significant Spearman’s rank correlation between feed value and ecogeographic factors in oat populations.
Feed IndexesGeographical
Environmental Factors
RelevanceProb > |ρ|
LigninLn0.29850.0283
Lt0.31720.0194
Al0.29960.0278
Tm−0.49480.0001
Tj−0.32050.0182
Td0.2850.0367
Rn−0.3820.0044
CelluloseLn0.37050.0058
Lt0.39460.0032
Tm−0.47830.0003
Tj−0.32460.0166
Td0.41290.0019
Tdd0.49790.0001
Ev−0.37780.0049
Rn−0.33080.0146
Ta−0.45440.0006
Rd−0.26980.0485
Hu14−0.41590.0018
Huan−0.46750.0004
DFRTm0.43330.0011
Ta0.39940.0028
Tj0.28710.0353
Td0.36720.0063
Rd0.45660.0005
Huan−0.4020.0026
ADFLt0.5010.0001
Al0.38630.0039
Rn−0.39910.0028
Rd−0.27240.0463
NDFRn0.28070.0398
Rd0.42340.0014
Note: Ln: longitude; Lt: latitude; Al: Beit-Orenude; Tm: three-year annual mean temperature; Ta: three-year August mean temperature; Tj: three-year January mean temperature; Td: three-year seasonal temperature difference; Tdd: three-year diurnal temperature difference; Ev: three-year annual evaporation; Rn: three-year annual rainfall; Rd: three-year annual number of days of rainfall; Hu14%: three-year 14:00 mean fitness; Huan: three-year annual mean humidity, same below.
Disclaimer/Publisher’s Note: The statements, opinions and data contained in all publications are solely those of the individual author(s) and contributor(s) and not of MDPI and/or the editor(s). MDPI and/or the editor(s) disclaim responsibility for any injury to people or property resulting from any ideas, methods, instructions or products referred to in the content.

