Article

Increasing Soil Organic Carbon for Higher Wheat Yield and Nitrogen Productivity

1
National Engineering Laboratory of Wheat and Maize, Maize Research Institute, Shandong Academy of Agricultural Sciences, Jinan 250100, China
2
Center for Resources, Environment and Food Security, China Agricultural University, Beijing 100193, China
3
Key Laboratory of Ecosystem Network Observation and Modeling, Institute of Geographic Sciences and Natural Resources Research, Chinese Academy of Sciences, Beijing 100101, China
4
Cultivated Land Quality Monitoring and Protection Center, Ministry of Agriculture and Rural Affairs, Beijing 100125, China
5
Agricultural and Rural Bureau of Huimin County, Binzhou 251700, China
*
Author to whom correspondence should be addressed.
Agronomy 2023, 13(1), 198; https://doi.org/10.3390/agronomy13010198
Submission received: 11 December 2022 / Revised: 5 January 2023 / Accepted: 6 January 2023 / Published: 9 January 2023
(This article belongs to the Section Soil and Plant Nutrition)

Abstract

:
Improving soil organic carbon (SOC) has been considered as a “win-win way” for ensuring high crop productivity and mitigating chemical N input. Improving SOC can achieve higher wheat yield and simultaneously improve nitrogen (N) productivity (defined as kg grain produced per kg total N input from both indigenous and applied N). Two treatments were tested for improving SOC level. The manure treatment involved applying manure for 6 successive years, and the EM treatment involved adding peat and vermiculite once, both combined with optimized in-season N management. The performance of these two systems were compared with a traditional farming system (Control, where only straw was returned each season). N fertilizer input under all three treatments was optimized by in-season N management and was increased by 90.1% and 48.1% under EM and Manure treatments, respectively, as compared with Control. The average wheat yield for the EM and Manure treatments was 9.1 and 9.2 Mg ha–1, respectively, across all three years, which was 18.8% and 19.7% higher, respectively, than that of the Control treatment (7.7 Mg ha–1). The average chemical N application rates for the EM and Manure treatments were 139 and 146 kg ha–1, which were 24.9% and 21.1% lower than those of the Control treatment, respectively. The N productivity was 15.1% and 14.9% which was higher under Manure and EM treatments than that of the Control treatment. The high yield and N productivity were attributed to improved aboveground dry matter and N uptake by wheat, with optimal soil N supply of the root zone. The higher stem number and weight seen in individual plants with increasing SOC resulted in larger spikes and grains at harvest. Our results determined that increasing SOC combined with optimal N management achieve low chemical N input and higher grain yield by increasing productive stems and grains per spike for improving wheat individual growth.

1. Introduction

Sustainable agricultural development is required to address environmental challenges while also meeting the growing food demand via higher crop yields [1,2,3]. To achieve this, it is essential to improve soil quality by increasing the soil organic carbon (SOC) content [4]. Current evidence shows that SOC content is positively correlated with crop yield and nitrogen (N) productivity (kg grain produced per kg N applied) [5]. However, the average SOC content of topsoil in cropping systems in the North China Plain is 8.7 g kg–1 [6], which is substantially lower than that of European (21.8–25.1 g kg–1) [7] and American (20.8–28.1 g kg–1) systems [8]. Previous long-term studies reported that increasing SOC content increased crop yield [4,9], but increasing SOC requires a long processing time and the use of SOC improvement strategies. However, improving SOC content via appropriate and sustainable management strategies is a priority for sustainably feeding the large Chinese population.
Winter wheat covers an area of 23.6 million ha in China, accounting for 23.5% of all land cultivated for cereal crops in 2021 [10]. Targeting three yield components (spike number, grain number per spike, and grain weight) is essential to achieve high wheat yields [11]. Most previous studies have shown that wheat yield is more sink-limited than source-limited [12], and a reduction in yield associated with an inadequate spike number cannot be compensated for by increasing other yield components [13]. Recent research indicates that increasing spike number leads to improved early initiated productive tiller growth and increased tiller productive percentage, and not just the total tiller number [14,15]. We hypothesized that increasing SOC would improve wheat population structure and enhance tiller quantity and quality, particularly in the early tiller growth stage, resulting in increasing wheat yield.
Optimizing N management is crucial to improve N productivity in the context of the over-fertilization seen currently in Chinese agricultural practices. Improvements in N productivity can occur when carbon (C) sequestration is coupled with increased crop yields via the adoption of practices that reduce yield losses due to abiotic and biotic stressors and improve N productivity [16]. In general, an increase in SOC decomposition results in a greater indigenous supply of plant-available N and a reduced requirement for N fertilizer [17]. However, in practice, most Chinese farmers believe that adding C substrates (e.g., returning straw) to the soil promotes the transformation of mineral nitrogen (Nmin) into soil organic N and increases the rate of N depletion from the soil, resulting in a higher N fertilizer requirement [18].
In previous studies, an in-season N management (INM) strategy was developed for intensive wheat production [19,20]. The N rate of each fertilizer application using this strategy was obtained by the difference between the target N value and the soil nitrate-N content in the root zone for each crop growth period [21,22]. The results demonstrate that, with the INM, N fertilizer use was reduced by 61% compared to the farmers’ usual practice without sacrificing crop yield [23]. The objectives of this study were to (i) evaluate whether wheat yield and N productivity increased with treatments that improved SOC and (ii) identify the impact of SOC on physiological mechanisms and yield components.

2. Materials and Methods

2.1. Site Description

Field experiments were established in 2014 at Quzhou Experimental Station, Hebei Province in the center of the North China Plain (36°51′51.9″ N, 115°00′38.0″ E). The climate for this region is characterized as a typical temperate continental monsoon with an average annual precipitation of 500 mm and an average annual temperature of 13.2 °C. The weather data collected during the experiment are shown in Figure 1 (data provided by the China Meteorological Data Network). The field experiment was conducted under winter wheat (Triticum aestivum L.)–summer maize (Zea mays L.) rotation. Winter wheat was sown in early October after harvesting the summer maize crop. Summer maize was planted in mid-June after the winter wheat harvest. The winter wheat cultivar was “Liangxing 99”. The soil was classified as calcareous Fluvo-aquic, loam texture with 56% sand, 16% silt, and 28% clay.

2.2. Experimental Design

Three treatments were established in a randomized complete block design with four replicates. The Control treatment involved only the return of in situ straw to the field which corresponded to the local framer’s practice. The Manure treatment applied 12 Mg ha–1 of air-dried composted cattle manure (water content 50–55%, organic matter content of 35.2 g kg−1, total N content of 14.5 g kg−1, Olsen P content of 11.8 g kg−1, and NH4OAc-K content of 11.8 g kg−1). The manure was broadcasted manually twice per year (for winter wheat and summer maize) since 2011. The third treatment was the EM treatment, in which 129 Mg ha–1 peat (organic matter content of 54.1g kg−1, total N content of 14.8 g kg−1, Olsen P content of 0.15 g kg−1, NH4OAc-K content of 0.13 g kg−1) and 129 Mg ha−1 vermiculite (organic matter content of 0 g kg−1, total N content of 0.49 g kg−1, Olsen P content of 0.002 g kg−1, NH4OAc-K content of 0.524 g kg−1) was added once before wheat sowing in October 2014, with the goal of increasing SOC in the short term. After adding the soil organic material, all treatments were ploughed (to a depth of 30 cm) before wheat sowing. Table 1 shows the basic physicochemical properties of the soil before applying peat and vermiculite in 2014 and after wheat harvest in 2017. There were four replications per 8 m × 30 m plot, and the three treatment areas were separated by a 2 m buffer zone. The experiment was established in same fields in each season for three years.
The recommended N fertilizer application rates (90 kg N ha−1 before sowing and 120 kg N ha−1 at the start of stem elongation) were used for all three treatments during the first growing season. In the second season, a 90 kg N ha−1 application rate was used before sowing, and the optimal nitrogen rate (ONR) based on the in-season nitrogen management (INM) strategy [20] was determined at the GS30 stage. In the third season, the ONR was determined both before sowing and at the GS30 stage. The ONR in each growth period was determined by deducting measured soil nitrate-N content in the top 0–60 cm soil depth from the N target value. The N target value was the sum of N uptake by shoots and roots estimated according to the target yield and N content and was 150 kg N ha−1 at planting and 200 kg N ha−1 at GS31, respectively [20]. Soil samples before N application were extracted with a 1:1 ratio of soil to 0.01 mol L−1 CaCl2, and nitrate-N concentrations were determined using a nitrate test strip and a reflectometer (Reflectometer RQflex, Nitrate Test, E. Merck, Darmstadt, Germany).
The N application rates for each treatment are shown in Table 2. N fertilizer was applied in the form of urea (46% N). Before sowing, 120 kg P2O5 ha–1 as triple superphosphate (16% P2O5) and 100 kg K2O ha–1 as potassium sulfate (50% K2O) were broadcast over the soil and incorporated into the upper (0–20 cm) layer by rotary tillage before sowing. The seeding density was 445 plants/m–2 on October 9, 2014, 475 plants/m–2 on October 10, 2015, and 430 plants/m–2 on October 10, 2016. Line spacing was 25 cm. The plots were flood-irrigated at GS23 (before winter), at the GS30 stage, and again at the GS61 stage (beginning of flowering) during each wheat season. Weeds, insects, and diseases were controlled as needed and did not affect wheat growth.
The same chemical N rates were applied to all three treatments each year; however, the optimum rate determined by the INM method was different each year. GS30 means Zadoks growth stage.

2.3. Sampling and Measurements

The shoots were counted in one 1 m central row of each plot at the GS23, GS30, GS61, and GS93 (physiological maturity) stages. Green leaf area (excluding the senescent leaves) was calculated as leaf length × leaf width × 0.82. Fifty plants were sampled at the GS30 stage, and each plant was classified as MS, T1, T2 or other tillers. The same method was applied at the GS61 stage, and each plant was classified as MS, fertile tiller (FT, i.e., the shoot had spikes) or infertile tiller (IT, i.e., the shoot had no spikes) to determine shoot dry matter per plant. Subsamples of the plant harvested in a 1 m2 area near the middle of each plot at GS23, GS30, GS61, and GS93 were obtained by clipping aboveground plant to determine dry accumulation.
Two separate 0.5 m2 areas near the middle of each plot were harvested manually at the GS30 and GS61 stages to determine biomass and N content. The straw biomass and grains were separated at maturity after oven-drying at 60 °C. About a 100 g subsample was taken and ground with a stainless-steel grinder. Straw and grain subsampling was performed to determine N content using the Kjeldahl procedure. The number of grains per spike was recorded by counting the grains on every spike of 30 randomly selected plants in each plot before harvest. Thousand-kernel weight (TKW) was determined by weighing three sets of 500 kernels from each plot. In each plot, a 6 m2 area of plants was harvested manually at the GS93 stage and threshed. A threshing machine powered by electricity was used to thresh the grain. The grains were oven-dried to constant weight at 70 °C to determine grain yield, and standardized to 14% moisture.
Soil samples were collected three times: at the GS30, GS61, and GS93 stages. Samples from each plot included five cores taken to a depth of 60 cm at 30 cm increments. The soil samples were extracted with 0.01 mol L–1 CaCl2 and the NH4+-N and NO3-N contents were determined using continuous flow analysis (TRAACS 2000, Bran + Luebbe, Norderstedt, Germany). The soil water content was measured by oven-drying at 105 °C for 24 h to a constant weight. Subsoil samples from the 0–30 cm soil layer collected after wheat harvest were air-dried, sieved to remove stubble and roots, and then analyzed using a Vario Max CN instrument (Elementar, Langenselbold, Germany) to obtain the SOC and total nitrogen (TN). The soil Olsen-P was measured by the ammonium molybdate-ascorbic acid method based on extraction of air dried soil with 0.5 mol L−1 NaHCO3 at pH 8.5 (25 ℃).

2.4. Data Analysis

The apparent N balance during the wheat growing season was estimated by total N input and output.
Total N input = N fertilizer rate + 0–60 cm soil Nmin before planting +N mineralization.
Total N output = crop N uptake + 0–60cm soil Nmin after harvest + estimated N losses.
The losses of N2O-N, NO3-N, and NH3-N were estimated with the N rate adopted for wheat in the region of study [24].
Estimated N losses = N2O emission +NO3 leaching + NH3 volatilization,
N2O emission = 0.50e0.0032X,
NO3 leaching = 3.63e0.0080X,
NH3 volatilization = 2.69 + 0.069X,
where X was the rate of chemical N fertilizer.
N productivity was calculated by the following equations,
N productivity (kg kg−1) = grain yield/total N input.
Grain yield, yield components, N productivity, DM, and the leaf area index (LAI) were evaluated by two-way analysis of variance (ANOVA) using SAS software (SAS Institute, Cary, NC, USA), with year as the main plot and soil management treatments (Control, Manure, and EM) as the subplots (four replicates). Following ANOVA, multiple comparisons of means (p < 0.05) were conducted using Fisher’s protected least significant difference (LSD). Soil chemical parameters, N uptake, soil Nmin, stem number, and DM per plant were analyzed by one-way analysis of variance (ANOVA). Treatment means were separated by the LSD and differences were considered significant at p < 0.05.

3. Results

3.1. Soil organic Carbon, Total Nitrogen, and Other Chemical Parameters

Before sowing the wheat in 2014, the SOC content in the top 30 cm soil layer were 8.1 g kg–1 for the EM and Control treatments, and 11.0 g kg–1 for the Manure treatment (Table 1). The SOC content increased significantly by 90.1% from 2014 to 2017 for EM, and by 9.1% for the Manure treatment (Table 1). After the wheat harvest in 2017, the SOC averaged 15.4 g kg–1 and 12.0 g kg–1 for the EM and Manure treatments, which was 90.1% and 48.1% higher than the Control treatment (Table 1).
The average TN content was increased by 45.5% and 27.3% under EM and Manure treatments, respectively, after the wheat harvest in 2017. The C/N ratio of EM was the largest among the three treatments, and was 20.3% and 29.7% larger than C/N ratio of the Manure and Control treatments, respectively (Table 1). In 2017, after three years, the soil Olsen P and available K content of the EM and Manure treatments were 74–325% and 17–113% larger than those of the Control treatment (Table 1).

3.2. Grain Yield and Nitrogen Productivity

Grain yield was significantly affected by treatment and year, but no interaction effect was detected (Table 3). Over the 3-year period, the average grain yield of the EM and Manure treatments was 9.1 (range 7.9–10.4) Mg ha–1 and 9.2 (range 8.4–9.9) Mg ha–1, respectively, which was a significant increase of 18.8% and 19.7%, respectively, compared to the Control treatment, which was 7.7 (range 6.8–8.8) Mg ha–1. The high yields in the EM and Manure treatments were attributed to more spikes (27.0% and 35.6%, respectively) and higher numbers of grains per spike (21.6% and 18.6%, respectively), compared to the Control treatment when averaged across 3 years. In contrast, thousand-kernel weight (TKW) was 3.7% and 5.9% lower under EM and Manure treatments relative to the Control, respectively. A low grain yield was explained by the low TKW in 2014–2015. There were significant interactions between Treatment and Year for spikes per m2 and grains per spike. The spikes were due to the much lower values in the Control in 2017, and the larger response to Manure and EM treatments in 2017. The spikes of Manure and EM treatments were significantly higher in 2017 than those in 2015 and 2016. The grains per spike were due to the much higher values in the Control in 2015, and smaller response to Manure and EM treatments in 2015. The grains per spike with Manure and EM treatment were significantly higher compared to those of the Control in both 2016 and 2017, but there were no differences between EM and Control in 2016.

3.3. Dry Matter Accumulation and Nitrogen Uptake

The average dry matter (DM) accumulation for the EM and Manure treatments were 26.2% and 24.1% larger, respectively, than that obtained with the Control treatment at the GS93 stage (Table 4). This corresponded to higher DM accumulation for EM and Manure treatments at the GS61 stage. The DM accumulation for the EM and Manure treatments at the GS61 stage were 3.0 and 3.0 Mg ha−1 larger than that of the control treatment, which accounted for 77.6% and 86.3% of the total differences at maturity between these two treatments and the Control, respectively. The LAI values of the EM and Manure treatments were larger than that of the Control treatment at all growth stages. The average LAI of the EM treatment was 5.03 at the GS61 stage, 59.7% larger than that of the Control treatment; no significant differences were observed between the EM and Manure treatments.
High DM accumulation indicated high N uptake (Table 4 and Figure 2). Although low rates of N fertilizer were applied during the entire wheat growing season over the 3-year study period, the total aboveground N uptake of the EM and Manure treatments were 28.4% and 29.7% larger at the GS93, respectively, than that of the Control during the entire wheat growing season over the 3-year study period (Figure 2). The aboveground N uptakes of the EM and Manure treatments were 38.9% and 32.3% higher, respectively, compared to the Control treatment from sowing to the GS30 stage. The corresponding soil Nmin values in the top 60 cm soil layer were 30.8% and 34.6% larger, respectively, than that of the Control (Figure 2A). The average wheat N uptake for the EM and Manure treatments was 50.2% and 48.1% higher in the period between GS30 and GS61, respectively, than that of the Control (Figure 2B). In this period, the average soil inorganic N contents were 116 and 112 kg N ha–1 for the EM and Manure treatments, respectively, which were substantially lower than that of the Control with 159 kg N ha–1 (Figure 2B). The soil inorganic N contents in the top 60 cm soil layer of Control were significantly higher than those of the other two treatments at the GS93 stage (Figure 2C).

3.4. Patterns of Stem Number and Weight of Individual Plants

The shoot numbers for the EM and Manure treatments, which have the same seeding rate, were 2.1 and 2.3 shoots/plant–1 before winter, representing increases of 25.5% and 39.6%, respectively, compared to the Control treatment (1.7 shoots plant–1; Figure 3). At the GS30 stage, the EM and Manure treatments had an average of 3.4 and 3.5 shoots/plant–1, respectively, much higher than those of the Control (2.8 shoots plant–1) over the 3-year study period (Figure 3). The DM of the MSs for the EM and Manure treatments were 12.5% and 15.9%, respectively, significantly higher than that of Control, and 63.6% and 67.3% for T1, and 61.5% and 83.4% for T2, respectively (Figure 4A). At GS61, 1.6 and 1.7 shoots/plant−1 were observed for the EM and Manure treatments, representing increases of 29.5% and 36.8%, respectively, compared to the value of 1.2 shoots/plant−1 for the Control treatment (Figure 3). The DM of the VTs for the EM and Manure treatments were 2.3 and 2.4 g/plant−1, which was 163.8% and 161.5% higher, respectively, compared to the Control over the 3-year study period (Figure 4B).

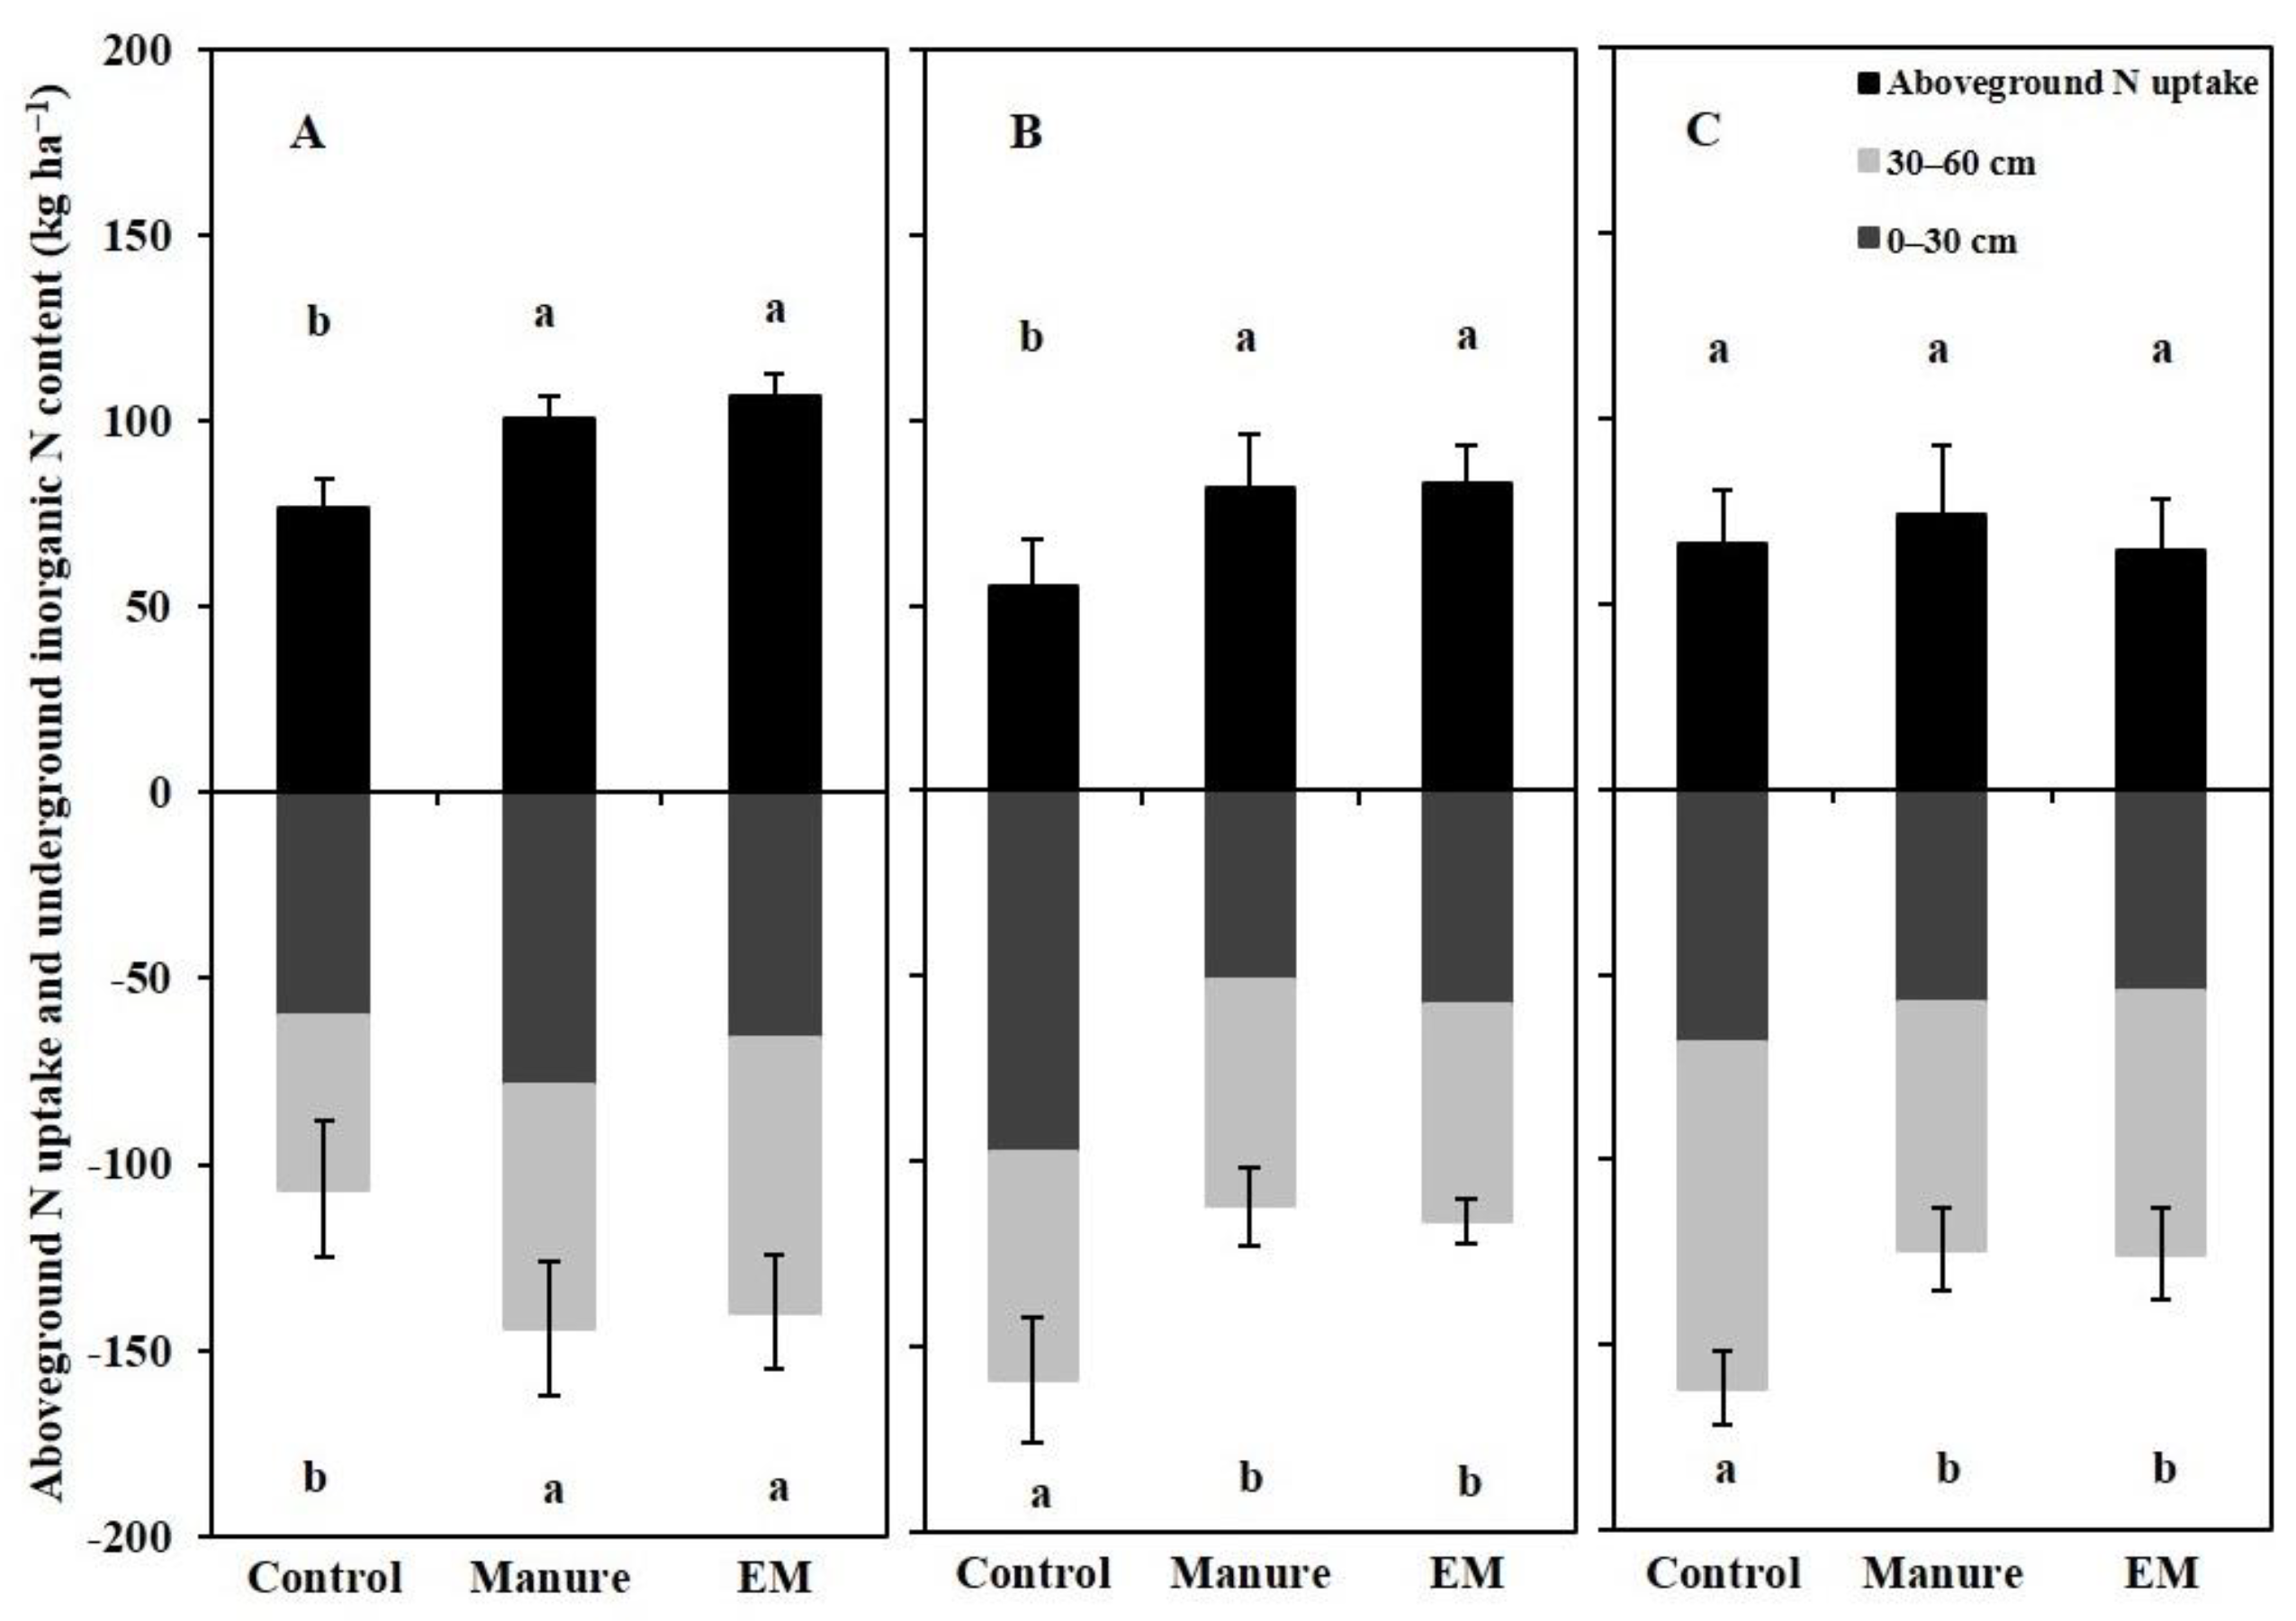
3.5. Apparent N Balance and N Productivity

Across 2 years, indigenous N from apparent N mineralization and soil Nmin in the top 60 cm soil layer before planting for the Manure and EM treatment was 30.1% and 36.0% higher than that of the Control (Table 5). Corresponding optimal N fertilizer rate was lower for these two treatments. Estimated N inputs from both indigenous and applied N were no significantly different among Control, Manure and EM treatments. The estimated N productivity of Manure and EM were 15.1% and 14.9%, pronouncedly higher than that of the Control (Table 3).

4. Discussion

Compared with the Control treatment, the improved management systems produced 18.8–19.7% higher yields and increased N productivity by 14.9–15.1%, respectively (Table 2 and Table 3). These values represented increases of 26.4–27.8% in yield, and 172.5–145.4% in N productivity, relative to those achieved with the standard practices of Chinese farmers (i.e., 7.2 Mg ha–1 yield and 28 kg kg–1 N productivity [3]). This agrees with previous studies showing that increasing SOC content in most intensive agricultural regions is positively correlated with crop yield and N productivity [5], although maximal yield-responsive SOC stock values fit a linear-plateau model [25,26]. For example, an increase of 1 ton of SOC increased wheat grain yield by 27 kg ha–1 in the US [27], and by 40 kg ha–1 in Argentina [28]. Clearly, improving SOC content combined with optimal N management can result in higher grain yield and N productivity.
This higher grain yield and N productivity in the improved systems can be attributed to several major factors. First, the wheat shoot numbers sharply disappear from GS 30 to GS 61 stage, which means that stem survival is highly important for increasing the spike number per area. The increased SOC in EM and Manure treatments not only improved wheat maximum shoot number, but also increased individual shoot weight and increased both spike number and wheat yield (Figure 3 and Figure 4, respectively). The increase of wheat yield not only depends on the maximum total shoot number, but also should improve the individual shoot quality for mature spikes [14,15]. It is likely that enhancing SOC content strengthened wheat shoot emergence [29] and allowed more mature spike survival during the shoot dying period, thus promoting higher yield formation [30]. Meanwhile, the EM and Manure treatments improved the soil physicochemical properties with the increasing SOC content, which could have positive effects on root development, water-holding capacity, and the reduction in other mineral nutrient limitations [16]. These results are consistent with the positive effect of improving SOC content on shoot growth reported previously [31].
Second, enhancing SOC content contributed to the increase in soil N mineralization, thus reducing N fertilizer input. Because the C/N ratio of soil is relatively stable, an increase in SOC decomposition results in a greater indigenous supply of plant-available N and a reduction in the N fertilizer requirement. In this study, compared with Control, adding manure and peat for the Manure and EM treatment increased apparent N mineralization by 36 and 47 kg N ha–1 yr–1, respectively (Table 5). This result indicates that improved SOC had a positive effect on the rates of N mineralization, probably due to high levels of microbial and enzyme activities [32]. High SOC and total N contents in the soil are closely related to the N supply available from the soil N mineralization process [33], and increased N mineralization is positively associated with organic material input [4]. In this study, N fertilizer input was optimized based on the results of soil Nmin testing, with in-season root zone N management implemented to ensure that the quantity requirements of the crops were met and synchronized in terms of time and crop growth (Figure 2). Thus, a high soil-available N supply for the EM and Manure treatments resulted in low N fertilizer input compared to the Control treatment.
Third, increasing yields by improving SOC content contributes to fast-growing plants and effectively exploits available soil N resources [34]. In this study, DM accumulation and aboveground N uptake before GS61 were significantly higher than that of the Control treatment (Table 5 and Figure 2), indicating that improving SOC contributed to wheat growth in the early growing period. These results are consistent with previous findings that showed that increased grain yield is related to the increasing pre-anthesis assimilate, which can be beneficial to grain filling and greater dry matter translocation efficiency [35]. Meanwhile, the EM and Manure treatments had lower residual soil Nmin content in the root zone (Figure 2), which reduced the likelihood of N losses, especially via leaching under the irrigated conditions seen in this region [16,36].
In this study, we developed an improved system by designing innovative pathways for enhancing SOC practice combined with optimizing soil and crop nutrient management, which led to the high-yield wheat population and increasing grain yield. However, only one third of the nutrients excreted by livestock are recycled in China, because the livestock industry is fragmented, comprising individual farmland systems with a variable load capacity [37]. Our results supported the finding that the recycling of manure applied to cereal crops would have large potential for replacing chemical fertilizer nutrients, which would be environmentally beneficial and economically profitable through the mitigation of nutrient losses and reduction of fertilizer application cost [38].
Previous study reported that recycling manure for use on farmland is impeded by the high cost of application, the disadvantages of relying on machines for transportation and application, and ineffective extension services [39]. Peat contains large quantities of sequestrated organic carbon, which is an economically effective soil amendment [40]. When considering the long-term effects on crop production and the environment, improving SOC content may be of benefit to sustainable agricultural production in China. On the other hand, technological innovations associated with mechanization will be essential in the near future to promote the adoption of SOC content-improving techniques, as such methods often require more on labor input than those involving only inorganic fertilizers and simple management practices. This and other studies demonstrate that the important physicochemical properties of the peat contribute to the growth of plants and more durable agriculture [41]. However, peat extraction and application can result in irreversible damage to the ecosystem and potential contribution to climate change (the release of greenhouse gas (GHG) emissions). Recycling organic materials to improve SOC, in combination with INM, confers benefits to grain yield, N productivity, and the environment and could be a useful approach to optimize management practices.

5. Conclusions

Our results demonstrated that applying manure or peat and vermiculite combined with optimal N management achieve higher dry matter and low chemical N input, which increases wheat yield and N productivity by improving wheat individual growth and population development. These findings highlight that the increasing SOC content regulates crop growth and development by utilizing organic materials in soil combined with optimal N management, which is crucial to gaining high grain production and recycling organic resources on cropland. A one-time application of a large amount of peat and vermiculite (a labor-saving way) would be more of an economically effective alternative than the application of manure in each crop season. These results provide an opportunity for increasing grain yield while reducing fertilizer inputs during wheat production. In the future, efforts to minimize the high cost of manure application, as well as efforts to provide subsides, will be effective. The measures will effectively promote green development of agriculture not only in China, but also in other areas with low SOC content.

Author Contributions

Conceptualization, Z.C. and J.P.; methodology, J.P. and W.Z.; software, J.P.; formal analysis, J.P. and Q.M.; data curation, J.P. and Q.M. writing—original draft preparation, J.P. and Q.M.; writing—review and editing, Z.C. and Q.M.; visualization, J.P. and Q.M.; supervision, Z.C., W.W. and H.W.; project administration, Z.C., Y.X. and S.Q.; funding acquisition, Z.C. All authors have read and agreed to the published version of the manuscript.

Funding

This work is supported by funds from the National Key Research and Development Program of China (Grant No. 61432014) and Taishan Scholarship Project of Shandong Province (Grant No. TS201712082).

Institutional Review Board Statement

Not applicable.

Informed Consent Statement

Not applicable.

Data Availability Statement

Not applicable.

Conflicts of Interest

The authors declare no conflict of interest.

References

  1. Liu, Z.; Ying, H.; Chen, M.; Bai, J.; Xue, Y.; Yin, Y.; William, D.; Yang, Y.; Bai, Z.; Du, M.; et al. Optimization of China’s maize and soy production can ensure feed sufficiency at lower nitrogen and carbon footprints. Nat. Food 2021, 2, 426–433. [Google Scholar] [CrossRef]
  2. Chen, X.; Cui, Z.; Fan, M.; Vitousek, P.; Zhao, M.; Ma, W.; Wang, Z.; Zhang, W.; Yan, X.; Yang, J.; et al. Producing more grain with lower environmental costs. Nature 2014, 514, 486–489. [Google Scholar] [CrossRef] [PubMed]
  3. Wang, Z.; Yin, Y.; Wang, Y.; Tian, X.; Ying, H.; Zhang, Q.; Xue, Y.; Oenema, O.; Li, S.; Zhou, F.; et al. Integrating crop redistribution and improved management towards meeting China’s food demand with lower environmental costs. Nat. Food 2022, 3, 1031–1039. [Google Scholar] [CrossRef]
  4. Wu, X.; Liu, Y.; Shang, Y.; Liu, D.; Liesack, W.; Cui, Z.; Peng, J.; Zhang, F. Peat-vermiculite alters microbiota composition towards increased soil fertility and crop productivity. Plant Soil. 2021, 470, 21–34. [Google Scholar] [CrossRef]
  5. Lal, R. Soil carbon sequestration impacts on global climate change and food security. Science 2004, 304, 1623–1627. [Google Scholar] [CrossRef] [Green Version]
  6. Han, D.; Sun, Z.; Li, F.; Hou, R.; Li, J.; Ouyang, Z.; Li, B.; Cao, C. Changes and controlling factors of cropland soil organic carbon in North China Plain over a 30-year period. Plant Soil 2016, 403, 437–453. [Google Scholar] [CrossRef]
  7. Mulder, V.; Lacoste, M.; Richer-de-Forges, A.; Martin, M.; Arrouays, D. National versus global modelling the 3D distribution of soil organic carbon in mainland France. Geoderma 2016, 263, 16–34. [Google Scholar] [CrossRef]
  8. Poffenbarger, H.; Barker, D.; Helmers, M.; Miguez, F.; Olk, D.; Sawyer, J. Maximum soil organic carbon storage in Midwest U.S. cropping systems when crops are optimally nitrogen-fertilized. PLoS ONE 2017, 12, e0172293. [Google Scholar] [CrossRef] [Green Version]
  9. Butler, T.; Muir, J. Dairy manure compost improves soil and increases tall wheatgrass yield. Agron. J. 2006, 98, 1090–1096. [Google Scholar] [CrossRef] [Green Version]
  10. State Statistics Bureau of China. 2021. Available online: http://www.stats.gov.cn/tjsj/ndsj/2021/indexch.htm (accessed on 10 October 2022).
  11. Racz, I.; Hirişcău, D.; Berindean, I.; Kadar, R.; Muntean, E.; Tritean, N.; Russu, F.; Ona, A.; Muntean, L. The Influence of flag leaf removal and its characteristics on main yield components and yield quality indices on wheat. Agronomy 2022, 12, 2545. [Google Scholar] [CrossRef]
  12. Miralles, D.; Slafer, G. Sink limitations to yield in wheat: How could it be reduced? J. Agric. Sci. 2007, 145, 139–149. [Google Scholar] [CrossRef] [Green Version]
  13. Sreenivasulu, N.; Schnurbusch, T. A genetic playground for enhancing grain number in cereals. Trends Plant Sci. 2012, 17, 91–101. [Google Scholar] [CrossRef] [PubMed]
  14. Duggan, B.; Richards, R.; van Herwaarden, A.; Fettell, N. Agronomic evaluation of a tiller inhibition gene (tin) in wheat. I. Effect on yield, yield components, and grain protein. Aust. J. Agric. Res. 2005, 56, 169–178. [Google Scholar] [CrossRef]
  15. Lu, D.; Lu, F.; Pan, J.; Cui, Z.; Zou, C.; Chen, X.; He, M.; Wang, Z. The effects of cultivar and nitrogen management on wheat yield and nitrogen use efficiency in the North China Plain. Field Crops Res. 2015, 171, 157–164. [Google Scholar] [CrossRef]
  16. Cassman, K.; Dobermann, A.; Walters, D.; Yang, H. Meeting cereal demand while protecting natural resources and improving environmental quality. Annu. Rev. Environ. Resour. 2003, 28, 315–358. [Google Scholar] [CrossRef] [Green Version]
  17. Wu, X.; Peng, J.; Liu, P.; Bei, Q.; Rensing, C.; Li, Y.; Yuan, H.; Liesack, W.; Zhang, F.; Cui, Z. Metagenomic insights into nitrogen and phosphorus cycling at the soil aggregate scale driven by organic material amendments. Sci. Total Environ. 2021, 785, 147329. [Google Scholar] [CrossRef]
  18. Qiu, S.; Ju, X.; Ingwersen, J.; Guo, Z.; Stange, C.F.; Bisharat, R.; Streck, T.; Chistie, P.; Zhang, F. Role of carbon substrates added in the transformation of surplus nitrate to organic nitrogen in a calcareous soil. Pedosphere 2013, 23, 205–212. [Google Scholar] [CrossRef]
  19. Chen, X.; Zhang, F.; Romheld, V.; Horlacher, D.; Schulz, R.; Boning-Zilkens, M. Synchronizing N supply from soil and fertilizer and N demand of winter wheat by an improved Nmin method. Nutr. Cycl. Agroecosys. 2006, 74, 91–98. [Google Scholar] [CrossRef]
  20. Cui, Z.; Chen, X.; Miao, Y.; Li, F.; Zhang, F.; Li, J.; Ye, Y.; Yang, Z.; Zhang, Q.; Liu, C. On-farm evaluation of winter wheat yield response to residual soil nitrate-N in North China plain. Agron. J. 2008, 100, 1527–1534. [Google Scholar] [CrossRef]
  21. Cui, Z.; Zhang, F.; Mi, G.; Chen, F.; Li, F.; Chen, X. Interaction between genotypic difference and nitrogen management strategy in determining nitrogen use efficiency of summer maize. Plant Soil. 2009, 317, 267–276. [Google Scholar] [CrossRef]
  22. Cui, Z.; Zhang, F.; Chen, X.; Dou, Z.; Li, J. In-season nitrogen management strategy for winter wheat: Maximizing yields, minimizing environmental impact in an over-fertilization context. Field Crops Res. 2010, 116, 140–146. [Google Scholar] [CrossRef]
  23. Cui, Z.; Yue, S.; Wang, G.; Zhang, F.; Chen, X. In-season root-zone N management for mitigating greenhouse gas emission and reactive N losses in intensive wheat production. Environ. Sci. Technol. 2013, 47, 6015–6022. [Google Scholar] [CrossRef] [PubMed]
  24. Cui, Z.; Zhang, H.; Chen, X.; Zhang, C.; Ma, W.; Huang, C.; Zhang, W. Pursuing sustainable productivity with millions of smallholder farmers. Nature 2018, 555, 363–366. [Google Scholar] [CrossRef] [PubMed]
  25. Loveland, P.; Webb, J. Is there a critical level of organic matter in the agricultural soils of temperate regions: A review. Soil Till. Res. 2003, 70, 1–18. [Google Scholar] [CrossRef]
  26. Oelofse, M.; Markussen, B.; Knudsen, L.; Schelde, K.; Olesen, J.; Jensen, L.; Bruun, S. Do soil organic carbon levels affect potential yields and nitrogen use efficiency? An analysis of winter wheat and spring barley field trials. Eur. J. Agron. 2015, 66, 62–73. [Google Scholar] [CrossRef]
  27. Bauer, A.; Black, A. Quantification of the effect of soil organic-matter content on soil productivity. Soil Sci. Soc. Am. J. 1994, 58, 185–193. [Google Scholar] [CrossRef]
  28. Diaz-Zorita, M.; Duarte, G.; Grove, J. A review of no-till systems and soil management for sustainable crop production in the subhumid and semiarid Pampas of Argentina. Soil Tillage Res. 2002, 65, 1–18. [Google Scholar] [CrossRef]
  29. Edmeades, D. The long-term effects of manures and fertilisers on soil productivity and quality: A review. Nutr. Cycl. Agroecosys. 2003, 66, 165–180. [Google Scholar] [CrossRef]
  30. Berry, P.; Spink, J.; Foulkes, M.; Wade, A. Quantifying the contributions and losses of dry matter from non-surviving shoots in four cultivars of winter wheat. Field Crops Res. 2003, 80, 111–121. [Google Scholar] [CrossRef]
  31. Mason, H.; Spaner, D. Competitive ability of wheat in conventional and organic management systems: A review of the literature. Can. J. Plant Sci. 2006, 86, 333–343. [Google Scholar] [CrossRef]
  32. Habteselassie, M.; Stark, J.; Miller, B.; Thacker, S.; Norton, J. Gross nitrogen transformations in an agricultural soil after repeated dairy-waste application. Soil Sci. Soc. Am. J. 2006, 70, 1338–1348. [Google Scholar] [CrossRef]
  33. Diacono, M.; Montemurro, F. Long-term effects of organic amendments on soil fertility. Agron. Sustain. Dev. 2011, 30, 401–422. [Google Scholar] [CrossRef] [Green Version]
  34. Petraityte, D.; Ceseviciene, J.; Arlauskiene, A.; Slepetiene, A.; Skersiene, A.; Gecaite, V. Variation of soil nitrogen, organic carbon, and waxy wheat yield using liquid organic and mineral fertilizers. Agriculture 2022, 12, 2016. [Google Scholar] [CrossRef]
  35. Álvaro, F.; Isidro, J.; Villegas, D.; GarcÍa del Moral, L.; Royo, C. Breeding effects on grain filling, biomass partitioning and remobilization in Mediterranean durum wheat. Agron. J. 2008, 100, 361–370. [Google Scholar] [CrossRef]
  36. Ju, X.; Xing, G.; Chen, X.; Zhang, S.; Zhang, L.; Liu, X.; Cui, Z.; Yin, B.; Christie, P.; Zhu, Z.; et al. Reducing environmental risk by improving N management in intensive Chinese agricultural systems. Proc. Natl. Acad. Sci. USA 2009, 106, 3041–3046. [Google Scholar] [CrossRef] [Green Version]
  37. Bai, Z.; Ma, L.; Jin, S.; Ma, W.; Velthof, G.; Oenema, O.; Liu, L.; Chadwick, D.; Zhang., F. Nitrogen, phosphorus, and potassium flows through the manure management chain in China. Environ. Sci. Technol. 2016, 50, 13409–13418. [Google Scholar] [CrossRef] [Green Version]
  38. David, C.; Jia, W.; Tong, Y.; Yu, G.; Shen, Q.; Qing, C. Improving manure nutrient management towards sustainable agricultural intensification in China. Agr. Ecosyst. Environ. 2015, 209, 34–46. [Google Scholar] [CrossRef]
  39. Barrett, G.; Alexander, P.; Robinson, J.; Bragg, N. Achieving environmentally sustainable growing media for soilless plant cultivation systems—A review. Sci. Hortic. 2016, 212, 220–234. [Google Scholar] [CrossRef] [Green Version]
  40. Szajdak, L.; Jezierski, A.; Wegner, K.; Meysner, T.; Szczepanski, M. Influence of drainage on peat organic matter: Implications for development, stability, and transformation. Molecules 2020, 25, 2587. [Google Scholar] [CrossRef]
  41. Jindo, K.; Audette, Y.; Higashikawa, F.; Silva, C.; Akashi, K.; Mastrolonardo, G.; Miguel, M.; Mondini, C. Role of biochar in promoting circular economy in the agriculture sector. Part 1: A review of the biochar roles in soil N, P and K cycles. Chem. Biol. Technol. Agriv. 2020, 7, 15. [Google Scholar] [CrossRef]
Figure 1. Rainfall (A) and mean monthly temperature (B) during the wheat growing season (from the initial year in October to the next year in June).
Agronomy 13 00198 g001
Figure 2. Soil inorganic N content (sum of NO3-N and NH4–N) at GS30 (start of stem elongation), GS61 (beginning of anthesis), and GS93 (physiological maturity) and the corresponding aboveground N uptake from sowing to GS30 (A), from the GS30 to GS61 (B), and from GS61 to GS93 (C) for three treatments across 3 years in 0–30 and 30–60 cm soil depth layers. Different letters indicate differences significant at p < 0.05 according to Fisher’s LSD test. Vertical bars represent ± S.E. of the mean.
Agronomy 13 00198 g002
Figure 3. The dynamic of stem number of individual plant across three years. (AC) means 2015, 2016, and 2017, respectively. Vertical bars represent ± S.E. of the mean. GS23, GS30, GS60, GS100 before the winter, start of stem elongation, beginning of anthesis, and physiological maturity stages, respectively. NS, not significant; * Significant at p < 0.05; *** Significant at p < 0.001.
Agronomy 13 00198 g003
Figure 4. The dry matter of the main stem (MS), tiller1 (T1), tiller2 (T2), other tillers at GS30 (start of stem elongation stage) (A) and the main stem (MS), valid tiller (VT), invalid tiller (IT) at GS61 (beginning of anthesis stage) (B) of per plant for three treatments over 3-year study period. Means followed by the different letter means significantly different among different treatment for MS, T1, T2 VI, IT and others at p < 0.05 level. Vertical bars represent ± S.E. of the mean.
Agronomy 13 00198 g004
Table 1. Changes in soil organic carbon (SOC), total nitrogen (TN), the carbon/nitrogen ratio (C/N) and other chemical parameters in the period from before wheat sowing in 2014 to after wheat harvest in 2017.
YearTreatmentsSOCTNC/NOlsen-PAvailable-K
mg kg–1mg kg–1 mg kg–1mg kg–1
2014Control (EM)8.1 ± 0.1b1.0 ± 0.1b8.1 ± 0.1b5.3 ± 0.4b135 ± 8b
Manure11.0 ± 0.3a1.2 ± 0.1a9.1 ± 0.1a23.0 ± 2.1a246 ± 3a
2017Control8.1 ± 0.1c1.1 ± 0.1b7.4 ± 0.4c7.2 ± 0.2c175 ± 11c
EM15.4 ± 0.4a1.6 ± 0.1a9.6 ± 0.5a12.5 ± 0.5b204 ± 5b
Manure12.0 ± 1.0b1.4 ± 0.1a8.9 ± 0.4b30.6 ± 3.7a373 ± 33a
Different lowercase letter means significant differences among soil treatments at p < 0.05 according to Fisher’s LSD test.
Table 2. Rates and times of nitrogen (N) application during the experiment based on an in-season nitrogen management (INM) strategy.
YearTreatmentBefore Sowing
(kg ha–1)
GS30
(kg ha–1)
Total N Rate
(kg ha–1)
2014–2015CK90120210
Manure90120210
EM90120210
2015–2016CK9067157
Manure9030120
EM9030120
2016–2017CK30157187
Manure3077107
EM305686
AverageCK70114184
Manure7076146
EM7069139
Table 3. Wheat yield, yield components, and N productivity for the three treatments from 2015 to 2017.
Yield
(Mg ha–1)
Spikes
(m–2)
Grains (Spike–1)Thousand-Kernel Weight (g)N Productivity
(kg kg–1)
Treatments (T)
Control7.7 ± 0.5559 ± 3526.4 ± 2.039.5 ± 2.120.5 ± 1.4
Manure9.2 ± 0.4758 ± 4231.3 ± 0.437.2 ± 1.723.6 ± 0.6
EM9.1 ± 0.6710 ± 5432.1 ± 1.038.1 ± 1.623.6 ± 1.0
LSD0.051.0913.52.11.3
Year (Y)
20158.6 ± 0.5716 ± 2830.3 ± 0.433.7 ± 0.3-
20167.7 ± 0.4582 ± 3530.1 ± 2.440.6 ± 0.719.3 ± 1.1
20179.7 ± 0.4741 ± 8730.0 ± 2.440.1 ± 0.725.9 ± 1.7
LSD0.050.81022.61.91.5
T × YNS*****NSNS
N productivity (kg kg–1) = grain yield/ total N input. N productivity defined as kg grain produced per kg N from indigenous and applied N. Total N input = chemical N fertilizer rate + 0–60 cm soil Nmin before planting + apparent N mineralization. ns, not significant. NS, not significant; ** Significant at 0.01 level; *** Significant at 0.001 level.
Table 4. The dynamics of aboveground dry matter accumulation and leaf area index (LAI) for three treatments over 3-year study period.
YearTreatmentAboveground Dry Matter Accumulation
(Mg ha–1)
LAI
GS23GS30GS61 GS93GS23GS30GS61GS75
Treatments (T)Control0.37 ± 0.173.17 ± 0.206.63±14.5±0.60 ± 0.043.43 ± 1.023.15 ± 0.612.16 ± 0.63
Manure0.50 ± 0.125.11 ± 0.249.65±18.0±1.10 ± 0.065.78 ± 0.555.10 ± 0.653.29 ± 1.10
EM0.51 ± 0.044.57±9.58±18.3±0.91 ± 0.015.50 ± 0.605.03 ± 0.653.09 ± 0.92
LSD0.05 0.141.182.992.190.170.810.901.28
Year (Y)20150.73 ± 0.035.92±12.13±18.8±-4.97 ± 0.874.16 ± 0.47-
20160.43 ± 0.284.9±9.15±13.8±-4.52 ± 0.914.27 ± 0.801.95 ± 0.22
20170.66 ± 0.185.35±11.04±18.5±0.84 ± 0.155.94 ± 0.615.54 ± 0.823.73 ± 0.48
LSD0.05 0.150.673.312.49-1.191.240.37
T × Y ***NS-NSNSNS
NS, not significant; * Significant at p < 0.05. There were no LAI data for the period GS23 in 2015 or 2016, or for GS75 in 2015. GS means Zadoks growth stage.
Table 5. Calculated apparent N mineralization, estimated N losses for three treatments during 2015–2016 and 2016–2017.
CKManureEM
2015–2016
A. Total N input
1. Chemical N fertilizer rate157120120
2. 0–60 cm soil Nmin before planting168187196
3. Apparent N mineralization 669185
B. N output
4. Crop N uptake162213197
5. 0–60 cm soil Nmin after harvest202164183
6. Estimated N losses272121
2016–2017
A. Total N input
1. Chemical N fertilizer rate18710786
2. 0–60 cm soil Nmin before planting156192185
3. Apparent N mineralization 2975104
B. Total N output
4. Crop N uptake218267277
5. 0–60 cm soil Nmin after harvest1218881
6. Estimated N losses331917
Total N input = 1 + 2 + 3. Total N output= 4 + 5 + 6. Apparent N mineralization = 4 + 5 + 6–1-2. Estimated N losses = N2O emission +NO3 leaching + NH3 volatilization. The losses of N2O-N, NO3-N, and NH3-N were estimated with N rate adopted for wheat in the region of study, N2O emission= 0.50e0.0032X; NO3 leaching = 3.63e0.0080X; NH3 volatilization =2.69 + 0.069X, X means the rate of chemical N fertilizer [24].
Disclaimer/Publisher’s Note: The statements, opinions and data contained in all publications are solely those of the individual author(s) and contributor(s) and not of MDPI and/or the editor(s). MDPI and/or the editor(s) disclaim responsibility for any injury to people or property resulting from any ideas, methods, instructions or products referred to in the content.

