Article

Stimulative Effects of Lupinus sp. and Melilotus albus Underseed on the Photosynthetic Performance of Maize (Zea mays) in Two Intercropping Systems

1
Department of Agrotechnics, Research Institute for Fodder Crops, Zahradní 1, 664 41 Troubsko, Czech Republic
2
Laboratory of Photosynthetic Processes, Department of Experimental Biology, Faculty of Science, Masaryk University, Kamenice 5, 625 00 Brno, Czech Republic
3
Department of Agrosystems and Bioclimatology, Faculty of Agrisciences, Mendel University in Brno, Zemědělská 1, 613 00 Brno, Czech Republic
*
Author to whom correspondence should be addressed.
Agronomy 2023, 13(1), 163; https://doi.org/10.3390/agronomy13010163
Submission received: 23 November 2022 / Revised: 29 December 2022 / Accepted: 1 January 2023 / Published: 4 January 2023

Abstract

:
In order to evaluate influential mechanisms for photosynthetic processes on the yields of an intercropping system composed of maize (Zea mays), Lupinus sp. and Melilotus albus, three treatments were designed and conducted in southern Moravia (Czech Republic) in the form of agronomy trials. The treatments included sole maize (SM), maize with Lupinus sp. (ML) and maize with field melilot (MM). The photosynthetic processes of Zea mays were monitored using several chlorophyll fluorescence techniques on the three treatments for 20 days in the late summer season. An analysis of fast chlorophyll fluorescence transients (OJIP) showed that the capacity of photochemical photosynthetic reactions in photosystem II (FV/FM), as well as the photosynthetic electron transport rate (ET0/RC), declined in response to a four-day episode of extremely warm days with full sunshine. Similarly, the performance index (PI), an indicator of general plant vitality, declined. The episode activated protective mechanisms in photosystem II (PSII), which resulted in an increase of thermal dissipation. For the majority of Z. mays photosynthetic parameters, their values decreased for particular treatments in the following order: MM, ML, SM. The MM and ML intercropping systems had a positive effect on the primary photosynthetic parameters in Z. mays.

1. Introduction

Maize (Zea mays) is among the most cultivated crops in central Europe. Recently, the most popular agricultural practice has been to grow maize in monocultures in large areas of agricultural land. That is why the cultivation of maize in Europe faces some challenges regarding the low biodiversity of agricultural ecosystems. Recently, the approach of intercropping maize with other crops has become an important issue, since it increases the biodiversity of the fields with implications for crop production, as shown by [1]. The system of intercropping of maize with white sweetclover and white lupin has been studied recently by [2,3]. According to Turkington et al. (1978) [4], white sweetclover is one of the alternative legumes for biogas production. The species is mainly used as a fodder crop, a soil-improving crop on less fertile soils and a green manure crop. Kadaňková et al. (2019) [5] and Kintl et al. (2022) [6] evaluated the potential of white sweetclover for intercropping systems.
Simultaneous intercropping has recently become a common agronomy practice to promote the production of a target crop species. The two approaches affect the agronomic performance of the target crop, dry matter production, partitioning and grain yield [7]. Among the combinations most commonly used in intercropping are cereals and legumes, with the association of maize [8,9]. The potential use of the Fabaceae family for agricultural soil sustainability has been reviewed in several studies [10,11,12] that focused the effects of stand density, and the intercropping system designs on crop production.
Chlorophyll fluorescence parameters are used routinely to indicate limitations in the photosynthetic apparatus, photosystem II (PSII) in particular, in response to a variety of biotic and abiotic stressors. In crops, special attention is paid to drought stress [13,14], its effect on effective quantum yield of PSII and photosynthetic parameters.
Among the recently-used chlorophyll fluorescence techniques used in crop research, fast chlorophyll fluorescence transients (OJIP) have been increasingly applied since they are non-invasive, fast and allow us to collect and analyze large datasets in a reasonable timeframe. The OJIPs are measured in crops in order to evaluate OJIP characteristics [15] and relate them to the particular driving factors affecting the primary photosynthetic processes in the leaves. In this concept, increased evidence for the negative effects of drought stress [16,17], salinity stress [18,19], high-temperature stress [20] and heavy metal stress [21] have accumulated in the last few decades. In this paper, we tested the hypothesis that the two intercropping species used in our study (legumes: Lupinus sp., Melilotus albus) would affect the microclimate of the stand and improve soil quality—nitrogen availability in particular. In our concept, these changes would lead to an increase in the photosynthetic performance of the target species (Zea mays) and, consequently, increased biomass production.

2. Materials and Methods

2.1. Field Experiment Design

The experimental plot covered a total area of 100 m2. The experiment was based on the randomization method in three replications (on individual 6 × 20 m plots). The selected crops were maize (Zea mays L., FAO 230–240), lupin (Lupinus sp.) and white sweetclover (Melilotus albus Medik., Meba). For details and the experimental design, see [3]. Before sowing, mixed NPK (10:26:26) fertilizer was applied (HOKR, spol. s r.o., Pardubice, Czech Republic) at 300 kg/ha.
(1).
Monoculture A: maize (Zea mays), the treatment abbreviated SM
Seventy-five thousand units/ha of selected maize seed were sown in 0.375 m rows using a Kinze 3500 precision vacuum seeder “interplant system” (Kinze Manufacturing, Williamsburg, IA, USA).
(2).
Mixed maize and white sweetclover (Melilotus albus), the treatment abbreviated MM
The combination of maize and white sweetclover was sown on the same date as the maize monoculture, again using a Kinze 3500 precision vacuum seeder (Kinze Manufacturing, Williamsburg, IA, USA). The maize was sown in a row at a distance of 0.375 m and the white sweetclover was sown in a strip 0.375 m wide on each side, 0.375 m from the nearest maize row. Both crops were sown at the same time. The sowing rate of each crop was 75 thousand grains/ha, and the total number of individuals (maize + white sweetclover) was thus 150 thousand grains/ha.
(3).
Mixed maize and white lupin (Lupinus sp.), the treatment abbreviated ML
The combination of maize and lupin was sown on the same date using a Kinze 3500 precision vacuum seeder (Kinze Manufacturing, Williamsburg, IA, USA). Individual grains of maize and lupin were sown simultaneously in rows at a distance of 0.375 m. The sowing rate of each crop was 75 thousand grains/ha, bringing the total number of individuals (maize + lupin) to 150 thousand grains/ha.

2.2. Soil Characteristics
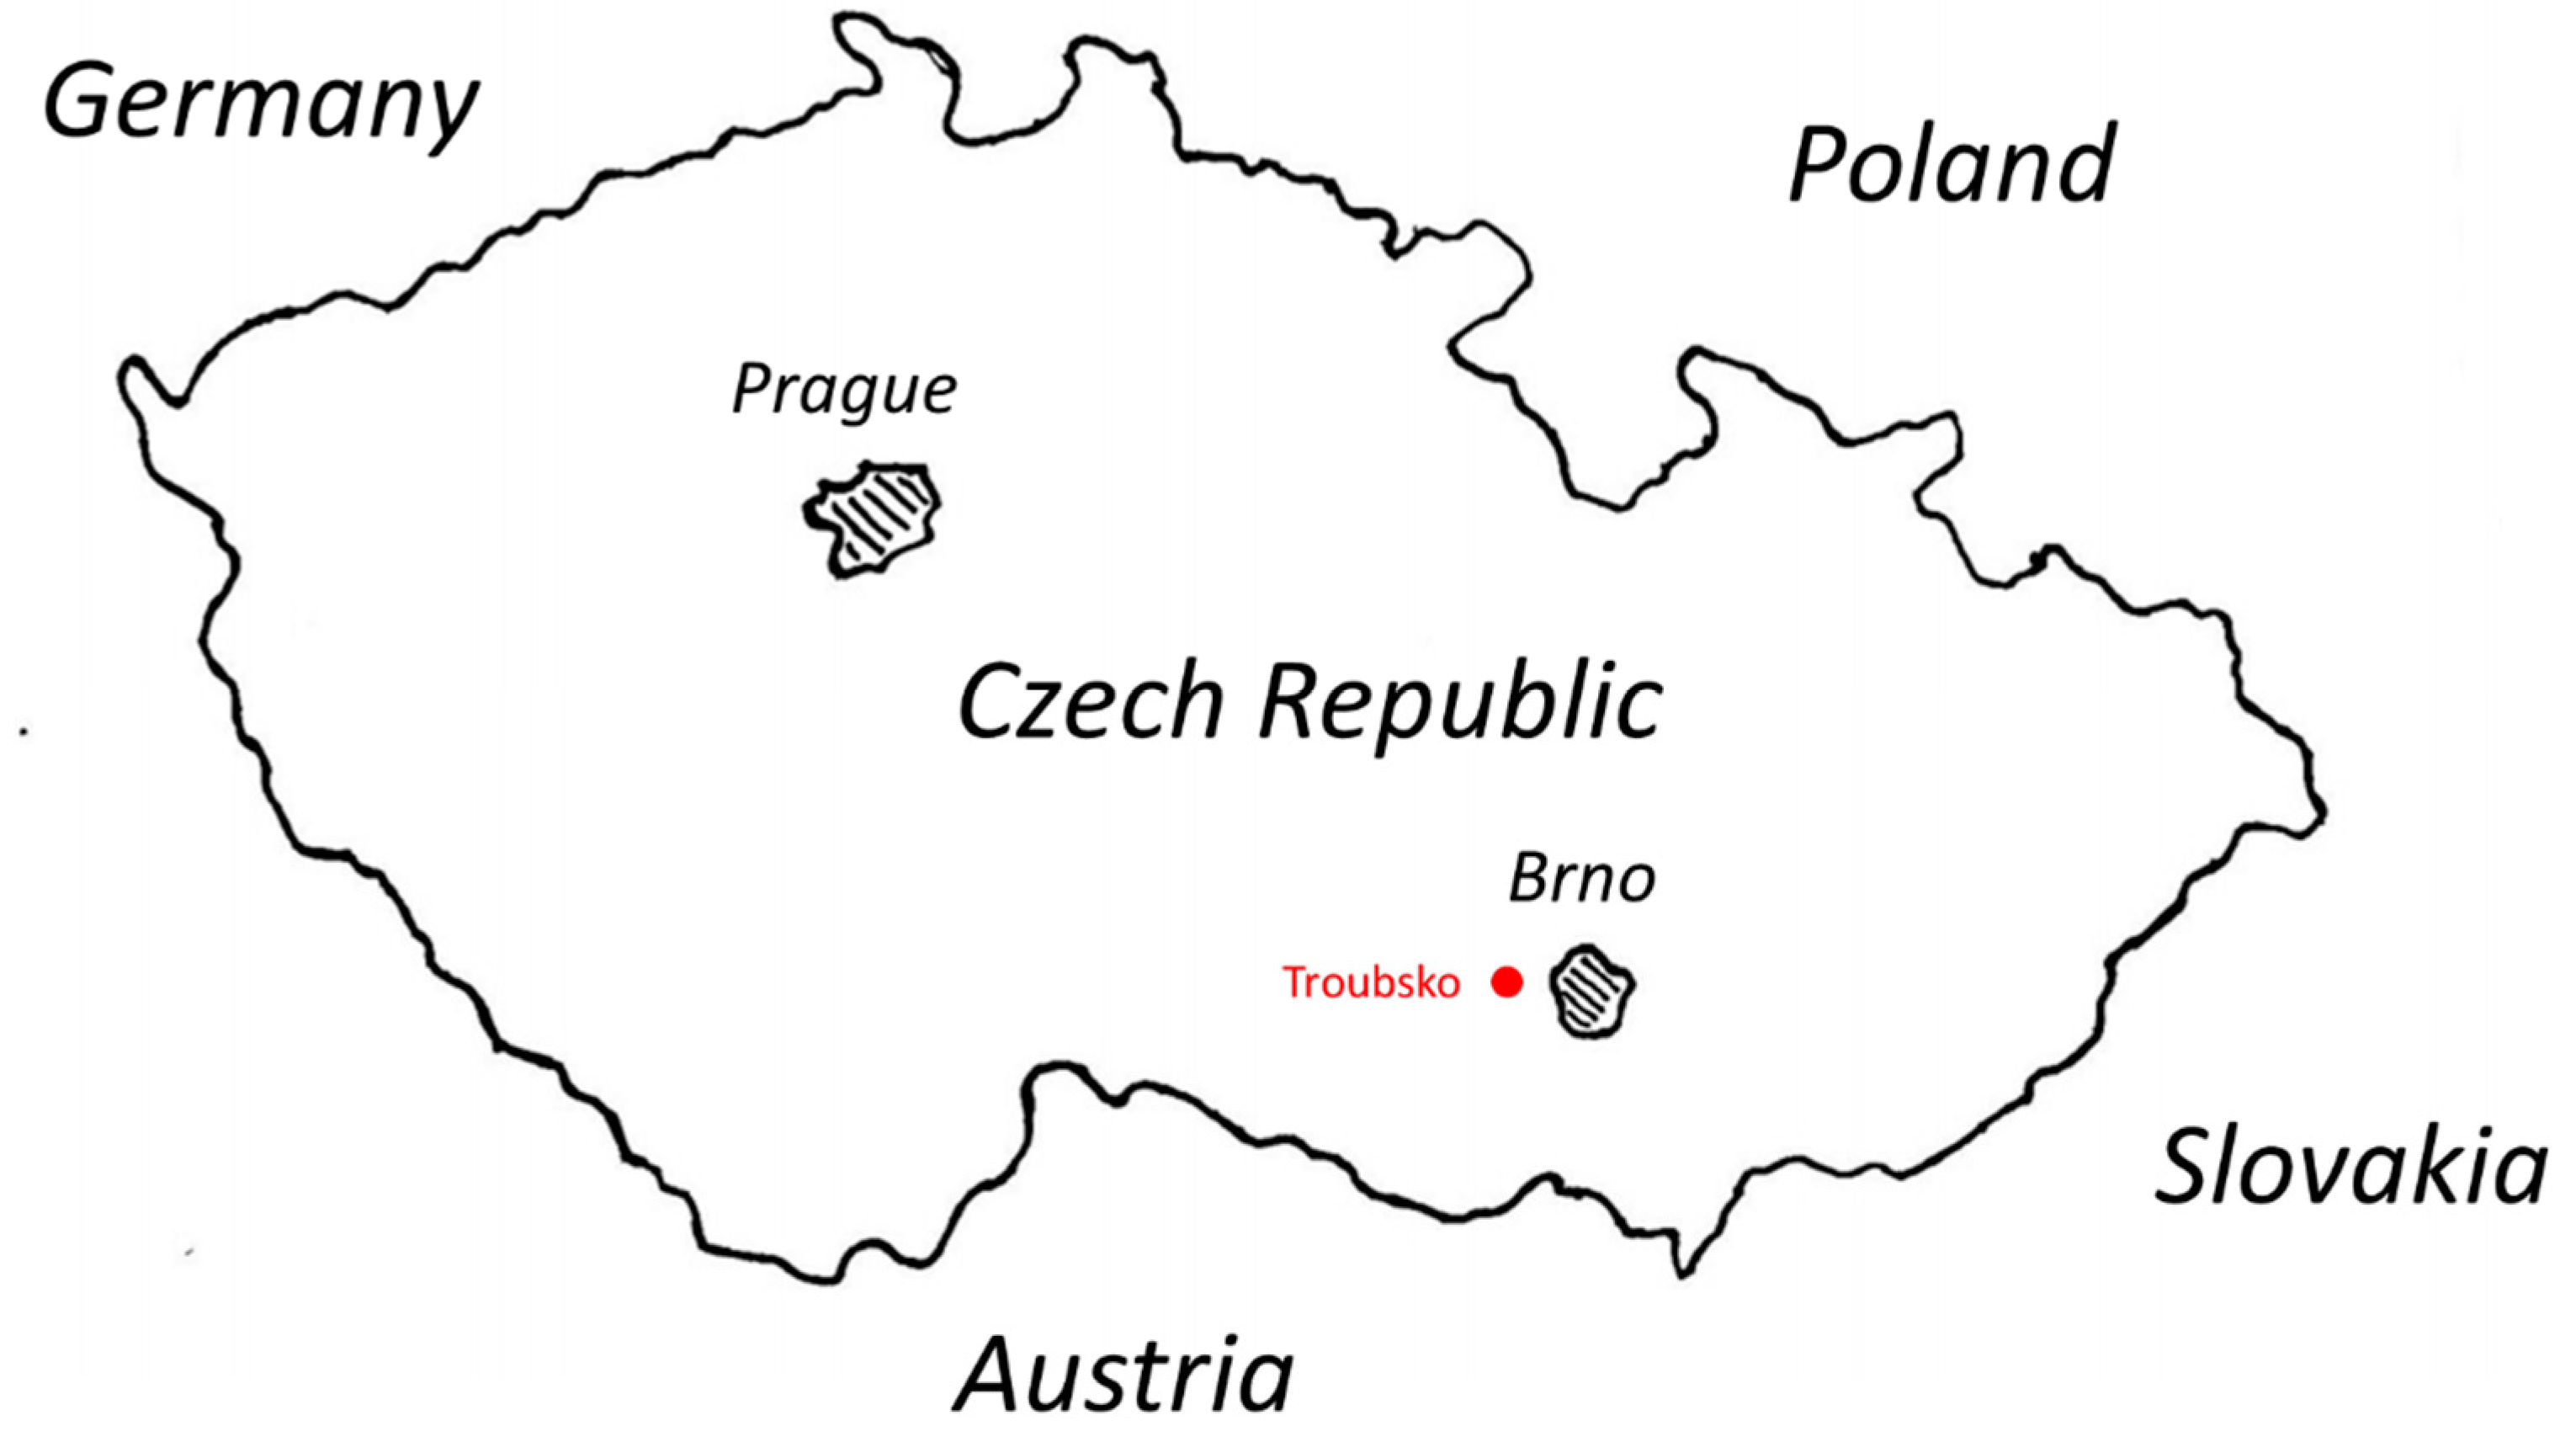
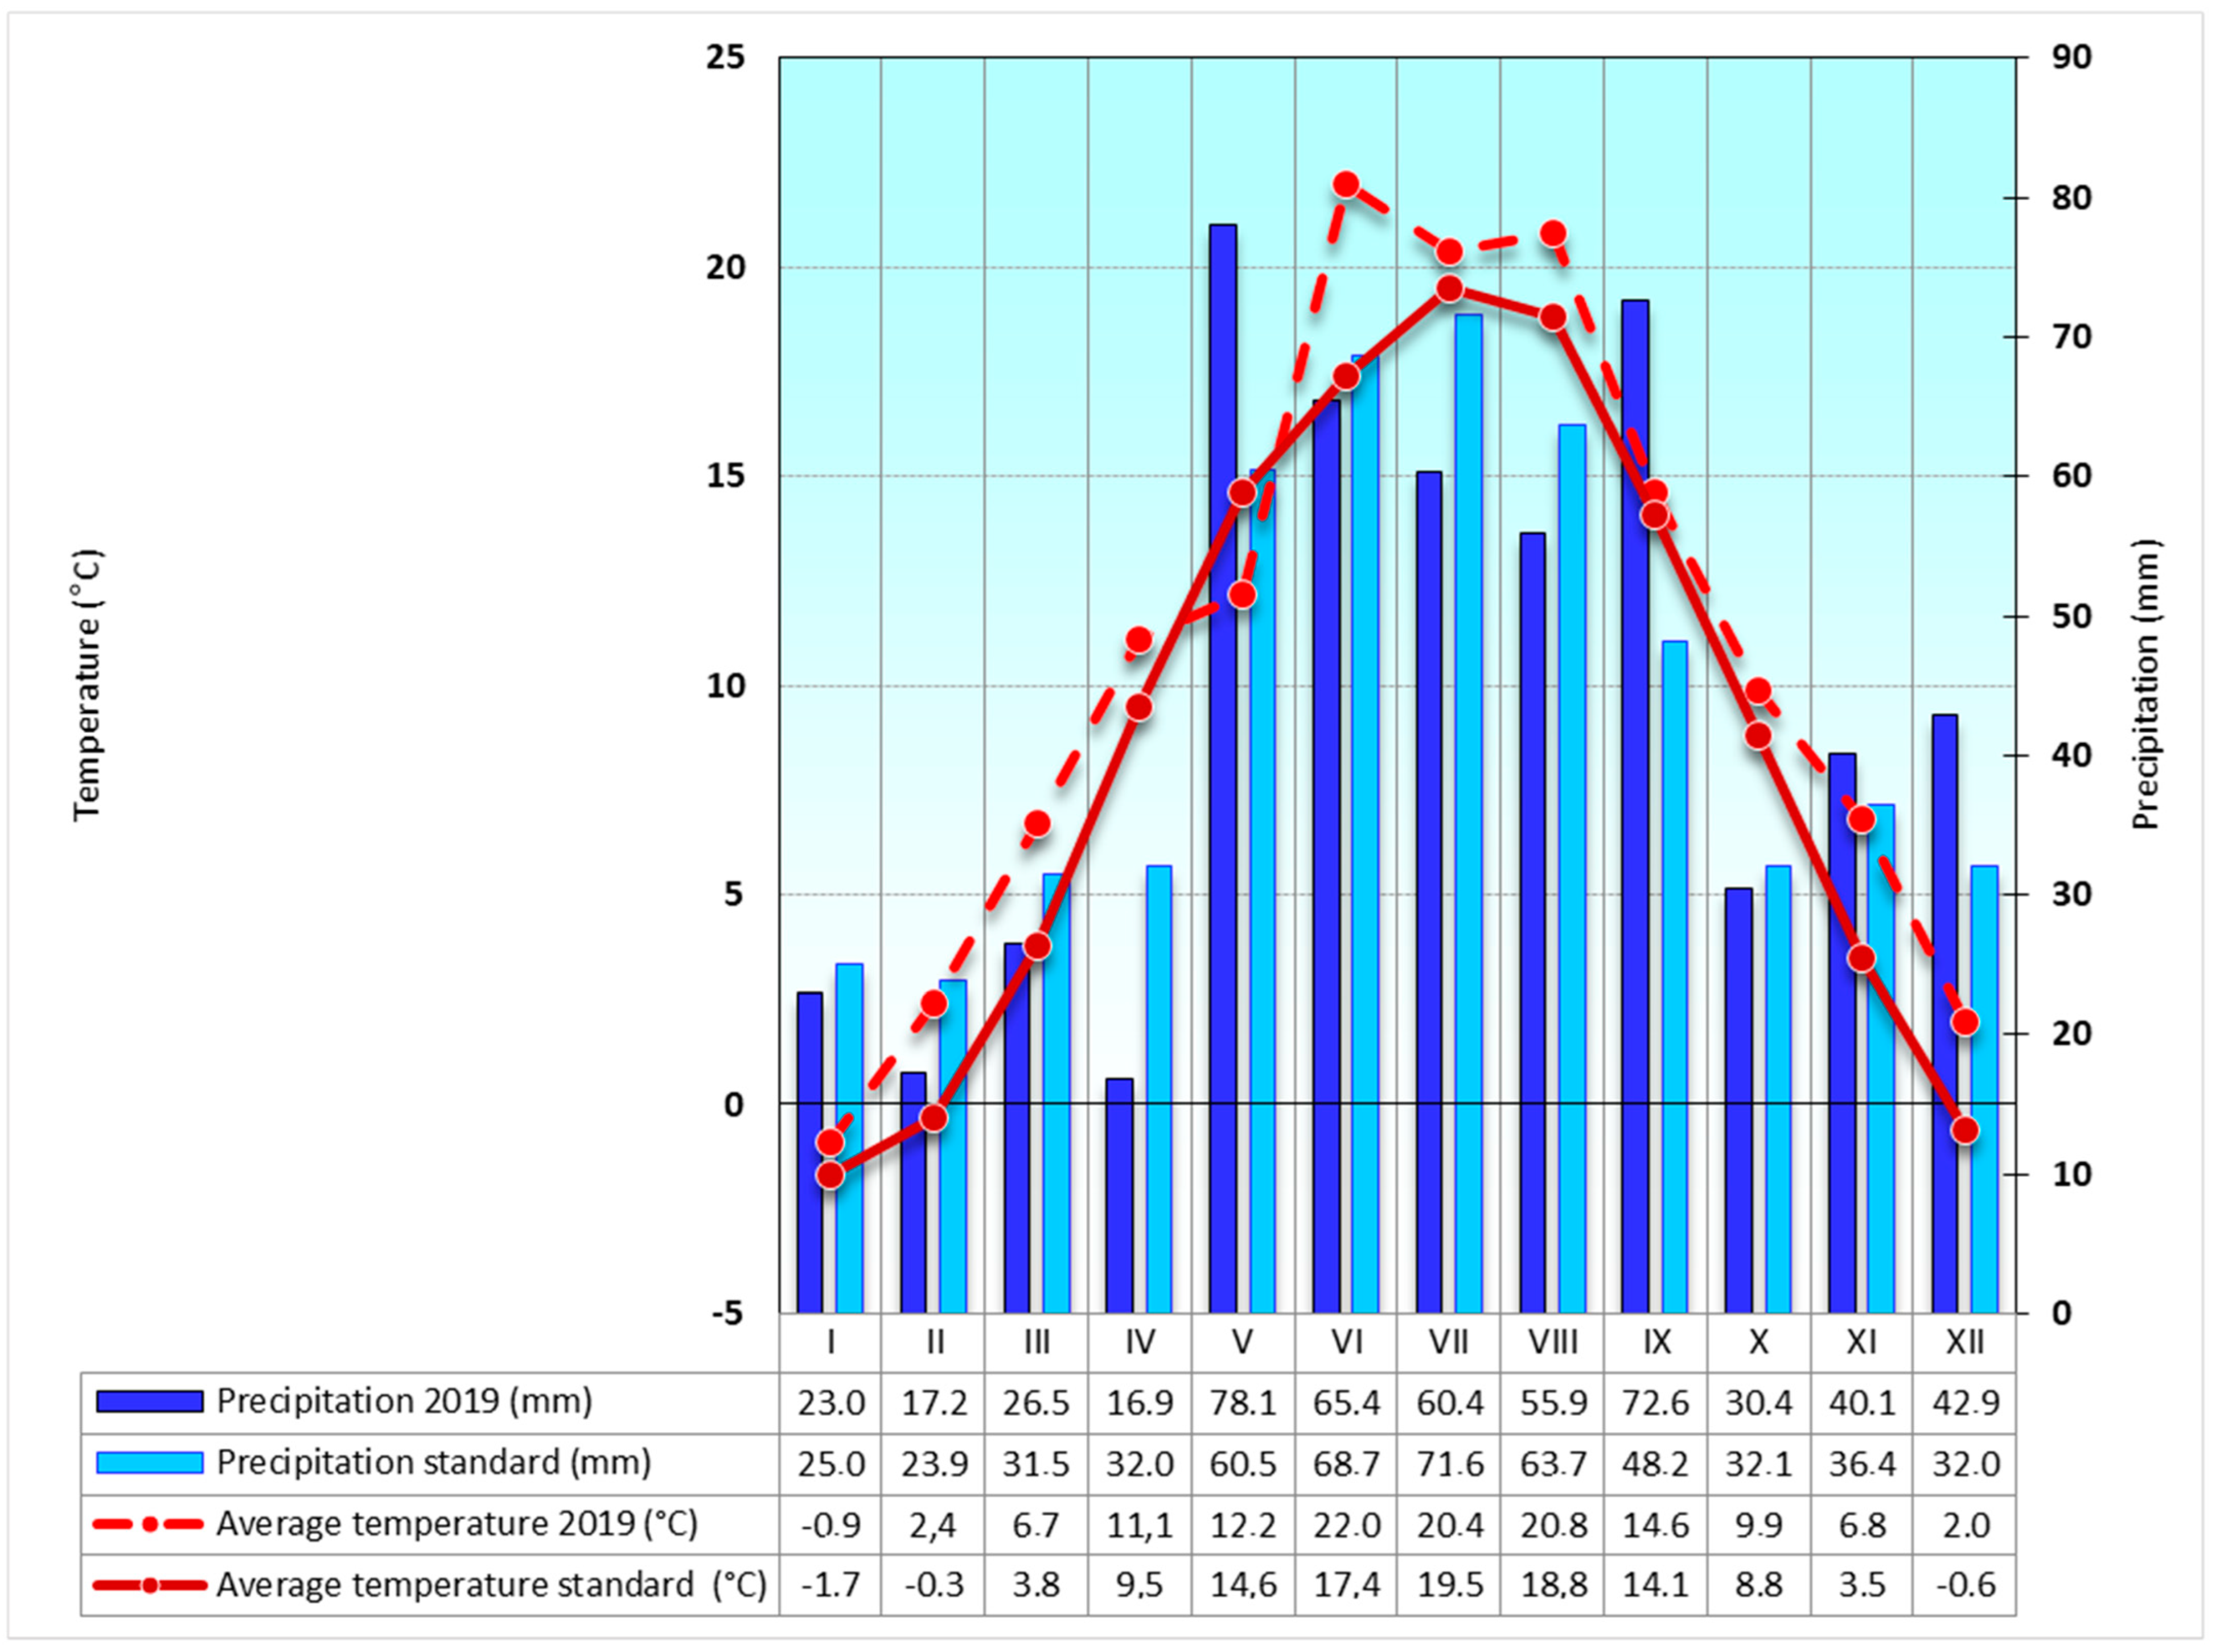
The experimental plot (Figure 1) is located close to Agricultural Research Ltd. in Troubsko (49.1709° N, 16.4916° E, Figure 2). In 2018, winter wheat was grown as a preceding crop on the plot. The trial was established in 2019. According to agroecological classification, the plot is located in a region typical for the cultivation of root crops (e.g., sugar beets) in a mildly warm and mildly dry climatic zone at an altitude of 290 m above sea level, with a mean annual temperature of 8.95 °C and a long-term total annual precipitation of 525.6 mm (the values correspond to the climatic norm of 1981–2010). The geological bedrock is composed of loess and loess loam of the Bohemian Massif, and the soil type is Haplic Luvisol. Basic information about the characteristics of the arable land on the experimental plot can be found in Table 1. The meteorological and climatological parameters are shown in Figure 3.

2.3. Local Climate

The Troubsko site is located southwest of Brno, in the northern part of the Pannonian thermophytic zone. It belongs to the beet production area, with an altitude of 270 m and an average annual temperature of 8.6 °C, 14.8 °C in vegetation (April–September). The temperature and precipitation data for the Troubsko experimental station were taken from 1961 to 1990 by a standard meteorological station run by the Czech Hydrometeorological Institute on the Agricultural Research Ltd. site in Troubsko, Czech Republic (49.164128° N, 16.511900° E).
The temperature and precipitation data show that 2019 was exceptionally warm, and precipitation reached a long-term average value (Figure 3). High air temperature was reached mainly in the first part of the year and during the growing season (April–September) as well. Despite the normal rainfall pattern, a lack of moisture was apparent in the fields because of increased transpiration and evapotranspiration due to the high air temperature (evaluated according to WHO methodology by [22].

2.4. Measurements of Microclimate

For microclimate measurements, a standard weather station (EMS, Brno, Czech Republic) monitoring air temperature and humidity was used, along with a photosynthetically active radiation (PAR) incident on the upper canopy (height of 2 m) in 10 min intervals. Based on the data, daily courses of air, T, RH and PAR were plotted and analysed.

2.5. Measurements of OJIPs and OJIP-Derived Parameters

To determine changes in photosynthesis at the level of photosystem 2, fast chlorophyll fluorescence kinetics (OJIP) were measured using a handy fluorometer FluorPen (FP-100, Photon Systems Instruments, Drásov, Czech Republic) in the morning (typically 8:30 to 11:00 CEST) at the beginning, and on the 2nd, 5th, 7th, 9th, 12th, 14th, 16th, 19th, 21st and 23rd days of the monitored period. The measurements were done on the third fully matured upper leaf (counted from the top), determined for all variants at the beginning, and remained the same throughout the measuring period of the experiment. For each plant species and the day of measurements, 5 replicates of OJIP curves were measured on different leaves. Measuring protocol started with a predarkening period of 15 min in the darkening clip, then OJIP kinetics were recorded (2 s, standard FluorPen OJIP protocol). The measured kinetics were analyzed, and OJIP-derived parameters were calculated using FluorPen software (v. 1.1, Photon Systems Instruments, Drásov, Czech Republic) according to equations published by [15]. The overview of the parameters used in the study are presented in Table 2.
In order to determine the main driving factors limiting primary photosynthetic processes (OJIP-derived parameters), correlations between selected OJIP-derived parameters (FV/FM, PIABS, ET0/RC, and DI0/RC-dependent variables) and the following independent variables were evaluated by STATISTICA package: (1) mean air temperature of the day before chlorophyll fluorescence measurements, (2) mean PAR of the day before measurements, (3) mean RH of the day before measurement, (4) maximum air temperature of the day before measurements, (5) maximum RH of the day before measurements, (6) minimum air temperature of the day before measurements, (7) minimum RH of the day before measurements, (8) mean air temperature of the period of measurement (7:00 to 11:00 a.m. of particular day), (9) mean PAR of the period of measurement, (10) mean RH of the period of measurement, (11) maximum air temperature of the period of measurement, (12) maximum PAR of the period of measurement, (13) maximum RH of the period of measurement, (14) minimum air temperature of the period of measurement, (15) minimum PAR of the period of measurement and (16) minimum RH of the period of measurement.

2.6. Light Response Curve Analysis

To determine changes in the rate of photosynthesis to irradiance, the light response curves were measured. The method is based on the successive effective quantum yield measurement of the sample when exposed to a stepwise increase of light intensity. The measurements were taken using a predefined protocol by the FluorPen fluorometer. The effective quantum yields were measured after each 60 s period of exposition by light intensities of 10, 20, 50, and 100 μmol m−2 s−1. The measurements were done each measuring day (2nd, 5th, 7th, 9th, 12th, 14th, 16th, 19th, 21st and 23rd) of the monitored period. For each treatment, i.e., for (1) maize (SM), (2) maize and white sweetclover (MM) and (3) maize and white lupin (ML), the best and worst curves were selected (considering the highest and lowest ETRmax values reached s) and the alpha parameter, i.e., maximum slope of the ETR to PAR relationship found at low light intensities, was also evaluated.

2.7. Biomass Determination

Above-ground biomass (dry mass) was harvested at the end of the experiment (mid-August) and estimated for Z. mays grown in the three systems: SM, MM, ML. Additionally, above-ground biomass of Melilotus albus in the MM intercropping system and Lupinus sp. grown in the ML intercropping system were evaluated.

2.8. Statistical Analysis

To calculate the statistical significance of the differences found in chlorophyll fluorescence parameters as dependent on the day of measurement and the intercropping system, one-way ANOVA was used (STATISTICA vs. 14, StatSoft-TIBCO Software Inc., Prague, Czech Republic).

3. Results

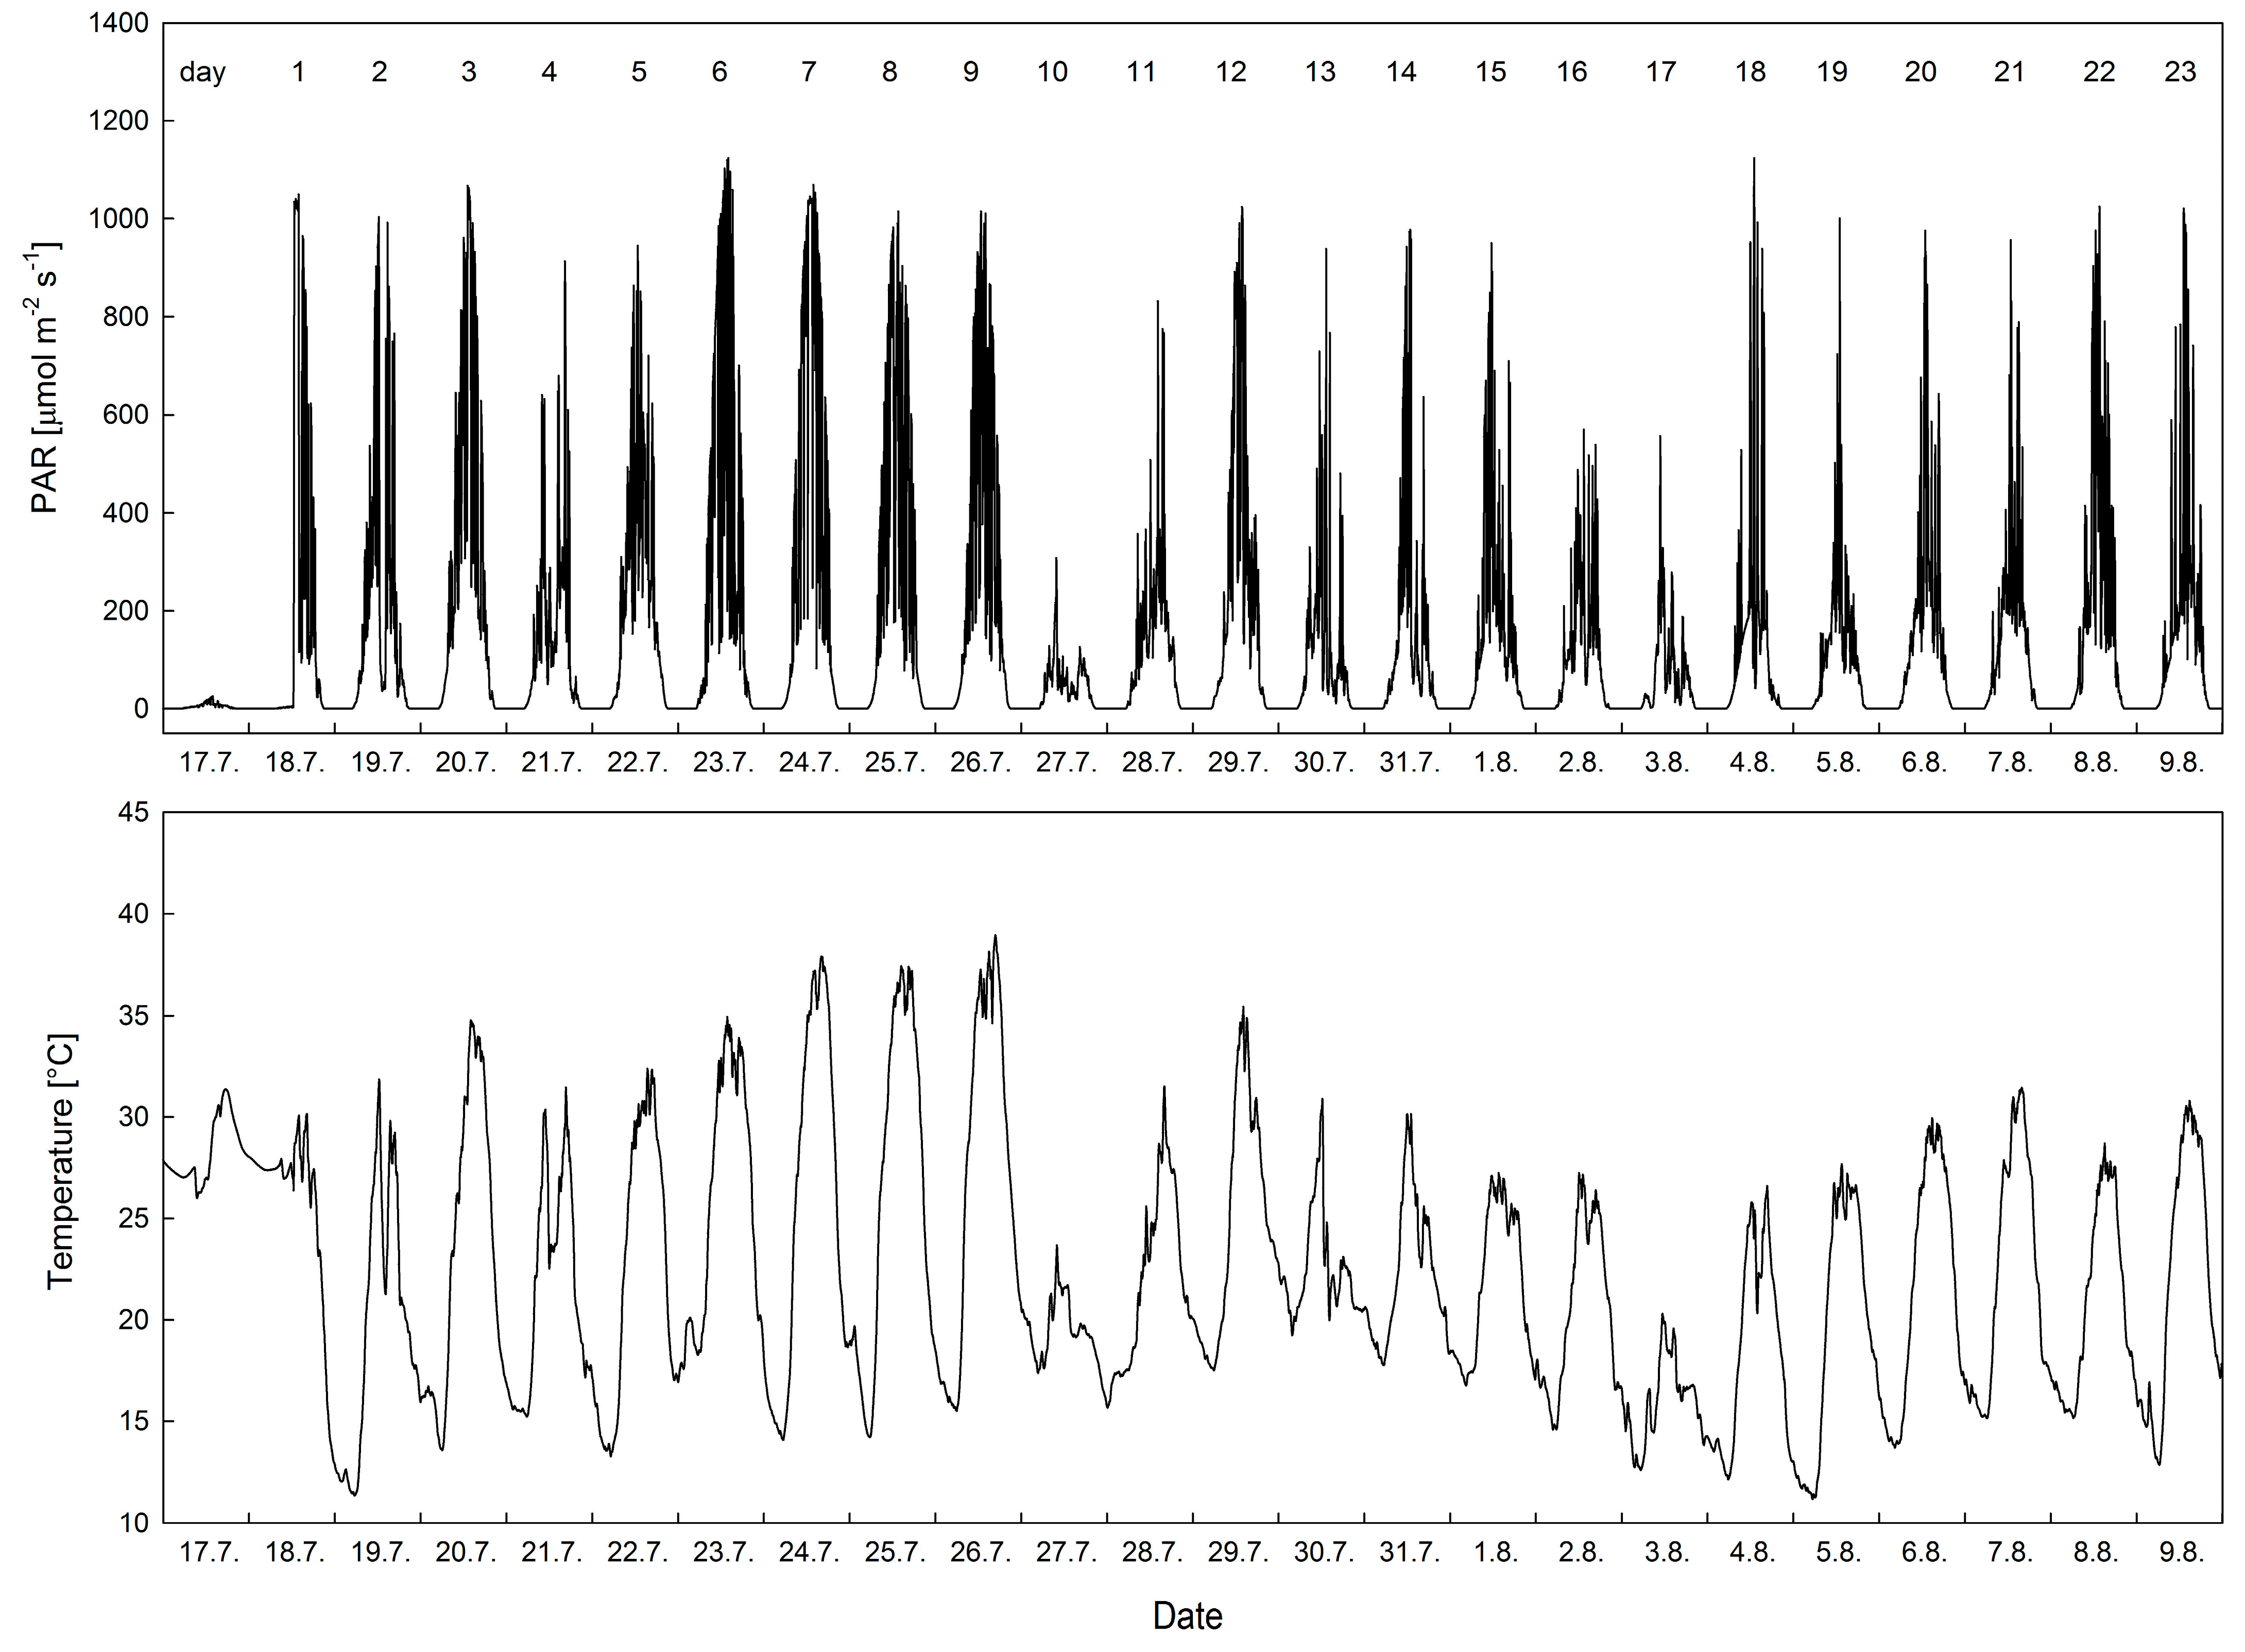
3.1. Local Microclimate

Air temperature varied in the experimental period according to the prevailing weather. In the period from 19 July to 27 July, warm days showed daily maxima ranges between 31.2 and 37.3 °C. The daily minima varied within the range of 12.5 to 14.1 °C. Partly to fully sunny days were typical of this particular period, especially in the subperiod of 23 July to 26 July. Overcast weather recorded on 27 July led to a decrease in air temperature, showing a maximum of 22.1 °C. Then, in the period of 28 July to 2 August, intermediate weather was typical in the form of partly sunny days with slightly decreasing daily maxima for PAR and air temperature. At the end of this period, another overcast day appeared on 3 August, with daily minimum/maximum values of 13.2/20.0 °C. The third period (4–9 July) was marked by gradual increases in air temperature, with daily maxima above 25 °C and minima ranging between 10.5 and 15.1 °C. Generally, the whole experimental period saw warm weather with low values of air relative humidity (RH minima below 23% in hot sunny days, data not shown).

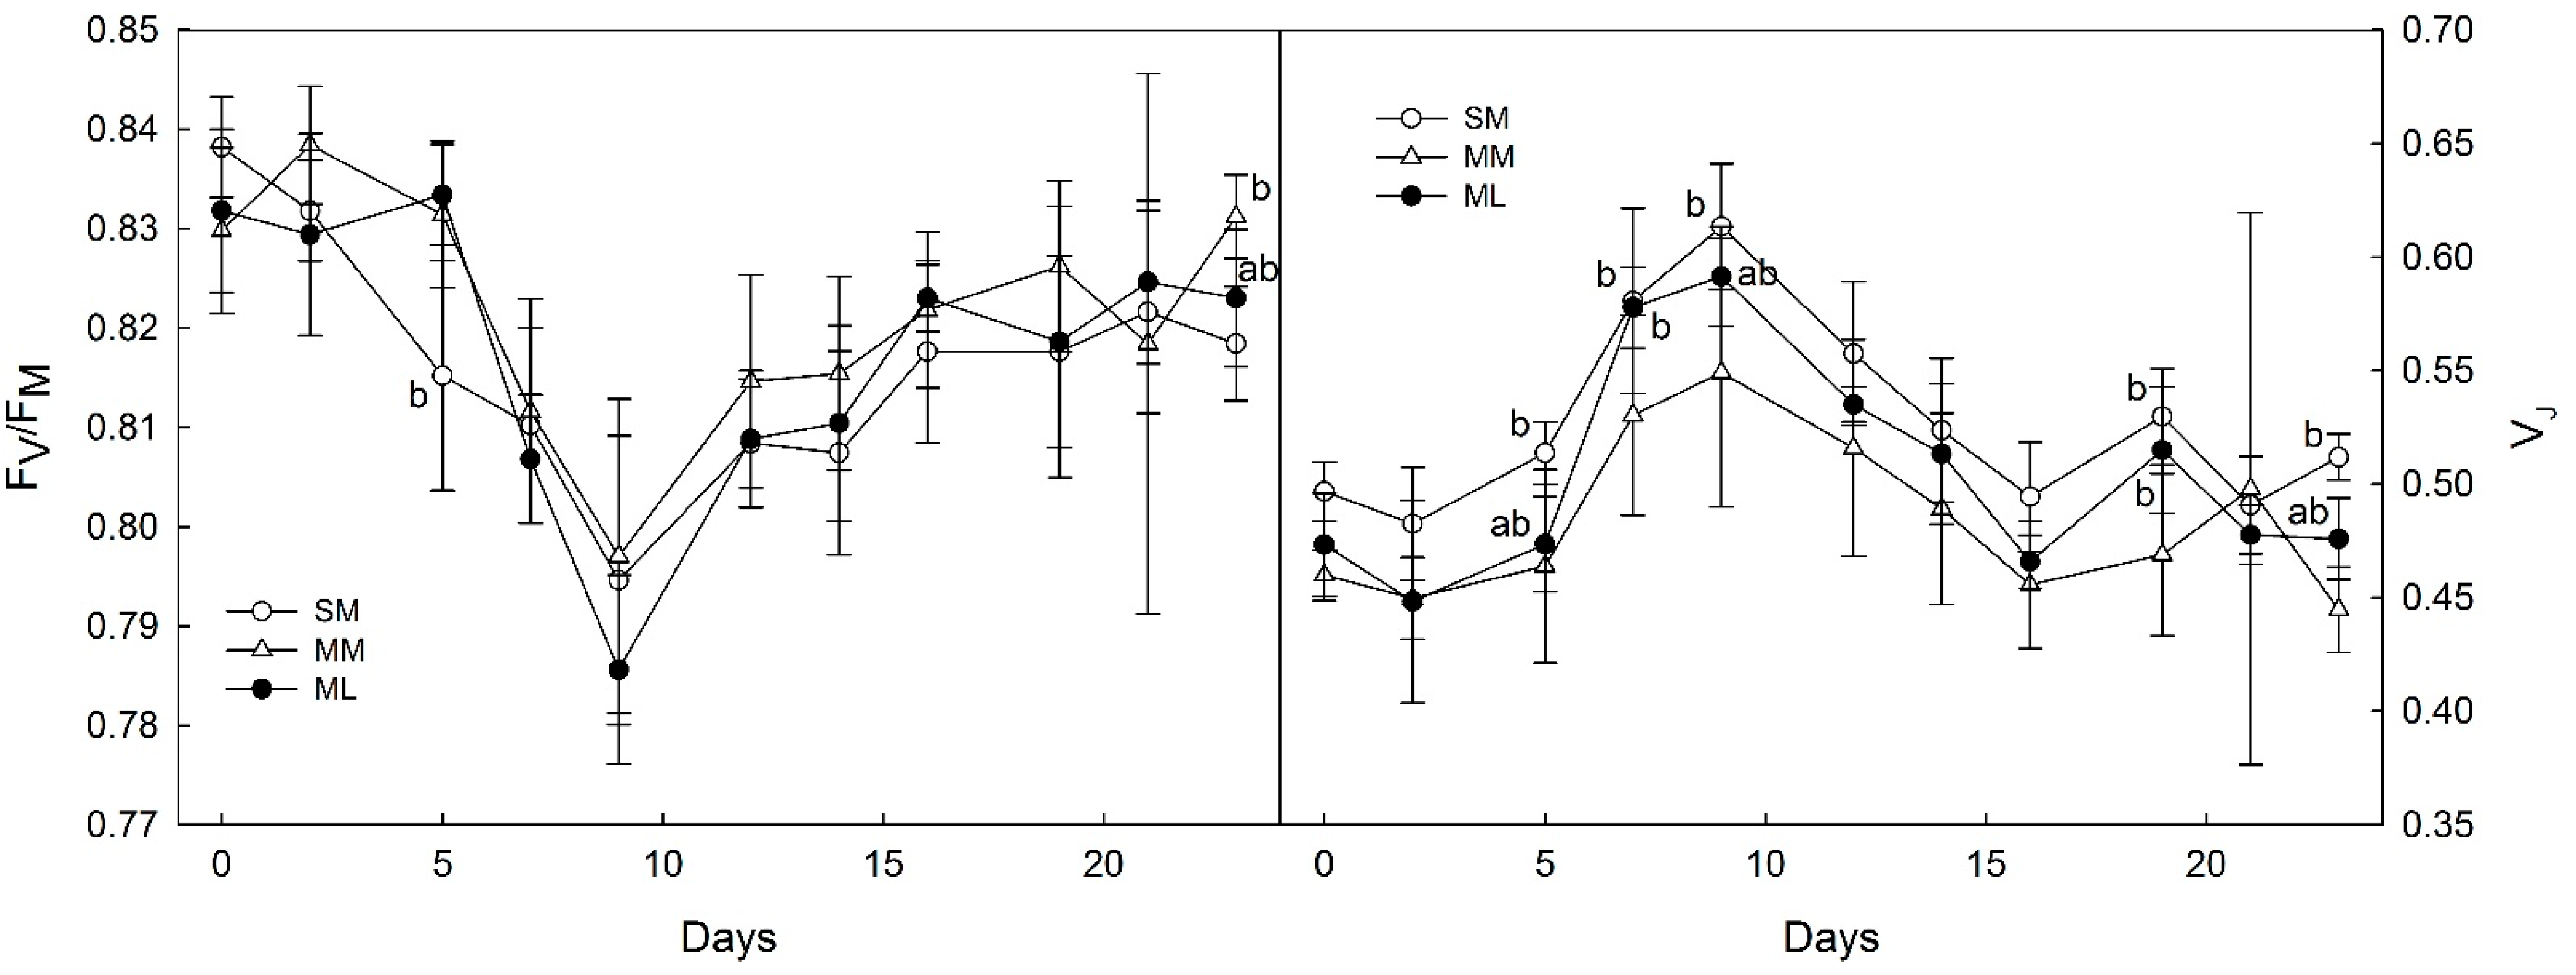
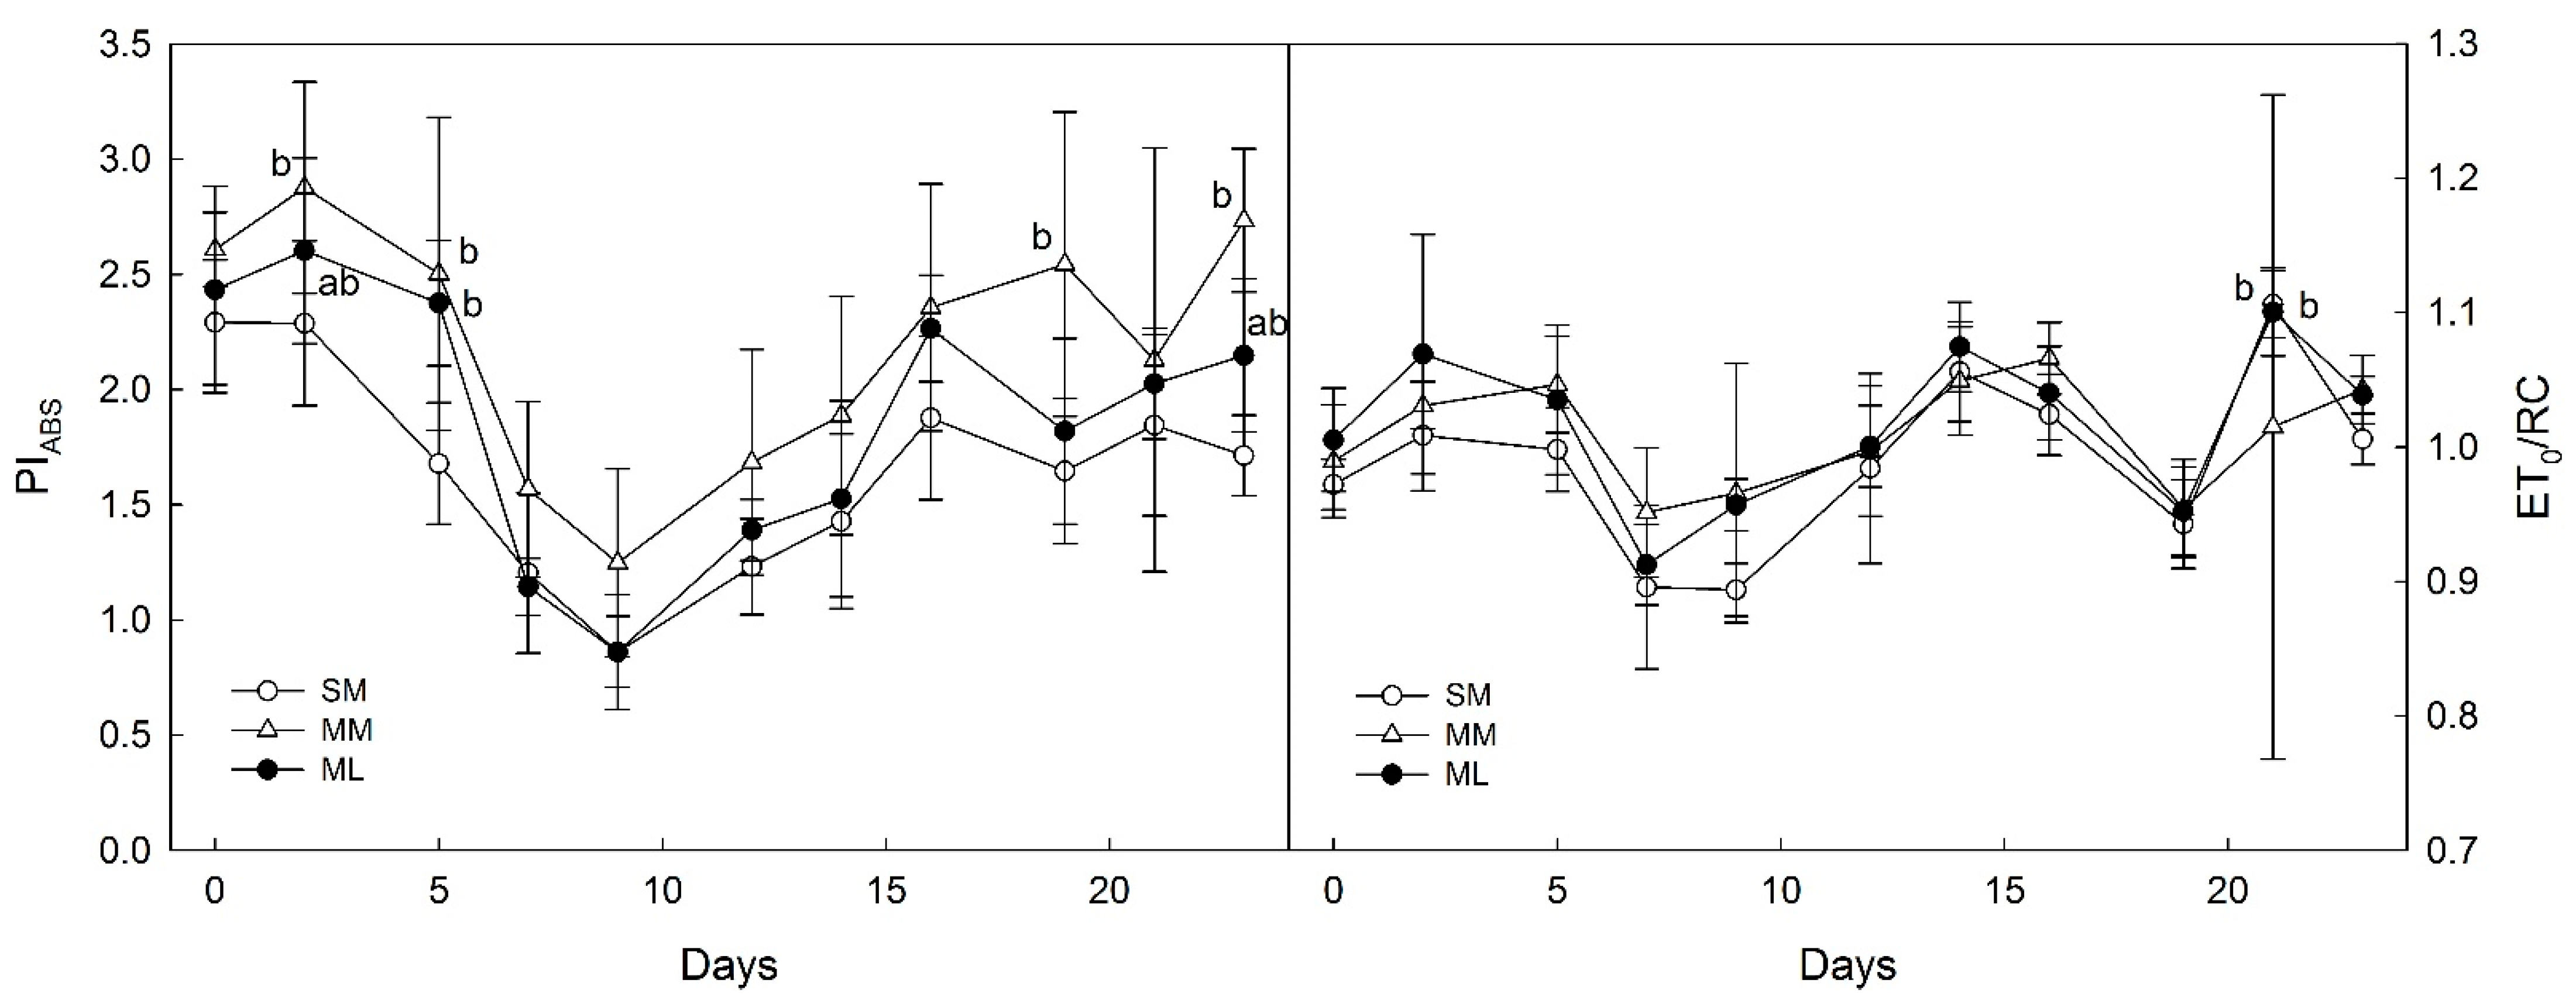
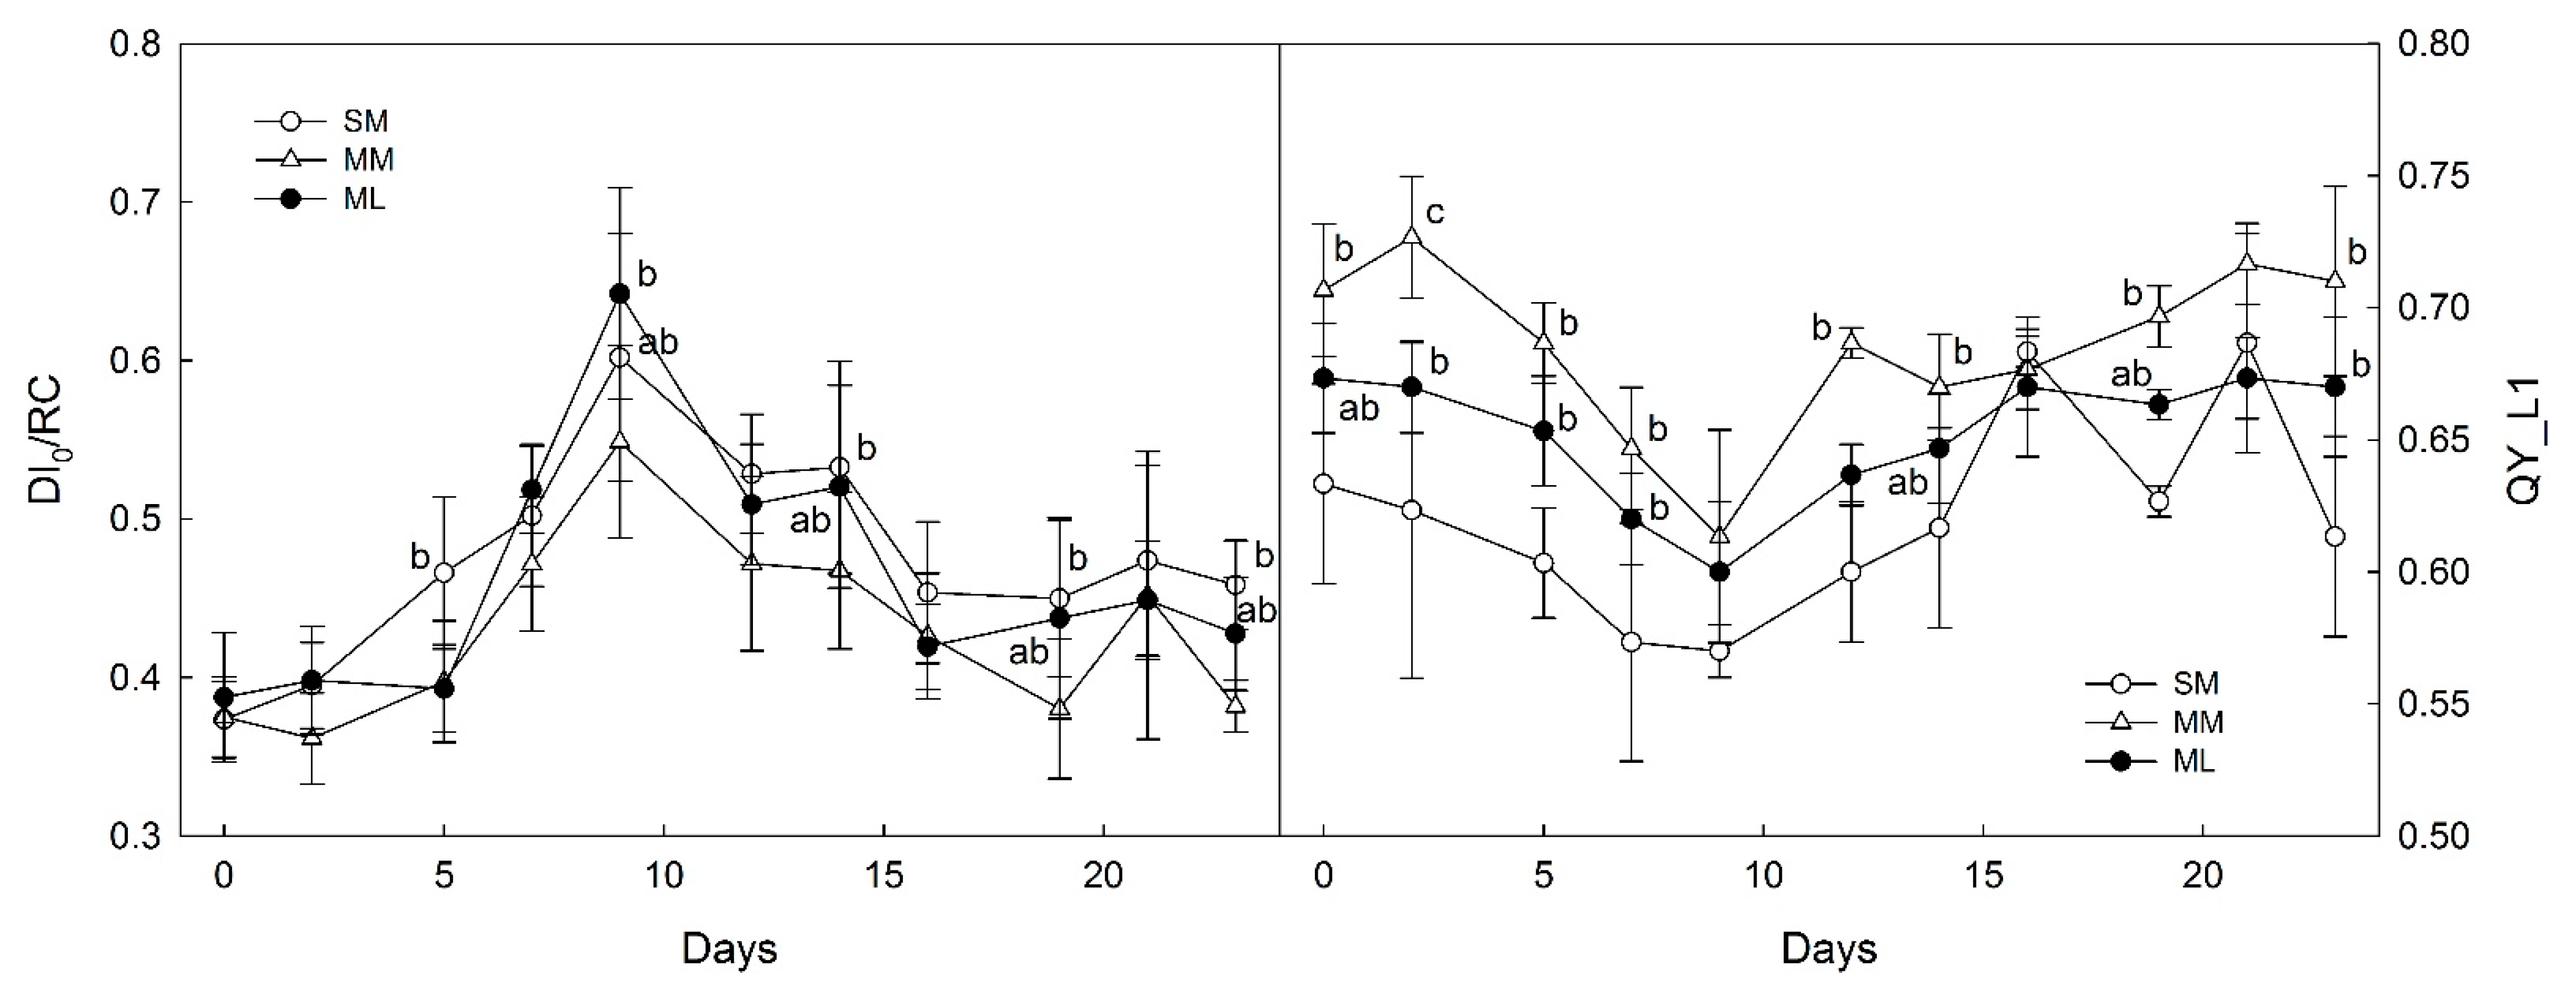
3.2. OJIP-Derived Parameters of Photosynthesis

The values of the maximal quantum yield of PSII fluorescence (FV/FM, Figure 4) varied from 0.786, i.e., the minimum recorded on the 9th day for the SM system (Zea mays alone), to a maximum of 0.838 recorded in the 2nd day for the MM intercropping system (Zea mays with Melilotus albus). All monitored treatments followed a similar trend with a decrease from the beginning (day 0) to 9th day, and a subsequent gradual rise until the end of the monitoring period. Throughout the monitoring period, FV/FM recorded for the ML treatment (Zea mays with Lupinus sp.) showed somewhat higher values than the other two.
Double-normalized fluorescence at J-step (VJ, Figure 4) showed variation between 0.445, a minimum that was found on the 23rd day of the MM intercropping system, to a maximum of 0.613 that was recorded on the 9th day for Zea mays alone (SM). The VJ time course showed an initial plateau until the 5th day, with a subsequent rise which followed until the 9th day, and then a decrease until the 16th day. More or less constant VJ was found at the end of the monitored period. The three treatments, i.e., the SM, MM and ML systems, followed the same time courses.
The performance index (PIABS, Figure 5) showed similar time courses as FV/FM within the monitored period. An initial plateau was typical of the time course, followed by a decrease found between the 5th and 9th day and a subsequent increase until the 16th day. The maximum of 2.876 was recorded on the 2nd day for the MM treatment, and a minimum of 0.861 showed for Zea mays alone on the 5th day. The photosynthetic electron transport flux per RC (ET0/RC, Figure 5) varied from a minimum of 0.894, recorded on the 9th day for Zea mays alone, to a maximum of 1.069, found on the 2nd day for the ML intercropping system. The ET0/RC time course exhibited a slight initial rise until the 5th day and was then followed by a decrease until the 7th day. Another rise in ET0/RC was found until the 12th day, then ET0/RC decreased until the 16th day, followed by a final slight rise.
The flux of dissipated excitation energy per RC (DI0/RC, Figure 6) showed in the initial plateau with the overall minimum found on the 2nd day for the MM intercropping system, followed by a rise to the maximum of 0.642 for the ML system (0.602 for SM and 0.549 for MM) on the 9th day. Then, the values gradually decreased until the end of the monitored period, reaching a minimum close to the initial values. The effective quantum yield (ΦPSII, OY_L1, Figure 6) varied between 0.570 (the minimum for the SM treatment on the 9th day) and 0.727 (the maximum for the MM on the 2nd day). For the three treatments, ΦPSII showed a decrease from the beginning to the 9th day, followed by an increase to initial values found on the 14th (SM, ML) to the 16th day (MM).
Air temperature and PAR had the most significant effects on the OJIP-derived chlorophyll fluorescence parameters related to primary photochemistry (FV/FM, PIABS, ET0/RC, and DI0/RC) as seen from Table 3. Typically, temperature and PAR on the day preceding the day of measurement had a stronger effect than those evaluated for the period of the measurement. Relative air humidity had lower effects, if any, on the above-mentioned chlorophyll fluorescence parameters.
ETR curves recorded on the days with different microclimatological characteristics showed a contrasting course and shape. The best ETR curves (those having the largest value of ETRmax) were recorded on 29 or 31 July, i.e., day 12 and 14. The microclimate of the days was typical of PARmax ranging 900–1000 μmol m−2 s−1 (see Figure 7) and daily mean temperature of 25 °C. The worst ETR curves were recorded on days 19 to 23 which were typical by comparable PARmax but lower daily means of temperature. The latter ones were typical of a reduction of ETRmax values found at 100 µmol m−2 s−1. For the first category of days, the best ETR curve showing the highest ETR values was found and presented in Figure 8. Photosynthetic performance based on ETRmax values was found to be best in the intercropping system of maize with Melilotus albus, followed by the maize with Lupinus sp. and maize alone. For the second category of days, the difference between ETRmax found for particular intercropping systems was smaller, however, the values found for maize were lower than for the other two intercropping systems.
Above-ground biomass expressed in dry mass per hectare reached the values presented in Table 4. When considering maize biomass, it reached the highest value in SM, followed by the ML and MM intercropping systems. When considering overall biomass (including maize plus particular intercropping species), it was highest in the MM, followed by ML an SM treatments.

4. Discussion

4.1. Microclimate

The effects of the microclimate on the parameters related to the primary processes of photosynthesis in Zea mays were apparent mainly during the episodic warm weather (days 6–9) and the other period (days 20–25, i.e., 4–9 July) marked by a gradual increase in air temperature. The first period caused a significant decrease in the chlorophyll fluorescence parameters derived from OJIP, indicating a strong limitation of primary photosynthetic processes. The latter period caused a limitation of parameters derived from ETR light response curves.

4.2. Photosynthetic Parameters Derived from OJIPs

Intercropping of maize with both Lupinus sp. and Melilotus albus brought about an increase in PIABS and ET0/RC, which can be explained as an intercropping species-dependent increase in energy flow through PSII and thylakoidal electron carriers in chloroplast. In this concept, an increased ATP and NADPH formation and their utilization in the biochemical processes of photosynthesis might be expected. Effective utilization of absorbed light energy in PSII and the (photosynthetic) linear electron flow in maize with MM treatment might be supported by the fact that thermal dissipation (DI0/RC) reached lower values in the MM than in the SM treatment.
Time courses of the OJIP-derived chlorophyll fluorescence parameters revealed a markable decrease of FV/FM, PIABS and ET0/RC found on day 9. This decrease might be attributed to a limitation of PSII function, caused by two stress factors—high air temperature (over 35 °C—see Figure 7) accompanied by low RH (below 20%). The air temperature and PAR of the day before the day of measurements had a similar role in the limitation of the above OJIP-derived parameters. The effects (on OJIPs) of air temperature and PAR recorded for the period of measurement were not that apparent. This might be attributed to the fact that the measurements were done before 11:00 local time. Therefore, the plants did not witness the midday, and possibly even afternoon, depression of photosynthesis on the day of measurements. However, direct effects of air temperature on the day of measurements were also apparent. A high temperature-induced decrease in FV/FM, PIABS and ET0/RC found on day 9 is consistent with the evidence reported for plants treated by high temperatures [23] and have been interpreted as a direct effect of high temperature on inhibition of PSII. These negative changes to PSII functioning are typically reflected in a high temperature-induced decrease of chlorophyll fluorescence, which is demonstrated as a flattening of the OJIP curves [24] and an increase in VJ chlorophyll fluorescence signal (see Figure 4). Apart from temperature, low RH is reported to cause ET0/RC decline [25].
In the intercropping system of maize with Lupinus sp. and Melilotus albus, the microclimate of the stands was affected mainly by the shading effects of maize. Maize plants were always taller than the other two intercrop species, which resulted in a high absorption of incident PAR and, therefore, the limited availability of PAR to the two species (data not shown). The change in microclimate caused by the maize canopy is reported from several intercropping systems. Liu and Song (2012) [26] refer to absorption higher than 50%. Consequently, changes in air temperature and relative air humidity appeared in the lower part of the Zea mays canopy, as well as in the canopy of Lupinus sp. and Melilotus albus in the ML and MM systems. Such a phenomenon is well documented, for example, in maize-soybean intercropping systems [27] and is dependent mainly on dimensions, growth rate of the target species (maize), row spacing and their azimuthal orientation [28]. In our study, PAR absorption by maize rows caused a light microclimate good enough for the successful growth and development of Lupinus sp. and Melilotus albus, which affected the microclimate (T and RH in particular) of the lower layer of the maize canopy. These changes were beneficial for maize photosynthesis and growth since the majority of the OJIP-derived parameters related to PSII functioning showed higher values for ML and MM systems than for maize alone. The intercropping-induced increase in the photosynthetic performance of maize has also been reported by [9] and attributed to a higher water use efficiency of maize cultivated in an intercropping system. Similarly, ref. [29] brought the evidence of the higher photosynthetic performance of maize when intercropped with soybeans, which is consistent with our results. However, it still remains an open question whether or not this is a consequence of the water efficiency of maize. Both a lower [30] and higher [31] lack of complementary water use in intercropped maize has been reported. The effect of the MM system on F0 decrease in maize plants (compared to SM and ML) remains unknown, however, it might be attributed to the generally good performance of primary photosynthetic processes in the PSII of the MM plants.

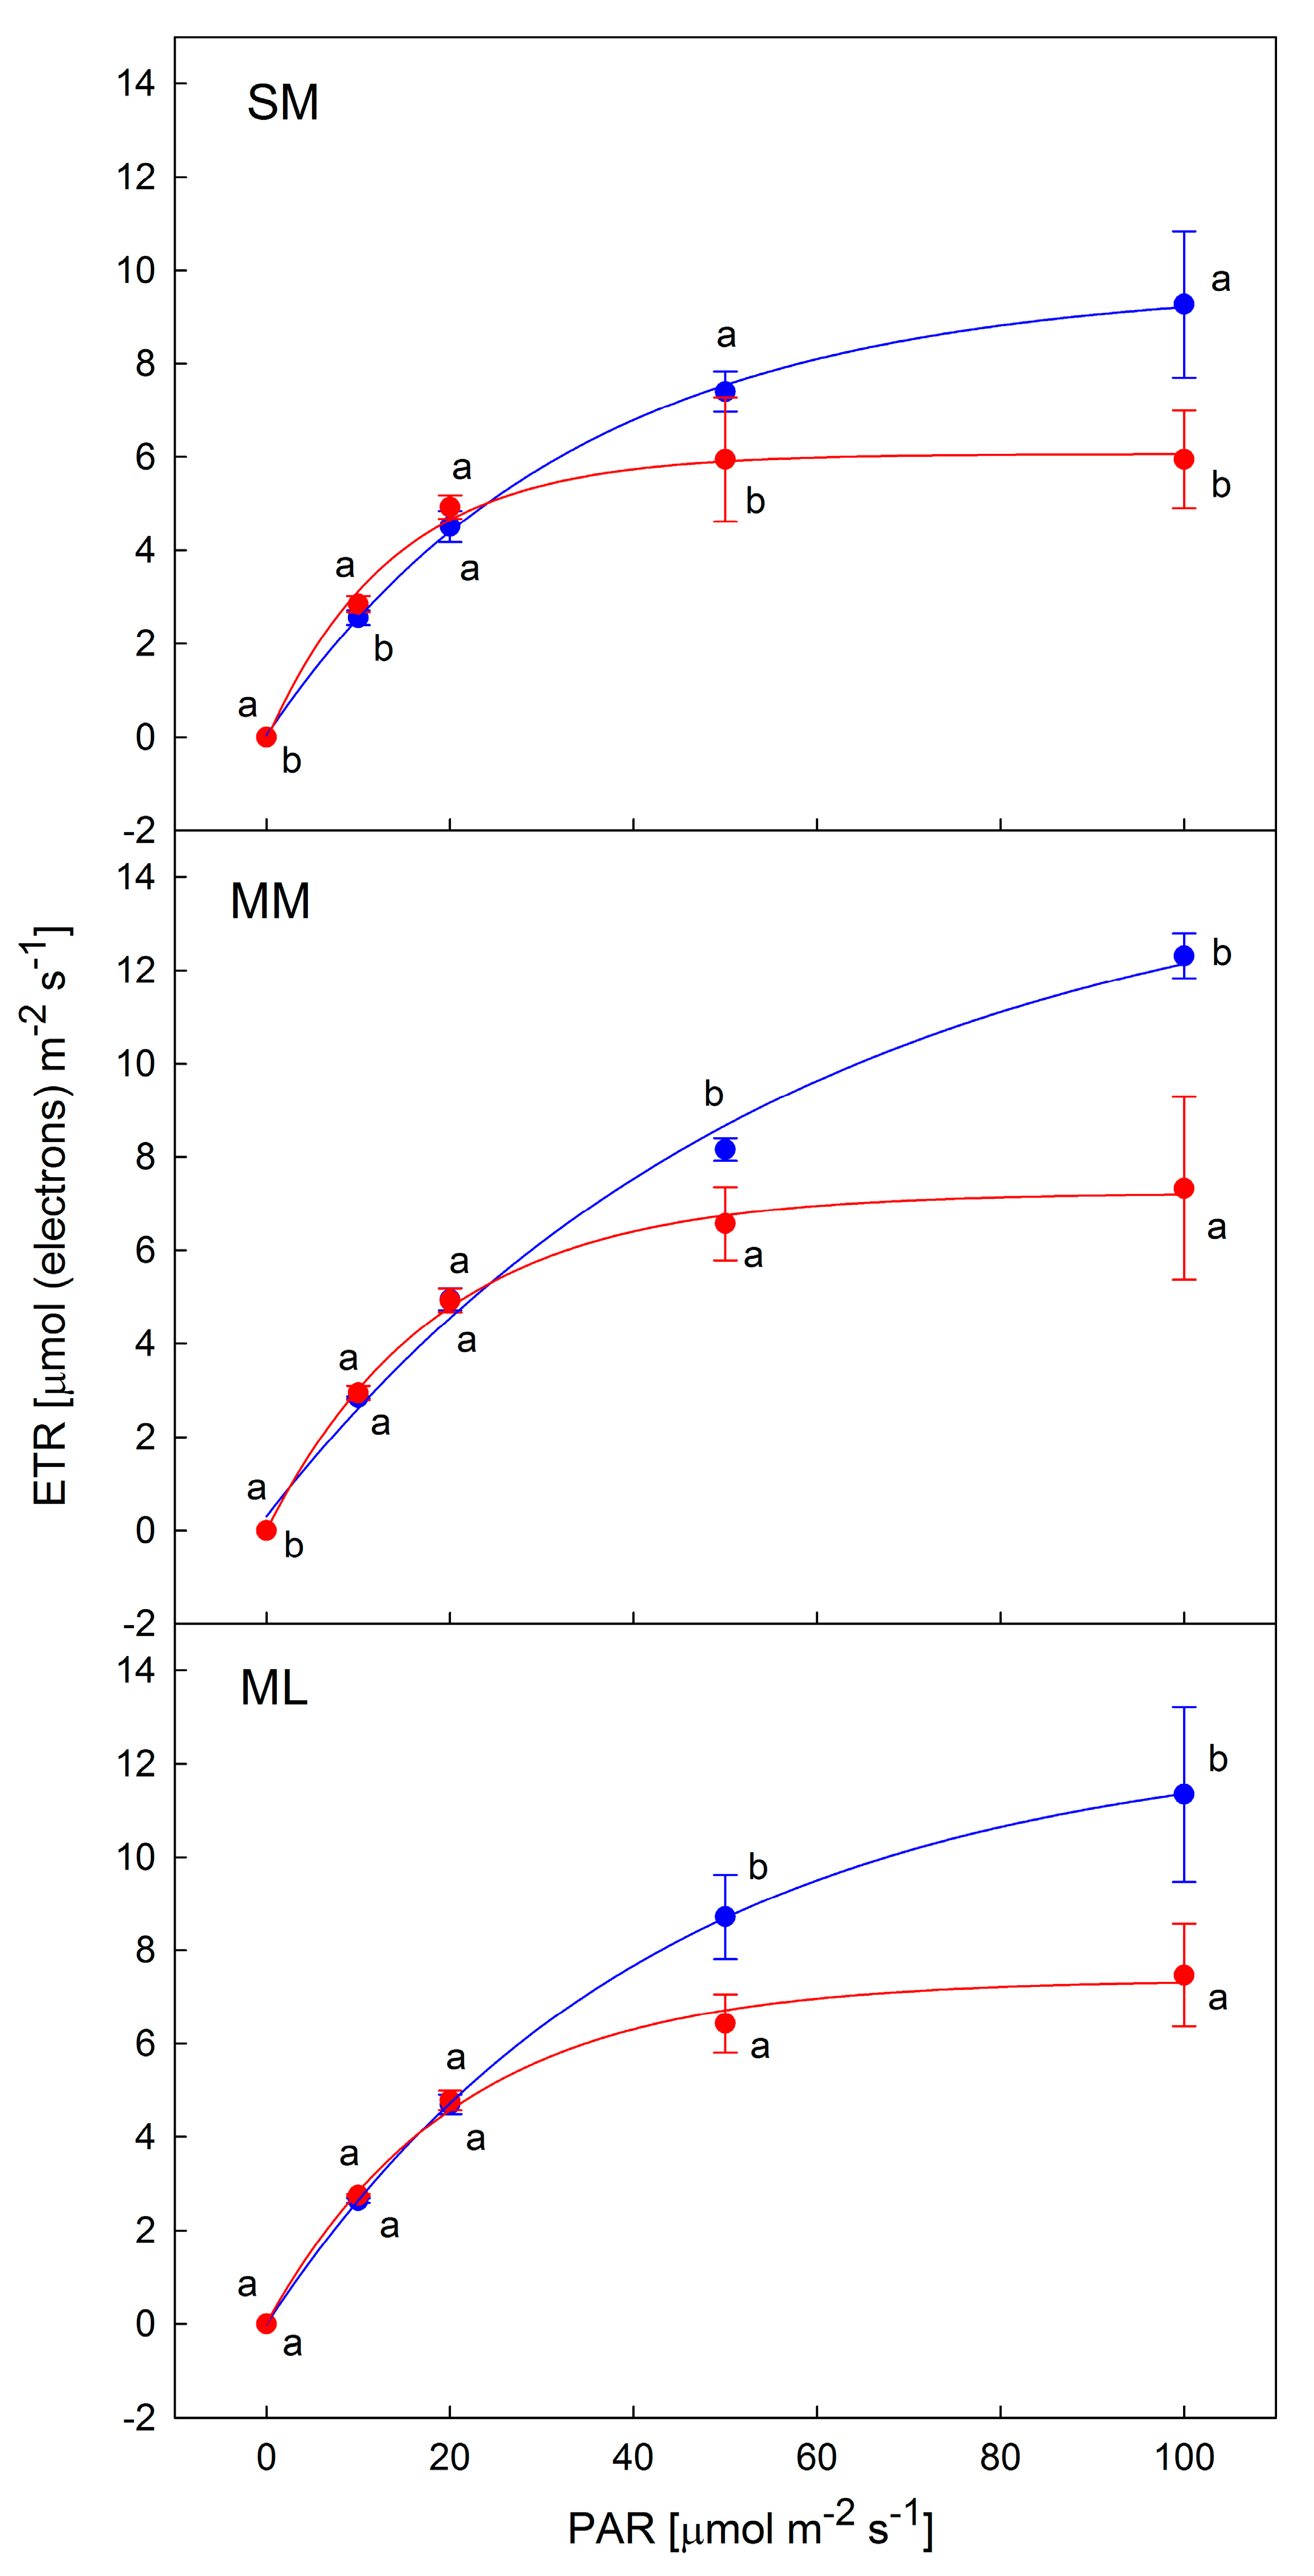
4.3. Light Response Curves of ETR

Our data indicated the negative effect of air temperature on photosynthetic ETR curves. The best curves, achieved at optimum leaf temperature, (see Figure 8) showed somewhat higher ETR values for Zea mays with white sweetclover (MM) than the other two (Zea mays with Lupinus sp. (ML). and Zea mays alone (SM)). This suggests that the photosynthetic linear electron transport rate works more efficiently for Zea mays with Melilotus albus. At high temperatures (days 6–8, Figure 7), ETR values were found to be lower in the light response curves. This might be attributed to the fact that the primary photochemical reactions in PSII, as well as the carbon fixation rate in the stroma of chloroplasts, have been reported to be the primary sites of injury [32]. Therefore, due to the high-temperature-induced inactivation of PSII, photosynthetic activity was inhibited and ETR reduced [33]. Furthermore, due to the high-temperature-induced decrease in the activity of Rubisco, CO2 metabolism is reduced as well. These metabolic changes result in a decrease in photosynthetic capacity and photochemical efficiency [34,35]. Such an interpretation is supported by evidence from laboratory-based experiments that showed chlorophyll fluorescence-based ETR decline in plants treated by temperatures above the photosynthetic optimum [36]. Recently, attempts were made to evaluate the light response curves of the net photosynthetic CO2 assimilation rate from ETR data [37], with emphasis given to the effect of high leaf/air temperature on the limitation of photosynthesis. Lowest ETR values (worst curves, Figure 8) were found, however, on the day with a relatively low air temperature, i.e., August 4th to 9th (i.e., days 20–25 of the experiment). This indicates a limitation in photosynthetic performance by another co-acting factor. The most limiting factor for ETR was soil moisture, which decreased dramatically from the 4th to the 9th (data not shown). A decrease in soil humidity typically leads to drought stress in plants and the severe limitation of photosynthesis due to decreased stomatal conductance, as shown earlier for numerous crops [14] including maize [38,39,40].
In spite of significant positive differences found in photosynthetic parameters in Z. mays intercropped with legumes, our data did not show any statistically significant increase in biomass production and grain yield of Z. mays. If an assumption of a positive relation between primary photochemical photosynthetic processes (measured in our study) and biochemical processes related to CO2 fixation is made, then, a question arises where the extra assimilates are utilized or allocated in Z. mays. Similar study with sole maize and maize–legume intercropping systems [41] found that the intercropping legume did not affect maize growth and biomass. The authors reported even decreased biomass and grain production in Z. mays in the intercropping system with a legume. This is in agreement with the review of [42] which reported that the advantages of monocropping yield benefits over the maize/legume can be attributed to the interspecific competition for space, nutrients, water and light.

5. Conclusions

Maize row-intercropping systems with the two flowering legume plants tested in our experiment have proven that the use of Lupinus sp. and Melilotus albus as intercrops may be an alternative to sole maize cropping. It might be supported by the fact that Zea mays photosynthetic parameters related to the performance of PSII reached higher values in intercropping systems with Lupinus sp. and Melilotus albus than in a maize monoculture. This is consistent with the recent study of [41] that stated higher net photosynthesis Z. mays intercropped with a cowpea (legume) than in sole maize. It might also be concluded that the two cropping partners can mitigate negative environmental impacts and even create a microclimate beneficial for Zea mays photosynthesis and productivity. Additionally, the two cropping partners have a positive effect on soil sustainability, since they protect the agroecosystem from erosion. Therefore, legumes are considered as prospective plants for soil conservation systems used in future agricultural practices in order to improve soil quality properties [43].

Author Contributions

Conceptualization—J.L., A.K., J.E. and P.V.; methodology—J.L. and P.V.; investigation—J.L., M.B. and J.H.; data curation—J.L., P.V., B.Z. and J.E.; writing, review and editing—M.B. and J.H.; visualization—A.K., J.E. and J.H. All authors have read and agreed to the published version of the manuscript.

Funding

The study referred to in this paper was supported by the framework of the Institutional Support for Long-Term Conceptual Development of a Research Organization (DKRVO), reg. no. MZE-RO1722, funded by the Ministry of Agriculture of the Czech Republic.

Data Availability Statement

Data available upon request directed to the main author (Jaroslav Lang, [email protected]).

Acknowledgments

The authors express their thanks to the above-specified funding that supported the experiments referred to in this study.

Conflicts of Interest

The authors declare no conflict of interest.

References

  1. Schulz, V.S.; Schumann, C.; Weisenburger, S.; Müller-Lindenlauf, M.; Stolzenburg, K.; Möller, K. Row-intercropping maize (Zea mays L.) with biodiversity-enhancing flowering-partners—Effect on plant growth, silage yield, and composition of harvest material. Agriculture 2020, 10, 524. [Google Scholar] [CrossRef]
  2. Kintl, A.; Vítěz, T.; Elbl, J.; Vítězová, M.; Dokulilová, T.; Nedělník, J.; Skladanka, J.; Brtnický, M. Mixed culture of corn and white lupine as an alternative to silage made from corn monoculture intended for biogas production. BioEnerg. Res. 2019, 12, 694–702. [Google Scholar] [CrossRef]
  3. Kintl, A.; Elbl, J.; Vítěz, T.; Brtnický, M.; Skládanka, J.; Hammerschmiedt, T.; Vítězová, M. Possibilities of using white sweetclover grown in mixture with maize for biomethane production. Agronomy 2020, 10, 1407. [Google Scholar] [CrossRef]
  4. Turkington, R.; Cavers, P.; Rempel, E. The biology of Canadian weeds. 29. Melilotus alba Desr. and M. officinalis (L.) Lam. Can. J. Plant Sci. 1978, 58, 523–537. [Google Scholar] [CrossRef]
  5. Kadaňková, P.; Kintl, A.; Koukalová, V.; Kučerová, J.; Brtnický, M. Coumarin content in silages made of mixed cropping biomass comprising maize and white sweet clover. In Proceedings of the 19th International Multidisciplinary Scientific GeoConference, Sofia: Surveying Geology & Mining Ecology Management (SGEM) 2019, Albena, Bulgaria, 28 June 2019; pp. 115–121. [Google Scholar] [CrossRef]
  6. Kintl, A.; Huňady, I.; Holátko, J.; Vítěz, T.; Hammerschmiedt, T.; Brtnický, M.; Ondrisková, V.; Elbl, J. Using the mixed culture of fodder mallow (Malva verticillate L.) and white sweet clover (Melilotus albus Medik.) for methane production. Fermentation 2022, 8, 94. [Google Scholar] [CrossRef]
  7. Suárez, J.C.; Anzola, J.A.; Contreras, A.T.; Salas, D.L.; Vanegas, J.I.; Urban, M.O.; Beebe, S.E.; Rao, I.M. Influence of simultaneous intercropping of maize-bean with input of inorganic or organic fertilizer on growth, development, and dry matter partitioning to yield components of two lines of common bean. Agronomy 2022, 12, 1216. [Google Scholar] [CrossRef]
  8. Wang, Q.; Sun, D.; Hao, H.; Zhao, X.; Hao, W.; Liu, Q. Photosynthetically active radiation determining yields for an intercrop of maize with cabbage. Eur. J. Agron. 2015, 69, 32–40. [Google Scholar] [CrossRef]
  9. Li, Y.H.; Shi, D.Y.; Li, G.H.; Zhao, B.; Zhang, J.W.; Liu, P.; Ren, B.Z.; Dong, S.T. Maize/peanut intercropping increases photosynthetic characteristics, 13C-photosynthate distribution, and grain yield of summer maize. J. Integr. Agric. 2019, 18, 2219–2229. [Google Scholar] [CrossRef]
  10. Ofori, F.; Stern, W. Relative sowing time and density of component crops in a maize/cowpea intercrop system. Exp. Agric. 1987, 23, 41–52. [Google Scholar] [CrossRef]
  11. Hauggaard-Nielsen, H.; Andersen, M.K. Intercropping grain legumes and cereals in organic cropping systems. Grain Legumes 2000, 30, 18–19. [Google Scholar]
  12. Brooker, R.W.; Bennett, A.E.; Cong, W.-F.; Daniell, T.J.; George, T.S.; Hallett, P.D.; Hawes, C.; Iannetta, P.P.M.; Jones, H.G.; Karley, A.J.; et al. Improving intercropping: A synthesis of research in agronomy, plant physiology and ecology. New Phytol. 2015, 206, 107–117. [Google Scholar] [CrossRef] [PubMed]
  13. Chen, Z.; Liu, Z.; Han, S.; Jiang, H.; Xu, S.; Zhao, H.; Ren, S. Using the diurnal variation characteristics of effective quantum yield of PSII photochemistry for drought stress detection in maize. Ecol. Indic. 2022, 138, 108842. [Google Scholar] [CrossRef]
  14. Chen, F.; Wang, H.; Zhao, F.; Wang, R.; Qi, Y.; Zhang, K.; Zhao, H.; Tang, G.; Yang, Y. The response mechanism and threshold of spring wheat to rapid drought. Atmosphere 2022, 13, 596. [Google Scholar] [CrossRef]
  15. Strasser, R.J.; Tsimilli-Michael, M.; Srivastava, A. Analysis of the chlorophyll a fluorescence transient. In Chlorophyll a Fuorescence. Advances in Photosynthesis and Respiration; Govindjee, P.G.C., Ed.; Springer: Dordrecht, The Netherlands, 2004; Volume 19, pp. 321–362. [Google Scholar]
  16. Malan, C.; Berner, J.M. Comparative PSII photochemistry of quinoa and maize under mild to severe drought stress. Photosynthetica 2022, 60, 362–371. [Google Scholar] [CrossRef]
  17. Barboričová, M.; Filaček, A.; Mlynáriková Vysoká, D.; Gašparovič, K.; Živčák, M.; Brestič, M. Sensitivity of fast chlorophyll fluorescence parameters to combined heat and drought stress in wheat genotypes. Plant Soil Environ. 2022, 68, 309–316. [Google Scholar] [CrossRef]
  18. Yan, K.; Chen, P.; Shao, H.; Zhao, S.; Zhang, L.; Zhang, L.; Xu, G.; Sun, J. Responses of photosynthesis and photosystem ii to higher temperature and salt stress in Sorghum. J. Agron. Crop Sci. 2012, 198, 218–225. [Google Scholar] [CrossRef]
  19. Khatri, K.; Rathore, M.S. Salt and osmotic stress-induced changes in physio-chemical responses, PSII photochemistry and chlorophyll a fluorescence in peanut. Plant Stress 2022, 3, 100063. [Google Scholar] [CrossRef]
  20. Zhu, L.; Wen, W.; Thorpe, M.R.; Hocart, C.H.; Song, X. Combining heat stress with pre-existing drought exacerbated the effects on chlorophyll fluorescence rise kinetics in four contrasting plant species. Int. J. Mol. Sci. 2021, 22, 10682. [Google Scholar] [CrossRef]
  21. Ayyaz, A.; Farooq, M.A.; Dawood, M.; Majid, A.; Javed, M.; Athar, H.U.; Bano, H.; Zafar, Z.U. Exogenous melatonin regulates chromium stress-induced feedback inhibition of photosynthesis and antioxidative protection in Brassica napus cultivars. Plant Cell Rep. 2021, 40, 2063–2080. [Google Scholar] [CrossRef]
  22. Kožnarová, V.; Klabzuba, J. Recommendation of World Meteorological Organization to describing meteorological or climatological conditions. Plant Prod./Rostl. Výroba 2002, 48, 190–192. [Google Scholar] [CrossRef] [Green Version]
  23. Jedmowski, C.; Brüggemann, W. Imaging of fast chlorophyll fluorescence induction curve (OJIP) parameters, applied in a screening study with wild barley (Hordeum spontaneum) genotypes under heat stress. J. Photoch. Photobiol. B 2015, 151, 153–160. [Google Scholar] [CrossRef] [PubMed]
  24. Chen, S.; Yang, J.; Zhang, M.; Strasser, R.J.; Qiang, S. Classification and characteristics of heat tolerance in Ageratina adenophora populations using fast chlorophyll a fluorescence rise O-J-I-P. Environ. Exp. Bot. 2016, 122, 126–140. [Google Scholar] [CrossRef]
  25. Choi, H.G.; Jeong, H.J. Comparison of chlorophyll fluorescence and photosynthesis of two strawberry cultivars in response to relative humidity. Hortic. Sci. Technol. 2020, 38, 66–77. [Google Scholar] [CrossRef]
  26. Liu, T.D.; Song, F.B. Maize photosynthesis and microclimate within the canopies at grain-filling stage in response to narrow-wide row planting patterns. Photosynthetica 2012, 50, 215–222. [Google Scholar] [CrossRef]
  27. Gao, Y.; Duan, A.; Qiu, X.; Sun, J.; Zhang, J.; Liu, H.; Wang, H. Distribution and use efficiency of photosynthetically active radiation in strip intercropping of maize and soybean. Agron. J. 2010, 102, 1149–1157. [Google Scholar] [CrossRef]
  28. Keshavamurthy; Yadav, J.S. Effect of row direction and row spacing on micro-climate in castor based intercropping system. J. Pharmacogn. Phytochem. 2019, 8, 2167–2170. [Google Scholar]
  29. Pelech, E.A.; Alexander, B.C.S.; Bernacchi, C.J. Photosynthesis, yield, energy balance, and water-use of intercropped maize and soybean. Plant Direct 2021, 5, e365. [Google Scholar] [CrossRef]
  30. Mao, L.; Zhang, L.; Li, W.; van der Werf, W.; Sun, J.; Spiertz, H.L.; Li, L. Yield advantage and water saving in maize/pea intercrop. Field Crops Res. 2012, 138, 11–20. [Google Scholar] [CrossRef]
  31. Zhang, Y.; Duan, Y.; Nie, J.; Yang, J.; Ren, J.; van der Werf, W.; Evers, J.B.; Zhang, J.; Su, Z.; Zhang, L. A lack of complementarity for water acquisition limits yield advantage of oats/vetch intercropping in a semi-arid condition. Agric. Water Manag. 2019, 225, 105778. [Google Scholar] [CrossRef]
  32. Wise, R.R.; Olson, A.J.; Schrader, S.M.; Sharkey, T.D. Electron transport is the functional limitation of photosynthesis in field-grown Pima cotton plants at high temperature. Plant Cell Environ. 2004, 27, 717–724. [Google Scholar] [CrossRef]
  33. Yamori, W.; Noguchi, K.; Kashino, Y.; Terashima, I. The role of electron transport in determining the temperature dependence of the photosynthetic rate in spinach leaves grown at contrasting temperatures. Plant Cell Physiol. 2008, 49, 583–591. [Google Scholar] [CrossRef] [PubMed]
  34. Percival, G.C. The use of chlorophyll fluorescence to identify chemical and environmental stress in leaf tissue of three oak (Quercus) species. J. Arbor. 2005, 31, 215–227. [Google Scholar] [CrossRef]
  35. Guo, Y.P.; Zhou, H.F.; Zhang, L.C. Photosynthetic characteristics and protective mechanisms against photooxidation during high temperature stress in two citrus species. Sci. Hort. 2006, 108, 260–267. [Google Scholar] [CrossRef]
  36. Costa, E.S.; Bressan-Smith, R.; Oliveira, J.G.; Campostrini, E. Chlorophyll a fluorescence analysis in response to excitation irradiance in bean plants (Phaseolus vulgaris L. and Vigna unguiculata L. Walp) submitted to high temperature stress. Photosynthetica 2003, 41, 77–82. [Google Scholar] [CrossRef]
  37. Kitao, M.; Yasuda, Y.; Kodani, E.; Harayama, H.; Awaya, Y.; Komatsu, M.; Yazaki, K.; Tobita, H.; Agathokleous, E. Integration of electron flow partitioning improves estimation of photosynthetic rate under various environmental conditions based on chlorophyll fluorescence. Remote Sens. Environ. 2021, 254, 112273. [Google Scholar] [CrossRef]
  38. Song, X.; Zhou, G.; He, Q.; Zhou, H. Stomatal limitations to photosynthesis and their critical Water conditions in different growth stages of maize under water stress. Agric. Water Manag. 2020, 241, 106330. [Google Scholar] [CrossRef]
  39. Bheemanahalli, R.; Vennam, R.R.; Ramamoorthy, P.; Reddy, K.R. Effects of post-flowering heat and drought stresses on physiology, yield, and quality in maize (Zea mays L.). Plant Stress 2022, 6, 100106. [Google Scholar] [CrossRef]
  40. Müllers, Y.; Postma, J.A.; Poorter, H.; van Dusschoten, D. Stomatal conductance tracks soil-to-leaf hydraulic conductance in faba bean and maize during soil drying. Plant Physiol. 2022, 190, 2279–2294. [Google Scholar] [CrossRef]
  41. Pierre, J.F.; Latournerie-Moreno, L.; Garruña, R.; Jacobsen, K.L.; Laboski, C.A.M.; Us-Santamaría, R.; Ruiz-Sánchez, E. Effect of Maize–Legume Intercropping on Maize Physio-Agronomic Parameters and Beneficial Insect Abundance. Sustainability 2022, 14, 12385. [Google Scholar] [CrossRef]
  42. Pierre, J.F.; Latournerie-Moreno, L.; Garruña-Hernández, R.; Jacobsen, K.L.; Guevara-Hernández, F.; Laboski, C.A.M.; RuizSánchez, E. Maize legume intercropping systems in southern Mexico: A review of benefits and challenges. Ciênc. Rural 2022, 52, 11. [Google Scholar] [CrossRef]
  43. Cárceles Rodríguez, B.; Durán Zuazo, V.H.; Soriano Rodríguez, M.; García-Tejero, I.F.; Gálvez Ruiz, B.; Repullo-Ruibérriz de Torres, M.A.; Ordóñez-Fernández, R.; Carbonell-Bojollo, R.M.; Cuadros Tavira, S. Chapter 13—Legumes protect the soil erosion and ecosystem services. In Advances in Legumes for Sustainable Intensification; Meena, R.S., Kumar, S., Eds.; Academic Press: Cambridge, MA, USA, 2022; pp. 247–266. [Google Scholar]
Figure 1. Scheme of intercropping system used in the study. The treatments are abbreviated: ML (maize and Lupinus sp.), MM (maize and Melilotus albus), and SM (maize).
Agronomy 13 00163 g001
Figure 2. Localization of the Troubsko experimental field station in CZE (Czech Republic).
Agronomy 13 00163 g002
Figure 3. Weather conditions at the Troubsko field experimental station, 2019—average monthly temperatures and mean annual precipitation amounts for the long term are standard for 1981–2010.
Agronomy 13 00163 g003
Figure 4. Time courses of FV/FM (left) and VJ (right). Note: Zea mays (SM), Zea mays + Lupinus sp. (ML), Zea mays + Melilotus albus (MM). Data points represent means calculated from five replicates ± standard deviations. Statistically significant differences are indicated by the letters (a, b). Most common (a) is not shown due to too numerous appearances. Only (ab) and (b) are shown.
Agronomy 13 00163 g004
Figure 5. Time courses of PIABS (left) and ET0/RC (right). Note: Zea mays (SM), Zea mays + Lupinus sp. (ML), Zea mays + Melilotus albus (MM). Data points represent means calculated from five replicates ± standard deviations. Statistically significant differences are indicated by the letters (a, b). Most common (a) is not shown due to too numerous appearances. Only (ab) and (b) are shown.
Agronomy 13 00163 g005
Figure 6. Time courses of DI0/RC (left) and ΦPSII (right). Note: Zea mays (SM), Zea mays + Lupinus sp. (ML), Zea mays + Melilotus albus (MM). Data points represent means calculated from five replicates ± standard deviations. Statistically significant differences are indicated by the letters (a, b). Most common (a) is not shown due to too numerous appearances. Only (ab) and (b, c) are shown. Parameter QY_L1 refers to effective quantum yield of photosystem II.
Agronomy 13 00163 g006
Figure 7. Daily courses of photosynthetically active radiation (PAR) and air temperature measured at the height of 1.5 m in the maize stand within the period of investigation (17 July to 9 August).
Agronomy 13 00163 g007
Figure 8. Light response curves of the photosynthetic electron transport rate (ETR) evaluated for the best (blue symbols) and worst days (red symbols). The best days were day 14 (SM), day 12 (MM) and day 12 (ML). The worst days were day 21 (SM), day 23 (MM) and day 19 (ML). Data points represent means of five replicates ± standard deviations. Characters (a, b) indicate statistically significant differences.
Agronomy 13 00163 g008
Table 1. Characteristics of the arable soil from the experimental plot and the average contents of plant available nutrients. Note: Mean of measured values (n = 3) is shown ± standard deviation (SD).
SampleSoil Reaction (pH)Plant Available Nutrient Content (mg/kg)
Nan-100%KMgPCa
Arable Soil7.1 ± 0.223.9 ± 5.3191 ± 34.2153 ± 5.158.3 ± 5.15968 ± 556
Table 2. OJIP-derived parameters used to study changes in photosystem II photochemistry.
Abbrev.Formula/EquationsExplanation
FV/FM Maximal quantum yield of PSII fluorescence
VJVJ = (FJ − F0)/(FM − F0)Relative variable fluorescence at the J-step
PIABSPIABS = (RC/ABS)·[φP0/(1 − φP0)]·[ψ0/(1 − ψ0)]Performance index (potential) for energy conservation from exciton to the reduction of intersystem electron acceptors
ET0/RCET0/RC = M0·(1/VJ)·ψ0Electron transport flux (further than QA) per RC
DI0/RCDI0/RC = (ABS/RC)–(TR0/RC)The flux of dissipated excitation energy at time 0
QY_L1 Equivalent to effective quantum yield of PSII (ΦPSII)
Table 3. Correlation between climatic parameters and OJIP-derived chlorophyll fluorescence parameters related to PSII primary photosynthetic processes. Red numbers (r values) indicate statistically significant difference. Climatic parameters numbering: (1) mean air temperature of the day before chlorophyll fluorescence measurements, (2) mean PAR of the day before measurements, (3) mean RH of the day before measurement, (4) maximum air temperature of the day before measurements, (5) maximum RH of the day before measurements, (6) minimum air temperature of the day before measurements, (7) minimum RH of the day before measurements, (8) mean air temperature of the period of measurement (7:00 to 11:00 a.m. of particular day), (9) mean PAR of the period of measurement, (10) mean RH of the period of measurement, (11) maximum air temperature of the period of measurement, (12) maximum PAR of the period of measurement, (13) maximum RH of the period of measurement, (14) minimum air temperature of the period of measurement, (15) minimum PAR of the period of measurement and (16) minimum RH of the period of measurement.
Dependent
Parameter
Climatic Parameter (Spearman Correlation, p < 0.05)
12345678
FV/FM−0.341−0.050−0.111−0.457−0.078−0.332−0.025−0.553
PIABS−0.351−0.101−0.071−0.537−0.005−0.2850.031−0.599
ET0/RC−0.152−0.2760.166−0.2990.2680.0830.413−0.110
DI0/RC0.3790.0570.0990.5130.0880.3330.0660.643
910111213141516
FV/FM−0.1690.119−0.187−0.2150.250−0.544−0.1620.049
PIABS−0.2530.115−0.296−0.2710.149−0.493−0.2470.103
ET0/RC−0.3250.263−0.201−0.3410.0510.088−0.2270.375
DI0/RC0.180−0.0860.2680.211−0.2060.5920.215−0.019
Table 4. Above-ground biomass for Z. mays, M. albus, and Lupinus sp. estimated for sole maize (SM) and the two intercropping systems maize with white sweetclower (MM) and Lupinus sp. (ML).
SystemZ. mays
[kg (DM) ha−1]
M. albus (MM)
Lupinus sp. (ML)
[kg (DM) ha−1]
Overall Productivity
[kg (DM) ha−1]
Sole maize (SM)15 676 ± 508 15 676 ± 508
Intercropping (MM)14 514 ± 8741 381 ± 10215 895 ± 521
Intercropping (ML)14 806 ± 13561 045 ± 22115 851 ± 699
Disclaimer/Publisher’s Note: The statements, opinions and data contained in all publications are solely those of the individual author(s) and contributor(s) and not of MDPI and/or the editor(s). MDPI and/or the editor(s) disclaim responsibility for any injury to people or property resulting from any ideas, methods, instructions or products referred to in the content.

