Abstract
In wheat production, improving resource utilization and grain yield is the goal researcher have been pursuing. This study aimed to investigate if a regulated nitrogen (N) and selenium (Se) fertilizer management could increase wheat yield and N use efficiency (NUE). This study reports the effects of three N application levels (N0: 0 kg N ha−1, N1: 180 kg N ha−1, N2: 270 kg N ha−1) and a combination of three Se application levels (Se0: 0 g Se ha−1, Se1: 450 g Se ha−1, Se2: 900 g Se ha−1) on N metabolism, NUE and yield in wheat in 2020–2021. Compared with N0, wheat yield increased by 44.76% in N1 and by 54.32% in N2, and the activity of N-metabolizing enzymes increased by 25.15~35.03% in N1 and by 32.01~51.27% in N2. Compared with N1, the apparent recovery efficiency of N, the agronomic N use efficiency and the partial factor productivity of applied N decreased by 15.71%, 28.00% and 28.93% in N2, respectively. Compared with Se0, the 1000-grain weight increased by 3.93% in Se1 and by 4.87% in Se2, and the activity of nitrogen-metabolizing enzymes increased by 4.23~4.91% in Se1 and by 6.65~8.46% in Se2. We conclude that Se could improve the wheat 1000-grain weigh and N metabolism and has the potential to increase wheat yield and NUE.
1. Introduction
Wheat is the second largest food crop in China and the staple food for more than 35% of the world’s population [1]. A stable and high yield of wheat is related to social stability and world food security [2]. N is the most required mineral for plants, and a reasonable N fertilizer application is the key to obtain high crop yields [3]. However, a continuous high input of N fertilizers into the fields has caused a series of ecological and environmental problems such as soil quality degradation and agricultural pollution aggravation [4]. The data show that the nitrogen fertilizers used for plant growth account for only 33% of the nitrogen used on average [5]. Therefore, improving the NUE of wheat is the key to a green and efficient production of wheat.
Selenium (Se) is one of the trace elements required for human health and has important functions in the human body, such as anti-oxidation, regulation of blood lipid metabolism and prevention of cardiomyopathies [6,7]. The application of an appropriate amount of Se can improve crops’ antioxidant capacity and photosynthesis and increase crop yield [8,9]. It has been reported that Se delays crop leaf senescence and enhances N metabolism. Hajiboland and Sadeghzade [10] reported that Se application can compensate for the decline in chlorophyll fluorescence parameters and N metabolism in the presence of low N levels in wheat. Shahid et al. [11] reported that Se reduces cadmium and arsenic toxicity by modulating carbohydrate and N metabolism in potatoes. Rios et al. [12] reported that Se increased nitrogen metabolism in lettuce plants. However, there are few reports on the effect of Se–N interactions on wheat yield, N metabolism and N use efficiency. Further, the effects of Se in delaying crop leaf senescence and enhancing N metabolism have the potential to improve N metabolism, N use efficiency and yield in wheat.
The aim of this study was to investigate the effects of the interaction between Se and N on N metabolism, N use efficiency and yield in wheat.
2. Material and Methods
2.1. Experimental Site
The experiments were conducted in 2020 and 2021 at an agricultural research farm in Heze County, Shandong Province, China. The soil texture was sandy loam. Basic information on the soil (0–20 cm) at the experimental site at the beginning of the experiment: cation exchange capacity, 8.60 cmol kg−1, 6.82 of pH, 19.3 g kg−1 of organic matter, 0.202 g kg−1 of available N, 45.4 mg kg−1 of available P, 0.162 g kg−1 of available K, 0.204 mg kg−1 of total Selenium (Se). Soil total N, available N, Olsen-P and available K content were measured by the Kjeldahl method, the alkali hydrolysis diffusion method, the Mo-Sb colorimetric method and the flame photometry method, respectively. Soil organic matter was determined by the wet combustion method. The determination of total Se in soil was carried out by the 2,3-diaminonaphthalene fluorescence method. The paddy field rotation pattern was summer maize–winter wheat. The tested wheat (Triticum aestivum L.) variety was Lumai22.
2.2. Experimental Treatments and Design
A split plot experiment was used in this study, with Nitrogen (N) application levels as the main plot, and Se application levels as the subplots. Three N application levels were considered, i.e., 0 kg N ha−1 (N0), 180 kg N ha−1 (N1) and 270 kg N ha−1 (N2), which were applied as base fertilizer (50%), tiller fertilizer (25%) and jointing fertilizer (25%) with urea, respectively. Three Se application levels were considered, i.e., 0 g Se ha−1 (Se0), 450 g Se ha−1 (Se1) and 900 g Se ha−1 (Se2). Before wheat planting, Se amounts of 0 g (Se0), 0.1 g (Se1) and 0.2 g (Se2) sodium selenite were weighed, dissolved in 0.3 L of water and sprayed on the soil surface (1 m2). Each treatment was repeated 3 times, and each subplot was 3 m × 10 m. All the treatments included P2O5 (59.0 kg ha−1) and K2O (120 kg ha−1) in the form of calcium superphosphate and potassium chloride, respectively. Wheat seeds were sown on 15 October both in 2019 and in 2020, at a rate of 150 kg ha−1. Other field management measures were consistent with the management methods of local farmers.
2.3. Measurement Items and Methods
2.3.1. Collection of Wheat Samples
At anthesis, 400 spikes that flowered on the same day were tagged for sampling in the center of each experimental plot. The flag leaves from 30 wheat plants were collected and stored at −80 °C after freezing in liquid N for 3 min, for the measurement of N-metabolizing enzyme and antioxidant enzyme activities and malonaldehyde (MDA) content. At maturity, 45 plants of wheat were collected and carefully threshed, dried and weighed to measure the yield per plot, the spikes per m−2, the kernels per spike, and the 1000-grain weight at 14% moisture. Then, the harvested wheat samples were divided into grains and straws, dried to constant weight and then pulverized for the determination of the N content. The N content was determined by the Kjeldahl(KDN-1, Shanghai Yitian precision instrument company, Shanghai, China) method [13].
2.3.2. Enzymatic Activities Assay
The nitrate reductase (NR, EC 1.6.6.1) activity assay followed the method proposed by Wu et al. [14]. We mixed 1.3 mM EDTA and 10 mM cysteine to obtain 4 mL of cold 25 mM sodium phosphate (pH 8.7) buffer. The frozen plant leaf samples were ground into a homogenate in the buffer, which was centrifuged at 4000× g rpm and 4 °C for 30 min. The centrifugation supernatant, 0.1 M KNO3 and 2.82 mM NADH formed the reaction solution. We added NADH to start the reaction, then incubated the mixture for 30 min. The reaction was ended with 1% sulfanilamide and 0.02% N-phenyl-2-naphthylamine and left for 15 min. After centrifugation at 4000× g rpm for 5 min, the absorbance was determined at 540 nm.
Nitrite reductase (NiR, EC 1.7.2.1) activity in the fresh leaves was determined according to the method of Rao et al. [15]. Briefly, the reaction mixture consisted of 10 mM KNO2, the enzyme extract in 100 mM NaHCO3, 5% sodium dithionite (Na2S2O4) and 1.5% methyl viologen. The frozen leaf tissues were homogenized with cold 0.1 M potassium phosphate buffer (pH 7.5). We added the homogenized tissues to the reaction mixture and started the reaction. The nitrite content was determined by measuring the absorption of the solution consisting of the supernatant, distilled water, 1% (w/v) N (1-naphthalene 1)-ethylenediamine dihydrochloride and 10% (w/v) sulfonamide at 540 nm.
Glutamine synthetase (GS EC 6.3.1.2) and NADH-glutamate synthase (NADH-GOGAT; EC 1.4.1.14) activities in the fresh leaves were determined according to the method of Imran et al. [16]. Briefly, we mixed 100 mM Tris-HCl (pH 7.6), 1.0 mM MgCl2-6H2O, 10 mM 2-mercaptoethanol and 1.0 mM ethylenediaminetetraacetic acid (EDTA) to obtain a buffer. The frozen plant leaf samples were ground into a homogenate in the buffer and centrifuged at 13,000× g rpm for 15 min at 4 °C to obtain a crude enzyme extract. The crude enzyme extract was treated with a synthetase reaction solution consisting of 0.1 M imidazole, 0.08 M MgSO4·7H2O, 0.02 M glutamic acid-Na, 58 M hydroxylamine hydrochloride (pH 7.0) and 10 mM ATP and incubated for 15 min at 37 °C. A FeCl3 solution, consisting of 2% tri-chloroacetic acid (TCA), 3.5% FeCl3 and 2% HCl, was added to terminate the reaction. The absorbance was then determined at 540 nm in a spectrophotometer(UV-6000, Shanghai metash instruments Co Ltd, Shanghai, China) to obtain the GS. Then, the absorbance was measured at 340 nm due to NADH oxidation to determine NADH-GOGAT.
2.3.3. Nitrogen Use Efficiency (NUE)
The apparent recovery efficiency of N (REN), the agronomic N use efficiency (AEN), the partial factor productivity of the applied N (PFPN), the physiological N use efficiency (PEN) and the internal N use efficiency (IEN) were calculated according to the method of Gu et al. [17].
2.3.4. Photosynthetic Capacity
At the flowering stage, 60 representative wheat plants were sampled. The leaf area index (LAI) refers to the total area of plant leaves per unit land area. We used a ruler to measure the length and maximum width of the wheat leaves. The calculation formula of wheat leaf area is: leaf area = leaf length × maximum leaf width × 0.83 (the compensation coefficient of wheat is 0.83) [18]. Five wheat plants were selected at the center of each plot to measure net photosynthetic rate (Pn) at anthesis. At 9:30–11:00 am, when the radiation above the canopy was 1200 mmol m−2 s−1, the net photosynthetic rate of the unfolded leaves at the top of the main stem was determined using a gas exchange analyzer (Li-6400, Li-COR Inc., Lincoln, NE, USA).
2.3.5. Oxidative Stress
We poured liquid nitrogen into a mortar to grind the frozen leaf samples and injected 50 mM sodium phosphate buffer (pH 7.0) into the ground leaves to homogenize them. The homogenate was centrifuged at 30,000× g for 30 min at 4 °C. The supernatant was separated for the determination of antioxidant enzyme (superoxide dismutase (SOD), catalase (CAT), peroxidase (POD)) activity and malonaldehyde (MDA) content [19]. One unit of SOD activity is the amount of enzyme that induces 50% inhibition in the initial rate of reduction of nitroblue tetrazolium at 560 nm. We prepared a solution containing 0.95 mL of 0.2% guaiacol,1 mL of 0.3% H2O2, 1 mL of sodium phosphate buffer (pH 7.8) and 0.05 mL of enzyme extract to determine POD. We read the absorbance at 470 nm 3 times at 30 s intervals. The amount of enzyme that causes the breakdown of 1 mg of substrate at 470 nm is defined as one unit of POD activity. We prepared a solution consisting of 1 mL of 0.3% H2O2, 1.95 mL distilled water and 0.05 mL of enzyme to determine CAT and used 1 mL of this solution to read the absorbance at 470 nm 3 times at 30 s intervals. One CAT activity unit is defined as the amount of enzyme required to decompose 1 M H2O2 in 1 min using 1 g of fresh leaf sample at A240. We mixed 1.5 mL of enzyme extract with 0.5 mL of thiobarbituric acid solution and 5% trichloroacetic acid to measure the MDA content. The reaction mixture was heated at 100 °C for 15 min in a water bath, then quickly cooled in an ice bath and centrifuged at 3000 rpm for 15 min. The absorbance of the colored supernatant was measured at 450 nm, 532 nm and 600 nm. The MDA content was calculated by using the formula: MDA content = 6.45(OD532 − OD600) − 0.599OD450.
2.4. Statistical Analyses
All experimental data were obtained from 2019 to 2021, were statistically analyzed using SPSS 21.0 and are expressed as the mean ± standard error (SE) of three replicates. The data were tested for normal distribution and homogeneity of variance using the Shapiro–Wilk test and the Levene test, respectively. One-way ANOVA was used to compare differences in the same index between two years. The effects of N administration level, Se administration level and their interaction were compared using multivariate analysis of variance. For data analysis, 2 significance levels were set at p < 0.05 and p < 0.01.
3. Results
3.1. Yield and Yield Composition
There were no significant differences in yield and yield composition between the two years (Table 1). N application had a significant effect on yield and yield composition. Compared with N0, the spikes per m−2, kernels per spike, 1000-grain weight and yield increased by 28.51%, 6.39%, 6.02% and 44.8% in N1 and by 38.0%, 6.48%, 5.18% and 54.3% in N2, respectively. The application of Se significantly increased the 1000-grain weight of wheat. Compared with Se0, the 1000-grain weight increased by 3.93% in Se1 and by 4.87% in Se2. The interaction of the Se and N treatments had a significant effect on the 1000-grain weight. The Se application increased the 1000-grain weight by 7.07~8.48% in N0, by 4.40~5.56% in N1 and by 0.62~0.90% in N2.

Table 1.
Effects of selenium and N fertilizers on wheat yield and yield composition.
3.2. Nitrogen Metabolism
There were no significant differences in N-metabolizing enzymes between the two years (Figure 1). N application significantly increased N-metabolizing enzyme activity. Compared with N0, NR, NiR, GOGAT and GS increased by 35.0%, 28.6%, 29.4% and 23.2% in N1 and by 51.3%, 32.0%, 33.7% and 42.2% in N2, respectively. Se treatment also significantly increased N-metabolizing enzyme activity. Compared with Se0, N0, NR, NiR, GOGAT and GS increased by 4.91%, 4.40%, 4.23% and 4.40% in Se1 and by 8.46%, 7.37%, 6.81% and 6.65% in Se2, respectively. The interaction of the N and Se treatments had no significant effect on N-metabolizing enzymes.
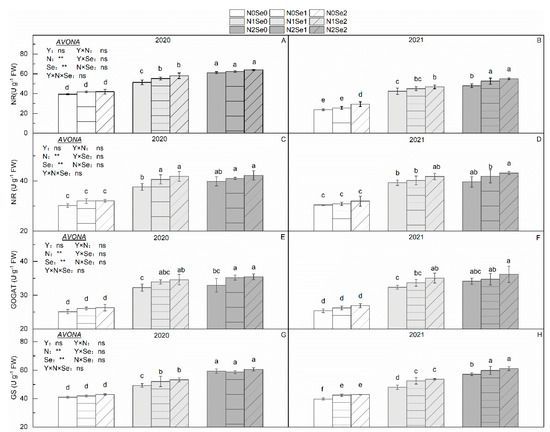
Figure 1.
Effects of selenium and N fertilizers on the activity of N-metabolizing enzymes in wheat. Y = Years, N = Nitrogen, Se = Selenium. (A,C,E,G) represent NR activity, NiR activity, NADH-GOGAT, GS in 2020, respectively. (B,D,F,H) represent NR activity, NiR activity, NADH-GOGAT, GS in 2021, respectively. N0, N1 and N2 indicate 0 kg N ha−1, 180 kg N ha−1 and 270 kg N ha−1, Se0, Se1 and Se2 indicate 0 g Se ha−1, 450 g Se ha−1 and 900 g Se ha−1. Different lowercase letters indicate statistical differences among the treatments at p < 0.05. “ns” means no significant difference (p > 0.05). ** represent the significance levels of p < 0.01, respectively.
3.3. Nitrogen Use Efficiency
There were no significant differences in NUE between the two years (Figure 2). Increased N application levels significantly reduced the NUE. Compared with N1, REN, AEN and PFPN decreased by 15.71%, 28.00% and 28.93% in N2, respectively. Se application and the interaction of the N and Se treatments had no significant effect on NUE.
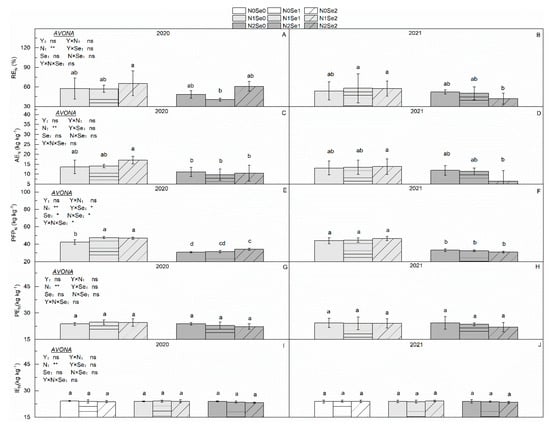
Figure 2.
Effects of selenium and N fertilizers on N use efficiency in wheat. Y = Years, N = Nitrogen, Se = Selenium. (A,C,E,G,I) represent REN, AEN, PFPN, PEN, IEN in 2020, respectively. (B,D,F,H,J) represent REN, AEN, PFPN, PEN, IEN in2021, respectively. N0, N1 and N2 indicate 0 kg N ha−1, 180 kg N ha−1 and 270 kg N ha−1, Se0, Se1 and Se2 indicate 0 g Se ha−1, 450 g Se ha−1 and 900 g Se ha−1. Different lowercase letters indicate statistical differences among the treatments at p < 0.05. “ns” means no significant difference (p > 0.05). * and ** represent the significance levels of p < 0.05 and p < 0.01, respectively.
3.4. Leaf Area Index and Net Photosynthetic Rate
There were no significant differences in Pn between the two years (Figure 3). N application significantly increased LAI and Pn. Compared with N0, LAI and Pn increased by 22.1% and 5.86% in N1 and by 26.4% and 10.09% in N2, respectively. Se application significantly increased Pn. Compared with Se0, Pn increased by 4.04% in Se1 and by 3.93% in Se2. The interaction of the N and Se treatments had no significant effect on LAI and Pn.
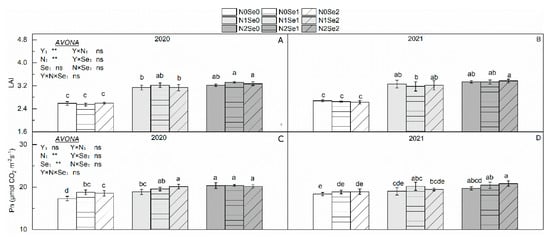
Figure 3.
Effects of selenium and N fertilizers on photosynthetic capacity in wheat. Y = Years, N = Nitrogen, Se = Selenium. (A,C) represent LAI and Pn in 2020, respectively. (B,D) represent LAI and Pn in 2021, respectively. N0, N1 and N2 indicate 0 kg N ha−1, 180 kg N ha−1 and 270 kg N ha−1, Se0, Se1 and Se2 indicate 0 g Se ha−1, 450 g Se ha−1 and 900 g Se ha−1. Different lowercase letters indicate statistical differences among treatments at p < 0.05. “ns” means no significant difference (p > 0.05). ** represent the significance levels of p < 0.01, respectively.
3.5. MDA Content and Antioxidant Enzyme Activity
There were no significant differences in MDA content and antioxidant enzyme activity between the two years (Figure 4). Both N and Se applications significantly decreased the MDA content and increased the antioxidant enzyme activity. Compared with N0, the MDA content decreased by 11.6% in N1 and by 13.5% in N2; the SOD, POD and CAT activities increased by 5.00%, 2.23% and 13.15% in N1 and by 5.29%, 4.32% and 13.1% in N2, respectively. Compared with Se0, the MDA content decreased by 15.7% in N1 and by 29.7% in N2; the SOD, POD and CAT activities increased by 6.06%, 5.77% and 12.7% in N1 and by 14.3%, 11.9% and 29.9% in N2, respectively.
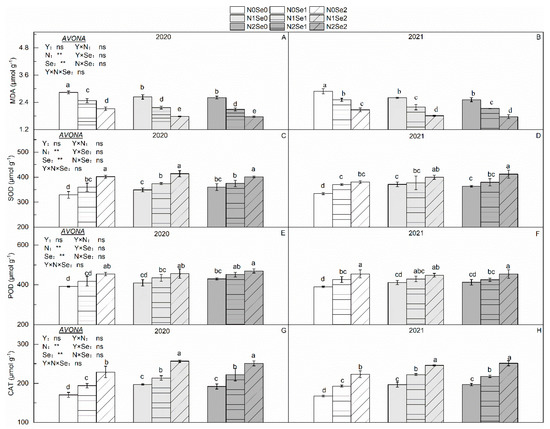
Figure 4.
Effects of selenium and nitrogen fertilizers on oxidative stress in wheat. Y = Years, N = Nitrogen, Se = Selenium. (A,C,E,G) represent MDA, SOD, POD, CAT in 2020, respectively. (B,D,F,H) represent MDA, SOD, POD, CAT in 2021, respectively. N0, N1 and N2 indicate 0 kg N ha−1, 180 kg N ha−1 and 270 kg N ha−1, Se0, Se1 and Se2 indicate 0 g Se ha−1, 450 g N ha−1 and 900 g Se ha−1. Different lowercase letters indicate statistical differences among treatments at p < 0.05. “ns” means no significant difference (p > 0.05). ** represent the significance levels of p < 0.01 respectively.
4. Discussion
Maintaining a high wheat yield is important for ensuring food security and social stability [20]. The N and Se application levels have been reported to affect wheat growth and yield [21,22]. We found that both yield and yield components increased with increasing N application levels, which is consistent with previous conclusions [23]. Increasing N application is an effective measure to improve crop yield and yield composition [24]. However, when the N application level increased from N1 to N2, the kernels per spike and the 1000-grain weight did not increase significantly, indicating that a very high N application did not significantly promote the growth of some yield components and that a moderate N fertilizer application is noteworthy and important [3]. In this study, the 1000-grain weight increased with the increase of the Se application level, which is consistent with previous conclusions [25]. Se application has been repeatedly shown to increase the photosynthetic capacity of crops, improve the grain filling process, and thus increase the 1000-grain weight of crops [26,27]. However, with the increase of the N application level, the effect of Se on the 1000-grain weight decreased. The reason may be that the increased N application replaced the effect of Se on the improvement of photosynthesis, as both N and Se have been shown to have this function in crops [28].Whether the yield-increasing effect of Se on crops is significant or not strongly depends on the experimental conditions and management methods [29]. In this study, the yield when using N1 + Se2 was not different from that under N2 treatment, indicating that Se has the potential to reduce the N input and compensate for the yield decline. However, it should be noted that a low level of Se fertilizer is conducive to crop growth and yield improvement, while an excessive application of selenium fertilizer is not conducive to crop yield improvement [30].
NR plays an important role in plant regulation and nitrogen assimilation, and both N and protein concentrations in the leaves are related to its activity, while NiR, GS and GOGAT play key roles in nitrogen metabolism and synergize with NR [31]. We observed that all N enzymes increased with an increasing N application level, which is consistent with previous conclusions [32,33]. An increased N application increases N uptake and assimilation by plants and stimulates the biosynthesis of N assimilation enzymes [3,34]. However, NiR and GOGAT showed no significant difference between N2 and N3, indicating that an excessive N application cannot promote the synthesis of all N assimilation enzymes, with the risk of not improving N assimilation [3]. We observed an increase in the activities of all N-metabolizing enzymes with increasing Se application levels. Se has been reported to improve the antioxidant capacity and photosynthesis capacity of crops [35]. A higher photosynthetic capacity promotes N uptake by plants and stimulates the synthesis of N-metabolizing enzymes [35]. In addition, a more stable oxidative balance in plants is also conducive to the synthesis of N-metabolizing enzymes [36].
NUE is the ratio of yield and total N supplied, and several techniques have been adopted to measure the NUE, which includes N uptake efficiency and N utilization efficiency [3]. In this study, REN, AEN and PFPN were decreased in N3 compared to N2. It indicated that excessively increasing the amount of N fertilizer would reduce REN and AEN, which is consistent with the results of most studies [37]. Optimizing nitrogen fertilizer application is very important to reduce nitrogen fertilizer input and improve wheat NUE [38]. Se did not increase NUE, indicating that the bottom application of sodium selenite had limited effect on improving NUE, but Se increased the activities of nitrogen metabolism-related enzymes and the 1000-grain weight, indicating that an optimized Se fertilization method could improve wheat NUE, which requires further study.
5. Conclusions
N application increased wheat yield and the activities of N-metabolizing enzymes, but the highest N application tested did not increase the kernels per spike, the 1000-grain weight, and the activities of NiR and GOGAT, and decreased REN and AEN. Se application increased the 1000-grain weight and nitrogen-metabolizing enzyme activities in wheat. Combined with resource utilization and wheat yield, the treatment consisting of N1 + Se2 is the best choice.
Author Contributions
H.Z., conducted the experiments, wrote and revised the manuscript; S.J., conducted the experiments, wrote the manuscript; Q.W. conceived and designed the research; J.Z. analyzed the data, B.D. helped and processed the ultrastructural pictures. All authors have read and agreed to the published version of the manuscript.
Funding
This research was funded by the National Natural Science Foundation (U21A2039).
Institutional Review Board Statement
Not applicable.
Informed Consent Statement
Not applicable.
Data Availability Statement
The datasets used and/or analyzed during the current study are available from the corresponding author on reasonable request.
Conflicts of Interest
The authors declare that they have no competing interest.
References
- Cakmak, I.; Kutman, U.B. Agronomic biofortification of cereals with zinc: A review. Eur. J. Soil Sci. 2018, 69, 172–180. [Google Scholar] [CrossRef]
- Godfray, H.C.J.; Beddington, J.R.; Crute, I.R.; Haddad, L.; Lawrence, D.; Muir, J.F.; Pretty, J.; Robinson, S.; Thomas, S.M.; Toulmin, C. Food Security: The Challenge of Feeding 9 Billion People. Science 2010, 327, 812–818. [Google Scholar] [CrossRef]
- Anas, M.; Liao, F.; Verma, K.K.; Sarwar, M.A.; Mahmood, A.; Chen, Z.-L.; Li, Q.; Zeng, X.-P.; Liu, Y.; Li, Y.-R. Fate of nitrogen in agriculture and environment: Agronomic, eco-physiological and molecular approaches to improve nitrogen use efficiency. Biol. Res. 2020, 53, 47. [Google Scholar] [CrossRef]
- Ju, C.; Buresh, R.J.; Wang, Z.; Zhang, H.; Liu, L.; Yang, J.; Zhang, J. Root and shoot traits for rice varieties with higher grain yield and higher nitrogen use efficiency at lower nitrogen rates application. Field Crop. Res. 2015, 175, 47–55. [Google Scholar] [CrossRef]
- Li, P.; Lu, J.; Wang, Y.; Wang, S.; Hussain, S.; Ren, T.; Cong, R.; Li, X. Nitrogen losses, use efficiency, and productivity of early rice under controlled-release urea. Agric. Ecosyst. Environ. 2018, 251, 78–87. [Google Scholar] [CrossRef]
- Schomburg, L. The other view: The trace element selenium as a micronutrient in thyroid disease, diabetes, and beyond. Hormones 2020, 19, 15–24. [Google Scholar] [CrossRef]
- Saleh, S.A.; Adly, H.M.; Abdelkhaliq, A.A.; Nassir, A.M. Serum Levels of Selenium, Zinc, Copper, Manganese, and Iron in Prostate Cancer Patients. Curr. Urol. 2020, 14, 44–49. [Google Scholar] [CrossRef]
- Ye, Y.; Qu, J.; Pu, Y.; Rao, S.; Xu, F.; Wu, C. Selenium Biofortification of Crop Food by Beneficial Microorganisms. J. Fungi 2020, 6, 59. [Google Scholar] [CrossRef]
- Xu, Y.; Hao, Z.; Li, Y.; Li, H.; Wang, L.; Zang, Z.; Liao, X.; Zhang, R. Distribution of selenium and zinc in soil-crop system and their relationship with environmental factors. Chemosphere 2019, 242, 125289. [Google Scholar] [CrossRef]
- Hajiboland, R.; Sadeghzade, N. Effect of selenium on CO2 and NO3- assimilation under low and adequate nitrogen supply in wheat (Triticum aestivum L.). Photosynthetica 2014, 52, 501–510. [Google Scholar] [CrossRef]
- Shahid, M.A.; Balal, R.M.; Khan, N.; Zotarelli, L.; Liu, G.D.; Sarkhosh, A.; Fernández-Zapata, J.C.; Nicolás, J.J.M.; Garcia-Sanchez, F. Selenium impedes cadmium and arsenic toxicity in potato by modulating carbohydrate and nitrogen metabolism. Ecotoxicol. Environ. Saf. 2019, 180, 588–599. [Google Scholar] [CrossRef]
- Rios, J.J.; Blasco, B.; A Rosales, M.; Sanchez-Rodriguez, E.; Leyva, R.; Cervilla, L.M.; Romero, L.; Ruiz, J.M. Response of nitrogen metabolism in lettuce plants subjected to different doses and forms of selenium. J. Sci. Food Agric. 2010, 90, 1914–1919. [Google Scholar] [CrossRef]
- Lowry, O.H.; Rosebrough, N.J.; Farr, A.L.; Randall, R.J. Protein measurement with the Folin phenol reagent. J. Biol. Chem. 1951, 193, 265–275. [Google Scholar] [CrossRef] [PubMed]
- Wu, S.; Hu, C.; Tan, Q.; Xu, S.; Sun, X. Nitric Oxide Mediates Molybdenum-Induced Antioxidant Defense in Wheat under Drought Stress. Front. Plant Sci. 2017, 8, 1085. [Google Scholar] [CrossRef]
- Rao, L.; Rajasekhar, V.K.; Sopory, S.K.; Sipra, G.M. Phytochrome regulation of nitrite reductase-a chloroplast enzyme-in etiolated maize leaves. Plant Cell Physiol. 1981, 3, 577–582. [Google Scholar] [CrossRef]
- Imran, M.; Sun, X.; Hussain, S.; Ali, U.; Rana, M.S.; Rasul, F.; Saleem, M.H.; Moussa, M.G.; Bhantana, P.; Afzal, J.; et al. Molybdenum-Induced Effects on Nitrogen Metabolism Enzymes and Elemental Profile of Winter Wheat (Triticum aestivum L.) Under Different Nitrogen Sources. Int. J. Mol. Sci. 2019, 20, 3009. [Google Scholar] [CrossRef]
- Gu, J.; Chen, Y.; Zhang, H.; Li, Z.; Zhou, Q.; Yu, C.; Kong, X.; Liu, L.; Wang, Z.; Yang, J. Canopy light and nitrogen distributions are related to grain yield and nitrogen use efficiency in rice. Field Crop. Res. 2017, 206, 74–85. [Google Scholar] [CrossRef]
- Guo, Y.; Yin, W.; Hu, F.; Fan, Z.; Fan, H.; Zhao, C.; Yu, A.; Chai, Q.; Coulter, J.A. Reduced irrigation and nitrogen coupled with no-tillage and plastic mulching increase wheat yield in maize-wheat rotation in an arid region. Field Crop. Res. 2019, 243, 107615. [Google Scholar] [CrossRef]
- Jiang, S.; Du, B.; Wu, Q.; Zhang, H.; Deng, Y.; Tang, X.; Zhu, J. Selenium Decreases the Cadmium Content in Brown Rice: Foliar Se Application to Plants Grown in Cd-contaminated Soil. J. Soil Sci. Plant Nutr. 2022, 22, 1033–1043. [Google Scholar] [CrossRef]
- Curtis, T.; Halford, N.G. Food security: The challenge of increasing wheat yield and the importance of not compromising food safety. Ann. Appl. Biol. 2014, 164, 354–372. [Google Scholar] [CrossRef]
- Lara, T.S.; Lessa, J.H.D.L.; de Souza, K.R.D.; Corguinha, A.P.B.; Martins, F.A.D.; Lopes, G.; Guilherme, L.R.G. Selenium biofortification of wheat grain via foliar application and its effect on plant metabolism. J. Food Compos. Anal. 2019, 81, 10–18. [Google Scholar] [CrossRef]
- Da Silveira, A.P.D.; Sala, V.M.R.; Cardoso, E.J.B.N.; Labanca, E.G.; Cipriano, M.A.P. Nitrogen metabolism and growth of wheat plant under diazotrophic endophytic bacteria inoculation. Appl. Soil Ecol. 2016, 107, 313–319. [Google Scholar] [CrossRef]
- Yan, F.; Shi, Y.; Yu, Z. Optimized Border Irrigation Improved Nitrogen Accumulation, Translocation of Winter Wheat and Reduce Soil Nitrate Nitrogen Residue. Agronomy 2022, 12, 433. [Google Scholar] [CrossRef]
- Albornoz, F. Crop responses to nitrogen overfertilization: A review. Sci. Hortic. 2016, 205, 79–83. [Google Scholar] [CrossRef]
- Chu, J.; Yao, X.; Yue, Z.; Li, J.; Zhao, J. The Effects of Selenium on Physiological Traits, Grain Selenium Content and Yield of Winter Wheat at Different Development Stages. Biol. Trace Element Res. 2012, 151, 434–440. [Google Scholar] [CrossRef]
- Nawaz, F.; Ashraf, M.; Ahmad, R.; Waraich, E.; Shabbir, R.; Bukhari, M. Supplemental selenium improves wheat grain yield and quality through alterations in biochemical processes under normal and water deficit conditions. Food Chem. 2015, 175, 350–357. [Google Scholar] [CrossRef] [PubMed]
- Nawaz, F.; Ahmad, R.; Ashraf, M.Y.; Waraich, E.A.; Khan, S.Z. Effect of selenium foliar spray on physiological and biochemical processes and chemical constituents of wheat under drought stress. Ecotoxicol. Environ. Saf. 2015, 113, 191–200. [Google Scholar] [CrossRef]
- Makino, A. Photosynthesis, Grain Yield, and Nitrogen Utilization in Rice and Wheat. Plant Physiol. 2010, 155, 125–129. [Google Scholar] [CrossRef]
- Deng, X.; Liu, K.; Li, M.; Zhang, W.; Zhao, X.; Zhao, Z.; Liu, X. Difference of selenium uptake and distribution in the plant and selenium form in the grains of rice with foliar spray of selenite or selenate at different stages. Field Crop. Res. 2017, 211, 165–171. [Google Scholar] [CrossRef]
- Liu, Y.; Huang, S.; Jiang, Z.; Wang, Y.; Zhang, Z. Selenium Biofortification Modulates Plant Growth, Microelement and Heavy Metal Concentrations, Selenium Uptake, and Accumulation in Black-Grained Wheat. Front. Plant Sci. 2021, 12, 2189. [Google Scholar] [CrossRef]
- Ali, S.; Hafeez, A.; Ma, X.; Tung, S.A.; Chattha, M.S.; Shah, A.N.; Luo, D.; Ahmad, S.; Liu, J.; Yang, G. Equal potassium-nitrogen ratio regulated the nitrogen metabolism and yield of high-density late-planted cotton (Gossypium hirsutum L.) in Yangtze River valley of China. Ind. Crop. Prod. 2018, 129, 231–241. [Google Scholar] [CrossRef]
- Zhang, Z.; Yu, Z.; Zhang, Y.; Shi, Y. Optimized nitrogen fertilizer application strategies under supplementary irrigation improved winter wheat (Triticum aestivum L.) yield and grain protein yield. PeerJ 2021, 9, e11467. [Google Scholar] [CrossRef] [PubMed]
- Kaur, G.; Asthir, B.; Bains, N.; Farooq, M. Nitrogen Nutrition, its Assimilation and Remobilization in Diverse Wheat Genotypes. Int. J. Agric. Biol. 2015, 17, 531–538. [Google Scholar] [CrossRef]
- The, S.V.; Snyder, R.; Tegeder, M. Targeting Nitrogen Metabolism and Transport Processes to Improve Plant Nitrogen Use Efficiency. Front. Plant Sci. 2021, 11, 628366. [Google Scholar] [CrossRef] [PubMed]
- Tang, H.; Liu, Y.; Gong, X.; Zeng, G.; Zheng, B.; Wang, D.; Sun, Z.; Zhou, L.; Zeng, X. Effects of selenium and silicon on enhancing antioxidative capacity in ramie (Boehmeria nivea (L.) Gaud.) under cadmium stress. Environ. Sci. Pollut. Res. 2015, 22, 9999–10008. [Google Scholar] [CrossRef] [PubMed]
- Rehman, M.; Yang, M.; Fahad, S.; Saleem, M.H.; Liu, L.; Liu, F.; Deng, G. Morpho-physiological traits, antioxidant capacity, and nitrogen metabolism in ramie under nitrogen fertilizer. Agron. J. 2020, 112, 2988–2997. [Google Scholar] [CrossRef]
- Garnett, T.; Plett, D.; Heuer, S.; Okamoto, M. Genetic approaches to enhancing nitrogen-use efficiency (NUE) in cereals: Challenges and future directions. Funct. Plant Biol. 2015, 42, 921. [Google Scholar] [CrossRef]
- Panel, E.N.E. Nitrogen Use Efficiency (NUE) an Indicator for the Utilization of Nitrogen in Food Systems; Wageningen University: Alterra, Wageningen, The Netherlands, 2015. [Google Scholar]


Disclaimer/Publisher’s Note: The statements, opinions and data contained in all publications are solely those of the individual author(s) and contributor(s) and not of MDPI and/or the editor(s). MDPI and/or the editor(s) disclaim responsibility for any injury to people or property resulting from any ideas, methods, instructions or products referred to in the content. |
© 2022 by the authors. Licensee MDPI, Basel, Switzerland. This article is an open access article distributed under the terms and conditions of the Creative Commons Attribution (CC BY) license (https://creativecommons.org/licenses/by/4.0/).