Article

Comparative Assessment of Genetic Variability Realised in Doubled Haploids Induced from F1 and F2 Plants for Response to Fusarium Stalk Rot and Yield Traits in Maize (Zea mays L.)

by
Budensab Mamtazbi Showkath Babu
1,
Hirenallur Chandappa Lohithaswa
1,*,
Gangadharaswamy Triveni
1,
Mallana Gowdra Mallikarjuna
2,
Nanjundappa Mallikarjuna
3,
Devanagondi C. Balasundara
4 and
Pandravada Anand
4
1
Department of Genetics and Plant Breeding, University of Agricultural Sciences, Bangalore 560 065, Karnataka, India
2
Division of Genetics, ICAR-Indian Agricultural Research Institute, New Delhi 110 012, Delhi, India
3
AICRP on Maize, Zonal Agricultural Research Station, V. C. Farm, Mandya 571 405, Karnataka, India
4
Pioneer Hi-Bred Pvt. Ltd., Kallinayakanahalli, Gauribidanur 561 213, Karnataka, India
*
Author to whom correspondence should be addressed.
Agronomy 2023, 13(1), 100; https://doi.org/10.3390/agronomy13010100
Submission received: 27 July 2022 / Revised: 22 September 2022 / Accepted: 20 October 2022 / Published: 28 December 2022
(This article belongs to the Section Crop Breeding and Genetics)

Abstract

:
Doubled-haploid lines (DHs) are normally produced from F1 plants in maize (Zea mays L.). Several studies have found a low frequency of recombinants in doubled haploids produced from F1 plants that could limit the selection response. Hence, an attempt was made to produce doubled haploids from the F2 generation to verify whether one more round of meiotic recombination could lead to increased genetic variability and assess the response to selection. The F1 and F2 plants of two cross-combinations, VL1043 × CM212 and VL121096 × CM202, were subjected to doubled-haploid production and evaluated in terms of their reaction to Fusarium stalk rot and yield traits along with F2 individuals of the same two crosses. There was significant variation in the number of DHs produced when F1 and F2 plants were subjected to DH production in the cross VL121096 × CM202. Furthermore, substantial genetic variability was observed among the DHs produced from the F1 generation (DHF1s), F2 generation (DHF2s), and F2s for Fusarium stalk rot (FSR) resistance. The genetic variance was more extensive in DHF2 compared to DHF1 plants in the cross VL1043 × CM212. Extreme candidate plants (highly resistant, resistant, and highly susceptible) were found in the F2 generation with a more standardized range than in the DHs. In the DH populations, the close correspondence between the phenotypic coefficient of variability (PCV) and the genotypic coefficient of variability (GCV) indicated less influence from the environment compared to the F2 plants. The heritability estimates in the DHs were greater than in the F2 plants of the VL1043 × CM212 cross, while in the VL121096 × CM202 cross, the heritability was almost the same between the DHs and F2 plants due to the relatively small population size of the DHs. The positively skewed leptokurtic distribution of the DH populations indicated the role of fewer genes, with the majority of them exhibiting complementary epistasis with decreasing effects in response to FSR. The mean estimated yield and genotypic variance in the top crosses produced from randomly chosen DHF1 and DHF2 plants of the cross VL1043 × CM212 were similar in magnitude.

1. Introduction

Maize (Zea mays L.) is an important cereal crop with broad adaptability under varied agro-climatic conditions. It suffers from more than 100 diseases, and about 65 diseases are known to infect maize in India. It has been reported that around 13.2% of the economic product of maize is lost annually due to diseases alone [1]. Fusarium stalk rot (FSR) caused by Fusarium verticilloides is one such important disease, resulting in severe economic losses of 10 to 42% in maize-growing areas of India [2,3,4]. FSR usually occurs after the flowering stage and before physiological maturity, causing a reduction of 18.7% in cob weight and 11.2% in 1000-grain weight in the infected plants [5]. Rapid generation advancement tools are required in maize breeding to address diseases such as FSR. Doubled-haploid (DH) technology is one such tool, which reduced the time required for the development of inbred lines from six or seven selfing generations to just two in conventional breeding. The rapid development of DH lines provides more reliable selection than lines obtained through consecutive self-pollination, because all genetic loci in DHs are homozygous [6,7,8].
In a typical maize DH production program, breeders need to decide whether to induce and create DH lines from F1 or F2 plants [9]. The plants (F1 or F2) from a bi-parental cross are crossed with a haploid inducer. Haploid progenies are identified using a morphological marker, and their chromosomes are doubled by treating seeds, embryos, or seedlings with colchicine [10]. Haploid induction in either the F1 or F2 generation has both advantages and disadvantages. In the F1 generation, the possibility of maintaining favorable combinations from the parental lines is achieved, and time is saved. However, this could result in a decreased response to selection due to a lower recombination rate in the DH lines compared to maize lines derived from segregating generations such as F2 [11,12]. The F2 generation with one more generation of recombination could lead to increased genetic variability [7]. Unfortunately, the literature on the benefits of subjecting a specific generation (F1 or F2) to DH production is minimal, represented by only a few simulation studies in corn [6,13].
An investigation into the use of a particular generation and its comparison with a normal F2 population could help breeders plan the genetic outcome of a breeding strategy. This could also drive the improvement of existing selection methods for complex resistance traits against disease such as FSR.
Hence, an attempt was made to develop and screen DHs induced from F1 and F2 plants of the two crosses in the artificial disease-screening nursery for FSR incidence and yield traits, with the objective of comparing the magnitude of genetic variation released; we also used descriptive statistics to decipher the inheritance pattern of FSR disease resistance. In addition, the same parameters were investigated in F2 populations of the same two crosses utilized for DH production. The comparison of DHs (DHF1 and DHF2) and F2 plants could aid in the understanding of their genetic relationships. Randomly chosen DHF1 and DHF2 plants of the cross VL1043 × CM212 were crossed with an open-pollinated tester to estimate and compare the magnitude of genetic variability released and to suggest whether the F1 or F2 generation should be used for DH induction.

2. Materials and Methods

2.1. Basic Plant Material

The basic material for the study consisted of two highly FSR-susceptible (VL1043 and VL121096) and two moderately FSR-resistant (CM212 and CM202) inbred lines. These inbred lines were procured from the International Maize and Wheat Improvement Center (CIMMYT), Hyderabad. The inbred lines were selected based on the previous year’s artificial disease-screening data for the reaction against FSR [14], along with their high parental polymorphism compared to the other inbred lines assayed.

2.2. Development of Experimental Material

The susceptible inbred lines (VL1043 and VL121096) were crossed with resistant lines (CM212 and CM202) during the summer of 2017 to develop two crosses, VL1043 × CM212 and VL121096 × CM202, and they were selfed to obtain F2 plants during the rainy season of 2017 at the College of Agriculture, V. C. Farm, Mandya, Karnataka, India. Without the selection of plants/kernels between generations, a random sample of around 1200 kernels for each of the F1 and F2 generations was planted in 50 rows of 4 m length at M/s Corteva Agriscience Research Farm, Kallinayakanahally, Gauribidanur, Chikkaballapur District, Karnataka, India and crossed with a male haploid-inducer inbred plant [15]. The dominant purple grain color marker gene (the R1-nj marker) was employed to separate haploid kernels without pigmentation on the embryo from those with pigmentation, which were regular diploids. The haploid kernels thus separated were placed on paper towels for germination. When the coleoptiles were about 2 cm long, the tip was cut off and submerged in colchicine solution with dimethyl sulphoxide (DMSO). At this stage, the colchicine bound to the β-tubulin, thereby preventing the formation of tubulin dimers and, hence, microtubules. This absence of microtubules during mitosis in the meristematic cells of the shoot apex precluded the separation of replicated chromosomes, polar migration, and cell division, leading to a cell with doubled chromosome numbers. After treatment, the seedlings were washed under tap water and planted in biodegradable jiffy pots filled with peat pellets [16]. These pots were kept in the shade house until they reached the three-leaf stage, at which point they were transplanted into the DH nursery net house and selfed to obtain doubled haploids (D1). The haploids, off-types, and false positives were removed. The D1 plants were raised in the nursery and subjected to strict selfing. This process resulted in 339 and 329 doubled-haploid lines from the F1 (DHF1) and F2 (DHF2) plants, respectively, from the cross VL1043 × CM212. Following the same procedure, 39 DHF1 and 130 DHF2 plants were developed from the cross VL121096 × CM202.
The experimental material consisted of DHF1 plants, DHF2 plants, and the remnant seeds of the F2 population left after the DH induction process, as well as the parental inbred lines of both crosses (Figure 1). The population size used for each cross is provided in Table 1.

2.3. Field Layout

The DHF1 and DHF2 plants of both crosses and their respective parents as checks were evaluated in an augmented design [17], and checks were repeated after every 10th row of test entries. The F2 plants were planted in 50 rows of 2 m length along with parental inbred plants in two rows. All the entries were planted in rows spaced 0.60 m apart with intra-row spacing of 0.20 m in the artificial disease-screening nursery for FSR at the College of Agriculture, V.C. Farm, Mandya, during the rainy season of 2019 and the winter of 2019–2020.

2.4. Screening for Resistance to Fusarium Stalk Rot

Disease screening was carried out by following the procedure developed by the Indian Institute of Maize Research (IIMR), Ludhiana [18]. To ensure effective inoculation, uniform disease infestation, and good disease development, all the plants were inoculated twice, first at 65 days after sowing (DAS) and then at 75 DAS, with a known concentration (1 × 10⁶) of pathogen spores.

2.5. Isolation and Mass Multiplication of F. verticilloides Pathogen

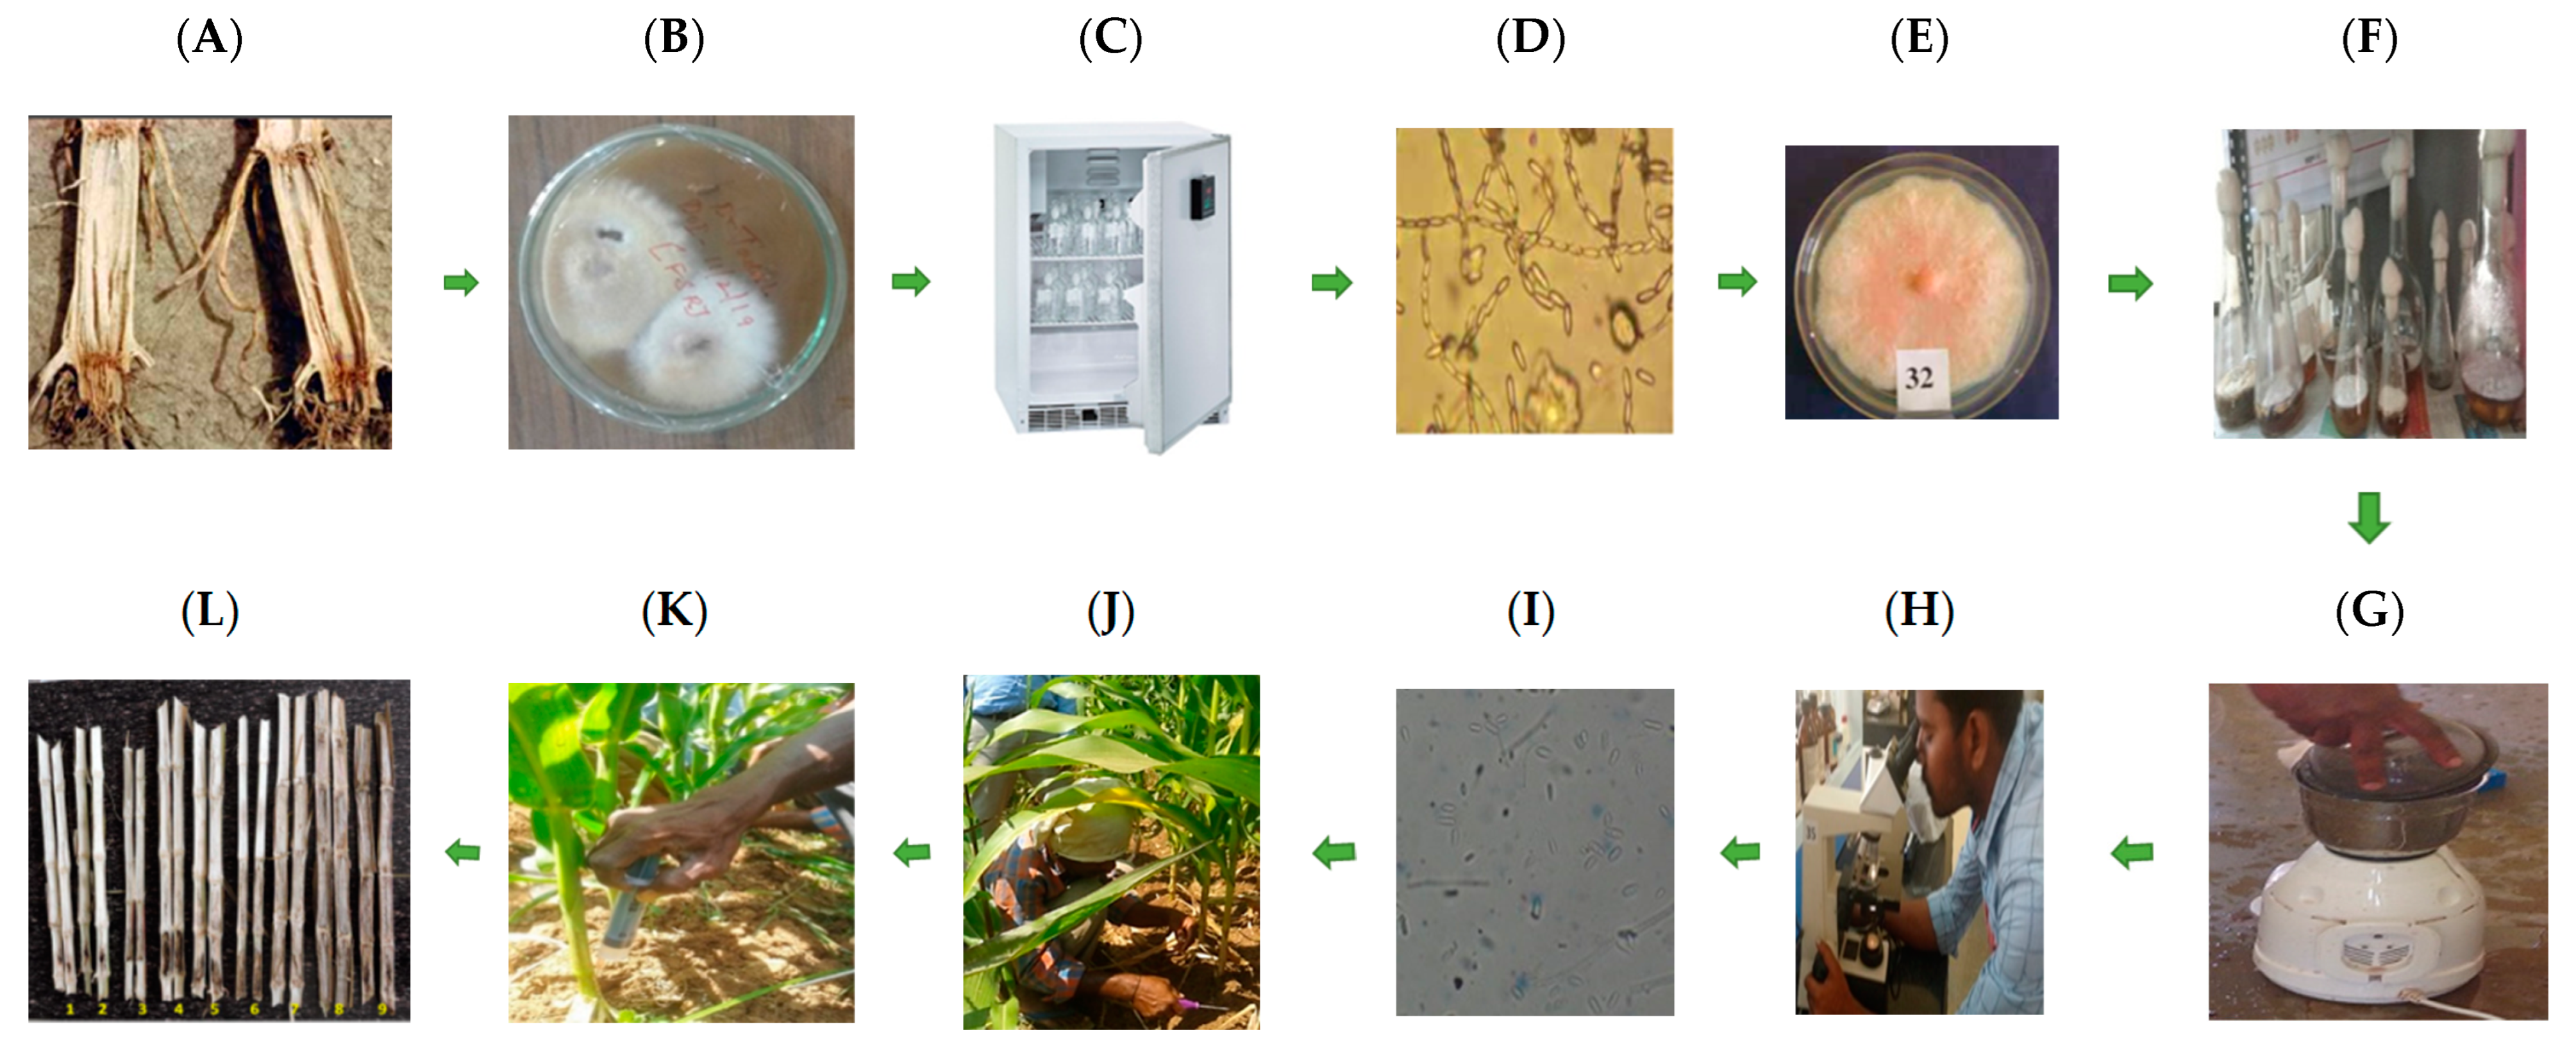
Maize stalks collected from the field with typical FSR symptoms were cut into small pieces, surface-sterilized in 4% sodium hypochlorite solution, washed twice in sterile distilled water, dried, and plated on potato dextrose agar (PDA) medium. The pathogen colonies that developed after five days in the biological oxygen demand (BOD) incubator were examined for morphological and fruiting body characteristics typical of F. verticilloides. These mycelia were mass-multiplied in conical flasks containing sterile potato dextrose broth (PDB). The mycelia were removed from the conical flasks on the 15th day of incubation, grounded, and filtered to obtain a pathogen spore suspension. The spore suspension was adjusted to 1 × 10⁶ spores per mL using sterile distilled water and a hemocytometer.

2.6. Phenotyping of DH Lines for Their Response to FSR

For each plant, 2 mL of the inoculum was injected diagonally into the second internode from the base using a syringe after making a 2 cm hole with the help of a jabber at 65 and 75 DAS. The stalks were split open around 30 days after inoculation for disease scoring. Disease severity and intensity were recorded for individual plants within each line, employing a disease scale with ratings of 1–9 in both seasons (Table 2). The disease score was recorded based on the spread of inter-node discoloration inside the maize stalks from the point of inoculation (Figure 2) [19].

2.7. Comparative Assessment of Genetic Variability for Quantitative Traits

The means and genetic variability of the doubled haploid lines derived from F1 and F2 were also compared for six quantitative traits: plant height (cm), ear height (cm), ear length (cm), ear circumference (cm), kernel rows per cob, and kernels per row. The data on plot yield were not recorded for the DH lines, as they were homozygous lines.

2.8. Assessment of Combining-Ability Variance of DH Lines Derived from F1 and F2 Generations of the Cross VL1043 × CM212

2.8.1. Crossing Program

Fifty-nine randomly chosen doubled-haploid lines derived from F1 plants and forty-one doubled-haploid lines derived from F2 plants of the cross VL1043 × CM212 were crossed with the open-pollinated tester CM500 during the rainy season of 2019.

2.8.2. Evaluation of Crosses

During the summer and rainy season of 2020, the hybrids were evaluated alongside three commercial checks, MAH-14-5, DKC-9144, and DKC-9141, in an alpha lattice design with two replications. Each entry was sown in a single row 2 meters in length with spacing of 20 cm between plants and 60 cm between rows, and the plot yield (kg/plot) data were recorded.

2.9. Statistical Analysis

2.9.1. Analysis of DH Lines

The disease response data from each DH line were averaged over two seasons and subjected to a pooled augmented analysis of variance (ANOVA) to determine the significance of the variation among the DH lines and the variation caused by DH line x season interaction. After ascertaining the existence/non-existence of DH line × season interactions, the best linear unbiased predictors (BLUPs) [21] were estimated by considering blocks and DH lines as random effects and seasons as fixed effects with a restricted maximum likelihood (REML) estimation mixed-model procedure (PROC MIXED) [20,21] in SAS ver. 9.4 (SAS Institute Inc., Cary, NC, USA) to estimate the genetic and non-genetic variances across seasons. These BLUP scores were then used to classify lines as highly resistant (HR), resistant (R), moderately resistant (MR), moderately susceptible (MS), susceptible (S), and highly susceptible (HS). The BLUP values were also used to calculate the descriptive statistical parameters such as mean, range, and standardized range [22]. Genotypic and phenotypic variances [23] and phenotypic and genotypic coefficients of variation were estimated as per Burton and De Vane [24] and classified based on [25]; heritability (in the broad sense) was calculated based on [23] and classified as per [25]; genetic advance and genetic advance as per cent mean (GAM) were assessed and classified as per [26,27]. Skewness (the third-degree statistic) and kurtosis (the fourth-degree statistic) were estimated following [28] by employing SPSS software to study the distribution pattern of DH lines with respect to FSR disease reaction. Individual F2 plants from the same two crosses were separately analyzed for the above descriptive parameters in Microsoft Excel using the same procedure as for the parental and F1 mean data.

2.9.2. Comparative Assessment of Genetic Variability of DH Lines in Terms of Quantitative Traits

The means and genetic variability of the DH lines derived from F1 and F2 generations of the cross VL1043 × CM212 were compared by employing testcross progenies and the t-test, while genetic variability was compared using the F-test.

2.9.3. Correlation Analysis

The correlation coefficients among yield traits were calculated to determine the degree of association using the following formula [29]:
r = n x y x y n x 2 x 2 [ n y 2 y 2
where x and y represent the two variables.
The significance of the correlation coefficient (r) was calculated based on t-distribution:
t = √n − 2/1 − r2
where t = t-value, n = sample size, and r = the computed correlation coefficient.

3. Results

The mean FSR scores of the DH lines (DHF1 and DHF2) across the two seasons (the rainy season of 2019 and the winter of 2019–2020) were subjected to ANOVA. Mean squares attributable to seasons, checks, DHs, and DHs vs. seasons were found to be significant in both DHF1 and DHF2 plants in the cross VL1043 × CM212. In the cross VL121096 × CM202, all sources of variation were found to be significant except for DH vs. seasons in the DHF2 plants (Table 3).

3.1. Classification of DHs into Different Disease-Response Groups

Out of the 339 DHF1 and 329 DHF2 lines in the cross VL1043 × CM212, only one DHF2 line (no. 6946) was resistant, whereas 59 DHF1 and 61 DHF2 lines were found to be moderately resistant, with a BLUP score of three. In the cross VL121096 × CM202, different responses were observed in DHF1 and DHF2 plants. Out of 39 DHF1 and 130 DHF2 lines, one DHF2 line (no. 6781) showed resistance, whereas 10 DHF1 and 29 DHF2 lines were moderately resistant across the two seasons (Table 4).

3.2. Classification of F2 Plants into Different Disease-Response Groups

In the F2 plants of the cross VL1043 × CM212, two highly resistant and three resistant plants were obtained for both seasons. However, in the winter season of 2019–2020, 22 moderately resistant plants were observed. Most of the plants belonged to the moderately susceptible group. In the cross VL121096 × CM202, 11 highly resistant and 13 resistant plants were obtained in the rainy season of 2019. In the winter season of 2019–2020, 8 highly resistant and 16 resistant plants were found (Table 4).

3.3. Genetic Variability Parameters and Components of Variance

The mean and standardized range (highest to lowest BLUP mean) of the DHF2 FSR-BLUP scores were greater than those of the DHF1 plants for both crosses. The range was wider in the DHF2 compared to the DHF1 plants (Table 5). The genetic variance (VG) was higher among the DHF1 lines than the DHF2 lines for the VL1043 × CM212 cross, whereas, for the VL121096 × CM202 cross, the genetic variance (VG) of the DHF2 lines was greater than that of the DHF1 lines (Table 5). In the F2 population, a wide variation (1 to 9) and a higher standardized range (>1.50) was observed for both crosses and seasons.
Both the DHF1 and DHF2 lines within each population had similar estimates of residual variance (VR). For the cross VL1043 × CM212, the estimates of PCV and GCV were lower in the DHF1 (13.51 and 11.92) compared to the DHF2 plants (15.50 and 14.48), while for the cross VL121096 × CM202, the estimates were higher in the DHF1 (18.47 and 17.12) than the DHF2 plants (16.39 and 14.24) (Table 5).
The PCV and GCV estimates in the F2 plants of the cross VL1043 × CM212 were 27.07 and 19.61 per cent in the rainy season of 2019, respectively, and 27.98 and 17.24 per cent in the winter season of 2019–2020. The cross VL121096 × CM202 had higher PCV and GCV estimates (42.86 and 39.82%) in the rainy season of 2019 and the winter season of 2019–2020 (41.55 and 36.52%) (Table 6).
In the cross VL1043 × CM212, the DHF1 plants had lower estimates of broad-sense heritability and expected GAM (0.78 and 21.65) compared to the DHF2 plants (0.87 and 27.89). In the other cross, VL121096 × CM202, the DHF1 plants showed higher estimates of broad-sense heritability and expected GAM (0.86 and 32.69) compared to the DHF2 plants (0.75 and 25.49) (Table 7).
In the F2 population of the cross VL1043 × CM212, the heritability was 0.52 and the expected GAM was 29.25 in the rainy season of 2019. In the winter season of 2019–2020, the heritability and expected GAM were 0.38 and 21.89, respectively. In the cross VL121096 × CM202, the heritability was 0.86 and the expected GAM was 76.19 in the rainy season of 2019, whereas these values were 0.77 and 66.15 in the winter season of 2019–2020 (Table 8).

3.4. Population Distribution

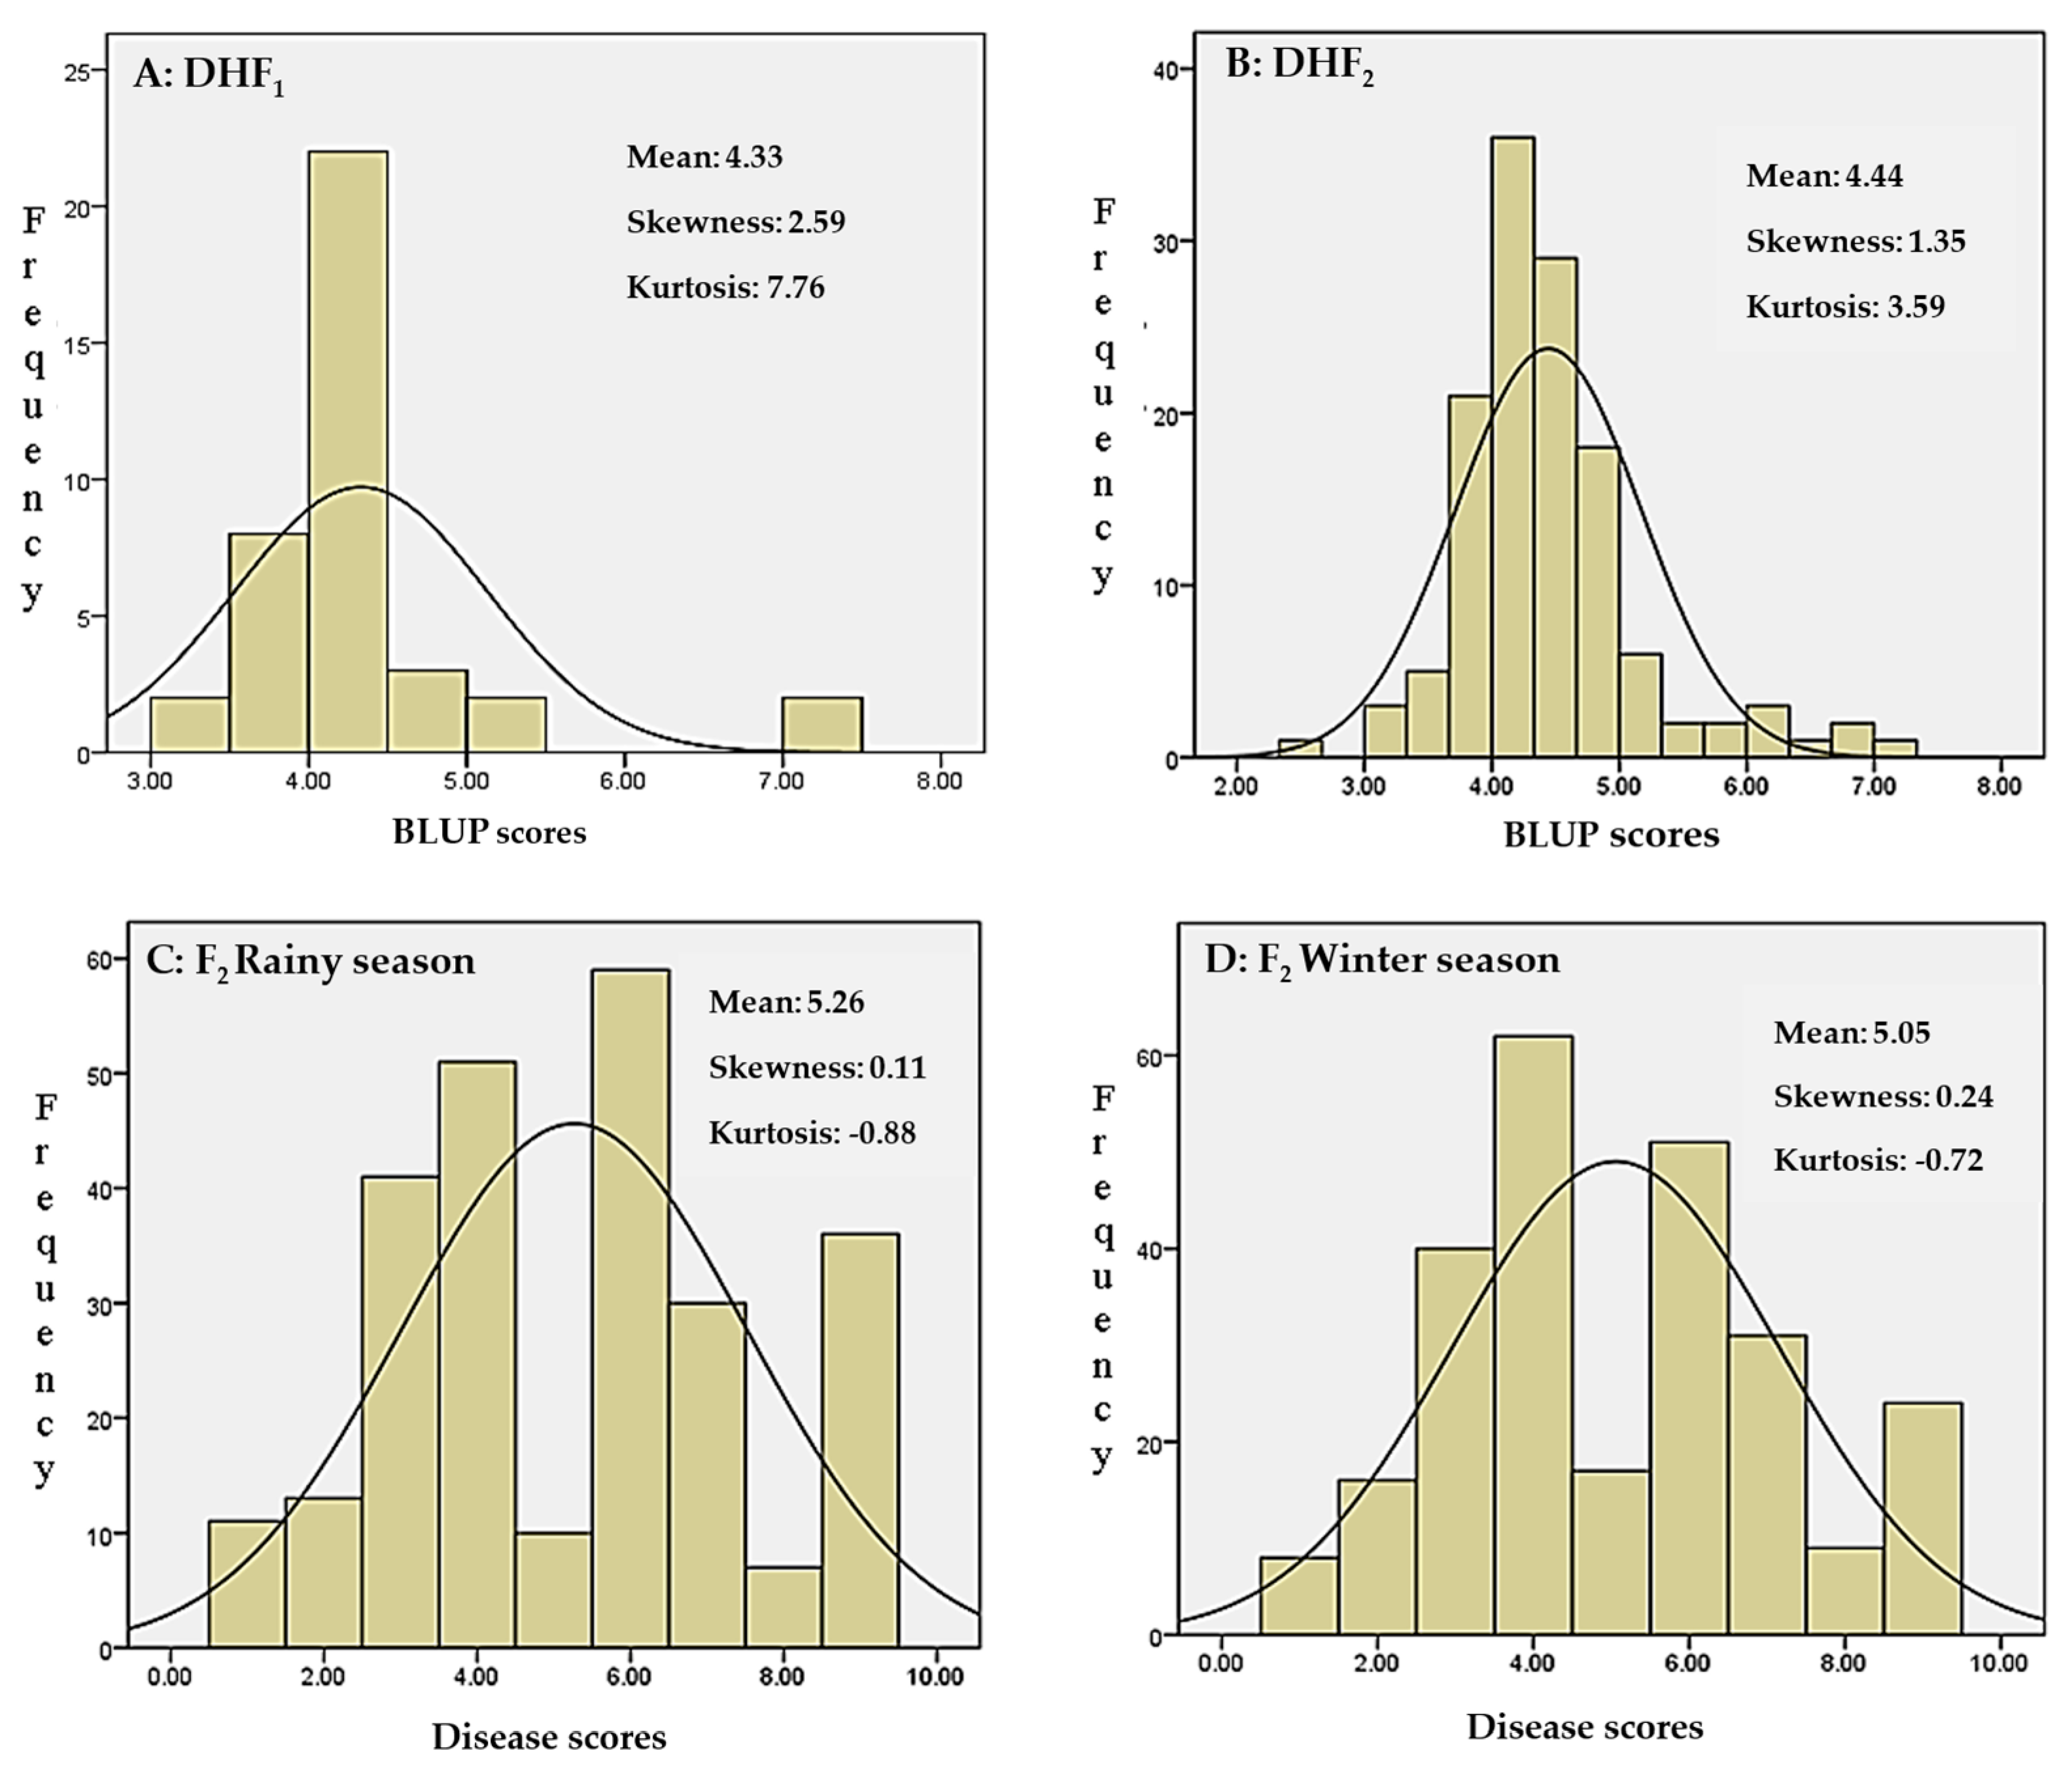
According to the coefficient of skewness, the distribution of DH lines (both DHF1 and DHF2) in both crosses in terms of FSR disease response was positively skewed (Table 5 and Table 6; Figure 3A–D) with leptokurtic distribution (>3.0) in the DH lines (DHF1 and DHF2). In the F2 population of both crosses, the distribution was positively skewed (Figure 4A–D) and platykurtic with a kurtosis value of less than 3.0 (Table 6).

3.5. Comparative Assessment of Genetic Variability Released from Doubled-Haploid Lines Produced from F1 and F2 Generations in Terms of Yield-Related Traits

The difference in the means and genetic variance among the F1- and F2-derived DH lines from both crosses for the six yield-related characteristics was significant. However, there was no significant difference in genetic variance (p = 0.05) between the DHF1 and DHF2 lines developed from either of the crosses (Table 7), and no significant genetic variability was observed among the testcross progenies derived from the DHF1 and DHF2 lines for the traits of plant height and yield.
Since the yield of an inbred plant is assessed through its testcross progenies, the mean values of the crosses of the selected doubled-haploid lines derived from the F1 and F2 generations of the cross VL1043 × CM212 were compared with an open-pollinated population of CM500 (Table 8). There was no significant difference in the means and genotypic variance between the two populations.

3.6. Characteristic Association among Productivity Traits

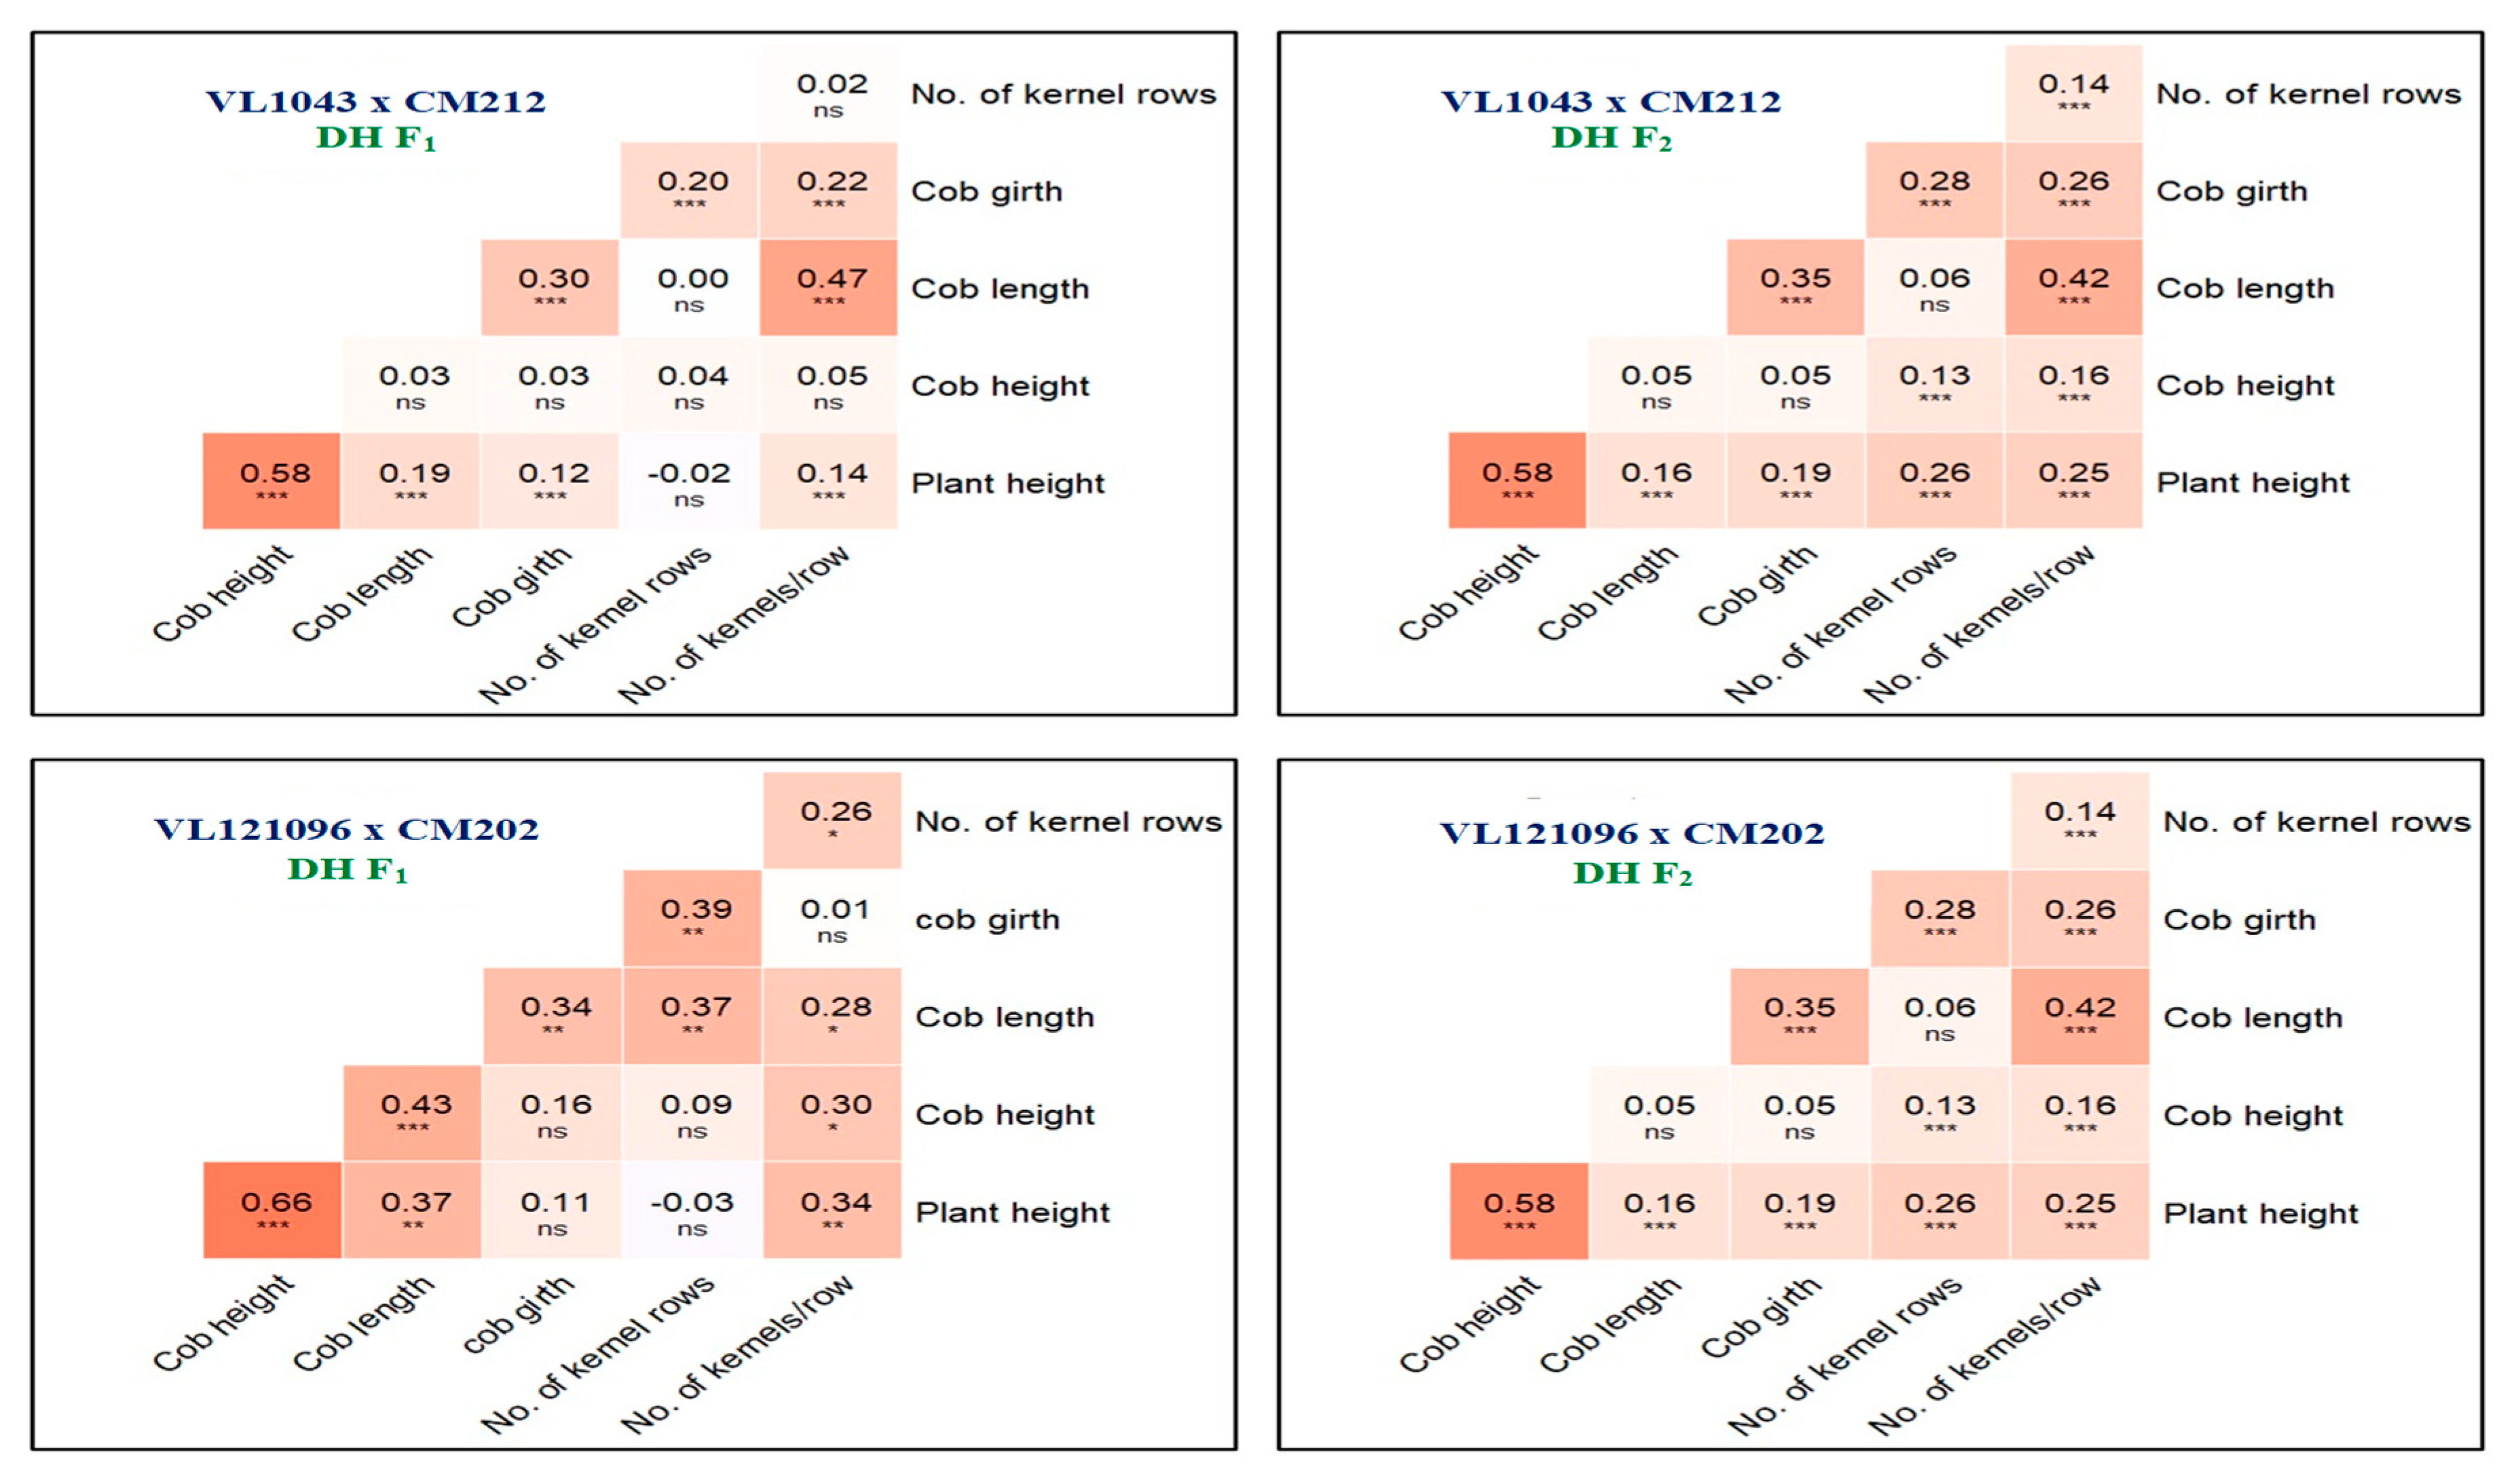
The estimation of the correlation coefficients among the productivity traits provided useful selection criterion for choosing desirable traits that could contribute to improved yield (Figure 5). The analysis of the associations among the traits indicated statistically significant relationships in both DHF1 and DHF2 plants. The cob height and cob length exhibited a significant and positive correlation with plant height in the DHF1 and DHF2 lines of both crosses. In the DHF1 lines, both cob girth and the number of kernels per row were non-significantly correlated with plant height; however, this correlation was positive and significant in the DHF2 lines. The traits of cob length and cob girth a showed positive and significant correlation in all populations. The association between the number of kernel rows per cob and the number of kernels per row was significant in the DHF1 and DHF2 lines of the cross VL121096 × CM202 and in the DHF2 lines of the cross VL1043 × CM212.

4. Discussion

The in vivo haploid-induction-based doubled-haploid (DH) method has enabled rapid generation advancement by significantly shortening breeding cycles and has emerged as an efficient strategy to increase the genetic gain per selection cycle [13]. This technology is a significant milestone in corn breeding, whereby six to eight generations of selfing or sib-mating have been reduced to just two seasons [30] for the development of completely homozygous lines [31]. Additionally, DH lines are expected to be independent of any effect of replication due to their 100% homozygosity. Therefore, the performance of DH lines can be reproduced and evaluated for additional quantitative traits. However, achieving higher genetic variability in DH lines is a prerequisite for ensuring response to selection. Considering this, DH lines were induced from both F1 and F2 plants in two different populations of maize and evaluated for their response to FSR disease. In this study, since the DH lines were the product of one (DHF1) or two (DHF2) meiotic cycles and were expected to be comparable to the F2 generation in terms of recombination [30,31,32], we attempted to estimate and compare the genetic variance of DHs produced from F1 and F2 generations and that of the F2 populations of two crosses. In the cross VL1043 × CM212, almost an equal number of DH lines were produced, whereas in the cross VL121096 × CM202, there was significant variation in the number of progenies produced when F1 and F2 plants were subjected to DH production. The cross VL1043 x CM212 was more responsive than the other cross in terms of the number of DHs produced. The varying number of DHs obtained from the crosses was mostly dependent on the response of each line/cross to DH induction. Genetic variations in the haploid induction rate across elite tropical germplasms, as well as higher induction rates in some single crosses, have previously been reported [15,30,33,34].
The mean squares attributable to seasons, checks, DHs, and DHs vs. seasons were found to be significant in both DHF1 and DHF2 plants in the cross VL1043 × CM212, which suggested significant differences among and between the DHs and the checks. The significance of the mean squares attributable to the DHs vs. seasons interactions implied that testing must be performed in the same season across multiple years for reliable results. The non-significance of the mean squares for the blocks in the DHF1 and DHF2 lines of both crosses indicated the absence of any detectable effects of edaphic factors and/or micro-environments associated with the blocks on the expression of FSR disease response and provided an indirect measure of the effectiveness of the artificial screening.
Best linear unbiased predictors (BLUPs) were calculated for the prediction of genetic effects and the estimation of genetic and non-genetic variances. This method was successfully implemented to classify the disease responses of the DHs and was simultaneously used to analyze and interpret the results in the present investigation. In both crosses, the majority of DH lines showed a moderately susceptible reaction, which may have been due to the parental genotypes CM212 and CM202 being moderately resistant. The number of resistant DHF2 lines was greater than the number of resistant DHF1 lines in both crosses. An additional meiosis cycle might have increased the genetic variability in the DHF2 lines through additional recombination [6,9].
More extreme candidates were noticed in the F2 lines than in DHs; since the bi-parentally derived F2 plants were genetically heterozygous and heterogeneous in nature, each plant’s allelic constitution was different. Therefore, they transgressed the parental limits in both crosses, and these extreme candidates (HR, R, and HS) could be utilized in a resistant breeding program [14].
Information on genetic variability and the relative contributions of genetic and non-genetic sources is essential in planning selection strategies to develop improved maize cultivars. In comparing the genetic variability released in the DHs and the F2 populations, we considered random samples of gametes or genotypes with no selection during their production [35].
The mean and range of the DHF2 plants were greater than those of the DHF1 plants in both crosses, which was expected due to the additional cycle of recombination in the F2 generation, resulting in increased genetic variability [9,36,37,38]. Unlike the DHs, the F2 plants were heterozygous; each F2 plant was expected to have a unique combination of linkage blocks from the two parents, which explained why the F2 plants showed a higher variation in FSR disease response than the DHs (Table 6) [39,40].
Estimating genetic variances is important for understanding the impact of genes on quantitative traits, predicting the response to selection, and determining a breeding procedure for the improvement of populations [41]. The difference in variance between the DHs and F2 progenies was determined using Levene’s test. The genetic variation between the DH lines was reflected in the estimate of additive components for FSR. A higher genetic variance (VG) was observed among the DHF1 lines than the DHF2 lines for the VL1043 × CM212 cross, whereas, for the VL121096 × CM202 cross, the genetic variance (VG) of the DHF2 lines was greater than that of the DHF1 lines. However, the difference in genotypic variance between the DHF1 and DHF2 lines was marginal. Linkages caused the VG to differ between the DHF1 and DHF2 lines. Coupling linkages led to a greater VG among the DHF1 lines than among the DHF2 lines, as was made evident by the decrease in the proportion of extreme types, a situation characteristic of the breakup of coupling linkages in the cross VL121096 × CM202. On the other hand, repulsion linkages led to a greater VG among the DHF2 lines irrespective of the kind of gene action operating and the hidden genetic variance that was released due to the breakup of repulsion linkages; this possibly resulted in higher proportions of extreme genotypes in the DHF2 lines at both ends of the phenotypic distribution in the cross VL121096 × CM202. This also suggested the presence of repulsion linkages in the genetic control of FSR resistance [38,42,43], and that the type of epistasis did not affect whether the genotypic variance (VG) was greater in the DHF1 lines or in the DHF2 lines. Differences in the VG were expected to be greater when the recombination frequency (r) was 0.25. An equal VG between the DHF1 and DHF2 lines could be expected when the two loci were unlinked [38]. In general, the F2 generation is the superior segregating population for initiating DH production, but the results obtained in this study revealed that the amount of genetic variability released depends on the parents involved in the cross. The extrapolation of these results to other elite line crosses should be carried out with caution, since the conclusions drawn are specific to the germplasm utilized. Future studies using other elite inbred lines should provide evidence for trends in regards to the superior segregating population for DH production.
Furthermore, the close correspondence between the GCV and PCV indicated the weaker influence of the environment on the expression of FSR disease reaction, and selection based on the phenotype performance would be effective. Compared to DHs, the genetic variance was more extensive in F2 plants, and there was a lower correspondence between the PCV and GCV for FSR disease response, which indicated the significant contribution of the environment to the phenotypic variation in the F2 progeny compared to DHs.
The heritability estimates were moderately higher in the DHs compared to the F2 plants as only additive, additive × additive interaction components were expected to contribute to genetic variance in the DHs. The frequency of recombinants was higher in the F2 population compared to the DHs. This was primarily because the frequency of recombinants in a DH population is predicted to be r, while it is r − (r2/2) in an F2 population, where ‘r’ is the frequency of recombination between two loci [35]. Such a high heritability for different characteristics has been reported previously in inbred maize lines [14,44].
Genetic analysis on the basis of skewness and kurtosis is more powerful and more worthwhile than mean and variance analysis [45], specifically when the nature of epistasis is to be established. Positive skewness was observed in the DH lines and the F2 populations, which indicated the involvement of complementary gene interactions [46]. In both the DHs and F2 plants, the selection intensity could be high, and the progress in improving the population performance may be enhanced by complementary epistasis [45,47], which might result in the greater number of desirable epistatic combinations in DHF2 followed by DHF1 and F2 plants.
Kurtosis, the fourth-degree statistic, characterizes the degree of a peak in a distribution relative to normal distribution. It indicates the relative number of genes controlling the trait under investigation [48]. The leptokurtic distribution (>3.0) observed in the DH lines (DHF1 and DHF2) suggested the involvement of a smaller number of genes in the FSR disease expression, with the majority of them displaying complementary epistasis with decreasing effects on the expression of resistance to FSR disease. Thus, intense selection by choosing the genotypes with resistance expression might contribute to rapid genetic gain.
In the F2 populations of both crosses, the distribution was positively skewed and platykurtic, with a kurtosis value of less than 3. This indicated that the FSR disease response was influenced by many genes, with the majority of them exhibiting complementary epistasis with increasing effects. Thus, the genetic gain expected in such conditions would be slow under mild selection, while it would be rapid under intense selection to improve FSR resistance.
In this study, a difference in genotypic variance (VG) between DHF1 and DHF2 lines did not contribute to significant differences in the performance of DH lines for FSR resistance. This result was confirmed earlier in maize, wherein an additional recombination via random mating in four populations produced no considerable increase in genetic gain [49], and random mating in a BC1 generation failed to generate a higher VG [50]. Simulation results also indicated that the cumulative selection gain with DHF2 lines was 3% higher than the cumulative gain with DHF1 lines by cycle 5 and 6% higher by cycle 15 with 200 QTL controlling a trait and a heritability (h2) of 0.50 [9]. These simulation results clearly showed that small per-cycle differences in terms of gains should be expected between DHF2 and DHF1 lines. Hence, the absence of a significant difference between the DHF2 and DHF1 lines in this study was not surprising.
The expectation was that the DHF2 lines would have marginally higher genetic variability than the DHF1 lines for the six yield-related traits in the test crosses, but no significant difference was found in the means and genotypic variance for the testcross progeny derived from the DHF1 and DHF2 lines. This could be attributed to the additional recombination that disrupted the repulsion-phase linkage [38]. Sleper and Bernardo [38] also concluded that the lack of the predominance of either of the linkage phases reduced the genetic variability in the DHF2 lines for yield and plant height in the cross they studied. They concluded that this could have been due to negligible epistasis as well as selection. Another study in maize, in which additional recombination via random mating in a BC1 generation was achieved, also failed to record a higher VG [50]. Studies of the correlation coefficients revealed very interesting associations among the productivity traits in the DHF1 and DHF2 lines of both crosses. The traits of cob length, cob girth, the number of kernel rows per cob, and the number of kernels per row exhibited significant associations among themselves, and the associations were particularly strong in the DHF2 plants. Many other studies have also revealed the importance of these productivity traits in producing a higher grain yield in maize [51,52,53].

5. Conclusions

Doubled-haploid (DH) technology has revolutionized plant breeding by ensuring 100% homozygous lines in a short time. In this study, the two crosses responded differently in terms of the number of DH lines produced and the genotypic variance among the DHF1 and DHF2 lines. The F2 generation exhibited more genotypic variance compared to the DHs. The heritability in the DH lines derived from the VL1043 × CM212 cross was greater than that in the F2 plants, whereas for the VL121096 × CM202 cross it was comparable, because the population size of the DHs was fairly small in this cross. The evaluation of the testcross progeny derived from the DHF1 and DHF2 lines failed to show any significant advantages for haploid induction from F2 plants in terms of genetic variance related to yield traits. The DHs resulting from this study could be used to develop hybrids with resistance to FSR disease.

Author Contributions

H.C.L. conceived the study. B.M.S.B. and G.T. conducted the experiments. B.M.S.B. and H.C.L. analyzed and interpreted the results and wrote the manuscript. M.G.M. assisted in data analysis and manuscript preparation. N.M. supervised the phenotyping work. D.C.B. and P.A. helped in generating DH populations. All authors have read and agreed to the published version of the manuscript.

Funding

This research was funded by Pioneer Hi-Bred Seeds Pvt. Ltd.

Institutional Review Board Statement

Not applicable.

Informed Consent Statement

Not applicable.

Data Availability Statement

Not applicable.

Acknowledgments

The authors are thankful to Pioneer Hi-Bred Seeds Pvt. Ltd. (Corteva Agriscience), Kallinayakahalli, Gouribidanur, for generating the doubled-haploid lines of maize that were used in this study. The first author is indebted to the Department of Minorities, Government of Karnataka, for extending fellowship during the period of investigation. All individuals included in this section have consented to the acknowledgement.

Conflicts of Interest

The authors declare no conflict of interest.

References

  1. Hooda, K.S.; Sekhar, J.C.; Karjagi, C.G.; Kumar, S. Identifying sources of multiple disease resistance in maize. Maize J. 2012, 1, 82–84. [Google Scholar]
  2. Desai, S.; Hegde, R.K.; Desai, S. A preliminary survey of incidence of stalk rot complex of maize in two districts of Karnataka. Indian Phytopath. 1991, 43, 575–576. [Google Scholar]
  3. Kumar, M.; Lal, H.C.; Jha, M.M. Assessment of yield loss due to post-flowering stalk rots in maize. J. Appl. Biol. 1998, 8, 90–92. [Google Scholar]
  4. Harlapur, S.I.; Wali, M.C.; Prashanth, M.; Shakuntala, N.M. Assessment of yield losses in maize due to charcoal rot in Ghataporabha Left Bank Cannal (GLBC) command area of Karnataka. Karnataka J. Agric. Sci. 2002, 15, 590–591. [Google Scholar]
  5. Cook, R.J. The incidence of stalk rot (Fusarium spp.) on maize hybrids and its effect on yield of maize in Britain. Ann. Appl. Biol. 1978, 88, 23–30. [Google Scholar] [CrossRef]
  6. Couto, E.G.D.O.; Cury, M.N.; E Souza, M.B.; Granato, S.C.; Vidotti, M.S.; Garbuglio, D.D.; Crossa, J.; Burgueño, J.; Fritsche-Neto, R. Effect of F1 and F2 generations on genetic variability and working steps of doubled haploid production in maize. PLoS ONE 2019, 14, e0224631. [Google Scholar] [CrossRef]
  7. Chaikam, V.; Lopez, L.A.; Martinez, L.; Burgueño, J.; Boddupalli, P.M. Identification of in vivo induced maternal haploids in maize using seedling traits. Euphytica 2017, 213, 177. [Google Scholar] [CrossRef] [Green Version]
  8. Chaikam, V.; Gowda, M.; Martinez, L.; Ochieng, J.; Omar, H.A.; Prasanna, B. Improving the Efficiency of Colchicine-Based Chromosomal Doubling of Maize Haploids. Plants 2020, 9, 459. [Google Scholar] [CrossRef] [Green Version]
  9. Bernardo, R. Should maize doubled haploids be induced among F1 or F2 plants? Theor. Appl. Genet. 2009, 119, 255–262. [Google Scholar] [CrossRef]
  10. Rober, F.; Gordillo, G.A.; Geiger, H.H. In vivo haploid induction in maize-performance of new inducers and significance of doubled haploid lines in hybrid breeding. Maydica 2005, 50, 275–283. [Google Scholar]
  11. Riggs, T.J.; Snape, J.W. Effects of linkage and interaction in a comparison of theoretical populations derived by diploidized haploid and single seed descent methods. Theor. Appl. Genet. 1977, 49, 111–115. [Google Scholar] [CrossRef] [PubMed]
  12. Jannink, J.-L.; Abadie, T.E. Inbreeding Method Effects on Genetic Mean, Variance, and Structure of Recurrent Selection Populations. Crop Sci. 1999, 39, 988–997. [Google Scholar] [CrossRef]
  13. Mowers, R.P.; Foster, D.J. Genetic Variance Estimates for Maize Yield, Grain Moisture, and Stalk Lodging for Doubled-Haploid and Conventional Selfed-Line Hybrids. Plants 2020, 9, 138. [Google Scholar] [CrossRef] [PubMed] [Green Version]
  14. Archana, R.; Lohithaswa, H.C.; Uma, M.S.; Shivakumar, K.V.; Sanathkumar, V.B.; Pavan, R. Genetic analysis of Fusarium stalk rot resistance in maize (Zea mays L.). J. Pharmacogn. Phytochem. 2019, SP1, 58–61. [Google Scholar]
  15. Chaikam, V.; Molenaar, W.; Melchinger, A.E.; Boddupalli, P.M. Doubled haploid technology for line development in maize: Technical advances and prospects. Theor. Appl. Genet. 2019, 132, 3227–3243. [Google Scholar] [CrossRef] [Green Version]
  16. Available online: www.jiffypot.com (accessed on 10 October 2020).
  17. Federer, W.T. Augmented Designs with One-Way Elimination of Heterogeneity. Biometrics 1961, 17, 447. [Google Scholar] [CrossRef]
  18. Anonymous. Indian Institute of Maize Research Bulletin; 2012. [Google Scholar]
  19. Payak, M.M.; Sharma, R.C. Disease rating scale in maize in India. In Techniques of Scoring for Resistance to Important Diseases of Maize; New Delhi: All India Coordinated Maize Improvement Project; IARI: New Delhi, India, 1983; pp. 1–5. [Google Scholar]
  20. Hooker, A.L. Association of resistance to several seedling, root, stalk, and ear diseases of corn. Phytopathology 1956, 46, 379–384. [Google Scholar]
  21. Schonfeld, P.; Werner, H.J. Beitragr zur teorie und anwendung linearer modelle. In Okonomische Progress, entscheidungsund gleichgewichtsmodelle; Krelle, W., Ed.; VCH Verlagsgesellschaft: Weinheim, Germany, 1986; pp. 251–262. [Google Scholar]
  22. Patterson, H.D.; Thompson, R. Recovery of inter-block information when block sizes are unequal. Biometrika 1971, 58, 545–554. [Google Scholar] [CrossRef]
  23. Federer, W.T.; Wolfinger, R.D. SAS code for recovering intereffect information in experiments with incomplete block and lattice rectangle designs. Agron. J. 1998, 90, 545–551. [Google Scholar] [CrossRef]
  24. Lush, J.L. Heritability of quantitative characters in farm animals. Hereditas 1945, 35, 356–375. [Google Scholar] [CrossRef]
  25. Burton, G.W.; DeVane, E.H. Estimating Heritability in Tall Fescue (Festuca arundinacea) from Replicated Clonal Material. Agron. J. 1953, 45, 478–481. [Google Scholar] [CrossRef]
  26. Robinson, H.F.; Comstock, R.E.; Harvey, P.H. Estimates of Heritability and the Degree of Dominance in Corn. Agron. J. 1949, 41, 353–359. [Google Scholar] [CrossRef]
  27. Johnson, H.W.; Robinson, H.F.; Comstock, R.E. Estimates of Genetic and Environmental Variability in Soybeans. Agron. J. 1955, 47, 314–318. [Google Scholar] [CrossRef]
  28. Snedecor, G.W.; Cochran, W.G. Statistical Methods, 5th ed.; Iowa State University Press: Ames, IA, USA, 1994. [Google Scholar]
  29. Dewey, D.R.; Lu, K.H. A Correlation and Path-Coefficient Analysis of Components of Crested Wheatgrass Seed Production. Agron. J. 1959, 51, 515–518. [Google Scholar] [CrossRef]
  30. Prigge, V.; Xu, X.; Li, L.; Babu, R.; Chen, S.; Atlin, G.N.; Melchinger, A.E. New insights into the genetics of in vivo induction of maternal haploids, the backbone of doubled haploid technology in maize. Genetics 2012, 190, 781–793. [Google Scholar] [CrossRef] [Green Version]
  31. Dunwell, J.M. Haploids in flowering plants: Origins and exploitation. Plant Biotechnol. J. 2010, 8, 377–424. [Google Scholar] [CrossRef]
  32. Boopathi, N.M. Genetic Mapping and Marker Assisted Selection: Basics, Practice and Benefits; Springer: New York, NY, USA, 2012; pp. 1–293. [Google Scholar] [CrossRef]
  33. Khulbe, R.K.; Pattanayak, A.; Kant, L.; Bisht, G.S.; Pant, M.C.; Pandey, V.; Kapil, R.; Mishra, N.C. Doubled haploid production in maize under Sub-montane Himalayan conditions using R1-nj-based haploid inducer TAILP1. Indian J. Genet. Plant Breed. 2020, 80, 261–266. [Google Scholar] [CrossRef]
  34. Nair, S.K.; Chaikam, V.; Gowda, M.; Hindu, V.; Melchinger, A.E.; Boddupalli, P.M. Genetic dissection of maternal influence on in vivo haploid induction in maize. Crop J. 2020, 8, 287–298. [Google Scholar] [CrossRef]
  35. Singh, B.D.; Singh, A.K. Marker-Assisted Plant Breeding: Principles and Practices; Springer: Berlin/Heidelberg, Germany, 2015; pp. 3–16. [Google Scholar] [CrossRef]
  36. Rotarenco, V.A.; Chalyk, S.T.; Jacota, A.; Eder, J. Breeding effect of selection at the level of haploid sporophyte in maize. Bull. Acad. Sci. Mold. 2007, 1, 92–98. [Google Scholar]
  37. Geiger, H.H.; Gordillo, G.A.; Koch, S. Genetic Correlations among Haploids, Doubled Haploids, and Testcrosses in Maize. Crop Sci. 2013, 53, 2313–2320. [Google Scholar] [CrossRef]
  38. Sleper, J.A.; Bernardo, R. Recombination and genetic variance among maize doubled haploids induced from F1 and F2 plants. Theor. Appl. Genet. 2016, 129, 2429–2436. [Google Scholar] [CrossRef] [PubMed]
  39. Melchinger, A.E.; Schmidt, W.; Geiger, H.H. Comparison of Testcrosses Produced from F 2 and First Backcross Populations in Maize. Crop Sci. 1988, 28, 743–749. [Google Scholar] [CrossRef]
  40. Schnicker, B.J. Comparison of Genetic Variances in F2 and Backcross Populations of Maize; Iowa State University Digital Repository: Ames, IA, USA, 1992; Available online: http://lib.dr.iastate.edu (accessed on 25 June 2019). [CrossRef]
  41. Choo, T.M. Doubled haploids for estimating additive epistatic genetic variances in self-pollinating crops. Can. J. Genet. Cytol. 1980, 22, 125–127. [Google Scholar] [CrossRef]
  42. Weir, B.S.; Cockerham, C.C.; Reynolds, J. The effects of linkage and linkage disequilibrium on the covariances of noninbred relatives. Heredity 1980, 45, 351–359. [Google Scholar] [CrossRef] [Green Version]
  43. Snape, J.W.; Simpson, E. The genetical expectations of doubled haploid lines derived from different filial generations. Theor. Appl. Genet. 1981, 60, 123–128. [Google Scholar] [CrossRef] [PubMed]
  44. Ogunniyan, D.; Olakojo, S. Genetic variation, heritability, genetic advance and agronomic character association of yellow elite inbred lines of maize (Zea mays L.). Niger. J. Genet. 2014, 28, 24–28. [Google Scholar] [CrossRef] [Green Version]
  45. Choo, T.M.; Reinbergs, E. Analyses of Skewness and Kurtosis for Detecting Gene Interaction in a Doubled Haploid Population. Crop Sci. 1982, 22, 231–235. [Google Scholar] [CrossRef]
  46. Snape, J.; Riggs, T.J. Genetical consequences of single seed descent in the breeding of self-pollinating crops. Heredity 1975, 35, 211–219. [Google Scholar] [CrossRef] [Green Version]
  47. Choo, T.M.; Christie, B.R.; Reinbergs, E. Doubled haploids for estimating genetic variances and a scheme for population improvement in self-pollinating crops. Theor. Appl. Genet. 1979, 54, 267–271. [Google Scholar] [CrossRef]
  48. Robson, D.S. Applications of the k 4 Statistic to Genetic Variance Component Analyses. Biometrics 1956, 12, 433. [Google Scholar] [CrossRef]
  49. Covarrubias-Prieto, J.; Hallauer, A.R.; Lamkey, K.R. Intermating F2 populations of maize. Genetika 1989, 21, 111–126. [Google Scholar]
  50. Arbelbide, M.; Bernardo, R. Random Mating before Selfing in Maize BC1 Populations. Crop Sci. 2004, 44, 401–404. [Google Scholar] [CrossRef]
  51. Reddy, V.R.; Jabeen, F.; Sudarshan, M.R.; Rao, A.S. Studies on genetic variability, heritability, correlation and path analysis in maize (Zea mays L.) over locations. Int. J. Appl. Biol. Pharm. 2012, 4, 195–199. [Google Scholar]
  52. Lingaiah, N.; Kumar, G.P.; Venkanna, V. Character association and path analysis for yield contributing and physiological parameters for grain yield in maize (Zea mays L.). Int. J. Pure Appl. Biosci. 2014, 2, 118–121. [Google Scholar]
  53. Supraja, V.; Sowmya, H.C.; Kuchanur, P.H.; Arunkumar, B.; Kisan, B. Genetic Variability and Character Association Studies in Maize (Zea mays L.) Inbred Lines. Int. J. Curr. Microbiol. Appl. Sci. 2019, 8, 646–656. [Google Scholar] [CrossRef]
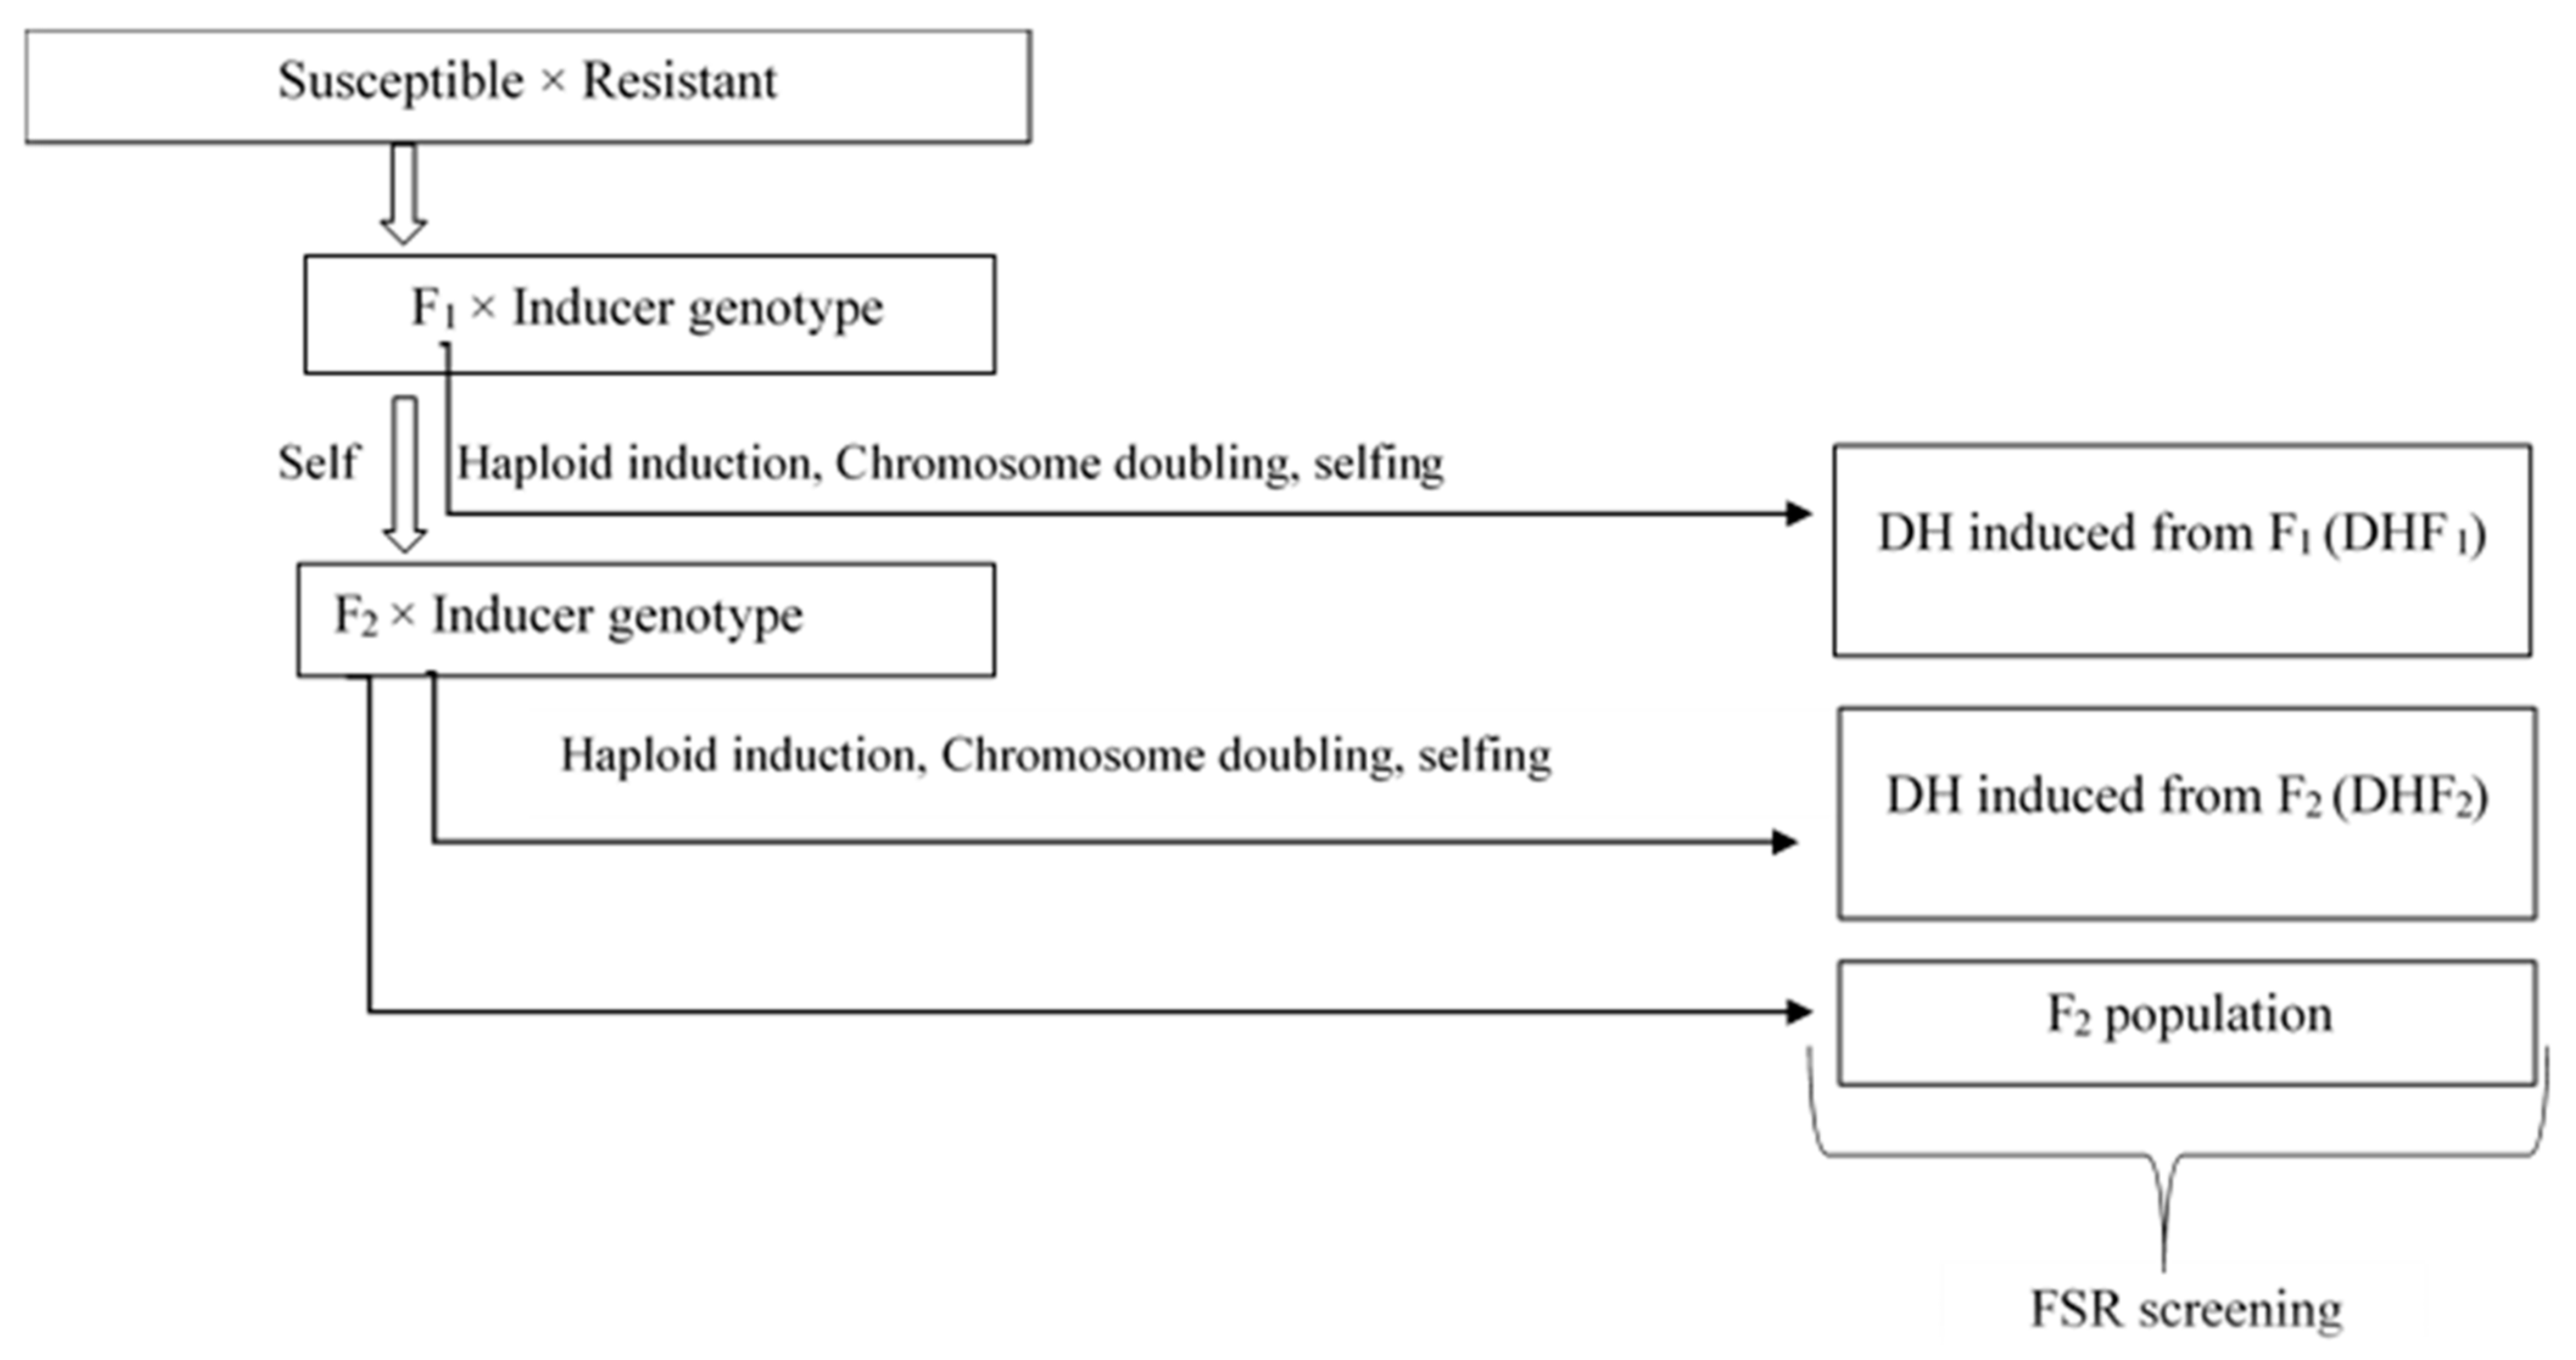
Figure 1. Experimental design used for the development of bi-parentally derived F2 and DHs induced from F1 and F2 plants.
Agronomy 13 00100 g001
Figure 2. Isolation, mass multiplication, and artificial inoculation of Fusarium verticilloides pathogen (A), FSR infected stalks were cut into small pieces, surface sterilized with sodium hypochloride and washed with distilled water (B), Air dried and transferred to PDA medium (C), Kept in BOD incubator for 5 days (D), The pathogen colonies examined for characters typical of F. verticilloides (E), Pure culture of FSR (F), Mycelia were mass multiplied in the conical flasks containing sterile PDB (G), Mycelial mat on 15th day was grounded and filtered (H), Pathogen spore count using Haemocytometer (I), The spore suspension was adjusted to 1 × 10⁶ spores per mL (J), Making 2 cm hole at 2nd internode of 45–50 days old plant with jabber (K), Injection of 1 × 10⁶ conidia/mL at 45 degree angle using syringe (L), Stalk were split opened 25–35 days after inoculation and evaluated using 1–9 disease rating scale.
Agronomy 13 00100 g002
Figure 3. Frequency distribution for FSR disease response in DHF1, DHF2, and F2 plants of the cross VL1043 × CM212 (A), DHF1 lines (B), DHF2 lines (C), F2 plants during rainy season (D), F2 plants during winter season.
Agronomy 13 00100 g003
Figure 4. Frequency distribution for FSR disease response in DHF1, DHF2, and F2 plants of the cross VL121096 × CM202 (A), DHF1 lines (B), DHF2 lines (C), F2 plants during rainy season (D), F2 plants during winter season.
Agronomy 13 00100 g004
Figure 5. Correlation coefficients estimated among yield traits in DHF1 and DHF2 plants of crosses VL1043 × CM212 and VL121096 × CM202. Values with ns, *, ** and *** implies non-significance, significant at p = 0.05, p < 0.01 and p < 0.001, respectively.
Agronomy 13 00100 g005
Table 1. Number of doubled haploids produced from F1 and F2 plants.
CrossNo. of Doubled-Haploid Lines
Induced from F1
(DHF1)
No. of Doubled-Haploid Lines
Induced from F2
(DHF2)
No. of Individual F2 Plants
VL1043 × CM212339329220
VL121096 × CM20239130258
Table 2. Disease rating scale for Fusarium stalk rot: [18,19,20].
ScoreSymptomsDisease Reaction
1Healthy or slight discoloration at the site of inoculationHighly Resistant
2Up to 50% of the inoculated internode is discoloredResistant
351–75% of the inoculated internode is discoloredModerately Resistant
476–100% of the inoculated internode is discoloredModerately Susceptible
5Less than 50% discoloration of the adjacent internodeSusceptible
6More than 50% discoloration of the adjacent internodeHighly Susceptible
7Discoloration of three internodesHighly Susceptible
8Discoloration of four internodesHighly Susceptible
9Discoloration of five or more internodes and premature death of a plantHighly Susceptible
Table 3. ANOVA of mean FSR disease scores of DHF1 and DHF2 plants induced from the crosses VL1043 × CM212 and VL121096 × CM202 over two seasons.
SourceVL1043 × CM212VL121096 × CM202
DHF1DHF2DHF1DHF2
Blocks120.05 ns120.02 ns50.05 ns50.038 ns
Seasons10.39 *13.51 ***10.33 ns10.399 ns
Checks1253.35 ***1223.02 ***196.80 ***196.00 ***
Doubled haploids3380.69 ***3280.89 ***381.15 ***1290.967 ***
Seasons vs. Doubled haploids3390.21 ***3290.22 ***390.22 *1300.164 ns
Error370.08370.06160.09160.128
Values with ns, * and *** implies non-significance, significant at p = 0.05 and p < 0.001, respectively.
Table 4. Classification of doubled-haploid lines induced from F1 and F2 plants into different response groups based on their BLUP values across two seasons.
Disease ScoreDisease ResponseVL1043 × CM212VL121096 × CM202
No. of Doubled-Haploid LinesNumber of Individual F2 PlantsNo. of Doubled-Haploid LinesNumber of Individual F2 Plants
DHF1DHF2Rainy Season 2019Winter Season 2019–2020DHF1DHF2Rainy Season 2019Winter Season 2019–2020
1Highly resistant0000020200001108
2Resistant0001030300011316
3Moderately resistant5961232210294140
4Moderately susceptible23522010810325835162
5Susceptible3531414102101017
>6–9Highly susceptible101643490207132115
Population size33932922022039130258258
Table 5. Genetic estimates of doubled-haploid lines induced from F1 and F2 plants in reaction to FSR disease across two seasons in maize.
Genetic ParametersGenetic Estimates (BLUP Scores)
VL1043 × CM212VL121096 × CM202
DHF1DHF2DHF1DHF2
Mean4.444.454.334.44
Range3.51–7.892.79–8.483.20–7.282.42–7.31
Standardized range0.991.280.941.10
Genetic variance0.280.410.550.40
Residual variance0.080.060.090.13
Phenotypic coefficient of variation13.5115.5018.4716.39
Genotypic coefficient of variation11.9214.4817.1214.24
Heritability0.780.870.860.75
Genetic advance0.961.241.421.13
Genetic advance as per cent mean21.6527.8932.6925.49
Skewness2.201.812.591.35
Kurtosis7.305.817.763.59
Table 6. Genetic estimates of bi-parentally derived F2 population in reaction to FSR disease in maize.
Genetic ParametersVL1043 × CM212VL121096 × CM202
Rainy Season 2019Winter Season 2019–2020Rainy Season 2019Winter Season 2019–2020
Mean4.514.605.265.05
Range1–91–91–91–9
Standardized range1.771.741.521.58
Genetic variance0.780.634.393.41
Residual variance0.711.030.701.00
Phenotypic coefficient of variation27.0727.9842.8641.55
Genotypic coefficient of variation19.6117.2439.8236.52
Heritability0.520.380.860.77
Genetic advance1.321.014.013.34
Genetic advance as per cent mean29.2521.8976.1966.15
Skewness0.710.680.110.24
Kurtosis1.320.93−0.88−0.72
Table 7. Trait means and genetic variance (VG) in doubled-haploid lines produced from F1 and F2 plants of crosses VL1043 × CM212 and VL121096 × CM202 for yield-related traits in maize.
CharactersVL1043 × CM212 VL121096 × CM202
Meant—Calculated
for Comparing Means
VGStandard
Deviation
Meant—Calculated
for Comparing Means
VGStandard
Deviation
DHF1DHF2 DHF1DHF2DHF1DHF2DHF1DHF2 DHF1DHF2DHF1DHF2
Plant height (cm)129.76121.2643.66317.4363.2117.8219.06116.421206.27263.06488.4116.2222.10
Ear height (cm)57.4845.3497.02192.68167.113.8812.9351.249.34.79105.31183.3210.2613.54
Ear length (cm)11.5413.1526.943.633.641.911.9111.3613.0211.733.823.821.951.95
Ear circumference (cm)11.1111.9917.811.011.131.001.0611.4112.216.090.951.70.971.30
Kernel rows per cob12.4712.362.151.91.721.381.3112.0712.997.383.553.051.881.75
Kernels per row21.5220.912.8927.8114.455.273.8016.3821.315.2130.9322.075.564.70
table t-value = 1.96 (p = 0.05) table t-value = 1.96 (p = 0.05)
Table 8. Mean yield in testcross progenies of doubled-haploid lines produced from F1 and F2 generations of the cross VL1043 × CM 212.
Crosses Derived from DHF1 LinesCrosses Derived from DHF2 Lines
Mean0.7580.757
Standard deviation0.2990.217
σ2A0.1510.133
Disclaimer/Publisher’s Note: The statements, opinions and data contained in all publications are solely those of the individual author(s) and contributor(s) and not of MDPI and/or the editor(s). MDPI and/or the editor(s) disclaim responsibility for any injury to people or property resulting from any ideas, methods, instructions or products referred to in the content.