Article

Printed Sowing of High-Density Mechanical Transplanted Hybrid Rice Can Reduce the Amount of Fertilizer Needed

College of Agronomy, Hunan Agricultural University, Changsha 410128, China
*
Author to whom correspondence should be addressed.
Agronomy 2022, 12(9), 2002; https://doi.org/10.3390/agronomy12092002
Submission received: 31 July 2022 / Revised: 22 August 2022 / Accepted: 22 August 2022 / Published: 25 August 2022

Abstract

:
In this study, we investigated how printed sowing machine transplanting impacts the yield of single-season rice by increasing the planting density and decreasing the amount of fertilizer needed. The study was aimed at exploring the relationships between the amount of fertilizer, transplanting density, and rice yield. During the rice growing season from 2019 to 2020 in the middle and lower reaches of the Yangtze River, six different field trials were conducted: low density and high fertilizer (LDHF), low density and low fertilizer (LDLF), middle density and high fertilizer (MDHF), middle density and low fertilizer (MDLF), high density and high fertilizer (HDHF), and high density and low fertilizer (HDLF). It turns out that compared to the LDHF, the thousand seed weight, the spikelets per panicle, the seed-setting rate, and the SPAD value at the filling stage decreased by 0.17% and 0.60%, 5.36% and 10.59%, 5.70% and 4.66%, and 17.52% and 4.93% in 2019 and 2020, respectively. However, compared to the LDHF, the panicles increased by 15.31% and 17.18%, respectively, the LAI at the filling stage increased by 1.92% and 0.48%, respectively, and the accumulation of dry matter above ground at the maturity stage also increased by 3.74% and 16.79% in 2019 and 2020, respectively. Therefore, compared to the yield of rice in the LDHF, the yield of rice in the HDLF increased by 5.06% and 6.64%. The yields of rice in the LDLF, MDHF, MDLF, and HDHF were lower than that in the LDHF and HDLF. The partial least squares path model (PLSPM) analysis showed that the fertilizer, density, and aboveground dry matter had positive effects on the yield, while the SPAD value and LAI had negative effects on the yield. This research shows that increasing the transplanting density can compensate for the yield loss caused by reducing the fertilizer amount. However, no combination of the transplanting density and fertilization amount can achieve the purpose of increasing the yield.

1. Introduction

China is the largest rice-producing country in the world. In China, the average planting area of hybrid rice every year exceeds 16.5 million hectares, accounting for 57% of the total rice planting area. China has made great contributions to national food security [1]. Therefore, the increase in rice production in China will play an important role in its food industry. The amount of fertilizer and transplanting density are important factors that affect rice yield [2,3,4]. In China, hybrid rice cultivation generally adopts the planting mode of low density and a high fertilizer application rate to improve the rice yield [5]. Studies have shown that fertilizer usually increases food yields by 40–60% [2], but excessive fertilization not only leads to the reduction of the yield and also brings about a low fertilizer utilization rate and environmental pollution [6]. In addition, related studies have shown that the rice yield decreased when the rice transplanting density was too high or too low. A transplanting density that is too high will lead to plants competing for light and heat resources, the breeding of diseases, and an increase in their risk of lodging [7]. It can also lead to the overgrowth of weeds, waste fertilizer, and a reduction in food production [8]. Only a reasonable amount of fertilizer and transplanting density can ensure the normal growth of rice, improve the plant growth environment, improve the fertilizer utilization rate, and increase the yield [9,10]. Therefore, there is still room to explore selecting planting density and fertilizer amount.
Hunan, located in the middle and lower reaches of the Yangtze River in China, is a traditional double cropping rice planting area in China [11]. In recent years, cities in China have expanded, leading to a shortage of agricultural workers. The development of science and technology has improved the mechanization of agricultural production. This has caused some young farmers to form planting teams and lease idle farmland so that land activities become more concentrated [12,13]. In rice production, these groups have been unable to complete a large area of early rice harvest and late rice farming tasks in the short term. In order to improve land use efficiency, they have chosen to use part of the land for single-cropping rice and wheat, rape, and other crop rotations.
The printing sowing technology was first put forward by Huang M in 2018 [14]. It has the advantages of reducing seeding-amount, prolonging seedling age, increasing yield, and has great value in alleviating the contradiction between early rice emergency harvest and late rice emergency sowing in double cropping rice areas.
In the past, the research about increasing the density and decreasing the fertilizer of this technology has been mainly focused on double-cropping rice planting [15,16], and has not been reported in single-season rice production. Therefore, this study was carried out in 2019 and 2020 using printing sowing machine-transplant mode. In the study, agronomic traits affecting rice yield, including the aerial biomass, LAI, SPAD, and yield components, were tested. The objectives of this study were as follows: (1) explore the effects of different fertilizer rates and planting densities on rice growth and yield, (2) determine the optimal combination of planting density and fertilization rate. This work is expected to provide a reference for “saving cost and increasing income” in rice production and provide support for promoting the transplanting technology of printing sowing for hybrid rice.

2. Materials and Methods

2.1. Experimental Location and Weather Conditions

The experiment was conducted at the teaching and research base of Hunan Agricultural University in Yanxi town (28°30′ N, 113°84′ E), Liuyang County, Hunan Province, China, during the rice growing seasons in 2019 and 2020. The planting method used in this experiment was rice–rape rotation. The experimental area was 5000 m2, a small hilly basin with a subtropical monsoon humid climate. The annual average temperature is 17.3 °C, and the annual average precipitation is 1358.6–1552.5 mm. The soil was paddy soil with 23.41 g·kg−1 organic carbon, 1.73 g·kg−1 total N, 0.64 g·kg−1 total P. and 19.35 g·kg−1 total K, and its pH value was 5.51. The cumulative solar radiation (Figure 1A) and average temperature per day (Figure 1B) during the rice growing seasons in 2019 and 2020 were measured at a meteorological station near the experimental site and are shown in Figure 1.

2.2. Arrangement of Field Experiments

The tested variety in this experiment was Jingliangyou Huazhan, which is the main variety for rice production in Hunan Province and was bred by Jing 4155S (♀) × Huazhan (♂). Its average plant height is 115.5 cm, its spike length is 25.2 cm, and its seed setting rate is 85.5%. The whole growth period was 138.5 days, the gel consistency was 81 mm, and the amylose content was 14.1%. The experiment adopted the split-plot trial method, with the planting density analyzed in the main plot and the fertilizer application in the split plot. The plot area was 260 m2 in 2019 and 2020. Six treatments in the experiment were set up and conducted three times. The details regarding the fertilizer application and transplanting density of each treatment are shown in Table 1. In this experiment, a mechanized operation was used in the whole process. The basic operation process of fertilization was as follows: first, a basic fertilizer was applied, then the field was smoothed, and the seedlings were thrown. After the seedlings grew, they were isolated into different plots and cultivated with tillering fertilizer. Each plot was isolated by a ridge that was covered with plastic film and whose height was 20 cm. Booting fertilizer was applied when the rice was in the booting stage. In 2019, the experiment schedule was arranged for sowing and seedling raising on 1 May, transplanting on 23 May, and harvesting around 20 September. In 2020, the experimental schedule was sowing and seedling raising on 10 May, transplanting on 4 June, and harvesting on 30 September. Before rotary tillage, 300 kg/ha of lime was applied to adjust the soil pH to reduce Cd absorption. Field water management and conventional chemical treatments were used to control pests, pathogens, and weeds.

2.3. Sample and Data Collection

In the mature period, 50 plants (except marginal plants) were randomly selected from each sample plot according to the five-point sampling method, and the panicle number per unit area, grain number per panicle, seed setting rate, and 1000-grain weight were measured. At the maturity stage of the rice, mechanical harvesting was used in all plots to calculate the rice yield. The SPAD values of the rice leaves at the tillering stage, jointing stage, full heading stage, and filling stage were measured using SPAD-502 (Soil-Plant Analysis Development Section, Minolta Camera Co., Osaka, Japan). A total of 10 leaves were randomly selected from each plot, and the upper, middle, and lower points of each leaf were measured to calculate the average SPAD value.
The aboveground dry matter was collected at the mid-tillering stage, jointing stage, full heading stage, mid-filling stage, and maturity stage. Five holes of dry matter were taken from each plot, and then the roots of the dry matter were cut off. The leaves, stems, sheaths, and ears of the dry matter were separated and placed in a drying box for 30 min at a constant temperature of 105 °C. The dry matter was dried to a constant weight by the drying box at a constant temperature of 80 °C. When the dry matter became cool and its temperature was stable, it was weighed (DHG-9625A, Shanghai Yiheng Scientific Instrument Co., Ltd., Shanghai, China).
Lastly, the aboveground dry matter weight was calculated. The leaf area index (LAI) of each plot was collected by an LI-2200C area meter (LI-COR, Lincoln, NE, USA) at the middle tillering stage, jointing stage, full heading stage, middle filling stage, and maturity stage according to the five-point sampling method.

2.4. Data Analysis

The statistical analysis included an analysis of variance (ANOVA). At the probability level of 0.05, the least significant difference (LSD) was used to determine the comparative average number. All the statistical analyses were formed using SPSS (24.0; SPSS Inc., Chicago, IL, USA), and charts were generated using OriginPro 2021 (OriginLab, Hampton, MA, USA). The standardized coefficients in our path model were validated by R (v.3.4.0, Auckland, New Zealand) with the package “PLSPM” [17].

3. Results

3.1. Rice Yield and Its Components

The analysis of variance showed that the yield differences among the years, density, fertilizer, interactions between the year and fertilizer, and interactions between the density and fertilizer were all highly significant (p < 0.01). The thousand-seed weight differences among the fertilization and the interactions between the fertilization and density reached a highly significant level (p < 0.01). The effect of density on the panicle number per unit area reached a highly significant level (p < 0.01). The results of the variance analysis show that only the density factor had a significant effect on the grain number per panicle (p < 0.05), and only the year factor had a highly significant effect on the seed setting rate (p < 0.01).
The yields with the high density and low fertilizer treatment (HDLF) were the highest, at 3.10~10.91% and 1.45~21.23% higher than those of the other treatments in 2019 and 2020, respectively (Table 2). The thousand-seed weight in the MDHF treatment was the highest, at 2.46~4.49% and 0.72~6.02% higher than those in the other treatments. In terms of the panicles per unit area, the results of the two-year experiments show that the HDLF treatment had the highest, at 2.96~18.61% and 4.75~26.50% higher than those of the other treatments. In terms of the spikelets per panicle, the MDLF treatment had the highest, at 5.17~11.85% and 2.06~16.26% higher than those of the other treatments. The seed setting rate of the LDHF treatment was the highest, which was 3.27~8.84% and 2.89~5.77% higher than that of other treatments.

3.2. SPAD Values

The analysis of variance showed that during the whole growth period of the rice, the difference in the SPAD values between the years was significant (p < 0.01). Fertilization, the interaction between the year and fertilization, and the interaction between the density and fertilization had highly significant differences in the SPAD values at the filling stage (p < 0.01). The effect of density on the SPAD value at the filling stage was significantly different (p < 0.05), and the effect of the interaction between the year and density on the SPAD value at the jointing stage was significantly different (p < 0.01).
At the tillering stage, the treatment with the highest SPAD value in 2019 was the LDLF, which was 6.15% higher than that of the LDHF. The treatment with the highest SPAD value in 2020 was the MDLF, which was 1.24% higher than the LDHF (Table 3). At the jointing stage, the MDHF had the highest SPAD value in 2019, 7.90% higher than the LDHF; the treatment with the highest SPAD value in 2020 was the LDHF, and the other treatments were 4.28~8.30% lower than that of the LDHF. At the heading stage, the MDHF had the highest SPAD value in 2019, 5.35% higher than that of the LDHF. In 2020, the SPAD value of the LDHF treatment was the highest, and the other treatments were 1.17~3.17% lower than that of the LDHF treatment. At the filling stage, the SPAD value of the LDHF was the highest, and the other treatments were 8.35~19.39% and 1.92~4.93% lower than that of the LDHF in 2019 and 2020, respectively.

3.3. Leaf Area Index

The results of the variance analysis show that (Table 4) at the tillering stage, the difference in the influence of density on the LAI reached a highly significant level (p < 0.01). At the jointing stage, the influence of the year and fertilizer on the LAI reached a significant level (p < 0.05), while the influence of density on the LAI reached an extremely significant level (p < 0.01). At the heading stage, except for the interaction between the year and the transplanting density, the influence of various factors on the LAI reached a highly significant level (p < 0.01). At the filling stage, only the influence of density on the LAI reached a highly significant level (p < 0.01).

3.4. Dry Matter Accumulation

At the tillering stage, the LAI of the MDHF treatment was the highest in 2019 and 2020, at 16.67~53.42% and 15.69~59.46% higher, respectively, than that of the other treatments. During the jointing stage, the two-year test results show that the LAI of the HDHF was the highest, at 10.76% and 31.88% higher than that of the LDHF. At the heading stage, the LAI of each treatment in 2019 was the highest in the MDLF, at 39.04% higher than that of the LDHF, and in 2020, the LAI of each treatment was the highest in the MDHF, at 13.66% higher than that of the LDHF. In the filling stage, the HDLF treatment had the highest LAI in 2019 and 2020, at 1.91% and 0.48% higher, respectively, than that of the LDHF.
The results of variance analysis show that (Table 5) the influence of the year factor on the aboveground dry matter at the jointing, and mature stages of rice reached a highly significant level (p < 0.01). The effect of the density factor on the aboveground dry matter reached an extremely significant level at the tillering stage, filling stage, and mature stage (p < 0.01). The effect of fertilizer on the aboveground dry matter reached an extremely significant level at the heading stage (p < 0.01), while the effect of fertilizer on the aboveground dry matter quality reached a significant level at the filling stage and maturity stage (p < 0.05). The effect of the interaction between the fertilizer and density on the aboveground dry matter at the heading and filling stages of the rice reached an extremely significant level (p < 0.01), and the effect of the interaction between the fertilizer and density on the aboveground dry matter at maturity reached a significant level (p < 0.05).
At the tillering stage, the aboveground dry matter mass of the HDHF treatment was the highest in 2019 and 2020, at 42.22% and 63.41% higher, respectively, than that of the LDHF treatment. At the jointing stage, in 2019 and 2020, the aboveground dry matter quality of the HDLF treatment was the highest, at 9.18% and 35.10% higher, respectively, than that of the LDHF treatment. At the heading stage, in 2019, the aboveground dry matter of the LDHF treatment was the highest, at 11.44~51.86% higher than those in the other treatments. In 2020, the aboveground dry matter of the HDLF treatment was the highest, at 11.18~53.99% higher than those in the other treatments. In the filling stage, the aboveground dry matter mass of each treatment in 2019 and 2020 was the highest in the HDLF treatment, at 0.42% and 21.58%, respectively, higher than that in the LDHF treatment. In the mature period, the results of two years showed that the aboveground dry matter of the HDLF treatment was the highest, at 3.74% and 16.79% higher, respectively, than that of the LDHF treatment.

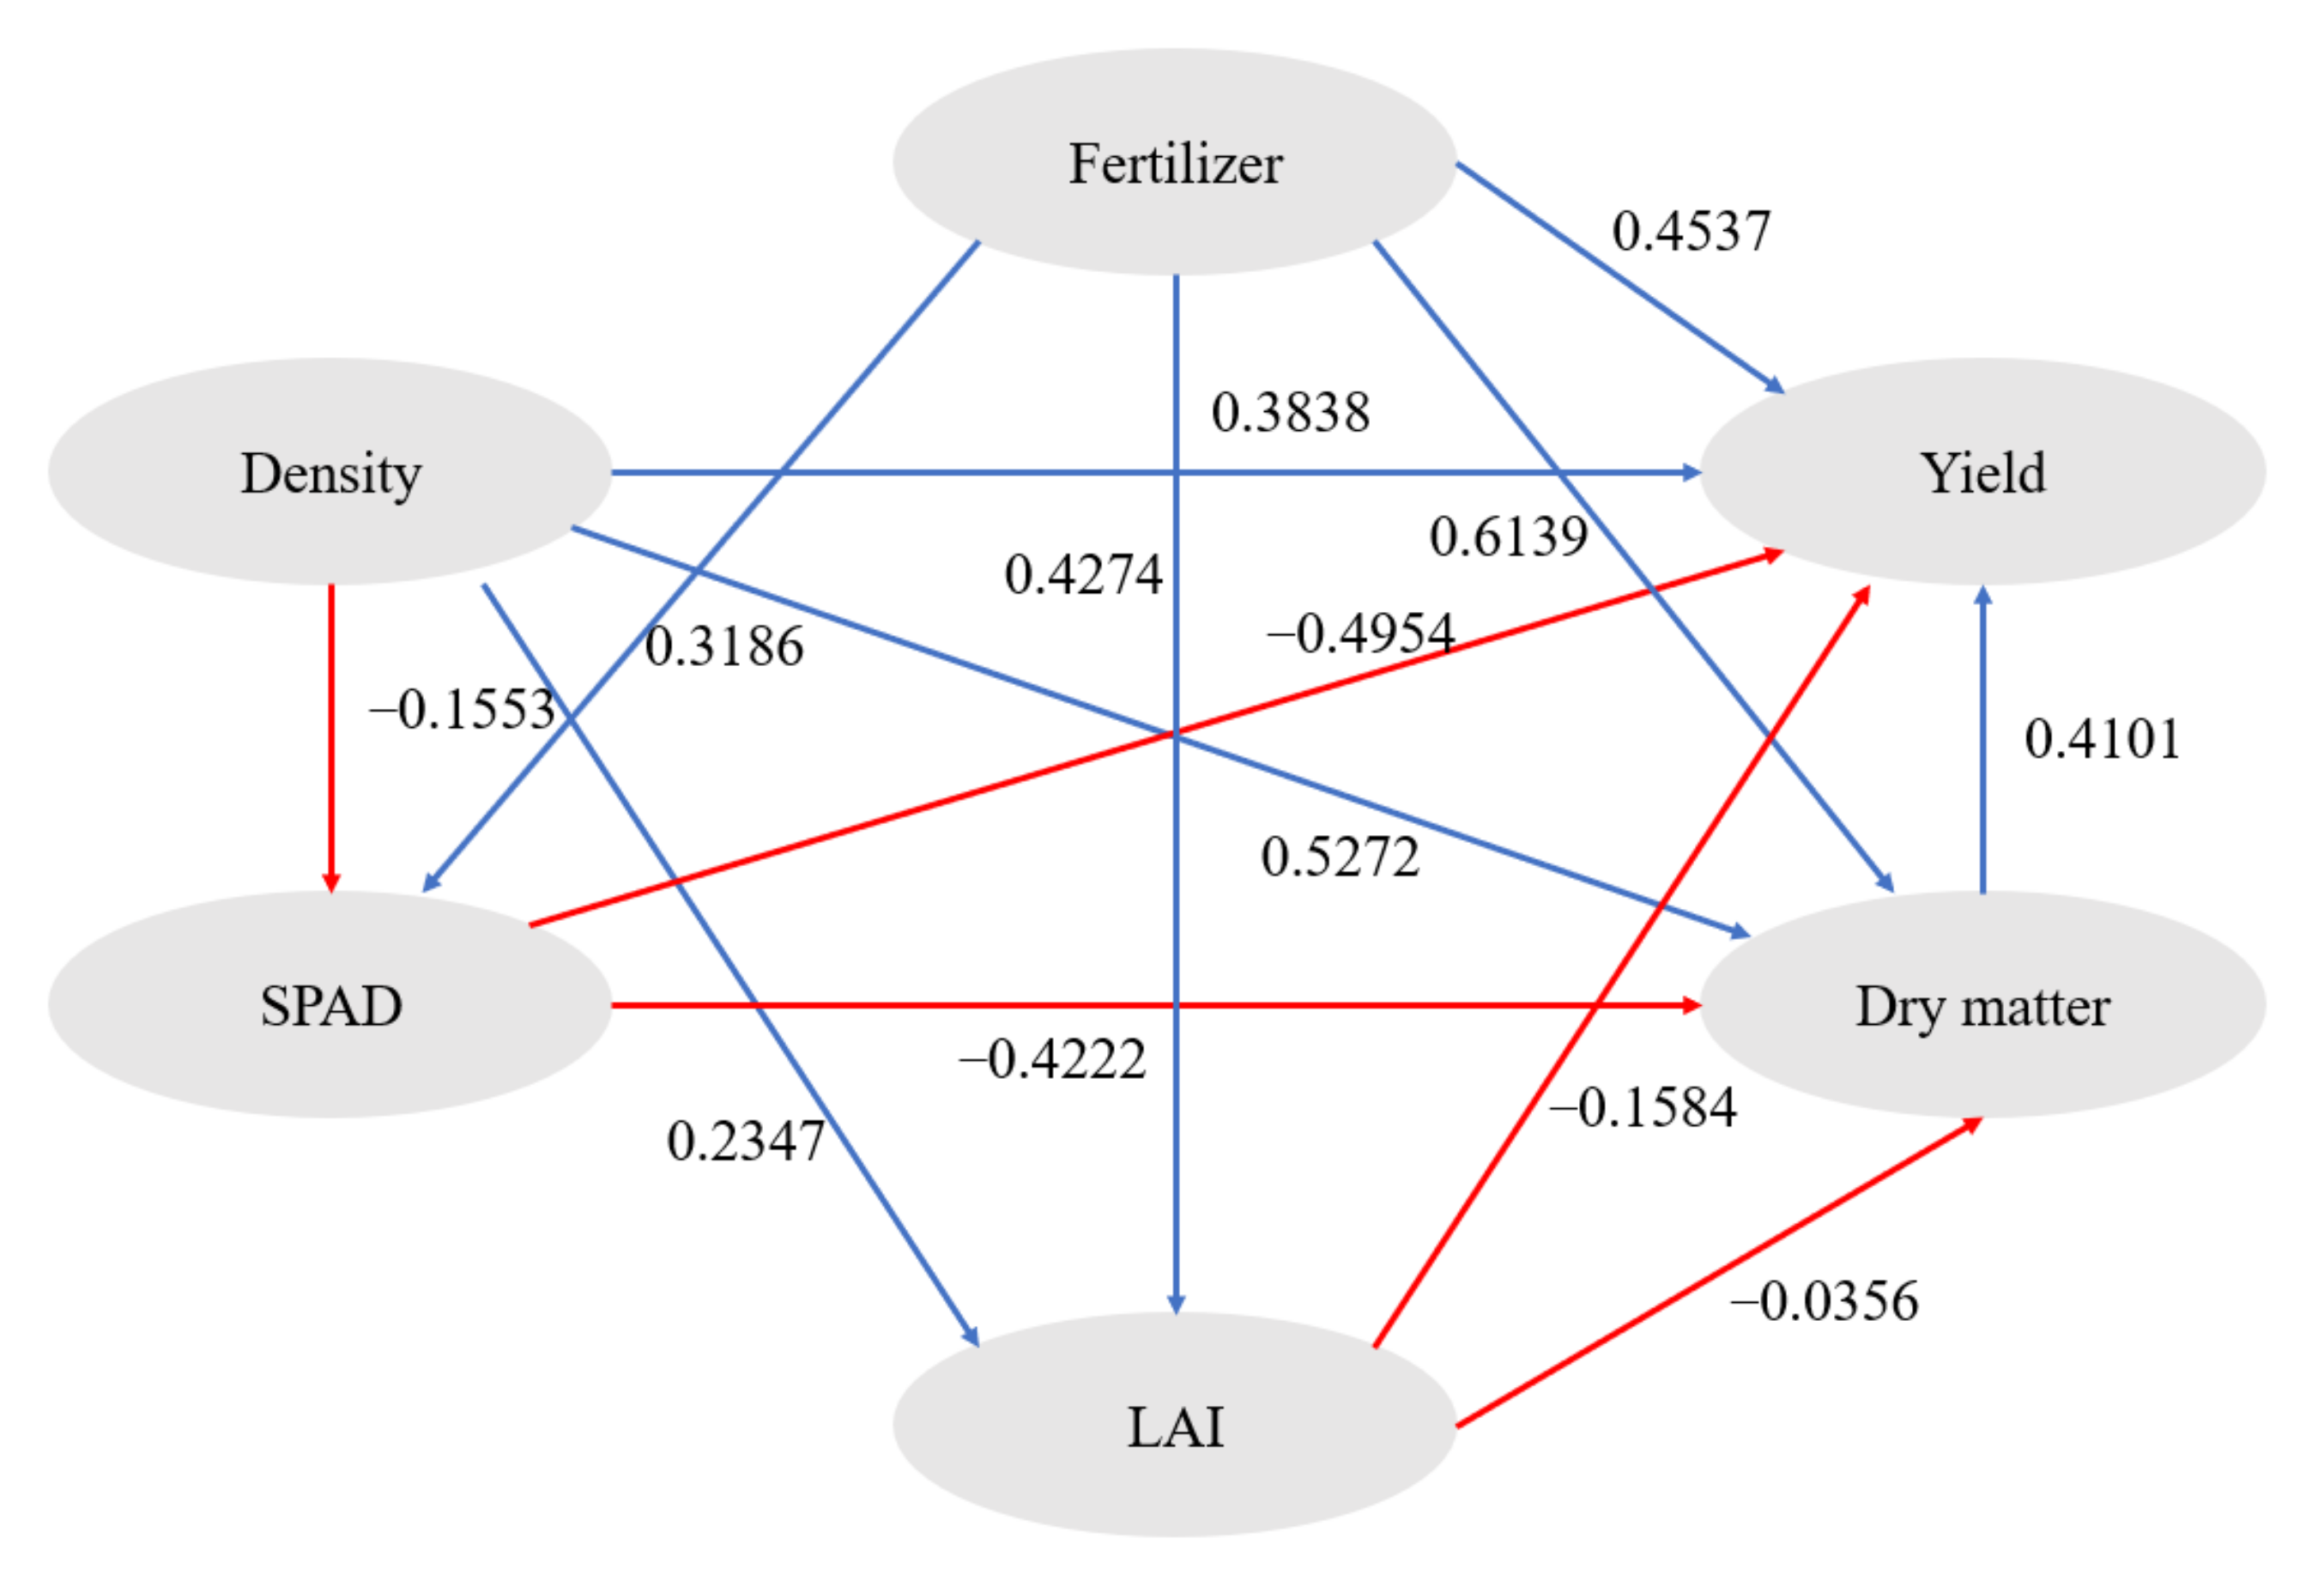
3.5. PLS-PM Analysis

The original PLS-PM model is composed of a structural model and a measurement model and is a comprehensive analysis model for analyzing the complex causal relationship between multiple variables. This model can not only solve the multicollinearity problem between indicators but can also calculate the direct and indirect effects of different variables on response variables [18].
The PLS-PM results (Figure 2) show that the direct effects of the fertilizer, transplanting density, and dry matter quality on the yield were all positive, and the SPAD and LAI had negative direct effects on the yield. The direct effect of the SPAD on the yield had a value of −0.4954, the indirect effect had a value of −0.1731, and the total effect had a value of −0.6685. The direct effect of the LAI on the yield had a value of −0.1584, the indirect effect had a value of −0.0146, and the total effect had a value of −0.1730, which was mainly due to the negative correlation between the grain filling and leaf wilt and apoptosis in the late growth stage of the rice. The fertilizer and density factors affected the yield through multiple paths. The direct effect of the fertilizer factor on the yield had a value of 0.4537, the indirect effect had a value of −0.0349, and the total effect had a value of 0.4188. That is to say, when the fertilizer effect was strong, it directly led to an increase in the yield. However, due to multiple indirect paths, this trend was greatly slowed down, which was mainly manifested in the apoptosis of the leaves, weakening photosynthesis, and further alleviating the trend of the yield increase through the weakening effect of the SPAD and LAI. The direct effect of the density on the yield had a value of 0.3838, the indirect effect had a value of 0.2794, and the total effect had a value of 0.6632, indicating that the increase in the density had a positive effect on the increase in the yield.

4. Discussion

Research shows that the planting density can be increased by increasing the hill number per square meter or the seedling number per hill [19]. The method used in this experiment was the former. According to the results of the two-year experiment (Table 2), at a transplanting density of 160,000 hills·ha−1, the yield of the machine-planted rice decreased when the fertilizer application was reduced from a high level to a low level. However, when the transplanting density reached 240,000 hills·ha−1, its yield did not decrease due to the reduction in fertilizer application. This indicates that reducing the fertilizer application can increase the rice population productivity but yield reduction cannot be achieved by increasing the transplanting density, which is consistent with the results of Huang et al. (2018) and Zhu et al. (2016). However, these two studies mainly reduced the application of N fertilizer, while this experiment reduced the application of nitrogen fertilizer, phosphorus fertilizer, and potassium fertilizer at the same time [15,20]. The effects of N, P, and K on crop growth and development have been widely studied [21]. The growth process of plants is affected by the interactions of these three elements [22], but this study did not show that a lack of phosphorus and potassium fertilizers had a negative effect on the crop yield. This is probably because the role of phosphorus and potassium fertilizers may be more nutritionally and environmentally relevant in plant growth [21]. Interestingly, this research shows that at a low level of fertilizer application, the yield was still at a loss when the transplanting density was increased to 190,000 hills·ha−1, which indicates that no combination of a fertilizer reduction rate and density increase rate can reach a stable and increased yield, and further research is needed to determine the best matching range of fertilizer application and transplanting density on the premise of increasing the yield.
Rice yield is composed of panicles, the number of glumes per panicle, the seed-setting rate, and the thousand-seed weight [10,23]. This research shows that (Table 2) the yield of the LDLF treatment was lower than that of the LDHF treatment under the same transplanting density. This is mainly due to the reduction in fertilizer application, which led to a decrease in the effective panicles, spikelets per panicle, and seed-setting rate, which in turn affected the yield. The results of the two-year experiment show that the yield increased with increasing density under the same fertilizer application, and an increase in density mainly affected the yield by affecting the number of panicles. In addition, this study found that there was a positive correlation between the number of panicles and transplanting density, while there was a negative correlation between the number of spikelets per panicle and the transplanting density. It was consistent with the findings of Wells and Faw (1978), Jones and Snyder (1987), and Huang et al. (2011) [24,25,26]. Planting density is one of the important approaches to regulating rice yield. Excessively dense planting will intensify the competition among rice individuals and cause deterioration of the population, so it is necessary to promote the competitive relationship between rice individuals and the population by reducing the amount of fertilizer application and limiting the development of individuals to achieve a high yield.
Photosynthesis is an integral part of crop yield, which provides photosynthetic products that account for 90% of rice production [27]. Related studies have shown that having more aboveground biomass can compensate for the relative shortage of fertilizer supply needed to obtain the desired yield [28,29]. Mitchell and Sheehy (2006) argued that biomass is determined by total canopy photosynthesis [30]. The leaf area index and canopy structure together determine the intensity of canopy photosynthesis [15]. Parameters such as the LAI and SPAD values are commonly used to characterize the magnitude of the canopy photosynthetic capacity [31]. Higher LAI values are associated with greater dry matter synthesis and, thus, a higher grain yield [32].
In this study, the SPAD values, LAI values, and aboveground dry matter increased at the tillering stage. The SPAD values and LAI reached their maximum at the tasseling stage, and the aboveground dry matter accumulation reached its maximum at the filling stage (Table 3, Table 4 and Table 5). Compared to the LDHF, the reduced fertilizer application and increased transplanting density resulted in lower SPAD values (Table 3), mainly because the SPAD values represent the chlorophyll concentration of the leaf and are positively correlated with the rice leaf N concentration [33,34]. In addition, this study shows that the observed lowest SPAD in the HDLF occurred during the filling stage, which may be due to the high-density planting that accelerated leaf senescence by mutual shading in the late growth of the rice, thus reducing the leaf chlorophyll content [16]. The leaf area index (LAI) is an important agronomic parameter reflecting crop growth and predicting crop yield, and an adequate LAI is necessary for biomass production. This research shows that the LAI decreased with decreasing fertilizer application, increased with increasing transplanting density, and increased significantly at the tassel stage (Table 4), which is consistent with the results of Huang et al. (2018) [15]. However, the LAI was the highest in the LDHF treatment during the early stage of rice development, indicating that the fertilizer application had a greater effect on the LAI than the transplanting density during this period. Pan et al. (2020) indicated that the aboveground biomass at the tassel stage determines the yield [35], with about 60–80% of the yield coming from photosynthetic products after tasseling [36]. Katsura et al. (2008) found that high rice yields were mainly attributed to high dry matter accumulation [29]. In this study, when the fertilizer application was reduced, increasing the transplanting density ensured that the HDLF had a relatively high biomass while reducing the amount of fertilizer applied at the tillering stage to control ineffective tillering in the high-density treatment and to reduce competition among rice individuals. Then, fertilizer was applied at the maturity stage to accumulate biomass for rice filling (Table 5). This study shows that the measure of increasing the transplanting density and reducing the fertilizer application increased the aboveground dry matter accumulation in rice compared to the LDHF. Interestingly, the SPAD of the HDLF was not the highest throughout the rice reproductive period, but the LAI and aboveground dry matter accumulation were indeed the highest, which indicates that an appropriate increase in the leaf area was beneficial for building a reasonable canopy structure, improving photosynthetic productivity, and promoting seed [37]. This study shows that the direct effect of fertilizer application was the highest, followed by the aboveground dry matter accumulation. The transplanting density was the third among all the yield-influencing factors according to the partial least squares path model (Figure 2). This indicates that the effect of density on the yield is mainly achieved indirectly by controlling the aboveground dry matter accumulation, while the effect of fertilizer application is mainly achieved directly.

5. Conclusions

This study shows that, compared to the LDHF, the rice yield could be increased by using the rice cultivation method under the HDLF treatment. Under the same fertilizer application rate, increasing the transplanting density could increase the effective panicles and dry matter accumulation in the aboveground parts, but it could reduce the spikelets per panicle and SPAD value of the leaves at the filling stage. Under the condition of the same transplanting density, reducing the fertilizer application rate would lead to a decrease in the seed setting rate and leaf SPAD value. Overall, increasing the transplanting density and reducing the fertilizer application can improve the rice yield, achieving the goal of saving fertilizer and increasing the yield.

Author Contributions

Z.G. designed the experiments; N.S. and S.W. performed the experiments and analyzed the data; N.S. wrote the manuscript; Q.G. and H.Y. provided writing guidance. All authors have read and agreed to the published version of the manuscript.

Funding

This study was supported by the National Key Research and Development Program of China (Gao Zhiqiang, 2017YFD0301506).

Institutional Review Board Statement

Not applicable.

Informed Consent Statement

Not applicable.

Data Availability Statement

Not applicable.

Acknowledgments

We sincerely thank Zhou Wen Tao for her meteorological data. We also sincerely thank Huang Min for the seeds.

Conflicts of Interest

The authors declare that they have no known competing financial interest or personal relationship that could have appeared to influence the work reported in this paper.

References

  1. Yuan, L.P. Development of hybrid rice to ensure food security. Rice Sci. 2014, 21, 1–2. [Google Scholar] [CrossRef]
  2. Stewart, W.M.; Dibb, D.W.; Johnston, A.E.; Smyth, T.J. The Contribution of Commercial Fertilizer Nutrients to Food Production. Agron. J. 2005, 97, 1–6. [Google Scholar] [CrossRef]
  3. Di Salvo, L.P.; Cellucci, G.C.; Carlino, M.E.; De Salamone, I.E.G. Plant growth-promoting rhizobacteria inoculation and nitrogen fertilization increase maize (Zea Mays L.) grain yield and modified rhizosphere microbial communities. Appl. Soil Ecol. 2018, 126, 113–120. [Google Scholar]
  4. Gong, Y.L.; Lei, Y.; Zhang, X.P.; Yan, B.C.; Ju, X.T.; Cheng, X.Y.; Zhang, J.D.; Sun, X.Y.; Xu, H.; Chen, W.F. Nitrogen rate and plant density interaction enhances grain yield by regulating the grain distribution of secondary branches on the panicle axis and photosynthesis in japonica rice. Photosynthetica. 2022, 60, 79–189. [Google Scholar] [CrossRef]
  5. Peng, S.; Buresh, R.J.; Huang, J.; Yang, J.; Zou, Y.; Zhong, X.; Wang, G.; Zhang, F. Strategies for overcoming low agronomic nitrogen use efficiency in irrigated rice systems in China. Field Crop. Res. 2006, 96, 37–47. [Google Scholar] [CrossRef]
  6. Pittelkow, C.M.; Adviento-Borbe, M.A.; van Kessel, C.; Hill, J.E.; Linquist, B.A. Optimizing rice yields while minimizing yield-scaled global warming potential. Glob. Change Biol. 2014, 20, 1382–1393. [Google Scholar] [CrossRef] [PubMed]
  7. Zhao, X.Y.; Zhou, N.; Lai, S.K.; Frei, M.; Wang, Y.X.; Yang, L.X. Elevated CO2 improves lodging resistance of rice by changing physicochemical properties of the basal internodes. Sci. Total Environ. 2019, 647, 223–231. [Google Scholar] [CrossRef]
  8. Zhu, D.W.; Zhang, H.C.; Guo, B.W.; Xu, K.; Dai, Q.G.; Wei, H.Y.; Gao, H.; Hu, Y.J.; Cui, P.Y.; Huo, Z.Y. Effects of nitrogen level on yield and quality of japonica soft super rice. J. Integr. Agr. 2017, 16, 1018–1027. [Google Scholar] [CrossRef]
  9. Hou, W.; Khan, M.R.; Zhang, J.; Lu, J.; Ren, T.; Cong, R.; Li, X. Nitrogen rate and plant density interaction enhances radiation interception, yield and nitrogen use efficiency of mechanically transplanted rice. Agric. Ecosyst. Environ. 2019, 269, 183–192. [Google Scholar] [CrossRef]
  10. Xie, X.; Shan, S.; Wang, Y.; Cao, F.; Chen, J.; Huang, M.; Zou, Y. Dense planting with reducing nitrogen rate increased grain yield and nitrogen use efficiency in two hybrid rice varieties across two light conditions. Field Crop. Res. 2019, 236, 24–32. [Google Scholar] [CrossRef]
  11. Zou, Y.; Dai, K. The Advantages for promoting double-season rice production in Hunan Province. Crop. Res. 2008, 22, 209–213. [Google Scholar]
  12. Wu, W.; Nie, L.X.; Liao, Y.C.; Shah, F.; Cui, K.H.; Wang, Q.; Lian, Y.; Huang, J.L. Toward yield improvement of early-season rice: Other options under double rice-cropping system in central China. Europ J. Agron. 2013, 45, 75–86. [Google Scholar] [CrossRef]
  13. Peng, S.B.; Tang, Q.Y.; Zou, Y.B. Current status and challenges of rice production in China. Plant. Prod. Sci. 2009, 12, 3–8. [Google Scholar] [CrossRef]
  14. Huang, M.; Shan, S.L.; Xie, X.B.; Cao, F.B.; Zou, Y.B. Why high grain yield can be achieved in single seedling machine-transplanted hybrid rice under dense planting conditions? J. Integr. Agr. 2018, 17, 1299–1306. [Google Scholar] [CrossRef]
  15. Huang, M.; Chen, J.N.; Cao, F.B.; Zou, Y.B. Increased hill density can compensate for yield loss from reduced nitrogen input in machine-transplanted double-cropped rice. Field Crop. Res. 2018, 221, 333–338. [Google Scholar] [CrossRef]
  16. Shan, S.L.; Jiang, P.; Fang, S.L.; Cao, F.B.; Zhang, H.D.; Chen, J.N.; Yin, X.H.; Tao, Z.; Lei, T.; Huang, M.; et al. Printed sowing improves grain yield with reduced seed rate in machine-transplanted hybrid rice. Field Crop. Res. 2020, 245, 107676. [Google Scholar] [CrossRef]
  17. Hair, J.F.; Ringle, C.M.; Sarstedt, M. Partial Least Squares Structural Equation Modeling: Rigorous Applications, Better Results and Higher Acceptance. Long Range Plann. 2013, 46, 1–12. [Google Scholar] [CrossRef]
  18. Tenenhaus, M.; Vinzi, V.E.; Chatelin, Y.-M.; Lauro, C. PLS path modeling. Comput. Stat. Data An. 2005, 48, 159–205. [Google Scholar] [CrossRef]
  19. Zheng, H.B.; Chen, Y.W.; Chen, Q.M.; Li, B.; Zhang, Y.S.; Jia, W.; Mo, W.W.; Tang, Q.Y. High-density planting with lower nitrogen application increased early rice production in a double-season rice system. Agron. J. 2020, 112, 205–214. [Google Scholar] [CrossRef]
  20. Zhu, X.C.; Zhang, J.; Zhang, Z.P.; Deng, A.X.; Zhang, W.J. Dense planting with less basal nitrogen fertilization might benefit rice cropping for high yield with less environmental impacts. Eur. J. Agron. 2016, 75, 50–59. [Google Scholar] [CrossRef]
  21. Wang, Y.; Chen, Y.F.; Wu, W.H. Potassium and phosphorus transport and signaling in plants. J. Integr. Plant. Biol. 2021, 63, 34–52. [Google Scholar] [CrossRef] [PubMed]
  22. Rosenstock, N.P.; Berner, C.; Smits, M.M.; Krám, P.; Wallander, H. The role of phosphorus, magnesium and potassium availability in soil fungal exploration of mineral nutrient sources in Norway spruce forests. New Phytol. 2016, 211, 542–553. [Google Scholar] [CrossRef]
  23. Hua, J.P.; Xing, Y.Z.; Xu, C.G.; Sun, X.L.; Yu, S.B.; Zhang, Q.F. Genetic dissection of an elite rice hybrid revealed that heterozygotes are not always advantageous for performance. Genetics 2002, 162, 1885–1895. [Google Scholar] [CrossRef]
  24. Wells, B.R.; Faw, W.F. Short-statured rice response to seeding and N rates. Agron. J. 1978, 70, 477–480. [Google Scholar] [CrossRef]
  25. Jones, D.B.; Snyder, G.H. Seeding rate and row spacing effects on yield and yield components of ratoon rice. Agron. J. 1987, 79, 627–629. [Google Scholar] [CrossRef]
  26. Huang, M.; Zou, Y.B.; Feng, Y.H.; Cheng, Z.W.; Mo, Y.L.; Ibrahim, M.; Xia, B.; Jiang, P. No-tillage and direct seeding for super hybrid rice production in rice-oilseed rape cropping system. Eur. J. Agron. 2011, 34, 278–286. [Google Scholar] [CrossRef]
  27. Zhang, H.; Yu, C.; Kong, X.S.; Hou, D.P.; Gu, J.F.; Liu, L.J.; Wang, Z.Q.; Yang, J.C. Progressive integrative crop managements increase grain yield, nitrogen use efficiency and irrigation water productivity in rice. Field Crop. Res. 2018, 215, 1–11. [Google Scholar] [CrossRef]
  28. Fagade, S.O.; De Datta, S.K. Leaf area index, tillering capacity, and grain yield of tropical rice as affected by plant density and nitrogen level. Agron. J. 1971, 63, 503–506. [Google Scholar]
  29. Katsura, K.; Maeda, S.; Lubis, I.; Horie, T.; Cao, W.X.; Shiraiwa, T. The high yield of irrigated rice in Yunnan, China–‘A ross-location analysis’. Field Crop. Res. 2008, 107, 1–11. [Google Scholar] [CrossRef]
  30. Mitchell, P.L.; Sheehy, J.E. Supercharging rice photosynthesis to increase yield. New Phytol. 2006, 171, 688–693. [Google Scholar] [CrossRef]
  31. Wei, H.H.; Meng, T.Y.; Ge, J.L.; Zhang, X.B.; Shi, T.Y.; Ding, E.H.; Lu, Y.; Li, X.Y.; Tao, Y.; Chen, Y.L.; et al. Reduced nitrogen application rate with dense planting improves rice grain yield and nitrogen use efficiency: A case study in east China. Crop. J. 2021, 9, 954–961. [Google Scholar] [CrossRef]
  32. Zeng, X.M.; Han, B.J.; Xu, F.S.; Huang, J.L.; Cai, H.M.; Shi, L. Effects of modified fertilization technology on the grain yield and nitrogen use efficiency of midseason rice. Field Crop. Res. 2012, 137, 203–212. [Google Scholar] [CrossRef]
  33. Turner, F.T.; Jund, M.F. Assessing the nitrogen requirements of rice crops with a chlorophyll meter. Aust. J. Exp. Agric. 1994, 34, 1001–1005. [Google Scholar] [CrossRef]
  34. Shukla, A.K.; Ladha, J.K.; Singh, V.K.; Dwivedi, B.S.; Balasubramanian, V.; Gupta, R.K.; Sharma, S.K.; Singh, Y.; Pathak, H.; Pandey, P.S.; et al. Calibrating the leaf color chart for nitrogen management in different genotypes of rice and wheat in a systems perspective. Agron. J. 2004, 96, 1606–1621. [Google Scholar] [CrossRef]
  35. Pan, Y.H.; Gao, S.; Xie, K.L.; Lu, Z.F.; Meng, X.S.; Wang, S.Y.; Lu, J.W.; Guo, S.E. Higher radiation use efficiency produces greater biomass before heading and grain yield in super hybrid rice. Agronomy 2020, 10, 209. [Google Scholar] [CrossRef]
  36. Gu, J.F.; Yin, X.Y.; Stomph, T.J.; Wang, H.Q.; Struik, P.C. Physiological basis of genetic variation in leaf photosynthesis among rice (Oryza Sativa L.) introgression lines under drought and well-watered conditions. J. Exp. Bot. 2012, 63, 5137–5153. [Google Scholar] [CrossRef]
  37. Acreche, M.M.; Briceño-Félix, G.; Martín Sánchez, J.A.; Slafer, G.A. Radiation interception and use efficiency as affected by breeding in Mediterranean wheat. Field Crop. Res. 2009, 110, 91–97. [Google Scholar] [CrossRef]
Figure 1. Cumulative solar radiation (A) and daily mean temperatures (B) during the growing season of rice in 2019 and 2020.
Agronomy 12 02002 g001
Figure 2. Results of PLSPM structural model. Each box represents an observed variable, with blue and red indicating positive and negative effects, respectively.
Agronomy 12 02002 g002
Table 1. Different fertilizer rates and transplanting density treatments in 2019 and 2020.
TreatmentBefore TransplantingAfter Regeneration PeriodBooting StageTotal Fertilization
N Rate (kg/ha)P Rate (kg/ha)K Rate (kg/ha)N Rate (kg/ha)P Rate (kg/ha)K Rate (kg/ha)N Rate (kg/ha)P Rate (kg/ha)K Rate (kg/ha)N Rate (kg/ha)P Rate (kg/ha)K Rate (kg/ha)
LDHF67.567.567.591.522.522.548.3045207.390135
LDLF67.567.567.534.50048.3045150.367.5112.5
MDHF67.567.567.591.522.522.548.3045207.390135
MDLF67.567.567.534.50048.3045150.367.5112.5
HDHF67.567.567.591.522.522.548.3045207.390135
HDLF67.567.567.534.50048.3045150.367.5112.5
LD, MD, and HD represent transplanting densities of 160,000, 190,000, and 240,000 hills·ha−1, respectively. HF represents the utilization of 450 kg·ha−1 compound fertilizer (N:P2O5:K2O = 15:15:15) before transplanting, the utilization of 150 kg·ha−1 compound fertilizer (N:P2O5:K2O = 15:15:15) and 150 kg·ha−1 urea after the growth stage, the utilization of 105 kg·ha−1 urea and 75 kg·ha−1 potassium fertilizer (potassium chloride) at the booting stage. LF indicates that 450 kg·ha−1 compound fertilizer (N:P2O5:K2O = 15:15:15) was used before transplanting, 75 kg·ha−1 urea was used after the growth stage, 105 kg·ha−1 urea, and 75 kg·ha−1 potassium chloride was used at the booting stage.
Table 2. Grain yield and yield attributes under single seedling machine transplanting in 2019 and 2020.
TreatmentGrain Yield (t·ha−1)Thousand Seed Weight (g·1000−1)Panicles (m−2)Spikelets per PanicleSeed-Setting Rate (%)
2019LDHF7.91 ± 0.22 b23.14 ± 0.66 a274.78 ± 9.1 bc166.93 ± 3.83 ab85.84 ± 1.06 a
LDLF7.47 ± 0.12 c23.09 ± 0.24 a267.14 ± 3.7 c167.07 ± 3.82 ab78.87 ± 3.82 b
MDHF7.17 ± 0.11 d23.76 ± 0.55 a277.21 ± 13.66 bc168.02 ± 11.95 ab82.91 ± 1.84 ab
MDLF7.11 ± 0.02 d22.74 ± 0.97 a285.02 ± 4.37 b176.7 ± 4.26 a79.51 ± 2.38 b
HDHF7.76 ± 0.12 b23.19 ± 0.49 a307.76 ± 5.92 a160.3 ± 1.84 b83.12 ± 1.56 ab
HDLF8.31 ± 0.08 a23.1 ± 0.27 a316.86 ± 8.91 a157.98 ± 2.32 b80.95 ± 2.69 b
2020LDHF7.23 ± 0.06 b23.31 ± 0.2 ab267.73 ± 20.26 ab165.19 ± 7.54 a86.12 ± 1.3 a
LDLF6.36 ± 0.1 d23.03 ± 0.28 b248.00 ± 25.15 b166.3 ± 13.81 a83.41 ± 3.01 ab
MDHF6.79 ± 0.2 c23.77 ± 0.14 a269.21 ± 48.72 ab168.24 ± 27.46 a83.7 ± 1.1 ab
MDLF6.67 ± 0.04 cd22.42 ± 0.55 c289.52 ± 24.91 ab171.71 ± 11.22 a81.42 ± 2.18 b
HDHF7.03 ± 0.41 b23.60 ± 0.27 ab298.82 ± 20.1 ab158.87 ± 7.58 a83.1 ± 2.01 ab
HDLF7.71 ± 0.17 a23.17 ± 0.15 b313.73 ± 20.56 a147.7 ± 12.91 a82.11 ± 0.91 ab
ANOVAsYear(Y)**NSNSNSNS
Density(D)**NS***NS
Fertilizer(F)****NSNS**
Y × D**NSNSNSNS
Y × FNSNSNSNSNS
D × F***NSNSNS
Y × D × FNSNSNSNSNS
Note: Different lowercase letters in the same column of each treatment are significantly different at the 0.05 probability level. NS, not significant at the p < 0.05 level. * Significant at the p < 0.05 level. ** Significant at the p = 0.01 level.
Table 3. SPAD values at different growth stages of rice under different treatments in 2019 and 2020.
TreatmentTillering StageJointing StageHeading StageFilling Stage
2019LDHF39.19 ± 2.2 ab36.07 ± 1.86 a38.3 ± 1.39 b37.50 ± 0.95 a
LDLF41.6 ± 0.75 a35.41 ± 2.46 a39.03 ± 1.71 b30.23 ± 0.91 b
MDHF39.9 ± 1.12 ab38.92 ± 2.72 a40.35 ± 1.09 b33.88 ± 0.91 a
MDLF40.15 ± 1.03 ab38.04 ± 1.89 a37.57 ± 0.64 ab34.37 ± 4.14 a
HDHF39.75 ± 2.27 ab36.77 ± 1.15 a37.1 ± 1.04 ab34.09 ± 0.47 a
HDLF37.58 ± 1.67 b36.78 ± 0.74 a37.97 ± 0.87 a30.93 ± 1.50 b
2020LDHF42.77 ± 1.1 a46.53 ± 0.88 a41.96 ± 0.4 a40.19 ± 2.09 a
LDLF41.7 ± 3.12 a44.07 ± 1.47 b41.45 ± 0.62 a38.33 ± 1.39 a
MDHF42.5 ± 0.95 a43.03 ± 0.45 b40.68 ± 1.09 a38.47 ± 0.66 a
MDLF43.3 ± 0.17 a44.54 ± 1.54 ab40.63 ± 2.9 a39.42 ± 1.48 a
HDHF41.73 ± 0.49 a43.07 ± 1.13 b41.47 ± 0.71 a39.23 ± 0.34 a
HDLF42.3 ± 0.52 a42.67 ± 1.07 b41.03 ± 0.24 a38.21 ± 0.08 a
ANOVAsYear(Y)********
Density(D)NSNSNS*
Fertilizer (F)NSNSNS**
Y × DNS**NSNS
Y × FNSNSNS**
D × FNSNSNS**
Y × D × FNSNSNSNS
Note: Different lowercase letters in the same column of each treatment are significantly different at the 0.05 probability level. NS, not significant at the p < 0.05 level. * Significant at the p < 0.05 level. ** Significant at the p < 0.01 level.
Table 4. Leaf area index (LAI) in different growth stages of rice under different treatments in 2019 and 2020.
TreatmentTillering StageJointing StageHeading StageFilling Stage
2019LDHF0.77 ± 0.05 c3.53 ± 0.3 ab5.43 ± 0.22 c6.26 ± 0.08 a
LDLF0.73 ± 0.09 c3.03 ± 0.28 b5.41 ± 0.39 c6.24 ± 0.71 a
MDHF1.12 ± 0.05 a3.55 ± 0.58 ab5.31 ± 0.54 c5.66 ± 0.3 ab
MDLF0.96 ± 0.05 b3.56 ± 0.11 ab7.55 ± 0.32 a5.66 ± 0.63 ab
HDHF0.83 ± 0.1 ab3.91 ± 0.08 a5.23 ± 0.23 c5.35 ± 0.42 b
HDLF0.94 ± 0.13 b3.89 ± 0.09 a6.49 ± 0.36 b6.38 ± 0.18 a
2020LDHF0.79 ± 0.04 c2.98 ± 0.2 bc6.66 ± 0.02 ab6.24 ± 0.17 a
LDLF0.74 ± 0.17 bc2.64 ± 0.15 c6.3 ± 0.27 c6.05 ± 0.28 a
MDHF1.19 ± 0.15 a3.55 ± 0.62 ab7.57 ± 0.14 a5.66 ± 0.63 ab
MDLF1.02 ± 0.11 ab3.32 ± 0.46 abc7.06 ± 0.17 b5.20 ± 0.44 b
HDHF0.97 ± 0.17 abc3.93 ± 0.09 a6.57 ± 0.31 c6.25 ± 0.18 a
HDLF0.85 ± 0.06 bc3.17 ± 0.38 bc6.51 ± 0.32 c6.27 ± 0.49 a
ANOVAsYear(Y)NS***NS
Density(D)********
Fertilizer (F)NS***NS
Y × DNSNSNSNS
Y × FNSNS**NS
D × FNSNS**NS
Y × D × FNSNS**NS
Note: Different lowercase letters in the same column of each treatment are significantly different at the 0.05 probability level. NS, not significant at the p < 0.05 level. * Significant at the p < 0.05 level. ** Significant at the p < 0.01 level.
Table 5. Aboveground dry matter weight in different growth stages of rice under different treatments in 2019 and 2020.
TreatmentTillering StageJointing StageHeading StageFilling StageMaturity Stage
2019LDHF0.45 ± 0.07 b3.16 ± 0.32 a11.01 ± 1.69 a14.20 ± 1.33 a15.25 ± 1.20 a
LDLF0.50 ± 0.07 ab3.21 ± 0.08 a7.65 ± 1.00 bc11.95 ± 0.76 ab14.19 ± 0.66 ab
MDHF0.53 ± 0.13 ab2.91 ± 0.21 a7.25 ± 1.14 c10.87 ± 1.19 b12.42 ± 0.76 b
MDLF0.53 ± 0.01 ab2.95 ± 0.40 a7.68 ± 1.62 bc12.49 ± 1.15 ab14.44 ± 1.00 a
HDHF0.64 ± 0.07 a3.25 ± 0.51 a7.87 ± 0.63 bc13.00 ± 1.10 ab13.93 ± 0.55 ab
HDLF0.55 ± 0.08 ab3.45 ± 0.65 a9.88 ± 0.65 ab14.26 ± 1.40 a15.82 ± 1.68 a
2020LDHF0.41 ± 0.07 a2.45 ± 0.21 b8.95 ± 2.06 ab12.05 ± 0.84 b13.16 ± 1.9 ab
LDLF0.42 ± 0.07 a2.50 ± 0.41 b6.52 ± 0.78 b10.93 ± 0.58 b11.25 ± 0.75 b
MDHF0.49 ± 0.18 a2.81 ± 0.51 ab9.03 ± 1.95 ab11.82 ± 1.67 b11.87 ± 0.66 b
MDLF0.55 ± 0.21 a2.83 ± 0.16 ab8.15 ± 1.17 ab11.96 ± 1.34 b11.95 ± 0.45 b
HDHF0.67 ± 0.09 a2.86 ± 0.40 ab8.92 ± 1.4 ab11.98 ± 0.31 b14.63 ± 0.62 a
HDLF0.66 ± 0.19 a3.31 ± 0.49 a10.04 ± 1.60 a14.65 ± 0.65 a15.37 ± 2.41 a
ANOVAsYear(Y)NS**NSNS**
Density(D)**NSNS****
Fertilizer (F)NSNSNSNS*
Y × DNSNSNSNSNS
Y × FNSNSNSNSNS
D × FNSNS*****
Y × D × FNSNSNSNSNS
Note: Different lowercase letters in the same column of each treatment are significantly different at the 0.05 probability level. NS, not significant at the p < 0.05 level. * Significant at the p < 0.05 level. ** Significant at the p < 0.01 level.
Publisher’s Note: MDPI stays neutral with regard to jurisdictional claims in published maps and institutional affiliations.

