Article

Development of SSR Markers Based on Transcriptome Sequencing and Verification of Their Conservation across Species of Ornamental Pennisetum Rich. (Poaceae)

1
College of Grassland Science, Beijing Forestry University, Beijing 100083, China
2
Institute of Grassland, Flowers and Ecology, Beijing Academy of Agriculture and Forestry Sciences, Beijing 100097, China
*
Authors to whom correspondence should be addressed.
Agronomy 2022, 12(7), 1683; https://doi.org/10.3390/agronomy12071683
Submission received: 1 June 2022 / Revised: 8 July 2022 / Accepted: 12 July 2022 / Published: 15 July 2022

Abstract

:
Pennisetum species have importance in foraging, agriculture, energy-production, the environment, and landscaping. To promote the preservation and utilization of ornamental Pennisetum resources, we developed simple sequence repeat (SSR) markers from the Pennisetum setaceum cv. ‘Rubrum’ transcriptome and verified their conservation in 38 sources. Our transcriptome sequencing efforts generated 58.91 Gb of clean data containing 55,627 unigenes. We functionally annotated 30,930 unigenes, with functions enriched in translation and ribosomal structure and biogenesis. Database comparisons indicated that the closest relative of P. setaceum cv. ‘Rubrum’ is Setaria italica. Over five thousand SSR markers were detected in the transcriptomic data. We selected 38 pairs of highly polymorphic SSR markers from 50 randomly selected SSR markers. Based on genetic diversity analysis of 38 ornamental Pennisetum sources, we obtained 312 polymorphic bands, with an average of 8.21 alleles per primer. Principal coordinate analyses and generation of a, which proved that Pennisetum has moderate genetic diversity. In addition, fingerprint maps were constructed to improve Pennisetum identification. The transcriptome data generated by our study enhances the transcriptional information available for P. setaceum. This study lays the foundation for the collection and utilization of ornamental Pennisetum resources and provides a basis for future breeding projects using this species.

1. Introduction

The genus Pennisetum belongs to the grass family (Poaceae), represent annual or perennial herbs distributed in tropical and subtropical regions [1]. Pennisetum species have importance in foraging [2], agriculture [3], environment [4] and energy production [5], and are also widely used in ornamental gardening [6]. Pennisetum ornamental grasses have elegant stalks, beautiful inflorescences, and colorful leaves. Pennisetum can be used for diverse landscaping needs, as they can be planted as a single plant, in clusters, in pieces, or in rows [7]. In addition to their ornamental value, they also have the advantage of being adaptable, and resistant to drought, and requiring low maintenance [8]. One member of this family, P. setaceum cv. ‘Rubrum’ has purple leaves throughout most of its growth stages, with high ornamental value, is widely used all over the world [9] and is lovingly referred to as “purple fountain grass” [10].
Molecular markers that have been developed to date include inter-simple sequence repeat (ISSR) [11], random amplified polymorphism DNA (RAPD) [12], restriction fragment length polymorphism (RFLP) [13], amplified fragment length polymorphism (AFLP) [14], simple sequence repeat (SSR) [15] and simple nucleotide polymorphism (SNP) [16]. Among these marker types, the use of SSR markers is advantageous as they are abundant, multi-allelic, highly polymorphic, and co-dominant. As such, SSRs are an ideal tool to examine the genetic diversity of plants [17]. The key to utilizing SSR molecular markers lies in their development. Early SSR primer development methods includes cDNA library construction and clone sequencing [18], as well as by searching for expressed sequence tags in public databases [19]. Transcriptome sequencing has become a popular method for developing SSR markers. Transcriptome sequencing (i.e., RNA-seq) represents a high-throughput technology for sequencing cDNAs obtained by reverse transcription of mRNA transcribed in a specific tissue or cell at a certain developmental stage or functional state [20]. It is an effective tool to identify SSR markers in species without reference genome and non-model organisms [20]. Furthermore, it has been shown that SSRs obtained from one species can be used to detect the diversity of related species and even other genera of the same family [21].
Zhou et al. [22] conducted genetic diversity analysis on 35 sources of Pennisetum from China and the United States. They verified the cross-species reactivityof Hemarthria EST-SSR markers. Wang et al. [23] developed 83,706 SSR markers from Pennisetum purpureum Schum ‘Zise’ and identified 28 pairs of polymorphic markers. In the past, our group has screened 15 Pennisetum-specific SSR markers by magnetic bead enrichment technology, and 147 polymorphic alleles were used to further verify the traditional phylogenetic classification of Pennisetum [6]. However, the sources of Pennisetum used in these studies were mostly forage-type Pennisetum or Pennisetum crops, and research on ornamental Pennisetum remained minimal. In terms molecular information on ornamental Pennisetum grasses, there are only a few SSR markers that have been developed. In addition, trancriptome data from ornamental Pennisetum species are lacking.
In our previous research, we constructed the full-length transcriptome of P. setaceum cv. ‘Rubrum and revealed the molecular mechanism underlying anthocyanin accumulation [24]. In the present study, we used this Illumina transcriptome data to: (1) develop SSR markers for P. setaceum cv. ‘Rubrum’ and enhance the transcriptional information available for Pennisetum, (2) verify whether these SSR markers are conserved among various Pennisetum species, and (3) analyze the genetic diversity of 38 Pennisetum accessions, investigate their genetic relationships, and establish genetic fingerprints. Thus, our study will provide a basis for functional genetic analyses, resource identification, and cultivation of new varieties of ornamental Pennisetum.

2. Materials and Methods

2.1. Plant Material and DNA Extraction

The P. setaceum cv. ‘Rubrum’ selected for transcriptome sequencing was collected from the National Precision Agriculture Research Demonstration Base in 2020 (116°28′ E, 39°94′ N). The 38 sources of Pennisetum included some widely used Pennisetum varieties and different mutants cultivated by our group. The original materials were collected from Beijing, Anhui and Kunming in China (Table 1). Meanwhile, Setaria viridis and Panicum virgatum were selected as experimental controls. The experimental materials consisted of fresh leaves or stems that were sampled and stored at −80 °C. Genomic DNA was extracted from the 40 plant samples using the CTAB method [25]. The concentration of the extracted DNA samples were measured using a Nanodrop 2000 (NanoDrop Technologies, Wilmington, DE, USA), uniformly diluted DNA to 20 ng/µL and stored at −20 °C until further use. PCR amplifications were optimized according to our previously reported protocols with minor modifications [21].

2.2. Transcriptome Sequencing of P. setaceum cv. ‘Rubrum’

Total RNA was extracted from P. setaceum cv. ‘Rubrum’ using the Trizol method as per the manufacturer’s specifications. The constructed cDNA libraries were then sequenced using the Illumina NovaSeq 6000 high-throughput sequencing platform (San Diego, CA, USA). Sequencing and quality control processes were performed according to the standard workflow of the Biomarker Corporation (Beijing, China). After obtaining a large amount of high-quality sequencing data, sequence assembly was performed using Trinity software [26]. The resulting unigenes were aligned with the Non-Redundant Protein (NR) [27], Swiss-Prot [28], Clusters of Orthologous (COG) [29], Eukaryotic Orthologous Groups (KOG) [30], eggNOG4.5 [31], and Kyoto Encyclopedia of Genes and Genomes (KEGG) [32] databases using the DIAMOND software [33]. SSR analysis was performed on unigenes that were longer than 1kB using MISA software [34]. SSR loci with dinucleotide to hexanucleotide repeat types are preferentially selected. The number of SSR markers selected for different repeat types is determined by their proportions. Using Primer3 (http://primer3.sourceforge.net/releases.php) (accessed on 3 December 2021) for each SSR primer design.

2.3. SSR Prediction, Selection, and Primer Design

Eight materials with different phenotypic traits including P. alopecuroides—A P. purpureum Schum. —D P. alopecuroides cv. ‘Wucai’, P. villosum, P. alopecuroides cv. ‘Little Bunny’, P. alopecuroides cv. ‘Fire Works’, P. virgatum, and S. viridis were selected for use in screening 50 randomly selected molecular markers that were generated from the RNA-seq data. The primers that produced clear bands and detected polymorphism were used in subsequent experiments. All materials were amplified by PCR using primers synthesized by Ruibiotech Company (Beijing, China). The concentration of primers is 10 µmol/L. Our optimized 10 µL PCR reaction system consisted of 5 µL 2 × Taq Master Mix, 0.6 µL forward primer, 0.6 µL reverse primer, 1 µL DNA, and 2.8 µL ddH2O. The PCR cycling conditions were as follows: pre-denaturation at 94 °C for 3 min, 35 cycles of denaturation at 94 °C for 30 s, annealing at 48 °C for 30 s and extension at 72 °C for 1 min, followed by a final extension at 72 °C for 10 min. The resulting PCR products were electrophoresed on an 8% non-denaturing polyacrylamide gel at 170 V 70 min. A 100 bp ladder (TransGen Biotech, Beijing, China) was used as a size marker. After electrophoresis, the PCR amplicons were by silver staining and photographed.

2.4. Genetic Diversity Analysis

To establish the original matrix, the bands visualized on the non-denaturing polyacrylamide gel were manually read. Due to the complex genetic background of Pennisetum, aneuploidy and polyploidy exist widely in Pennisetum, and it is difficult to detect the peak value of each locus, so we analyzed SSR markers as binary dominant. We used the molecular markers of co-dominant inheritance as dominant markers. Clear bands were recorded as “1”, whereas samples were assigned a “0” if the bands were difficult to distinguish or non-existent. POPGENE v1.3.2 [35] was used to analyze genetic distance, observed allele number (Na), effective allele number (Ne), gene diversity index (H), and Shannon information index (I), and to analyze genetic diversity. The formula PIC = 1 j i P i j 2 (Pi and Pj are the frequencies of the ith and jth genes at a locus) [21], was used to calculate the polymorphism information content (PIC) of the primers.

2.5. Unweighted Pair Group Method with Arithmetic Mean (UPGMA) Clustering Analysis and Principal Component Analysis (PCoA) of 38 Accessions

NTSYS v2.1 [36] was used to evaluate the similarity of 38 Pennisetum samples, and to establish UPGMA and PCoA. A UPGMA cluster diagram was drawn by the SSR data similarity matrix. PCoA was performed according to anastomotic differences between binary genotypic profiles. Distance and covariance were both standardized [21].

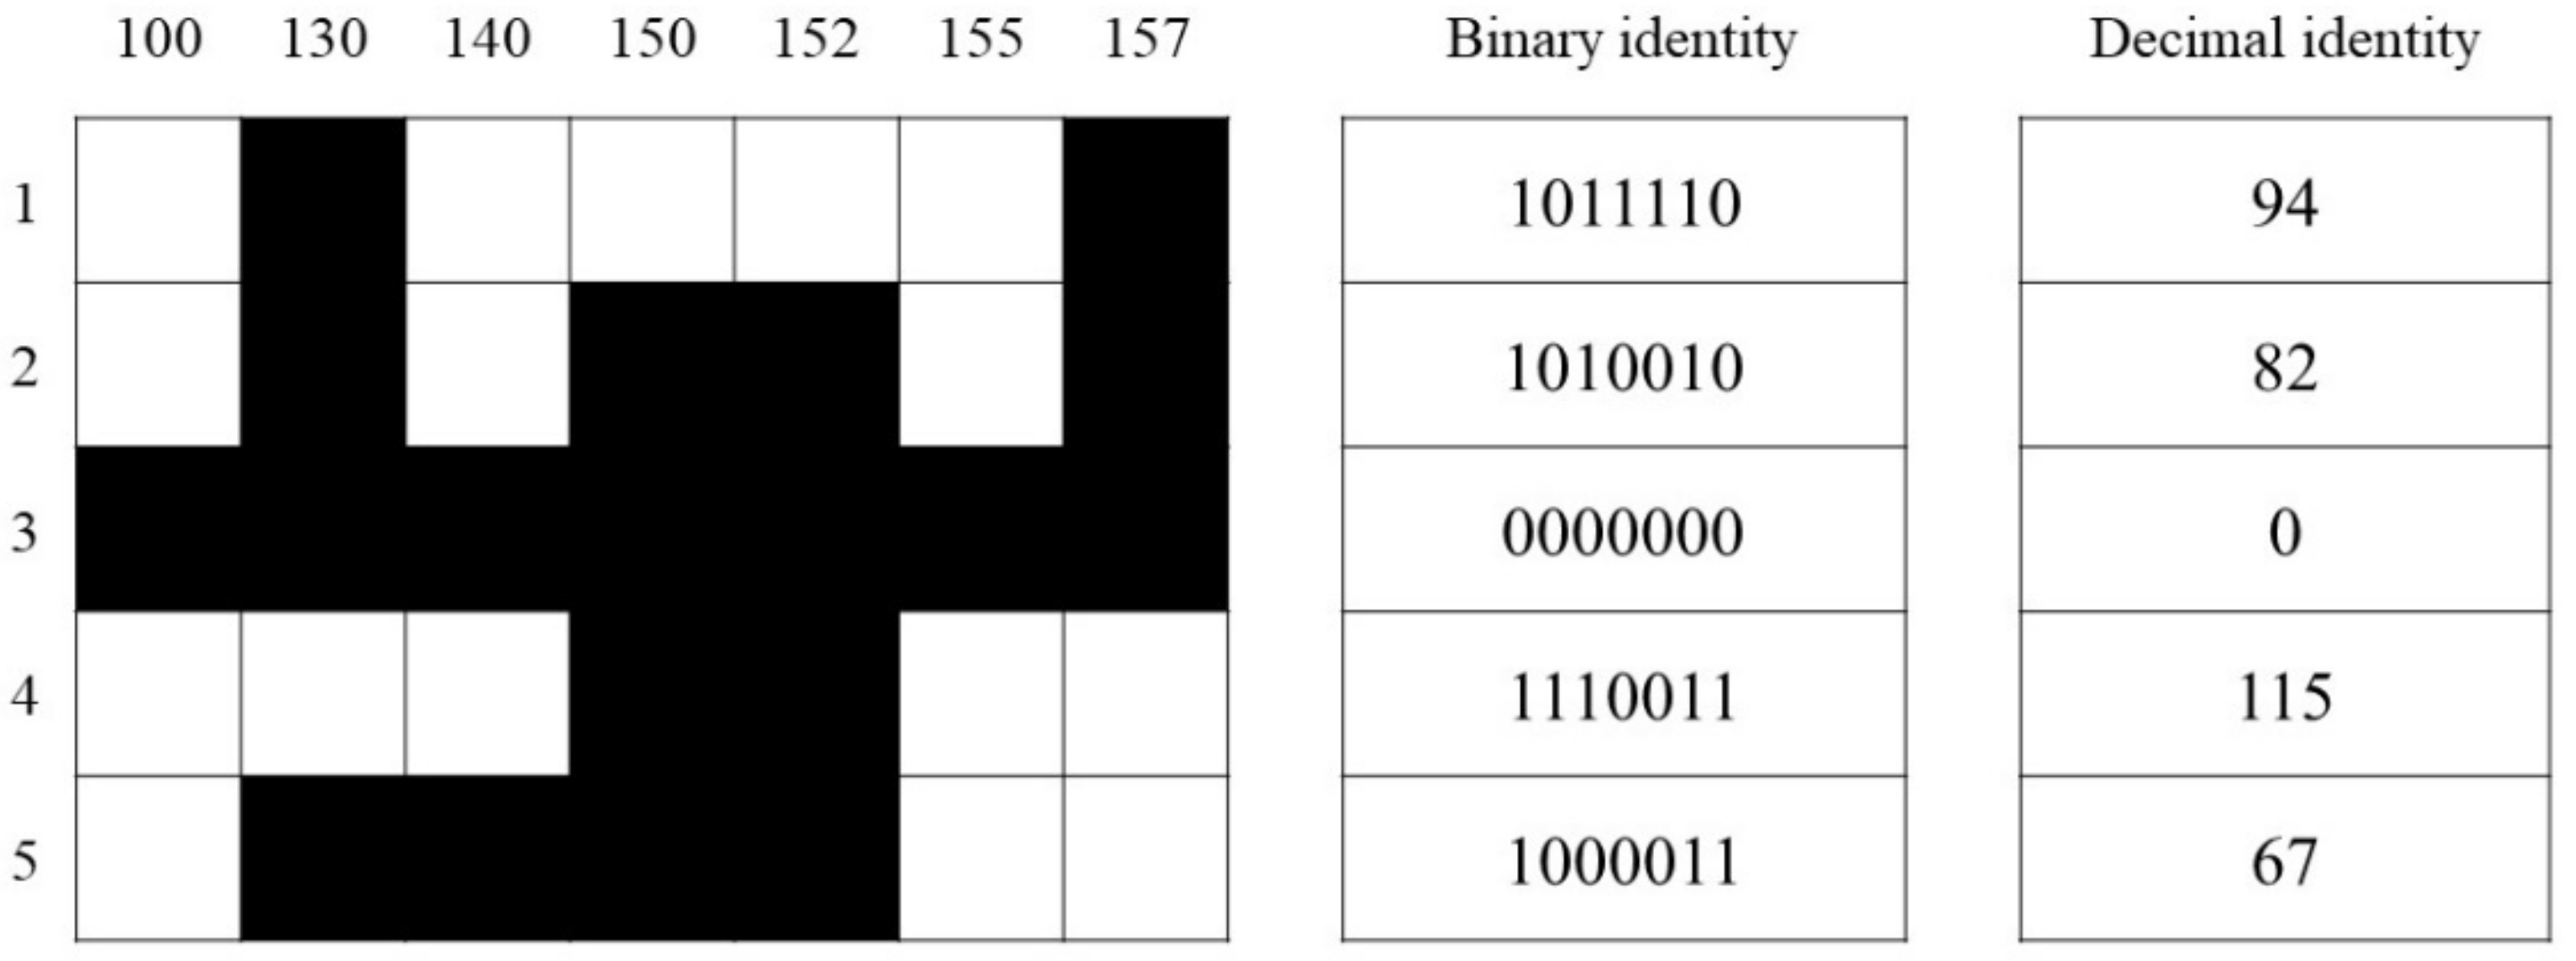
2.6. Construction of Fingerprints

Fingerprints were constructed by reading the banding information obtained following gel electrophoresis of the PCR products. At positions of the same length, positions with a band were marked in white, and positions without a band were marked in black, with their binary identities represented as “1” and “0”, respectively. Binary identities were converted to decimal identities.

3. Results

3.1. Illumina Sequencing and De Novo Transcriptome Assembly

A total of 58.91 Gb of clean data was obtained from the transcriptome sequencing of P. setaceum cv. ‘Rubrum’. Clean data from each sample reached a maximum of 6.15 Gb, and the percentage of Q30 bases was over 94.22%. After assembly, a total of 55,627 unigenes were obtained, and their N50 was 1637 bp in length. The assembly integrity qualified the transcriptome for subsequent analysis. The transcriptome data has been deposited in the NCBI database under accession number “PRJNA744323”.

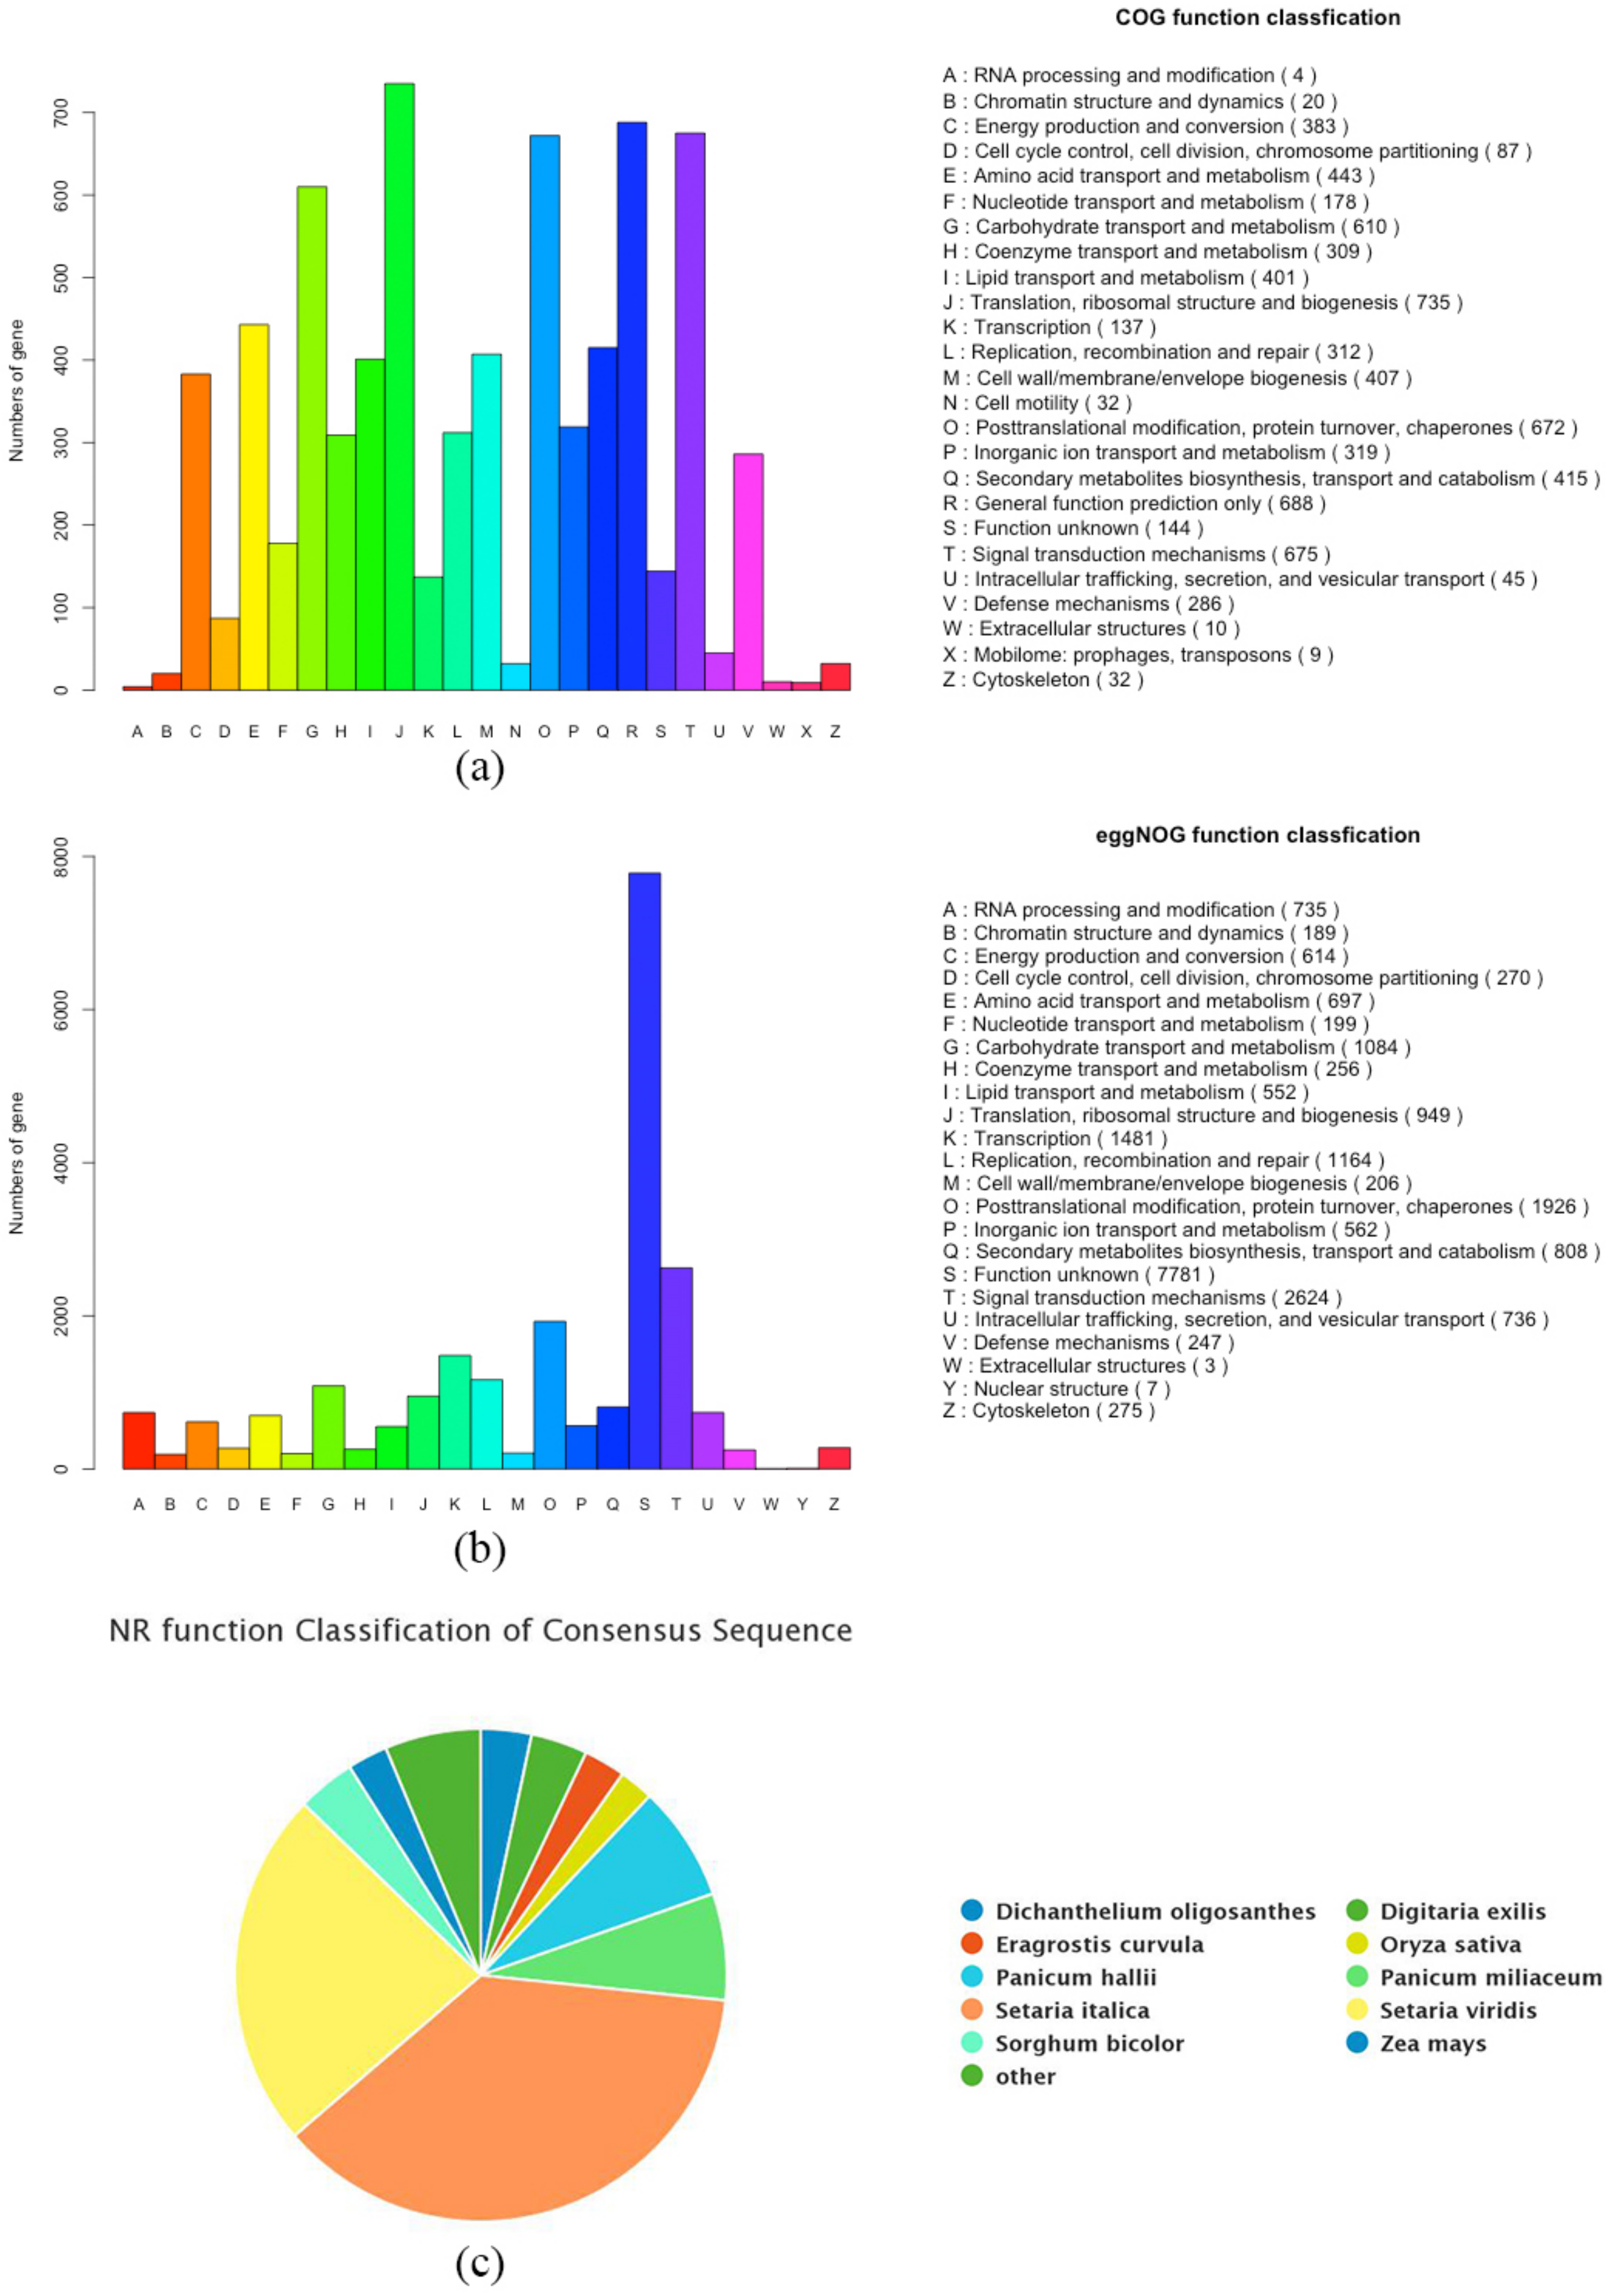
3.2. Functional Gene Annotation

Functional annotation of the unigenes was performed by aligning them to the NR, Swiss-Prot, KEGG, COG, KOG, GO, eggNOG, and Pfam databases. In general, a total of 30,930 unigene annotations were obtained (Table 2). The COG classification statistics showed that the most genes were classified into “translation, ribosomal structure, and biogenesis”, followed by “posttranslational modification, protein turnover, and chaperones” (Figure 1a). The eggNOG classification statistics showed that the genes were widely distributed in “signal transduction mechanisms posttranslational modification, protein turnover chaperones” (Figure 1b). The results of NR protein sequence alignment showed that the closest relative species to Pennisetum was Setaria italica, followed by Setaria viridis, Panicum hallii, Panicum miliaceum (Figure 1c), with homologous percentages of 37.10%, 23.50%, and 7.00%, respectively.

3.3. Development of Novel SSRs and Analysis of Their Conservation

A total of 5122 SSR loci were obtained from the 55,627 unigenes using MISA software, and the distribution frequency of SSR loci was 9.21%. There were six SSR types, including mononucleotide repeats, dinucleotide repeats, trinucleotide repeats, tetranucleotide repeats, pentanucleotide repeats, and hexanucleotide repeats (Table 3). The most abundant type of SSR was trinucleotide repeats (41.94%), followed by mononucleotide repeats (39.26%), and dinucleotide repeats (14.70%). The number of tetranucleotide repeats, pentanucleotide repeats, and hexanucleotide repeats was low, with the number of hexanucleotide repeats (0.04%) being the least (only two) (Table 3). Fifty pairs of SSR primers were randomly selected from the 5122 SSR loci (Table 4), and eight materials with obvious phenotypic differences were utilized to further select polymorphic SSRs. We selected 38 pairs of primers with higher polymorphisms to perform PCR amplification of 40 experimental materials. The raw band data are presented in Table S1. The amplification results of representative polymorphic primers in 40 samples are shown in Figure S1.

3.4. Genetic Diversity Statistics

A total of 312 polymorphic bands were amplified using 38 pairs of SSR markers, with an average of 8.21 bands per marker. The PIC ranged from 0.16 (PaSSR—2) to 0.44 (PaSSR—47), with an average of 0.35 (Table S2). 37 locus was medium level polymorphism (0.25 < PIC < 0.5), one locus was low level (PIC < 0.25), and not have high level polymorphism (PIC > 0.5) locus. SSRs displayed wide genetic variation among accessions. The average Na was 2.00. The Ne ranged from 1.19 (PaSSR—2) to 1.81 (PaSSR—47), with an average of 1.60. The H ranged from 0.16 (PaSSR—2) to 0.44 (PaSSR—47), with an average of 0.35. The I values were between 0.16 (PaSSR—2) and 0.63 (PaSSR—47), with an average of 0.52 (Table S2). The genetic similarity coefficient between accessions (Table S3) ranged from 0.39 to 1.00 with an average of 0.58 (Table S3).

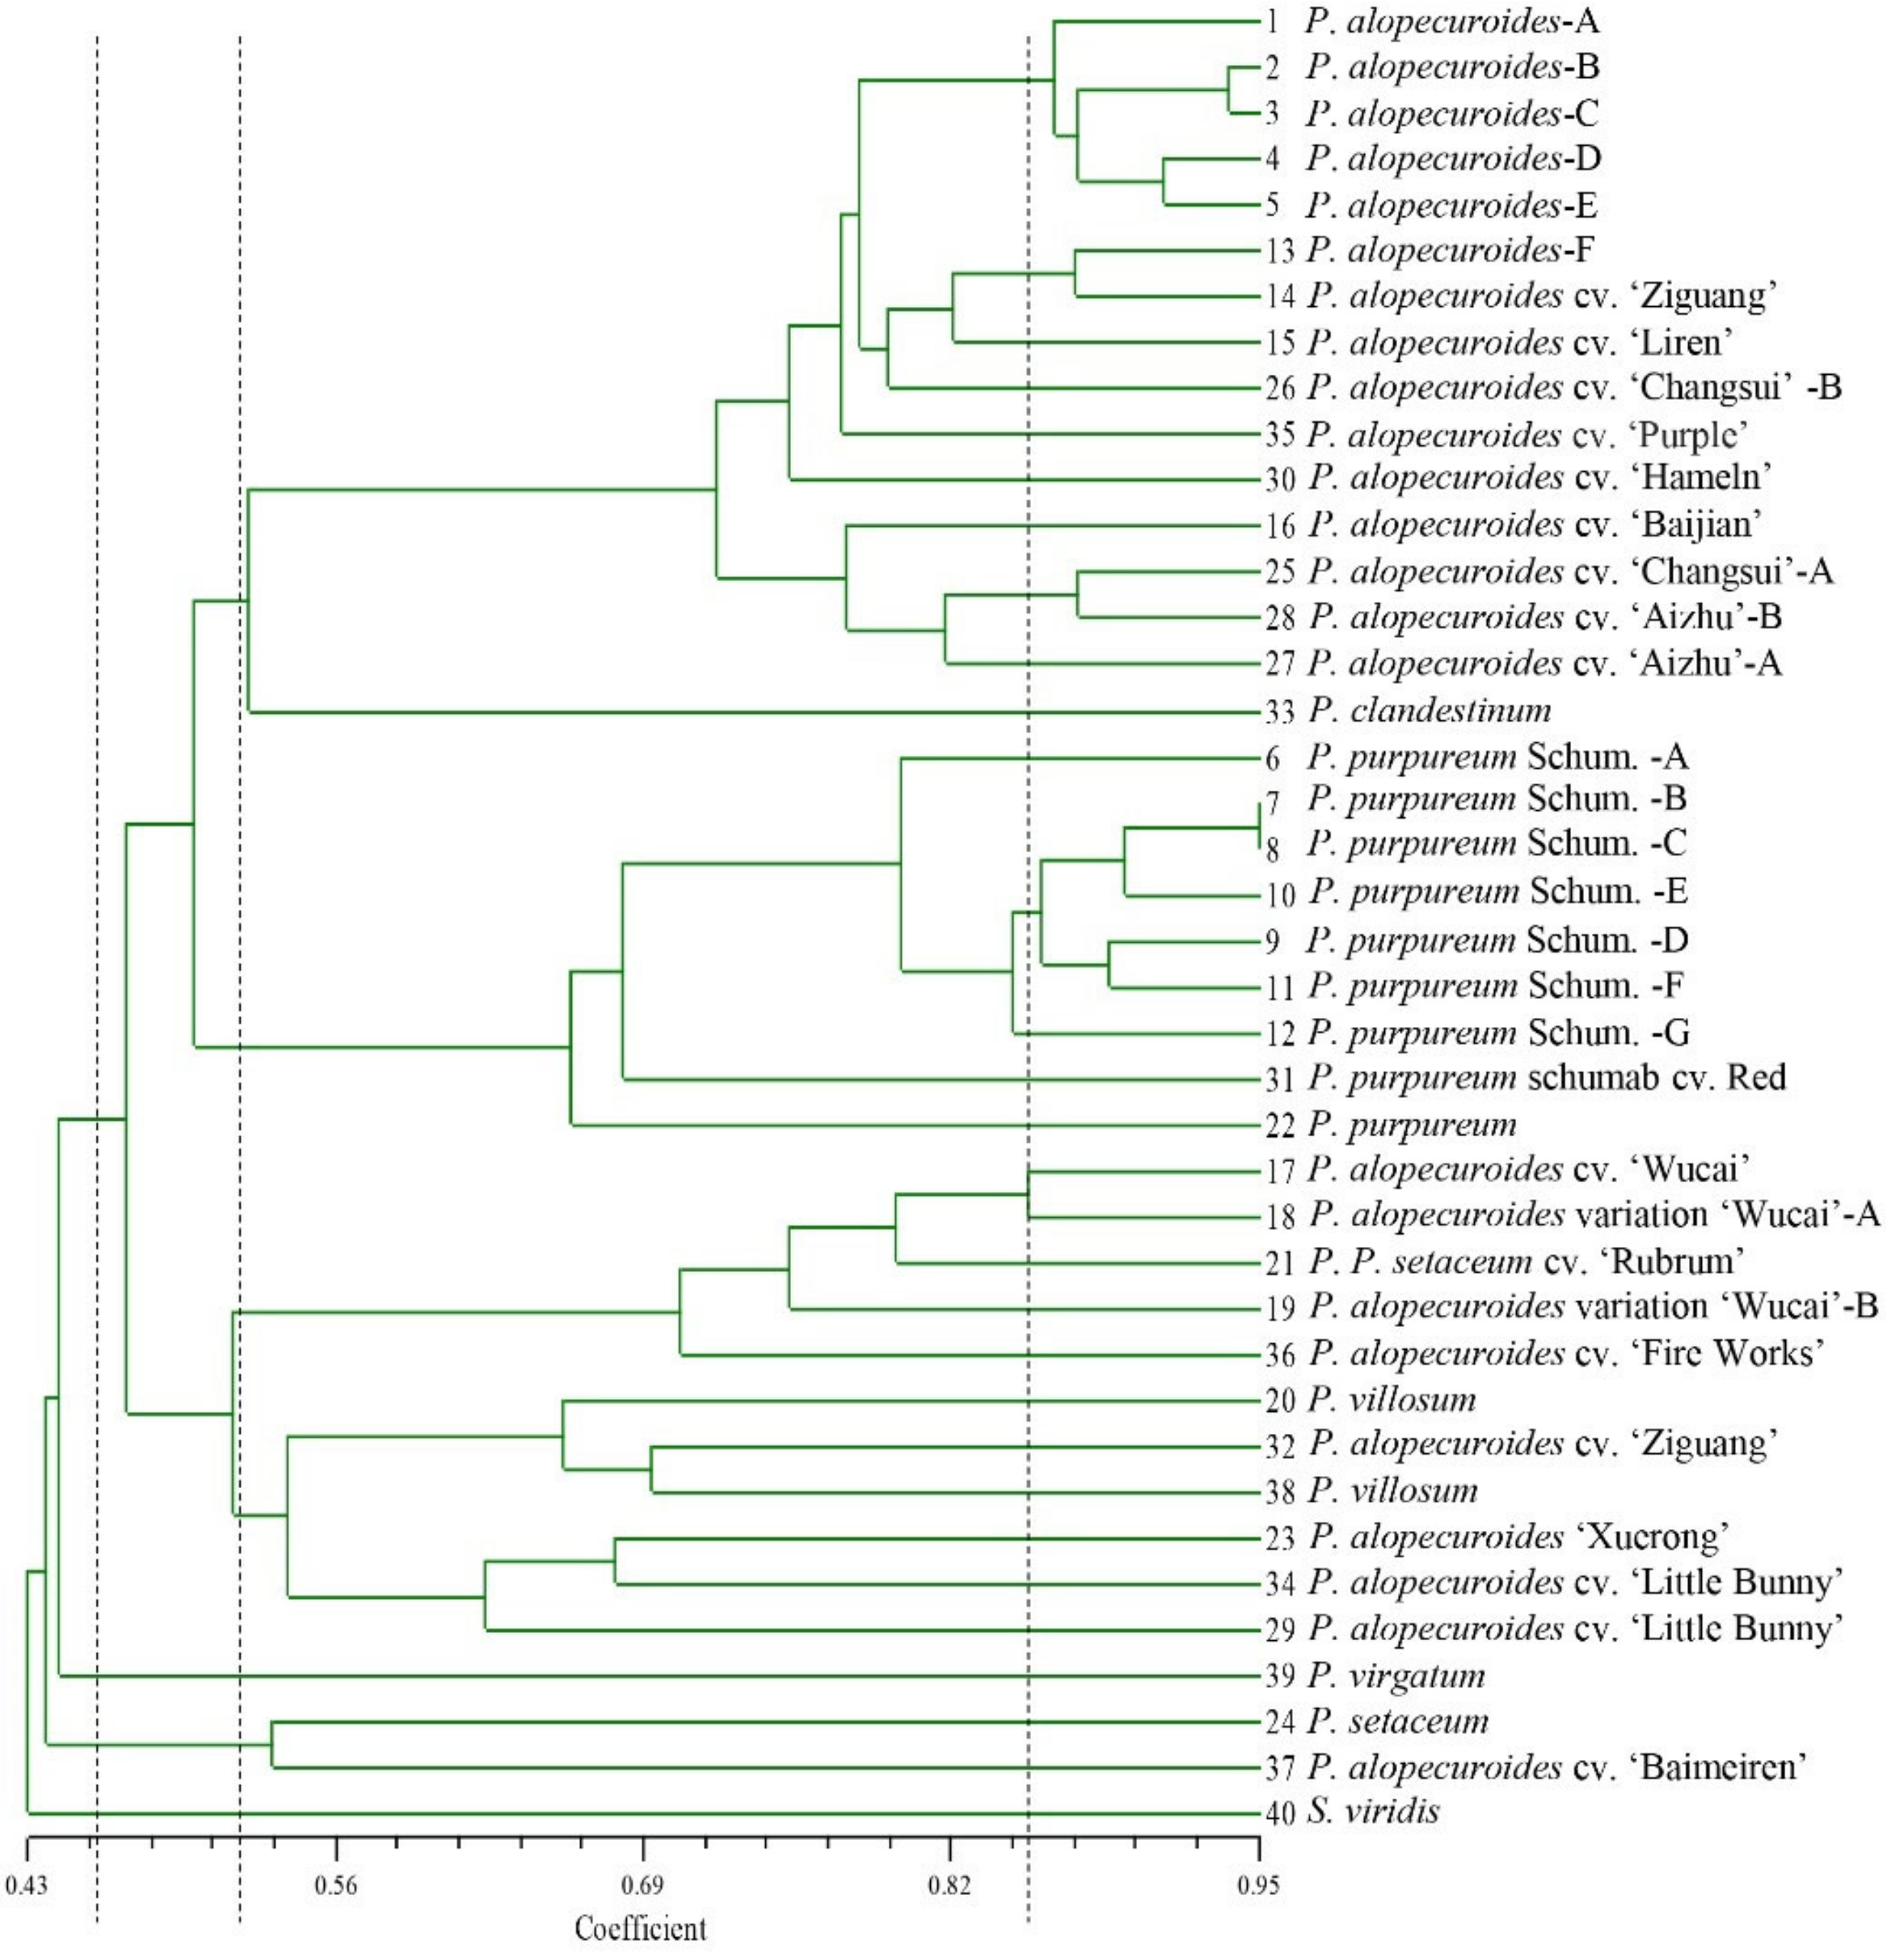
3.5. Cluster Analysis of 38 Pennisetum Accessions

UPGMA cluster analysis was performed on 40 samples according to the genetic distance, and the genetic relationships between all samples were obtained by combining the clustering results. Based on the control samples, S. viridis and P. virgatum verified the reliability of the test results. S. viridis was singly branched at a genetic similarity coefficient of 0.43, and the switchgrass P. virgatum was classified into a single class at a genetic similarity coefficient of 0.44 (Figure 2). When the genetic distance was 0.50, the 38 Pennisetum samples were divided into five categories. The Pennisetum variants were divided into one category at a genetic similarity of 0.89. When the genetic similarity was 0.81 (Figure 2), the P. purpureum Schum. variants were classified into one category. P. alopecuroides ‘Baimeiren’ from Kunming, Yunnan, and P. setaceum from Beijing are classified into one category, indicating that the two are closely related and could be distinguished when the genetic similarity is 0.47. The phenotypes of these variant materials have different degrees of variation, and it is impossible to accurately classify them only by phenotypic characteristics. The results confirmed their genetic relationship and further verified the reliability of the clustering results. P. clandestinum was branched separately at a genetic similarity of 0.48, indicating that it is distantly related to other Pennisetum samples. P. alopecuroides cv. ‘Little Bunny’ and P. alopecuroides cv. ‘Hameln’ have similar phenotypes at a certain growth stage, thus it is difficult to distinguish the two based on their phenotype. UPGMA clustering revealed that they branched at a genetic similarity of 0.48 (Figure 2). These results demonstrate that this clustering method can effectively distinguish similar materials.

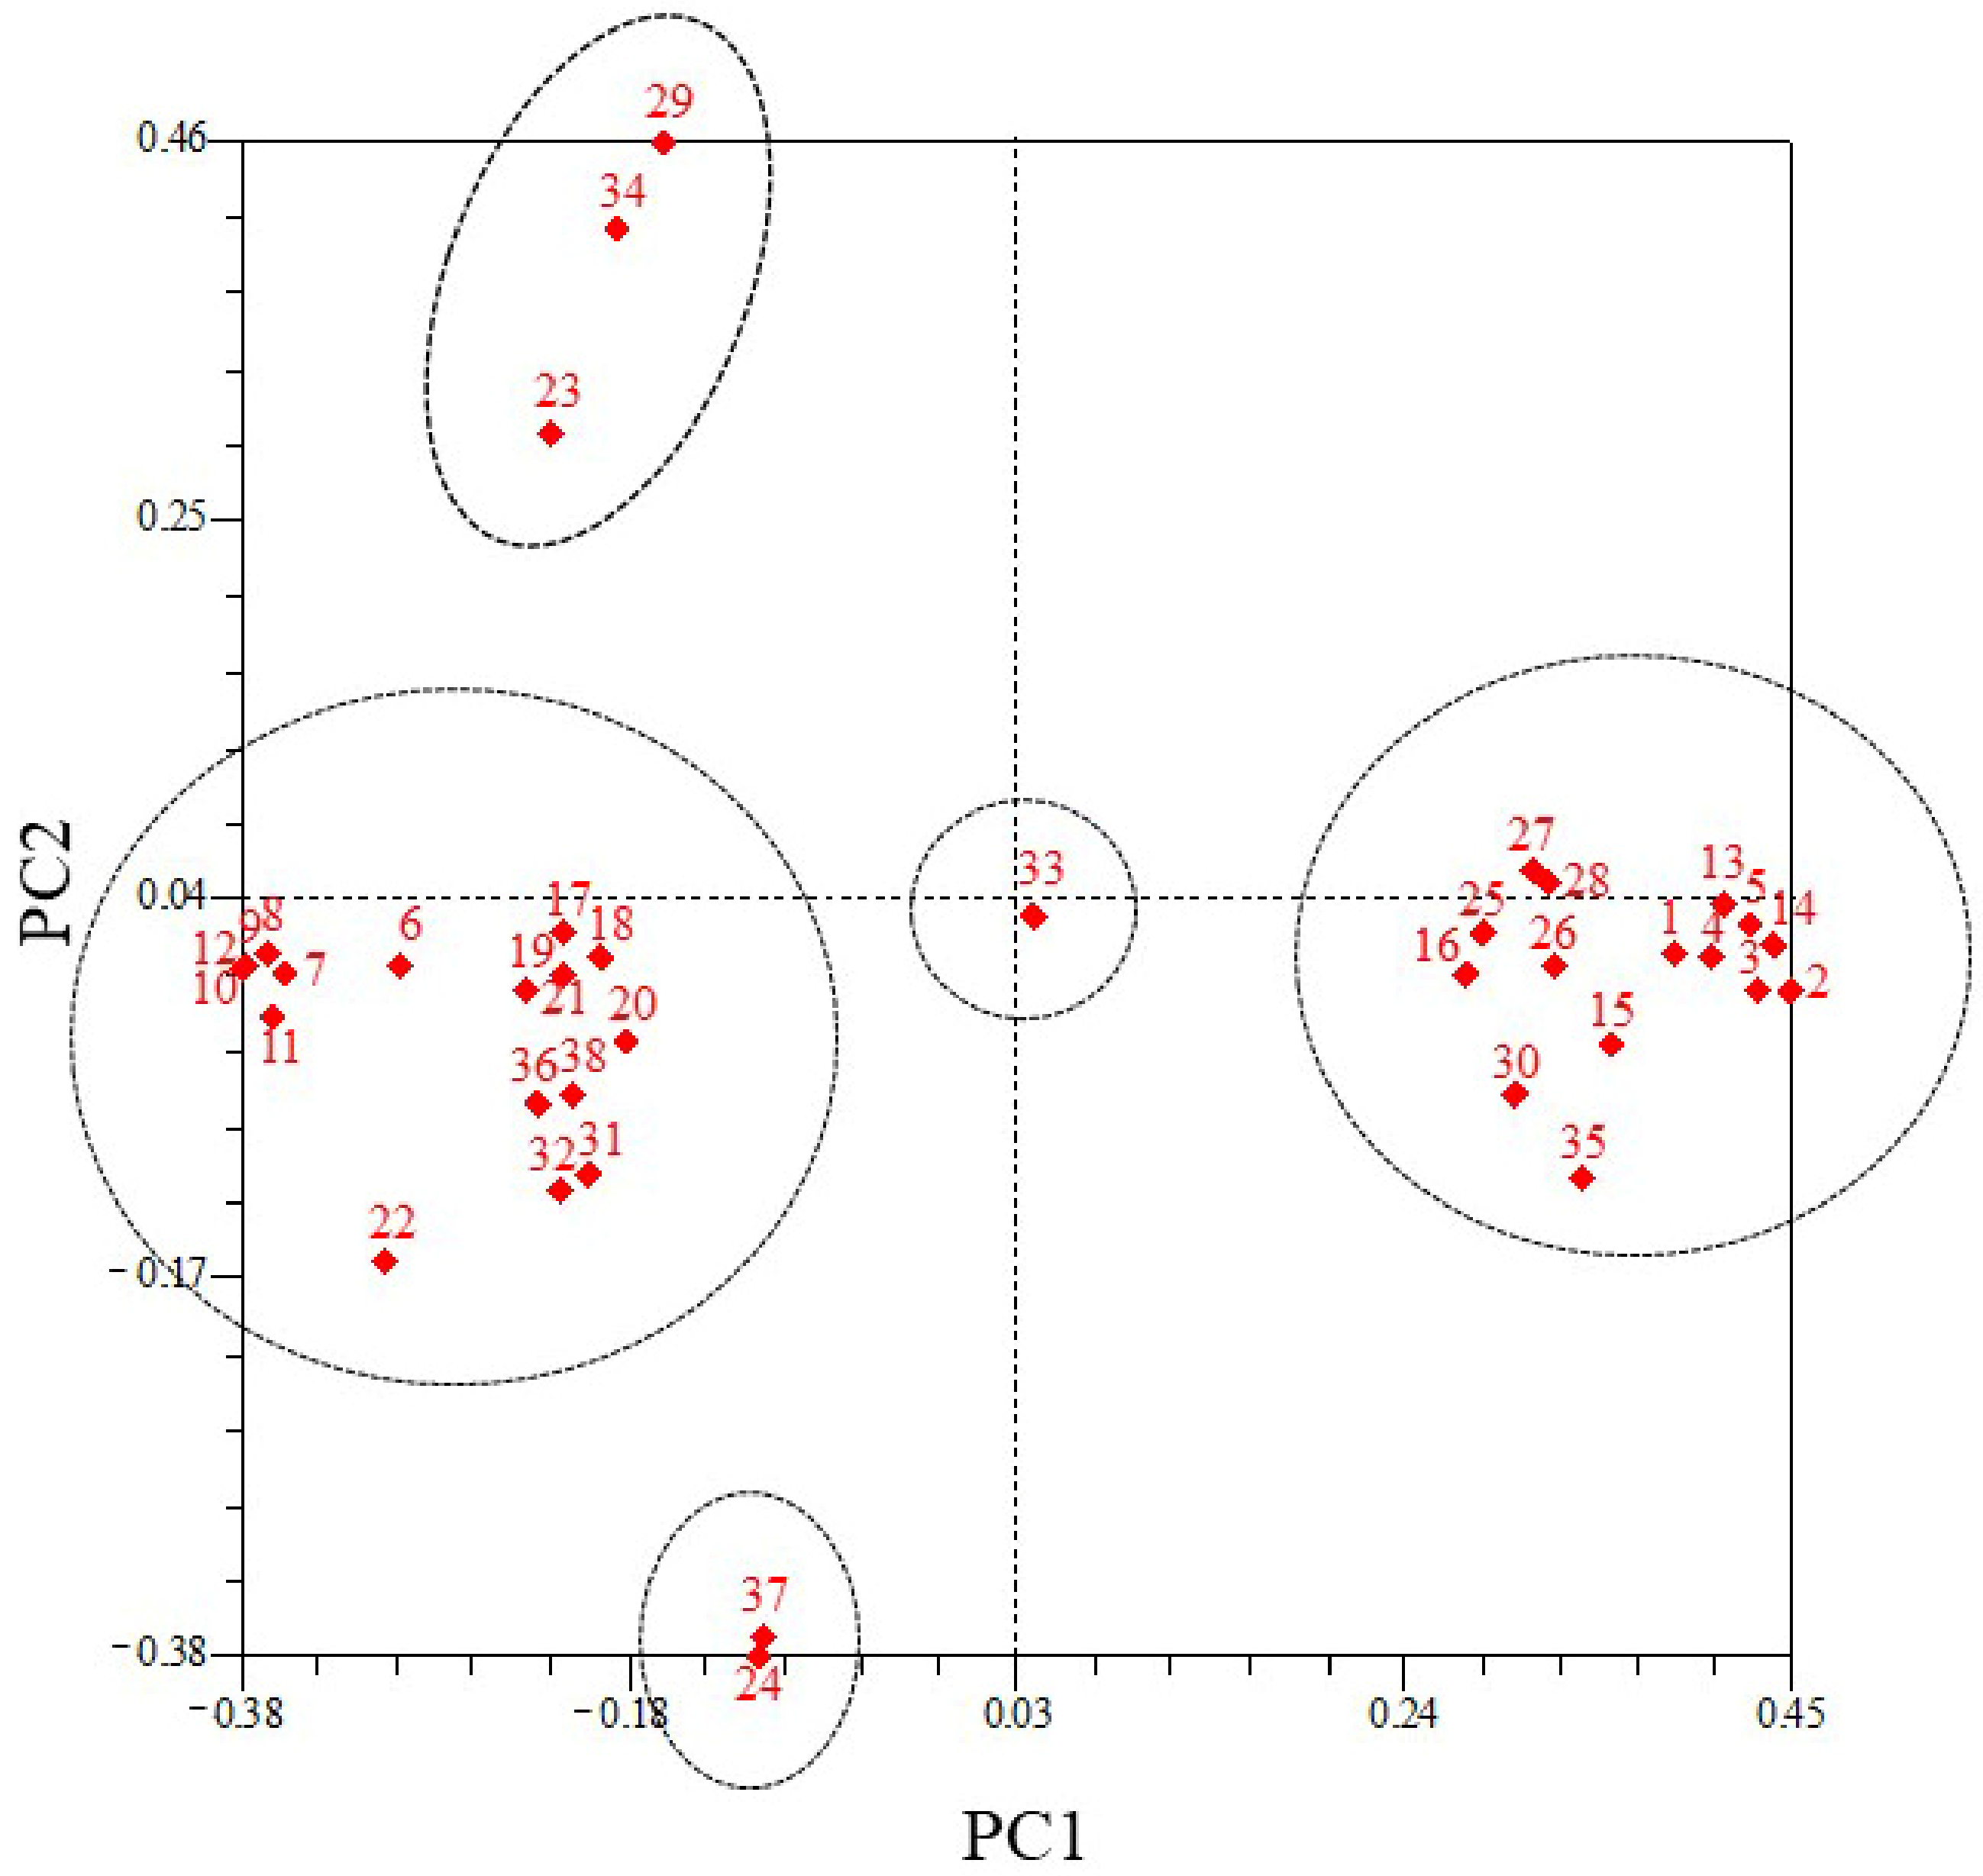
3.6. PCoA of 38 Pennisetum Accessions

PCoA was performed on 38 Pennisetum materials according to genetic distance (Figure 3), and the 38 Pennisetum samples were divided into five parts, consistent with the UPGMA clustering tree. P. clandestinum was classified as a separate category. Samples 1–5, 13–16, 25–28, 30, and 35 were clustered into one category. Sample 24 (P. setaceum) and sample 37 (P. alopecuroides cv. ‘Baimeiren’) were found to be closely related. It may be because their genetic backgrounds are more consistent. Samples 23 (P. orientale cv. ‘Xuerong’), 29 (P. alopecuroides cv. ‘Little Bunny’ (Beijing, China)), and 34 (P. alopecuroides cv. ‘Little Bunny’ (Kunming, Yunnan)) were classified into one category. These findings suggest that these species are closely related, genetic relationship is less related to region, and there is less gene exchange with local varieties.

3.7. Fingerprint of Pennisetum Varieties with Similar Genetic Background

PCR analysis of the SSR markers revealed that the PaSSR-11 primer could effectively distinguish five strains of Pennisetum with the same genetic background, including samples 1–5 (P. alopecuroides—A, P. alopecuroides—B, P. alopecuroides—C, P. alopecuroides—D, and P. alopecuroides—E. Fingerprints were established for the identification of variants (Figure 4). In addition, the PaSSR-1 and PaSSR-8 primers could distinguish between P. purpureum Schum. samples (samples 6–12).

4. Discussion

As an ornamental Pennisetum species with purple appearance, P. setaceum cv. ‘Rubrum’ has high ornamental value, strong drought tolerance, low maintenance cost, and landscaping value. In this study, 58.91 Gb of clean data was obtained via second-generation transcriptome sequencing of P. setaceum cv. ‘Rubrum’. The N50 of unigenes was 1637 bp, which was higher than those of two P. purpureus samples (N50 of 586 bp and 583 bp) [37] but lower than two P. glaucum samples (1860 bp and 1691 bp) [38]. The percentage of Q30 bases in P. setaceum cv. ‘Rubrum’ transcriptome was over 94.22%, which was higher than that of two kinds of P. glaucum (92.2% and 83.5%) [38]. A total of 55,627 unigenes were obtained after sequencing and assembly of the P. setaceum cv. ‘Rubrum’ transcriptome, which was more than the 6799 and 1253 unigenes identified in the two kinds of P. glaucum [39]. Compared with the transcriptome data of Pennisetum above, the assembly integrity of the transcriptome data and number of unigenes detected in this study is higher. This may be related to the genome size of the species itself and the quality of the sequencing. The NR database comparison showed that the species most closely related to Pennisetum was S. italica, followed by S. viridis. According to the records of Flora of China, both S. italica and S. viridis belong to the genus Setaria, and both Pennisetum and Setaria belong to the Trib. Paniceae R. Br. Pennisetum was not present in the top ten species with according to protein sequence alignment, which may be due to the lack of Pennisetum information currently available in the database. Therefore, it is very important to generate additional Pennisetum transcriptome information.
Previous studies obtained 4493 SSR markers through the transcriptome sequencing of Medicago sativa, with an SSR distribution frequency of 8.28% [40]. A total of 3745 SSR loci were obtained from transcriptome sequencing of Pinus kesiya var. langbianensis, with an SSR distribution frequency of 6.28% [41]. These values are lower than the number of SSR markers (5122) we obtained from the P. setaceum cv. ‘Rubrum’ transcriptome in this study. Among the SSR markers we identified, trinucleotide repeats (41.94%) were the most abundant, followed by mononucleotide repeats (39.26%). The main SSR type observed in the Pinus kesiya var. langbianensis transcriptome was the trinucleotide repeat (49%), followed by the dinucleotide repeat (24%) [41]. Among the SSR markers developed by transcriptome sequencing of purple elephant grass, trinucleotide repeats (59,368) were the most abundant, followed by dinucleotide repeats (15,524) [23]. Mononucleotide repeats (64.93%) were the most abundant in the Carex breviculmis transcriptome, followed by trinucleotide repeats [21]. This indicates that there are differences in the distribution of SSR repeat types among different species.
The ability to use the same SSR primers across species determines the value of these primers. In our previous studies, 42 SSRs from C. breviculmis were found to be conserved between species and within Carex species [21]. Li et al. [42] developed 18 polymorphic SSR markers for P. glaucum, which amplified polymorphic bands from 40 Pennisetum sources. Seventy-eight SSRs from Triticum aestivum were conserved from Triticum to Hordeum [43]. In the present study, 50 SSR markers were randomly selected from the 5122 SSR markers we identified, of which 38 pairs of SSR primers showed polymorphism. Those primers were used in PCR among different Pennisetum species and demonstrated that the corresponding SSRs were conserved. The SSR marker amplification results of the 38 Pennisetum samples in this study showed that the average PIC value was 0.35, which indicates a moderate level of polymorphism [44]. The PIC in our study was lower than the average PIC value of the SSR markers of the 128 Camellia sinensis varieties (0.704) [45], and Prunus avium (0.59) [46], but higher than Carex (0.259) [21]. This suggests that the PIC value, reflecting the degree of variation in SSR loci, may be related to germplasm. The genetic diversity in the collected Pennisetum samples was found to be moderate, which may be due to the materials having been collected in a relatively concentrated place where the genetic background difference may not be particularly large. In addition, based on the results of UPGMA clustering and PCoA analysis, we were able to determine the genetic background of different Pennisetum plant materials. And the results showed that the genetic relationship of Pennisetum samples was not closely related to the geographical distribution location. The phylogeny of P. clandestinum was classified into a separate category in UPGMA clustering and PCoA analysis. P. clandestinum is native to Africa and, thus, it perhaps not expected to have genetic similarity to other materials [47]. In addition, two kinds of P. alopecuroides cv. ‘Little Bunny’ materials from Beijing and Yunnan were clustered as one category, indicating that they are closely related. However, P. alopecuroides cv. ‘Ziguang’ from Beijing and P. alopecuroides cv. ‘Ziguang’ from Kunming, Yunnan, were classified into two categories. We speculated that this may be because they can cross with other local varieties when applied in different places.
Fingerprint maps can be used to identify different varieties, which is an important step for furthering Pennisetum breeding applications. We constructed fingerprints based on the genetic relationships and SSR results of 38 samples. In previous studies, the Ctcp016 primer was able to identify 12 samples of Carex based on genetic diversity, and the MtTFSSR-10 primer could distinguish seven varieties of alfalfa. In a study on Chrysanthemum × morifolium Ramat., researchers identified 480 traditional Chinese chrysanthemum varieties and established their fingerprints [48]. The fingerprints generated in the present study have important reference value in Pennisetum, which are notoriously difficult to distinguish. It is worth noting that the PaSSR-11 primer can distinguish strains of P. alopecuroides, and a combination of the PaSSR-1 and PaSSR-8 primers can distinguish seven kinds of P. purpureum Schum. P. alopecuroides cv. ‘Hameln’ and P. alopecuroides cv. ‘Little Bunny’ are similar in appearance and cannot be distinguished based on phenotypic characteristics. In this study, we succeeded in distinguishing them at the gene level using the PaSSR-1 and PaSSR-2 primers. The SSR markers developed in this study have greatly improved our ability to identify Pennisetum species.

5. Conclusions

Second-generation transcriptome sequencing of P. setaceum cv. ‘Rubrum’ provided abundant transcriptome data for Pennisetum. Thirty-eight of 50 randomly selected SSRs were conserved among the Pennisetum species studied herein, demonstrating the feasibility of developing SSR markers using RNA-seq in Pennisetum. Genetic diversity analysis of 38 Pennisetum samples was performed, revealing a high level of genetic diversity among Pennisetum species. Through UPGMA clustering and PCoA analysis, 38 Pennisetum samples were genetically classified, and a fingerprint map was developed to improve Pennisetum identification. This study lays the foundation for the subsequent collection and utilization of ornamental Pennisetum resources.

Supplementary Materials

The following supporting information can be downloaded at: https://www.mdpi.com/article/10.3390/agronomy12071683/s1, Figure S1: Representative SSR amplification results of Pennisetum varieties coded from 1 to 40; Table S1: Band Statistics Raw Data; Table S2: Genetic diversity parameters of 38 pairs of polymorphic primers in the 38 Pennisetum materials; Table S3: The genetic similarity coefficient between accessions.

Author Contributions

Conceptualization, X.F., Z.C. and K.T.; data curation, Y.G., L.L. and Y.Y.; formal analysis, Y.G. and L.L.; funding acquisition, K.T. and X.F.; investigation, Y.G.; methodology, Y.G.; project administration, W.T., H.Z., K.G. and J.G.; resources, W.T.; software, L.L.; supervision, K.T.; validation, Y.G.; visualization, L.L.; writing—original draft, Y.G.; writing—review & editing, Z.C. and K.T. All authors have read and agreed to the published version of the manuscript.

Funding

This study was s funded by the Scientific Funds of Beijing Academy of Agriculture and Forestry Sciences (KJCX20210431, CZZJ202210, KJCX20220103), and Scientist Program granted to X.F.

Institutional Review Board Statement

Not applicable.

Informed Consent Statement

Not applicable.

Data Availability Statement

The Illumina NGS reads generated in this study were submitted to the BioProject database of the National Center for Biotechnology Information (Accession No. PRJNA744323).

Acknowledgments

We acknowledge the Biomarker Corporation (Beijing, China) for the facilities and expertise of Illumina platform for libraries construction and sequencing. We also thank Qi Wang from Yunnan Forestry Technological College for plant material collection.

Conflicts of Interest

The authors declare no conflict of interest.

References

  1. Robert, T.; Khalfallah, N.; Martel, E.; Lamy, F.; Sarr, A. Pennisetum. In Wild Crop Relatives: Genomic and Breeding Resources; Springer: Berlin/Heidelberg, Germany, 2010; pp. 217–255. [Google Scholar]
  2. Tenorio, C.; Moya, R.; Tomazello, M.; Valaert, J. Quality of Pellets Made from Agricultural and Forestry Crops in Costa Rican Tropical Climates. Bioresources 2015, 10, 482–498. [Google Scholar] [CrossRef]
  3. Xu, J.; Liu, C.; Song, Y.; Li, M. Comparative Analysis of the Chloroplast Genome for Four Pennisetum Species: Molecular Structure and Phylogenetic Relationships. Front. Genet. 2021, 12, 687844. [Google Scholar] [CrossRef] [PubMed]
  4. Hayat, K.; Bundschuh, J.; Jan, F.; Menhas, S.; Zhou, P. Combating soil salinity with combining saline agriculture and phytomanagement with salt-accumulating plants. Crit. Rev. Env. Sci. Tec. 2019, 50, 1085–1115. [Google Scholar] [CrossRef]
  5. Gallego, L.J.; Escobar, A.; Penuela, M.; Pena, J.D.; Rios, L.A. King Grass: A promising material for the production of second-generation butanol. Fuel 2015, 143, 399–403. [Google Scholar] [CrossRef]
  6. Zhang, Y.; Yuan, X.; Teng, W.; Chen, C.; Wu, J. Identification and Phylogenetic Classification of Pennisetum (Poaceae) Ornamental Grasses Based on SSR Locus Polymorphisms. Plant Mol. Biol. Rep. 2016, 34, 1181–1192. [Google Scholar] [CrossRef]
  7. Wu, J.; Teng, W.; Wang, Q. Basic Botanic Characters, Adaptabilities and Applying in Landscape Architecture of Pennisetum alopecuroides. Chin. Landsc. Archit. 2005, 21, 57–59. [Google Scholar]
  8. Song, X.; Zhong, Y.; Zhang, Q. Preliminary Studies on the Application of Ornamental Grassland in Landscape. Chin. Landsc. Archit. 2004, 3, 35–39. [Google Scholar]
  9. Yue, Y.; Fan, X.; Hu, Y.; Han, C.; Wu, J. In vitro induction and characterization of hexaploid Pennisetum × advena, an ornamental grass. Plant Cell Tiss. Org. 2020, 142, 221–228. [Google Scholar] [CrossRef]
  10. Owen, W.G.; Lopez, R.G. Geranium and Purple Fountain Grass Leaf Pigmentation Is Influenced by End-of-Production Supplemental Lighting with Red and Blue Light-emitting Diodes. HortScience 2017, 52, 236–244. [Google Scholar] [CrossRef] [Green Version]
  11. Hasanova, S.; Akparov, Z.; Mammadov, A.; Amirov, L.; Abbasov, M. Genetic diversity of chickpea genotypes as revealed by ISSR and RAPD markers. Genetika 2017, 49, 415–423. [Google Scholar] [CrossRef]
  12. Bortolini, F.; Agnol, M.D.; Schifino-Wittmann, M.T. Molecular Characterization of the USDA White Clover (Trifolium repens L.) Core Collection by RAPD Markers. Genet. Resour. Crop Evol. 2006, 53, 1081–1087. [Google Scholar] [CrossRef]
  13. Zaharieva, M.; Santoni, S.; David, J. Use of RFLP markers to study genetic diversity and to build a core-collection of the wild wheat relative Ae-geniculata Roth (=Ae ovata L.). Genet. Sel. Evol. 2001, 33, S269–S288. [Google Scholar] [CrossRef] [Green Version]
  14. Chavarriaga-Aguirre, P.; Maya, M.M.; Tohme, J.; Duque, M.C.; Iglesias, C.; Bonierbale, M.W.; Kresovich, S.; Kochert, G. Using microsatellites, isozymes and AFLPs to evaluate genetic diversity and redundancy in the cassava core collection and to assess the usefulness of DNA-based markers to maintain germplasm collections. Mol. Breed. 1999, 5, 263–273. [Google Scholar] [CrossRef]
  15. Wang, R.; Li, X.; Zhang, W.; Ou, J.; Fang, C.; Song, Q.; Zhou, H. SSR analysis and fingerprint construction to evaluate the genetic diversity of medicinal plum varieties. J. Plant Biochem. Biot. 2021, 31, 1–11. [Google Scholar] [CrossRef]
  16. Fang, W.P.; Meinhardt, L.W.; Tan, H.W.; Zhou, L.; Mischke, S.; Zhang, D. Varietal identification of tea (Camellia sinensis) using nanofluidic array of single nucleotide polymorphism (SNP) markers. Hortic. Res. 2014, 1, 8. [Google Scholar] [CrossRef] [Green Version]
  17. Kaur, S.; Panesar, P.S.; Bera, M.B.; Kaur, V. Simple Sequence Repeat Markers in Genetic Divergence and Marker-Assisted Selection of Rice Cultivars: A Review. Crit. Rev. Food Sci. 2015, 55, 41–49. [Google Scholar] [CrossRef]
  18. Szewc-Mcfadden, A.K.; Kresovich, S.; Bliek, S.M.; Mitchell, S.E.; Mcferson, J.R. Identification of polymorphic, conserved simple sequence repeats (SSRs) in cultivated Brassica species. Theor. Appl. Genet. 1996, 93, 534–538. [Google Scholar] [CrossRef]
  19. Saha, M.C.; Mian, M.; Eujayl, I.; Zwonitzer, J.C.; Wang, L.; May, G.D. Tall fescue EST-SSR markers with transferability across several grass species. Appl. Genet. 2004, 109, 783–791. [Google Scholar] [CrossRef]
  20. Torre, S.; Tattini, M.; Brunetti, C.; Fineschi, S.; Fini, A.; Ferrini, F.; Sebastiani, F. RNA-Seq Analysis of Quercus pubescens Leaves: De Novo Transcriptome Assembly, Annotation and Functional Markers Development. PLoS ONE 2014, 9, e112487. [Google Scholar] [CrossRef] [Green Version]
  21. Liu, L.; Fan, X.; Tan, P.; Wu, J.; Teng, K. The development of SSR markers based on RNA-sequencing and its validation between and within Carex L. species. BMC Plant Biol. 2021, 21, 17. [Google Scholar] [CrossRef]
  22. Zhou, S.; Wang, C.; Yin, G.; Zhang, Y.; Huang, L. Phylogenetics and diversity analysis of Pennisetum species using Hemarthria EST-SSR marker. Grassl. Sci. 2018, 65, 13–22. [Google Scholar] [CrossRef] [Green Version]
  23. Wang, C.; Yan, H.; Ji, L.; Zhou, S.; Liu, T.; Zhang, X.; Huang, L. Genome survey sequencing of purple elephant grass (Pennisetum purpureum Schum ‘Zise’) and identification of its SSR markers. Mol. Breed. 2018, 38, 94. [Google Scholar] [CrossRef]
  24. Liu, L.; Teng, K.; Fan, X.; Han, C.; Zhang, H.; Wu, J.; Chang, Z. Combination analysis of single-molecule long-read and Illumina sequencing provides insights into the anthocyanin accumulation mechanism in an ornamental grass, Pennisetum setaceum cv. rubrum. Plant Mol. Biol. 2022, 109, 159–175. [Google Scholar] [CrossRef] [PubMed]
  25. Borba, T.; Brondani, R.; Rangel, P.; Brondani, C. Microsatellite marker-mediated analysis of the EMBRAPA Rice Core Collection genetic diversity. Genetica 2009, 137, 293–304. [Google Scholar] [CrossRef]
  26. Grabherr, M.G.; Haas, B.J.; Yassour, M.; Levin, J.Z.; Thompson, D.A.; Amit, I.; Adiconis, X.; Fan, L.; Raychowdhury, R.; Zeng, Q. Full-length transcriptome assembly from RNA-Seq data without a reference genome. Nat. Biotechnol. 2011, 29, 644–652. [Google Scholar] [CrossRef] [Green Version]
  27. Deng, Y.; Jianqi, L.I.; Songfeng, W.U.; Zhu, Y.; Chen, Y.; Fuchu, H.E. Integrated nr Database in Protein Annotation System and Its Localization. Comput. Eng. 2006, 32, 71–72. [Google Scholar]
  28. Rolf, A.; Amos, B.; Wu, C.H.; Barker, W.C.; Brigitte, B.; Serenella, F.; Elisabeth, G.; Huang, H.; Rodrigo, L.; Michele, M. UniProt: The Universal Protein knowledgebase. Nucleic Acids Res. 2004, 32, D115–D119. [Google Scholar]
  29. Tatusov, R.L.; Galperin, M.Y.; Natale, D.A.; Koonin, E.V. The COG database: A tool for genome-scale analysis of protein functions and evolution. Nucleic Acids Res. 2000, 28, 33–36. [Google Scholar] [CrossRef] [Green Version]
  30. Yuan, X.; Li, K.; Huo, W.; Lu, X. De Novo Transcriptome Sequencing and Analysis to Identify Genes Involved in the Biosynthesis of Flavonoids in Abrus mollis Leaves. Russ. J. Plant Phys. 2018, 65, 333–344. [Google Scholar] [CrossRef]
  31. Jaime, H.C.; Damian, S.; Kristoffer, F.; Helen, C.; Davide, H.; Walter, M.C.; Thomas, R.; Mende, D.R.; Shinichi, S.; Michael, K. eggNOG 4.5: A hierarchical orthology framework with improved functional annotations for eukaryotic, prokaryotic and viral sequences. Nucleic Acids Res. 2016, 44, D286–D293. [Google Scholar]
  32. Minoru, K.; Susumu, G.; Shuichi, K.; Yasushi, O.; Masahiro, H. The KEGG resource for deciphering the genome. Nucleic Acids Res. 2004, 32, D277. [Google Scholar]
  33. Huson, D.H.; Buchfink, B. Fast and sensitive protein alignment using DIAMOND. Nat. Methods 2015, 12, 59–60. [Google Scholar]
  34. Yan, X.Q.; Min, L.U.; Hua-Ming, A.N.; University, G. Analysis on SSR Information in Transcriptome and Development of Molecular Markers in Rosa roxburghii. Acta Hortic. Sin. 2015, 42, 341–349. [Google Scholar]
  35. Guo, J.; Zhu, J.; Xie, S. Development of SSR Molecular Markers Based on Transcriptome and Analysis of Genetic Relationship of Germplasm Resources in Avocado. Acta Hortic. Sin. 2020, 47, 1552–1564. [Google Scholar] [CrossRef]
  36. Rohlf, F.; Rohlf, F.; Rohlf, F.; Rohlf, F.; Rohlf, F.J. NTSYS-pc, Numerical Taxonomy and Multivariate Analysis System, Version 2.1; Applied Biostatistics Inc.: New York, NY, USA, 2000. [Google Scholar]
  37. Wu, J.; Qian, C.; Liu, Z. De novo transcriptomic analysis for lignin synthesis in Cenchrus purpureus using RNA-seq. Acta Prataculturae Sin. 2019, 28, 150–161. [Google Scholar]
  38. Shivhare, R.; Lakhwani, D.; Asif, M.H.; Chauhan, P.S.; Lata, C. De novo assembly and comparative transcriptome analysis of contrasting pearl millet (Pennisetum glaucum L.) genotypes under terminal drought stress using illumina sequencing. Nucleus 2020, 63, 341–352. [Google Scholar] [CrossRef]
  39. Ambika, D.; Harshraj, S.; Daisuke, T.; Liu, S.; Tetsuo, T.; Singh, Y.R. Transcriptomic analysis reveals the differentially expressed genes and pathways involved in drought tolerance in pearl millet [Pennisetum glaucum (L.) R. Br]. PLoS ONE 2018, 13, e195908. [Google Scholar]
  40. Wang, Z.; Yu, G.; Shi, B.; Wang, X.; Qiang, H.; Gao, H.; Zhou, F. Development and Characterization of Simple Sequence Repeat (SSR) Markers Based on RNA-Sequencing of Medicago sativa and in silico Mapping onto the M. truncatula Genome. PLoS ONE 2014, 9, e92029. [Google Scholar] [CrossRef]
  41. Zhao, N.; Yuan, X.; Miao, F. Development of SSR Molecular Markers Based on Transcriptome Data of Pinus kesiya var. langbianensis. Biotechnol. Bull. 2017, 33, 71–77. [Google Scholar]
  42. Li, Q.; Liu, T.; Zhang, S. Development and Application of Survey Sequencing and gSSR Molecular Marker of Pennisetum glaucum. Mol. Plant Breed. 2019, 17, 5375–5382. [Google Scholar]
  43. Gupta, P.K.; Rustgi, S.; Sharma, S.; Singh, R.; Kumar, N.; Balyan, H.S. Transferable EST-SSR markers for the study of polymorphism and genetic diversity in bread wheat. Mol. Genet. Genom. 2003, 270, 315–323. [Google Scholar] [CrossRef] [PubMed]
  44. Wang, Y.; Yang, Y.; Fan, S. Genetic Diversity Analysis of 73 Vitis amurensis and Its Hybrids Offsprings Based on SSR Molecular Markers. Biotechnol. Bull. 2021, 37, 189–197. [Google Scholar]
  45. Tan, L.Q.; Peng, M.; Xu, L.Y.; Wang, L.Y.; Chen, S.X.; Zou, Y.; Qi, G.N.; Cheng, H. Fingerprinting 128 Chinese clonal tea cultivars using SSR markers provides new insights into their pedigree relationships. Tree Genet. Genomes 2015, 11, 90. [Google Scholar] [CrossRef]
  46. Schüller, E.; Fernández, F.F.; Antanaviciute, L.; Anhalt-Brüderl, U.; Forneck, A. Autochthonous Austrian Varieties of Prunus avium L. Represent a Regional Gene Pool, Assessed Using SSR and AFLP Markers. Genes 2021, 12, 322. [Google Scholar] [CrossRef] [PubMed]
  47. Arango, J.; Lopez, A.; Marquez, E.; Echeverri, J. Development and validation of microsatellite markers for kikuyu grass using next generation sequencing technology. Crop Pasture Sci. 2022, 73, 415–424. [Google Scholar] [CrossRef]
  48. Zhang, Y.; Dai, S.; Yan, H.; Song, X.; Fang, D.D. Application of Genomic SSR Locus Polymorphisms on the Identification and Classification of Chrysanthemum Cultivars in China. PLoS ONE 2014, 9, e104856. [Google Scholar] [CrossRef] [Green Version]
Figure 1. The gene annotation results of P. setaceum cv. ‘Rubrum’ based on COG, NOG and NR databases. (a) COG gene annotation results. (b) NOG gene annotation results. (c) NR function classification of consensus sequences.
Agronomy 12 01683 g001
Figure 2. UPGMA clustering analysis of 40 samples. The number on the horizontal axis in the figure represents the genetic coefficient, and the number on the vertical axis represents the samples number from 1 to 40.
Agronomy 12 01683 g002
Figure 3. PCoA analysis of 38 Pennisetum materials. The numbers on the horizontal and vertical coordinates in the figure represent the genetic coefficient, and the numbers represent the sample numbers from 1 to 40.
Agronomy 12 01683 g003
Figure 4. Identification fingerprint of 5 Pennisetum varieties by primer PaSSR11. The numbers 1–5 on the ordinate represent Pennisetum samples (No. 1–5), and the numbers on the abscissa represent the length of alleles; the white squares represent amplified bands, and the black squares represent non-amplified bands. The binary identity is represented as “1” and “0” respectively; the decimal identity is converted from the binary identity.
Agronomy 12 01683 g004
Table 1. The information of 38 Pennisetum and 2 control materials.
Sample IDSample NameSampling Location
1P. alopecuroides—ABeijing
2P. alopecuroides—BBeijing
3P. alopecuroides—CBeijing
4P. alopecuroides—DBeijing
5P. alopecuroides—EBeijing
6P. purpureum Schum. —ABeijing
7P. purpureum Schum. —BBeijing
8P. purpureum Schum. —CBeijing
9P. purpureum Schum. —DBeijing
10P. purpureum Schum. —EBeijing
11P. purpureum Schum. —FBeijing
12P. purpureum Schum. —GBeijing
13P. alopecuroides—FAnhui
14P. alopecuroides cv. ‘Ziguang’Beijing
15P. alopecuroides cv. ‘Liren’Beijing
16P. alopecuroides cv. ‘Baijian’Beijing
17P. alopecuroides cv. ‘Wucai’Beijing
18P. alopecuroides variation ‘Wucai’ —ABeijing
19P. alopecuroides variation ‘Wucai’ —BBeijing
20P. villosumBeijing
21P. setaceum cv. ‘Rubrum’Beijing
22P. purpureumBeijing
23P. orientale cv. ‘Xuerong’Beijing
24P. setaceumBeijing
25P. alopecuroides cv. ‘Changsui’ —ABeijing
26P. alopecuroides cv. ‘Changsui’ —BBeijing
27P. alopecuroides cv. ‘Aizhu’ —ABeijing
28P. alopecuroides cv. ‘Aizhu’ —BBeijing
29P. alopecuroides cv. ‘Little Bunny’Beijing
30P. alopecuroides cv. ‘Hameln’Beijing
31P. purpureum schumab cv. RedKunming
32P. alopecuroides cv. ‘Ziguang’Kunming
33P. clandestinumKunming
34P. alopecuroides cv. ‘Little Bunny’Kunming
35P. alopecuroides cv. ‘Purple’Kunming
36P. alopecuroides cv. ‘Fire Works’Kunming
37P. alopecuroides cv. ‘Baimeiren’Kunming
38P. villosumKunming
39P. virgatumBeijing
40S. viridisBeijing
Table 2. Unigene annotation statistics.
DatabaseAnnotated Number300 ≤ Length < 1000Length ≥ 1000
COG Annotation660615535053
GO Annotation22,845885913,986
KEGG Annotation17,384585511,529
KOG Annotation13,49841529346
Pfam Annotation18,502528213,220
Swissprot Annotation16,727534711,380
eggNOG Annotation23,365882714,538
Nr Annotation30,02012,30217,718
All Annotated30,93012,99917,931
Table 3. The distribution and quantity of different SSR types.
TypeNumberProportion
Mono nucleotide201139.26%
Di nucleotide75314.70%
Tri nucleotide214841.94%
Tetra nucleotide420.82%
Penta nucleotide110.21%
Hexa nucleotide20.04%
c 11532.99%
c* 220.04%
Total number of identified SSRs5122
1 “c” means contains at least two SSRs, and the distance between them is less than 100bp without overlap. 2 “c*” means there is overlap between composite SSRs.
Table 4. The information of 50 pairs of SSR makers.
Primer IDPolymorphismForward Primer Sequence (5–3)Reverse Primer Sequence (5–3)
PaSSR—1YesTATACTTGGTTGCCACGGGTTTCATGGTGATGCGTCATTT
PaSSR—2YesAACCCCTAGCAGTCTCTCCCGCGGTACTCGTACTGCTTGA
PaSSR—3NoTCCATGGAGTACCCGAAGAGACATCAACCACTGCAACCAA
PaSSR—4NoAAAATTAGGTCCGCTTGCCTGACCGATTCCAATTCCGTTA
PaSSR—5NoCCCCTTTTTCTCTCACTCCCCCACCAATTTGCCTTTCAGT
PaSSR—6NoAAAGAAAGAAAAGAAAACGCACACCTAGCTTGTCTGCCTCCTG
PaSSR—7YesGCGAGGAGATTCAGAGATCGGGACGAACAAAGAGACCGAG
PaSSR—8YesTATGGGTTGCTCCTCGAATCATTGAACAGCTTCTGCGGAT
PaSSR—9YesTGGATGGAGGACAGTGATGAACGACCAGGAAAGCCTTACA
PaSSR—10YesTGTTCCGATATGCCTGTTTTCTGCAACATTCTGCATGGAC
PaSSR—11YesAGCTAGGCACAAAGAAGGCACTAGCTTCATGATGCACGGA
PaSSR—12YesCTTTACCCAAACAGCCCCTCTCTGGATTAACCACTTCGGC
PaSSR—13YesTGGTCAGTTGTCGACTCAGGACGCACTTGTACTGTGGCTG
PaSSR—14YesGTCCACGAGAGAGGGAAGAGGTAGCATATCCCGCCTGTGT
PaSSR—15NoGGCTCAATTTGGTGCATTCTTATTAAACCAGGGTGGCTGC
PaSSR—16YesAGCAGCAACAACTGCAACAGGCTACAGGGTTTGCCACATT
PaSSR—17YesGACCAGTCGCTCTCGACCTAATCCACCTTCCAAGCCAG
PaSSR—18YesCTCAGAAGGGTGGGTACGAATGTGCCAATGCAGAGAAGTC
PaSSR—19NoTCAACCAGGCCAGATCATAAACGAGGCCTCTACGACAGAA
PaSSR—20NoACCTCTGCGTGGTGAAGAATCTCCAGAAGTAGCAGCAGCA
PaSSR—21YesGCTCTCGCAGTACATCTCCCGCCACTTGACCTTCTCCTTG
PaSSR—22NoTCGTGGTCAAACTGATAGCGCTCCAGAAGTAGCAGCAGCA
PaSSR—23NoCAGCAAATGCAGCCTATCAACTGTTGGTCACTGGTCCCTT
PaSSR—24YesAAGGGACCAGTGACCAACAGCCAGATTCACGAACTGACCA
PaSSR—25NoGACAAAACTACGGGGGTCAACGGTGGGGAAGAAAGAAAAT
PaSSR—26YesAGACGAGCGGAGAGGAAACTCCGCTCCTTGATCTTTCTG
PaSSR—27YesGCACCACCACCTCTCTTCTTCGAGGAGGAAGATCTCGATG
PaSSR—28YesAACCTCTTCGCTTCTCTCCCCAGCAGGCACAACTTCCAT
PaSSR—29YesTTCGATTGCTTGTATGCTGCCCGCACGTAGTTGTGAGTGT
PaSSR—30YesTTCTTCTTCGCCGTACGAATGATCGAGATGGCGACAAAAT
PaSSR—31YesGTTCCCCTCTGTATCTGGGCGCTGGGGAAGGAAGACCTC
PaSSR—32YesAGTACGGCTGCCTCGTCTACTAGTTGCGGTCGAGAAGGAT
PaSSR—33YesATCAGGTCGGTGGTGAGAACCCCATCTGATGCTCCAACTT
PaSSR—34YesTGCAGAGAAACCAATTGCAGCCGGTTCATAAGCTGGTGTT
PaSSR—35YesATGCTCTATGCACTCCCACCTGAACCCTGATTTGAGGTCC
PaSSR—36YesCCGCTGTAACTCTCAGCCACCACTCCTTCACTCAGCCTCC
PaSSR—37NoCGCACCTCGTTCGATTTTTGAACAGGTGCACAGGAGGAC
PaSSR—38YesTTACCCTCCCAGATTGCTTGCGTGAAAAGAATAGTCGTCCG
PaSSR—39YesCACCACCACCTCTCCTCTTCGAGAAGCTCATGTCGACGG
PaSSR—40YesTTCCACATCTCCGCTTCTCTCCTTGAACTTCTCCTCGTCG
PaSSR—41YesTCGGGAAGAAAGCTGAAAAACTCGCCTCCTCTCCTCTCTT
PaSSR—42YesGAGGCCTCTCCCTCTCTCTCGACCAAACCCAAACCCAAC
PaSSR—43YesCTCCGCTCATCCTACCCTCTGGGTTCTAGGGTTCTGTCG
PaSSR—44YesCCAAATTTTCCAAGCCAAAAACTGGTGGATCTGCGCCT
PaSSR—45YesGCTCTTCATCATAGCGGTGGAGACCGAGGACGTAGAGCAG
PaSSR—46YesAAATGCCATGACAACTGCTGCAAGAACGCAGACGACAAAA
PaSSR—47YesCGGATTTCCTACAGCGAGAGATACCGACAAAAACCCGACA
PaSSR—48YesGTGCGTCTCACACACCACACCAAGTGGGGATGAACAGAG
PaSSR—49NoTAGACTTCGGTCGACTCGCTAACGAACACCTGGCGTAGAT
PaSSR—50YesCAGGGTGCAGTTAAGGGTTCCCATCTGTGTTCATATGGCG
Publisher’s Note: MDPI stays neutral with regard to jurisdictional claims in published maps and institutional affiliations.

