Article

Interactive Effects of Tillage Systems and Nitrogen Fertilizer Rates on the Performance of Mustard-Boro-aman Rice Cropping Systems under Conservation Agriculture Practices

by
Nazmus Salahin
1,
Md. Khairul Alam
2,
Nirmal Chandra Shil
1,
Abu Taher Mohammad Anwarul Islam Mondol
1,
Md. Jahangir Alam
1,
Mohamed I. Kobeasy
3,
Ahmed Gaber
4,* and
Sharif Ahmed
5,*
1
Soil Science Division, Regional Agricultural Research Station, BARI, Jashore 7400, Bangladesh
2
Soil Science Division, Bangladesh Agricultural Research Council, Dhaka 1208, Bangladesh
3
Department of Chemistry, Faculty of Science, Taif University, P.O. Box 11099, Taif 21944, Saudi Arabia
4
Department of Biology, College of Science, Taif University, P.O. Box 11099, Taif 21944, Saudi Arabia
5
International Rice Research Institute, Bangladesh Office, Dhaka 1213, Bangladesh
*
Authors to whom correspondence should be addressed.
Agronomy 2022, 12(7), 1671; https://doi.org/10.3390/agronomy12071671
Submission received: 9 June 2022 / Revised: 30 June 2022 / Accepted: 11 July 2022 / Published: 13 July 2022

Abstract

:
In intensive crop production systems, sustainable agricultural development strives to find the balance between productivity and environmental impact. To reduce the N fertilizer-associated environmental risks of intensive cropping, sound agronomic and environmentally acceptable management practices are urgently needed. To attain high yields, improve soil health, and ensure economic return and N usage efficiency in conservation-based intensive agriculture, N management must be optimized, which has not yet been studied systematically in the mustard-boro rice-aman rice cropping pattern. During 2016/17, 2017/18, and 2018/19 cropping seasons in Bangladesh, cropping system experiments were conducted to investigate the interactive effects of tillage practices and nitrogen fertilizer rates on soil characteristics, crop productivity, and profitability under conservation agriculture (CA) systems. The trial featured two tillage systems: (i) conventional tillage (CT) and (ii) strip-tillage (ST). It also used three doses of N fertilizer: N1: 75% of the recommended N fertilizer dose (RND); N2: 100% of the RND; and N3: 125% of the RND. Each crop’s experiment was set up in a split-plot design with three replications, with the main plot assigned tillage practices and the sub-plot assigned nitrogen fertilizer rates. For rice, neither the tillage systems nor the interactions between the tillage systems and N levels affected any of the growth parameters, yield, and yield components, but the N levels did. Across the tillage systems, the rice grain and straw yield were similar for the N levels of 100% RND and 125% RND, which were significantly higher than the N level of 75% RND. In mustard, the highest seed yield was recorded from the tillage system ST, with an N level of 125% RND, which was at par with the tillage system ST with 100% RND and CT with 125% RND. The highest system rice equivalent yield (SREY, 14.9 to 15.8 t ha−1) was recorded from the tillage system ST, with an N level of 125% RND, which was at par with the same tillage system with an N level of 100% RND. The soil penetration and bulk density (BD) were higher for the CT than the ST, but soil organic matter (OM), total nitrogen (TN), phosphorus (P), potassium (K), and boron (B) content were higher for the tillage system ST than the CT. Across N levels, the tillage system CT had a 2–4% higher production cost than the ST. Total production cost increased as N levels increased across all tillage systems. The tillage system ST with an N level of 125% RND had the highest system gross return and net profit, which was at par with the same tillage system with 100% RND. This study suggested that farmers should apply slightly higher N for the mustard-boro-aman rice systems for the first couple of years when commencing CA; however, after a few years of consistent CA practice, the N rate may be reduced.

1. Introduction

Minimal tillage (MT) in conservation agriculture (CA) systems reduce soil disturbance, making for more sustainable and resilient crop production [1]. In comparison to conventional tillage systems, MT decreases crop establishment costs, minimizes soil and environmental pollution, encourages concurrent use of organics, enhances soil health, aids field operation timeliness, and promotes prompt crop planting. By slowing the breakdown of plant residues, this practice can reduce the release of mineralized inorganic forms of plant nutrients in the soil [1,2]. In Bangladesh’s rice-based intensive cropping systems, planting for upland crops following strip tillage and non-puddled transplanting for rice crop establishment have recently been introduced [3,4]. Considering production, economic return, and soil health, the novel crop-establishing approaches performed almost as well as or better than the conventional practices [4,5]. If additional management practices can be established in line with CA practices, the performance of CA practices can be increased [5]. In Bangladesh, fertilizer rates and application methods utilized in conventional crop establishment practices have not yet been optimized for CA-based crop production practices.
Nitrogen (N) is the most limiting nutrient element in Bangladesh soils due to poor soil organic matter content [6]. In the South Asian Gangetic plains, Urea contributes around 75% of the fertilizer used in rice-based intensive crops, and it is mostly used in rice crop production, which occupies about 80% of the arable land [6,7]. According to Alam et al. [5], adopting the novel non-puddled rice transplanting and strip planting of upland crops increased N accumulation in soil by slowing in-season N turnover due to the slow breakdown of plant residues and reducing mineral N availability to crops during the early growth stage of crops, resulting in an increase in crop N uptake. Due to the synchrony between crop demand and soil N supply under strip-tillage/non-puddling and residue retention practices, Alam et al. [5] found that crops in the mustard-boro-aman rice, lentil-jute-aman rice, and wheat-jute-aman rice cropping systems required low N application. A lower N mineralization rate in CA was recorded than the conventional crop establishment practices following puddling and deep tillage since the soil is minimally disturbed while keeping organic residues on the surface [5,7,8]. The CA practice improved crop production sustainability by conserving and protecting natural resources such as soil, water, and energy [9,10]. Crop residue integration did not improve the N supply to the succeeding crop during its early vegetative growth phase, but it did increase the N supply to the crop at later growth stages. Thus, Thuy et al. [11] recommended performing experiments to optimize the time and rate of fertilizer N delivery to crops receiving residues. As a result, in CA-based systems, effective nitrogen fertilizer management is critical for optimizing crop production and economic yields, improving N efficiency, and ensuring environmental sustainability [12].
Many studies have demonstrated that the conventional rice–rice system requires more N than the mustard–rice system; however, under CA practice, the organic residues remain on the surface, where the decomposition and nitrogen mineralization rate is lower, resulting in less nitrate in the soil under CA than in conventionally tilled soil [13]. As a result, with minimum tillage, nitrogen in the systems is less available for the first few years after conversion from full tillage. Since less N is available for crop development under CA due to decreased mineralization, for the initial years of CA practice, it may be essential to apply additional N fertilizer. Sutapa [14] reported a higher N requirement for transplanting rice in non-puddled soils (strip tillage) with crop residue retention than in puddled soils due to N immobilization during minimum tillage. However, there are no data available to quantify the nitrogen fertilizer needed for the mustard-boro-aman rice cropping system in Bangladesh using conservation tillage approaches. In light of the above discussion, the purpose of this study was to assess the interactive effect of tillage options and nitrogen fertilizer rates on soil characteristics, crop yields, system productivity, and profitability in an intensive cropping system (mustard-boro rice-aman rice) under CA practice.

2. Materials and Methods

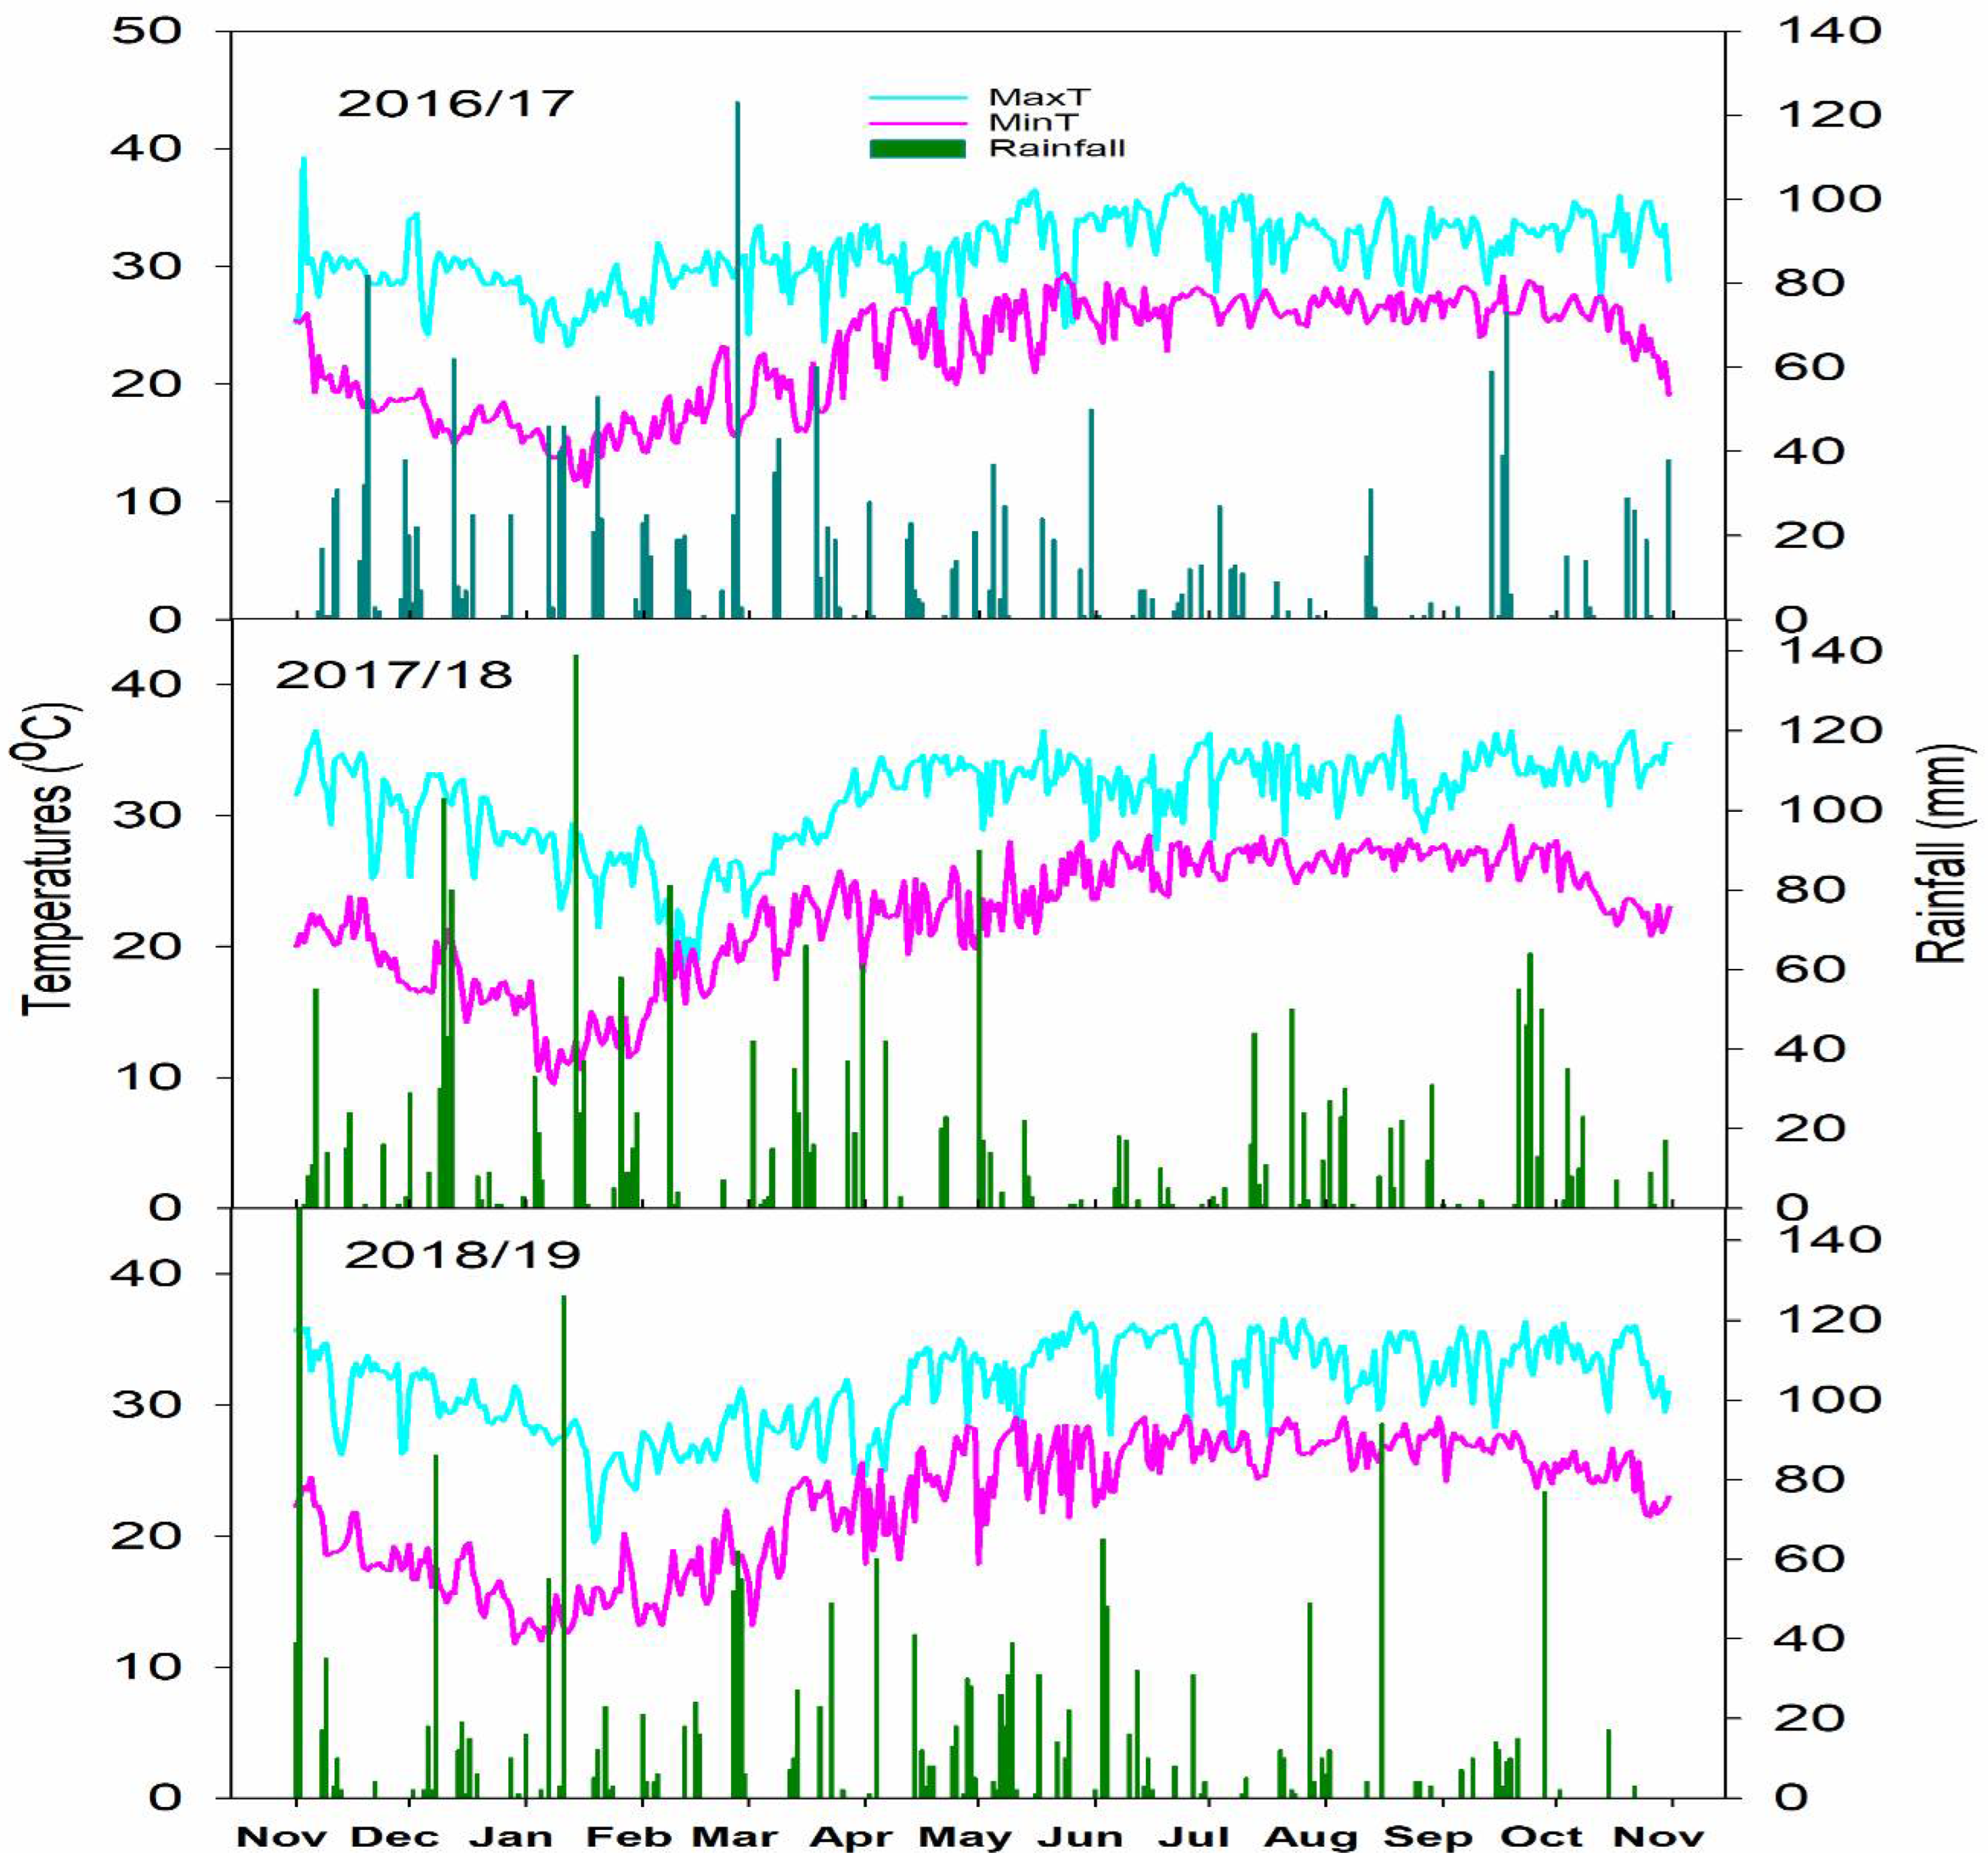
2.1. Description of the Site and Climatic Conditions

The field experiments were conducted at Bangladesh Agricultural Research Institute Central Research Farm, Gazipur, from 2016 to 2019, during three consecutive cycles of the mustard-boro rice-aman rice cropping pattern/sequence. The field study area is located in the agro-ecological zone “Madhupur Tract” (AEZ-28), which consists of relatively high land that is not subjected to flooding at any time of the year. The climate is subtropical. November to February comprises the cool period, suitable for non-rice and cool-loving crops; March to October comprises the hot period and frequent rain occurs within this period; June to July is the period with the most rainfall. The daily maximum and minimum temperatures and daily total rainfall data are presented in Figure 1.
The initial soil properties (before starting the first mustard crop), including soil texture, bulk density, pH, soil organic matter, total N, exchangeable K, and available P, S, Zn, and B concentrations at 0–15 cm soil depths are presented in Table 1.

2.2. Treatments and Design

The trial was designed using two tillage practices (land preparation), conventional tillage (CT) and strip-tillage (ST), assigned to the main plot, and three different doses of N fertilizer, N1: 75% of recommended N-fertilizer dose (RND), N2: 100% of RND, and N3: 125% of RND, assigned to the sub-plot. Recommendations of fertilizers were based on the Bangladesh Rice Research Institute for rice and Bangladesh Agricultural Research Institute for mustard. Table 2 lists the treatments in further detail. The experimental design was a split-plot with three replications, and the unit plot size was 7.2 m × 3.5 m.

2.3. Crop Management

2.3.1. Mustard

To control existing standing weeds, a pre-planting non-selective herbicide Glyphosate (Roundup 3.75 L ha−1) was applied to the entire experimental field just three days prior to land preparation for each crop for ST, and the land was prepared without the application of pre-plant herbicide for CT. BARI Sarisha-14 variety was used for mustard and sown on 15, 16, and 18 November 2016, 2017, and 2018, respectively. The seed rates were at the rate of 7 kg ha−1 and the row-to-row distance was 30 cm with continuous seeding. Three irrigations were given at 4, 26, and 42 DAS. Manual weeding was done twice at 12 and 24 DAS. After completion of flowering, an insecticide, Dimethion 40 EC at 0.05%, was sprayed within 46 and 55 DAS. Mustard was harvested (cut from the soil level) at the physiologically matured stage on 13, 09, and 10 February of 2017, 2018, and 2019, respectively.

2.3.2. Rice

Similar to mustard, Glyphosate (Roundup 3.75 L ha−1) was applied three days prior to field preparation for both crops for ST. For the CT, the land was prepared without the application of pre-plant herbicide. The popular rice variety BRRI dhan28 was used for boro and BRRI dhan72 was used for aman. The seeds were sown in a seedbed at the rate of 70 g m−2, and the target seed rate was 30 kg ha−1. In boro, seedlings were transplanted on 25, 24, and 27 February 2017, 2018, and 2019, respectively, maintaining 20 cm × 15 cm spacing, whereas in aman, seedlings were transplanted on 20, 23, and 21 July of 2017, 2018, and 2019, respectively, maintaining the same spacing. The seedling age ranged from 35–40 and 20–25 days for boro and aman, respectively. The boro was completely irrigated rice, and an alternate wetting and drying system was followed for the irrigation; aman was a rainfed system, but partial irrigations were required. Weeds were managed two manual weeding times for each rice crop. To manage pests and disease, carbofuran (Furadan 5 G @ 20 kg ha−1) was applied at 20–30 DAT, while chlorantraniliprole 20% + thiamethoxam 20% (Virtako @ 70 g ha−1) was applied at 45–75 DAT. Boro rice was harvested on 15, 14, and 17 June 2017, 2018, and 2019, respectively, whereas aman was harvested on 15, 19, and 17 November 2017, 2018, and 2019, respectively. Both rice crops were harvested around 30 cm above the soil level using a hand sickle when they reached full maturity.

2.4. Data Collection

2.4.1. Mustard

Ten plants from each plot during harvest were selected randomly to collect the data on plant height (cm), number of branches plant−1, number of siliqua plant−1, siliqua length (cm), and number of seeds siliqua−1. Mustard seed and straw yields were measured from an area of 3.0 m2 from each plot and finally converted to t ha−1. Thousand seed weight was measured for each treatment by counting 1000 seeds using a seed counter machine (Contador, S/N 14181000, Germany).

2.4.2. Rice

Ten hills from each plot at physiological maturity were selected randomly to measure the data on plant height (cm) and yield-contributing characters (productive tillers hill−1, filled grain panicle−1, unfilled grain panicle−1, 1000-grain weight). The grain yield and straw yield were measured from an area of 3.0 m2 and 1 m2, respectively, and finally converted to t ha−1. The grain yield and grain weight (1000) were adjusted to a moisture content of 14%; the straw yield was calculated on a sun-dry basis.

2.5. Soil and Nutrient Data

During the final mustard crop (2018/19), soil moisture content and soil penetration resistance were monitored simultaneously during the crop growing season. A hand penetrometer was used to test the cone penetration resistance (PR) (Eijkelkamp Equipment, Model 06.01, Giesbeek, The Netherlands). The soil water content (SWC) was determined using an MPM–160 Moisture Probe Meter (ICT International Pty Ltd, Armidale, New South Wales, Australia) [15]. The PR was measured at the same time, and PR was expressed in Mega Pascals (MPa) [16]. After harvesting the final crop, the soil samples from all treatment plots were taken at depths of 0–15 cm. For soil bulk density (BD) determination, the core method was used [17]. Soil organic carbon (SOC) was determined using the wet oxidation method by Jackson [18], and a van Bemmelen factor of 1.73 was used to calculate the SOM [19]. For total N determined, the micro-Kjeldahl method by Bremner and Mulvany [20] was followed. The following methods were used: for available P, the 0.5 M NaHCO3, pH 8.5 extraction by Olsen and Sommers [21]; for exchangeable K, the NH4OAc extraction method by Black [22]; for available S, the CaCl2 extraction method by Fox et al. [23]; for available Zn, the DTPA extraction method by Lindsay and Norvell [24]; and for available B, the mono-calcium bi-phosphate [Ca (H2PO4)2] extraction method was used.

2.6. Systems Rice Equivalent Yield (SREY) Calculation

In the cropping systems, the rice equivalent yield (REY) of component crops (mustard) was computed by using the following formula [25]:
R E Y = R i c e   y i e l d   ( t / h a ) +   M u s t a r d   y i e l d   ( t / h a ) × M a r k e t   p r i c e   o f   m u s t a r d ( B D T / h a ) M a r k e t   p r i c e   o f   r i c e ( B D T / h a )
The SREY was calculated by the sum of the yield (rice grain yield and for mustard REY) of all three crops in a sequence in a cropping year.

2.7. Economic Analysis

All production-related costs (inputs), such as seed, seedling raising, strip-till planter and power–tiller hires, fertilizers, herbicides, insecticides, irrigation, and labor (for land preparation, planting, weeding, intercultural operations, harvest, and post-harvest operations) were considered in the total variable costs. The land rental charge was also considered a fixed production cost. The total production cost was calculated as the sum of the total variable costs (inputs) plus the total fixed costs. The gross return was calculated by adding the market values of each crop’s products and by-products per hectare. The systems’ total production cost and systems’ gross return was the sum of the total production cost and the sum of the total incomes of all three crops in a sequence in a cropping year. The production costs and gross return are used to compute the net profit and benefit–cost ratio (BCR). The BCR was computed by dividing the gross return by the total production cost, while the net profit was determined by subtracting the total production cost from the gross return [26]. All costs and prices were converted to US dollars at the rate in effect on 10 September 2021.

2.8. Statistical Analysis

The data (crop, soil, and economics) were homogeneity-tested prior to analysis of variance (ANOVA). The homogeneity of the outputs was satisfied for running further ANOVA. Thus, the combined ANOVA for all data (crop-wise) of the three seasons was performed using the software program JMP 13 (SAS Institute, San Francisco, CA, USA). The means were separated using Tukey’s Honestly Significant Difference (HSD) values only when the F-test found significant (p < 0.05) differences among the treatments.

3. Results

3.1. Rice Performance
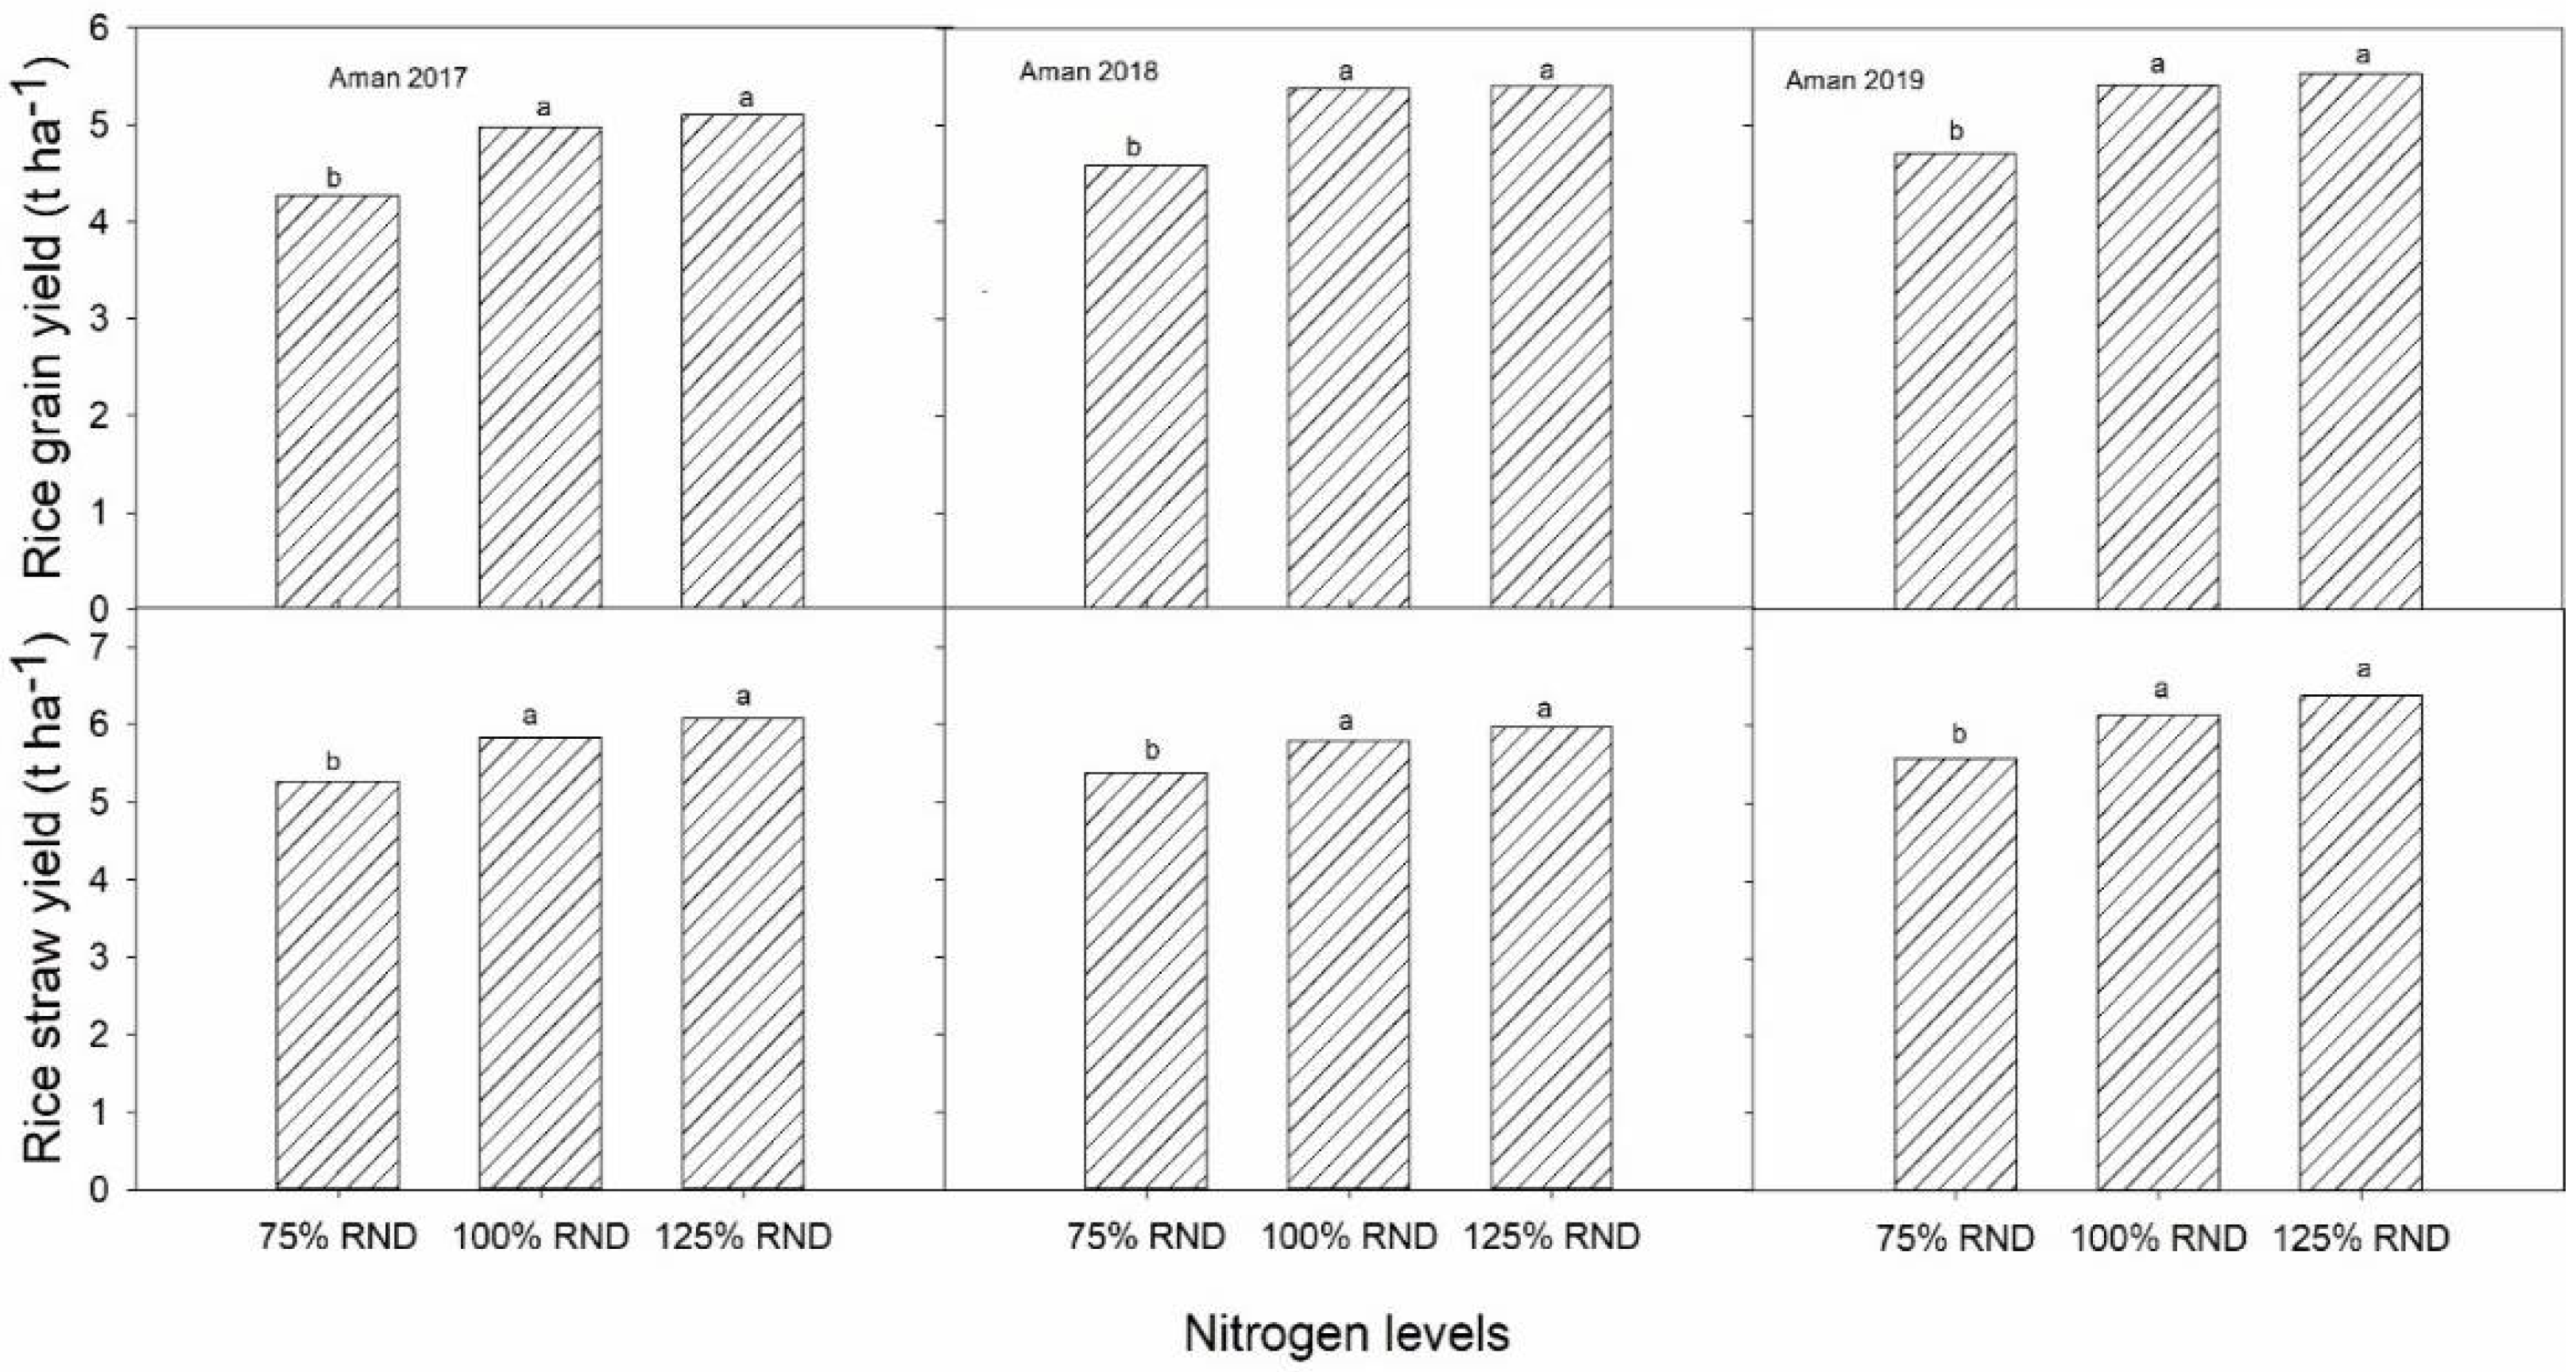
3.1.1. Aman

None of the growth parameters, yield contributing components, and yields of monsoon rice were affected by the effect of tillage systems as well as the interactions between the tillage systems and N levels; however, they were affected by the N levels (Table 3).
In monsoon rice (aman), plant height (cm), panicle length (cm), filled grain panicle−1, and 1000-grain weight were similar for the years studied; however, effective tiller hill−1, unfilled grain panicle−1, and grain and straw yield were different for the years studied (Table 3 and Table 4 and Figure 2). The plant height increased with the increase in N level up to 125% RND (Table 4). Across tillage systems, in 2018, the productive tiller hill−1 increased significantly with the increase in N levels from 75% RND to 125% RND; however, in 2017 and 2019, the results were similar for the 100% RND and 125% RND, and 75% RND and 100% RND, respectively (Table 4). Panicle length and filled grain panicle−1 were similar for the N levels 100% RND and 125% RND but significantly higher than the 75% RND. Unfilled grain panicle−1 was always higher for the N level at 125% RND and significantly higher than the 75% RND and 100% RND (Table 4). The 1000-grain weight was not affected by the N levels in 2017 and 2018. However, in 2019, 1000-grain weight was different among different doses of N fertilizer. The N levels 100% RND and 125% RND had similar 1000-grain weight and were significantly higher than the 75% RND. Across tillage systems, the 100% RND and 125% RND had similar grain and straw weight but were always significantly higher than the 75% RND (Figure 2).

3.1.2. Boro

Similar to monsoon rice (aman), in irrigated rice (Boro), none of the growth parameters, yield, and yield-contributing components was affected by the tillage systems as well as the interactions between the tillage systems and N levels. However, the N levels had varied yield and yield-contributing characteristics for irrigated rice (Table 3). In irrigated rice, filled grain panicle−1, unfilled grain panicle−1, and 1000-grain weight were similar for the years studied; however, plant height, effective tiller hill−1, panicle length, grain, and straw yield were different for all the studied years (Table 3 and Table 5 and Figure 3). Across tillage systems, the highest plant height was recorded from the 125% RND N level, which was similar to the N level of 100% RND in the years 2016/17 and 2017/18 but significantly higher in 2018/19. The 75% RND N level consistently had the lowest plant height (Table 5).
The effective tiller hill−1 increased significantly with the increase in N level from 75% RND to 125% RND; however, in 2017/18 and 2018/19, the results were similar for the 100% RND and 125% RND, and in 2016/17 and 2017/18, the results were similar for the N levels 75% RND and 100% RND (Table 5). The highest panicle length was recorded from the N level 125% RND, which was similar to the N level at 100% RND. In 2017/18 and 2018/19, the panicle length of N level 100% RND was significantly higher than the N level 75% RND; however, in 2016/17, the result was similar for both the levels (Table 5). The N levels 100% RND and 125% RND had similarly filled grain panicle−1 and were always significantly higher than the N level 75% RND (Table 5). Across the tillage systems, the rice grain and straw yield were similar for the N levels of 100% RND and 125% RND which were significantly higher than the N level of 75% RND, except for straw yield in 2016/17, whereas N levels 75% RND and 100% RND had similar results (Figure 3).

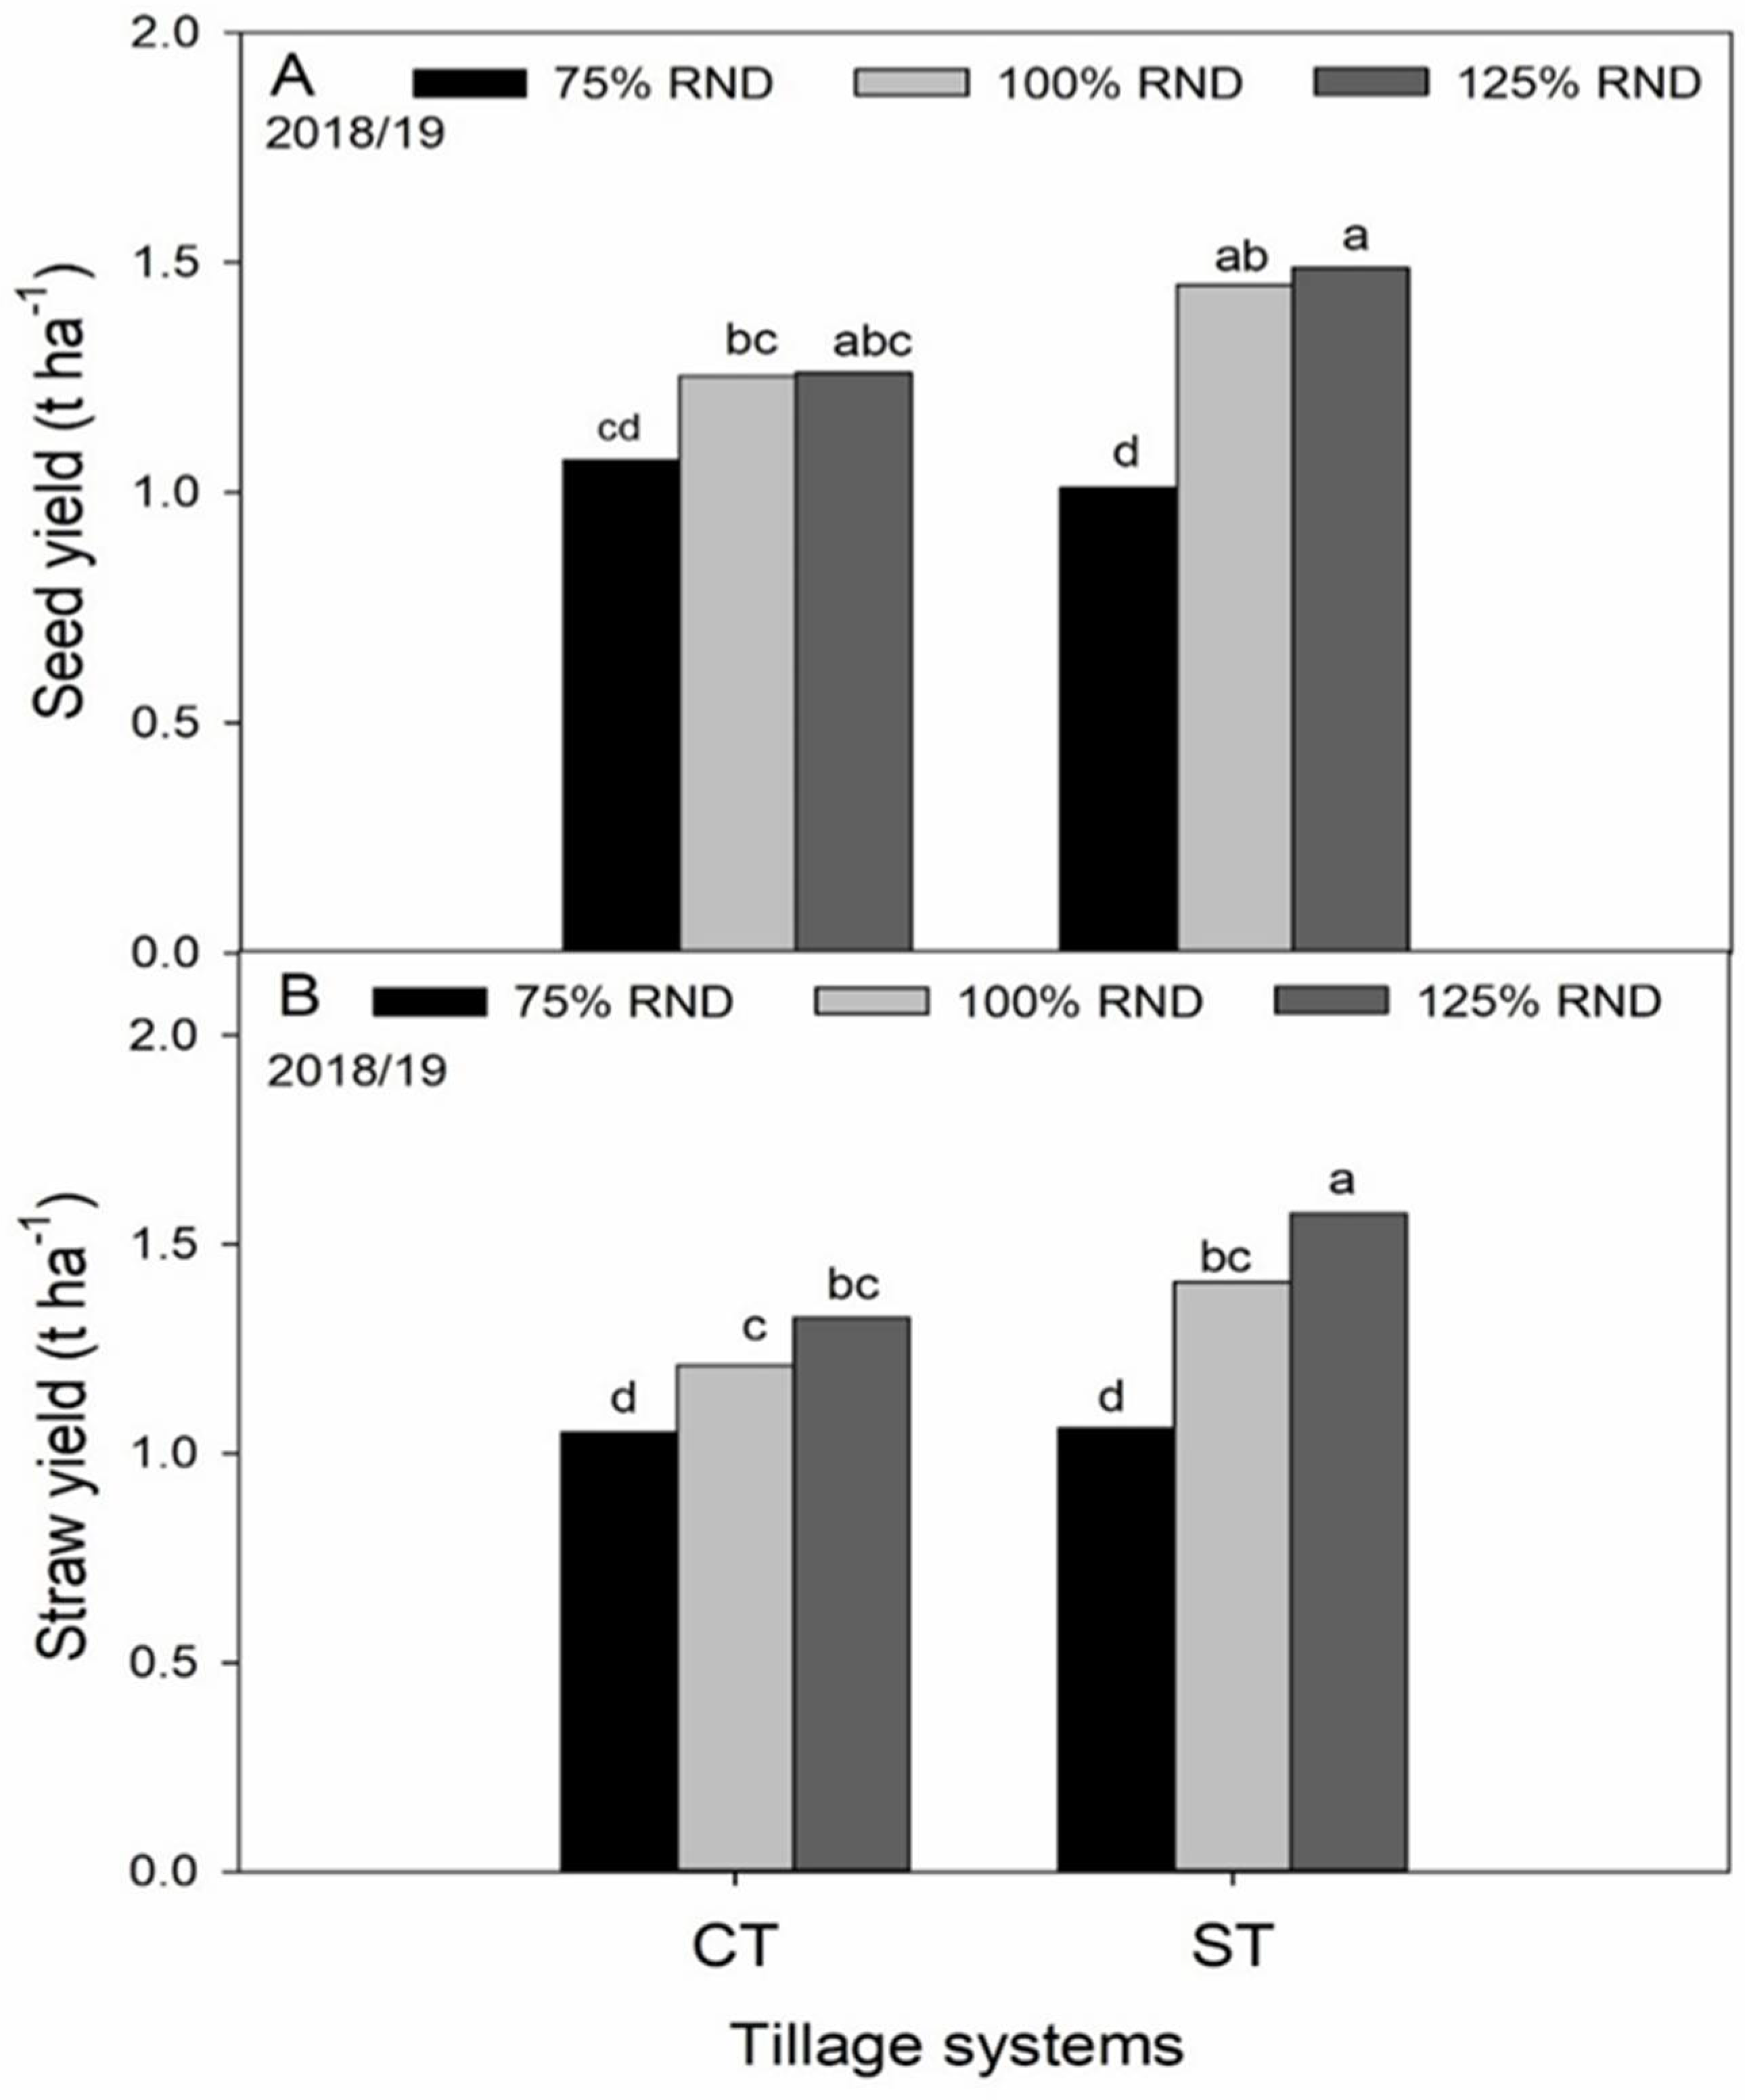
3.2. Mustard Performance

The plant height of mustard did not vary among the combined effects of tillage systems and N levels in 2016/17 and 2017/18; however, there was an interaction in 2018/19 (Table 6 and Table 7 and Figure 4A). Across N levels, in 2016/17 and 2017/18, the plant height was higher for the tillage system CT than the ST, and across tillage systems, a taller plant was recorded from the N level at 125% RND (Table 7). The plant height of 75% RND N level was similar to the N level of 100% RND but lower than the 100% RND N level. In 2018/19, the highest plant height was recorded from the ST with 125% RND N level followed by ST with 100% RND N level (Figure 4A). In both tillage systems, the lowest plant height was recorded at N level 75% RND.
Similar to the plant height, in 2018/19, there was an interaction between the tillage systems and N levels on branch plant−1, siliqua plant−1, and seed siliqua−1; however, the combined effects of different tillages and N levels on yield-contributing characteristics did not vary in 2016/17 and 2017/18 seasons. Across N levels, in 2016/17, the branch plant−1 of mustard was not affected by the tillage systems; however, in 2017/18, the tillage system ST had a higher branch plant−1. Across tillage systems, the N levels 100% RND and 125% RND had similar but significantly higher branch plant−1 than the N level 75% RND (Table 7). In 2018/19, the highest branch plant−1 was recorded from the ST with 125% RND N level, which was at par with the same tillage system with 100% RND and CT with 125% RND N level (Figure 4B). In 2016/17 and 2017/18, the siliqua plant−1 and seed siliqua−1 had a similar trend to the branches/plant; however, in 2018/19, the highest siliqua plant−1 were recorded from the tillage system ST with 125% RND N level, followed by same tillage system with 100% RND N level (Figure 4C). The higher and similar seed siliqua−1 was recorded from the treatment combinations of ST with 125% RND and 100% RND N levels (Figure 4D).
The root weight of mustard was not affected by the interactions of tillage systems and N levels; however, their individual effect was significant (Table 6 and Table 7). Across N levels, the ST had a higher root weight than the CT for all three seasons (Table 7). Across tillage systems, the highest root weight was recorded from the N level of 125% RND, which was similar to the N level of 100% RND but always significantly higher than the 75% RND (Table 7). The seed and straw yield of mustard differed among the years (Table 6). In the 2016/17 season, seed and straw yield was not affected by the tillage systems but was affected by the N levels (Figure 5). Across tillage systems, N levels 125% RND and 100% RND had similar seed and straw yield and were significantly higher than the N level 75% RND. In the 2017/18 season, both seed and straw yield was affected by the tillage systems and N levels, but their interactions were not significant (Figure 5).
Across N levels, the tillage system ST had a higher seed and straw yield than the CT. Across tillage systems, the highest seed yield was recorded from the N level 125% RND, which was at par with the N level 100% RND but significantly higher than the N level 75% RND. The straw yield significantly increased with the increase of the N level. In 2018/19, both the seed and straw yield of mustard were affected by the interactions of tillage systems and N levels (Figure 6A). The highest seed yield was recorded from the tillage system ST with 125% RND N level, which was at par with the tillage system ST with 100% RND and CT with 125% RND N levels. The lowest seed yield was recorded from the tillage system ST with an N level of 75%. The highest straw yield was recorded from the tillage system ST with N level 125% RND followed by ST with 100% RND and CT with N levels of 125% RND (Figure 6B). The lowest straw yield was recorded from the lowest N level of 75% RND in both tillage systems.

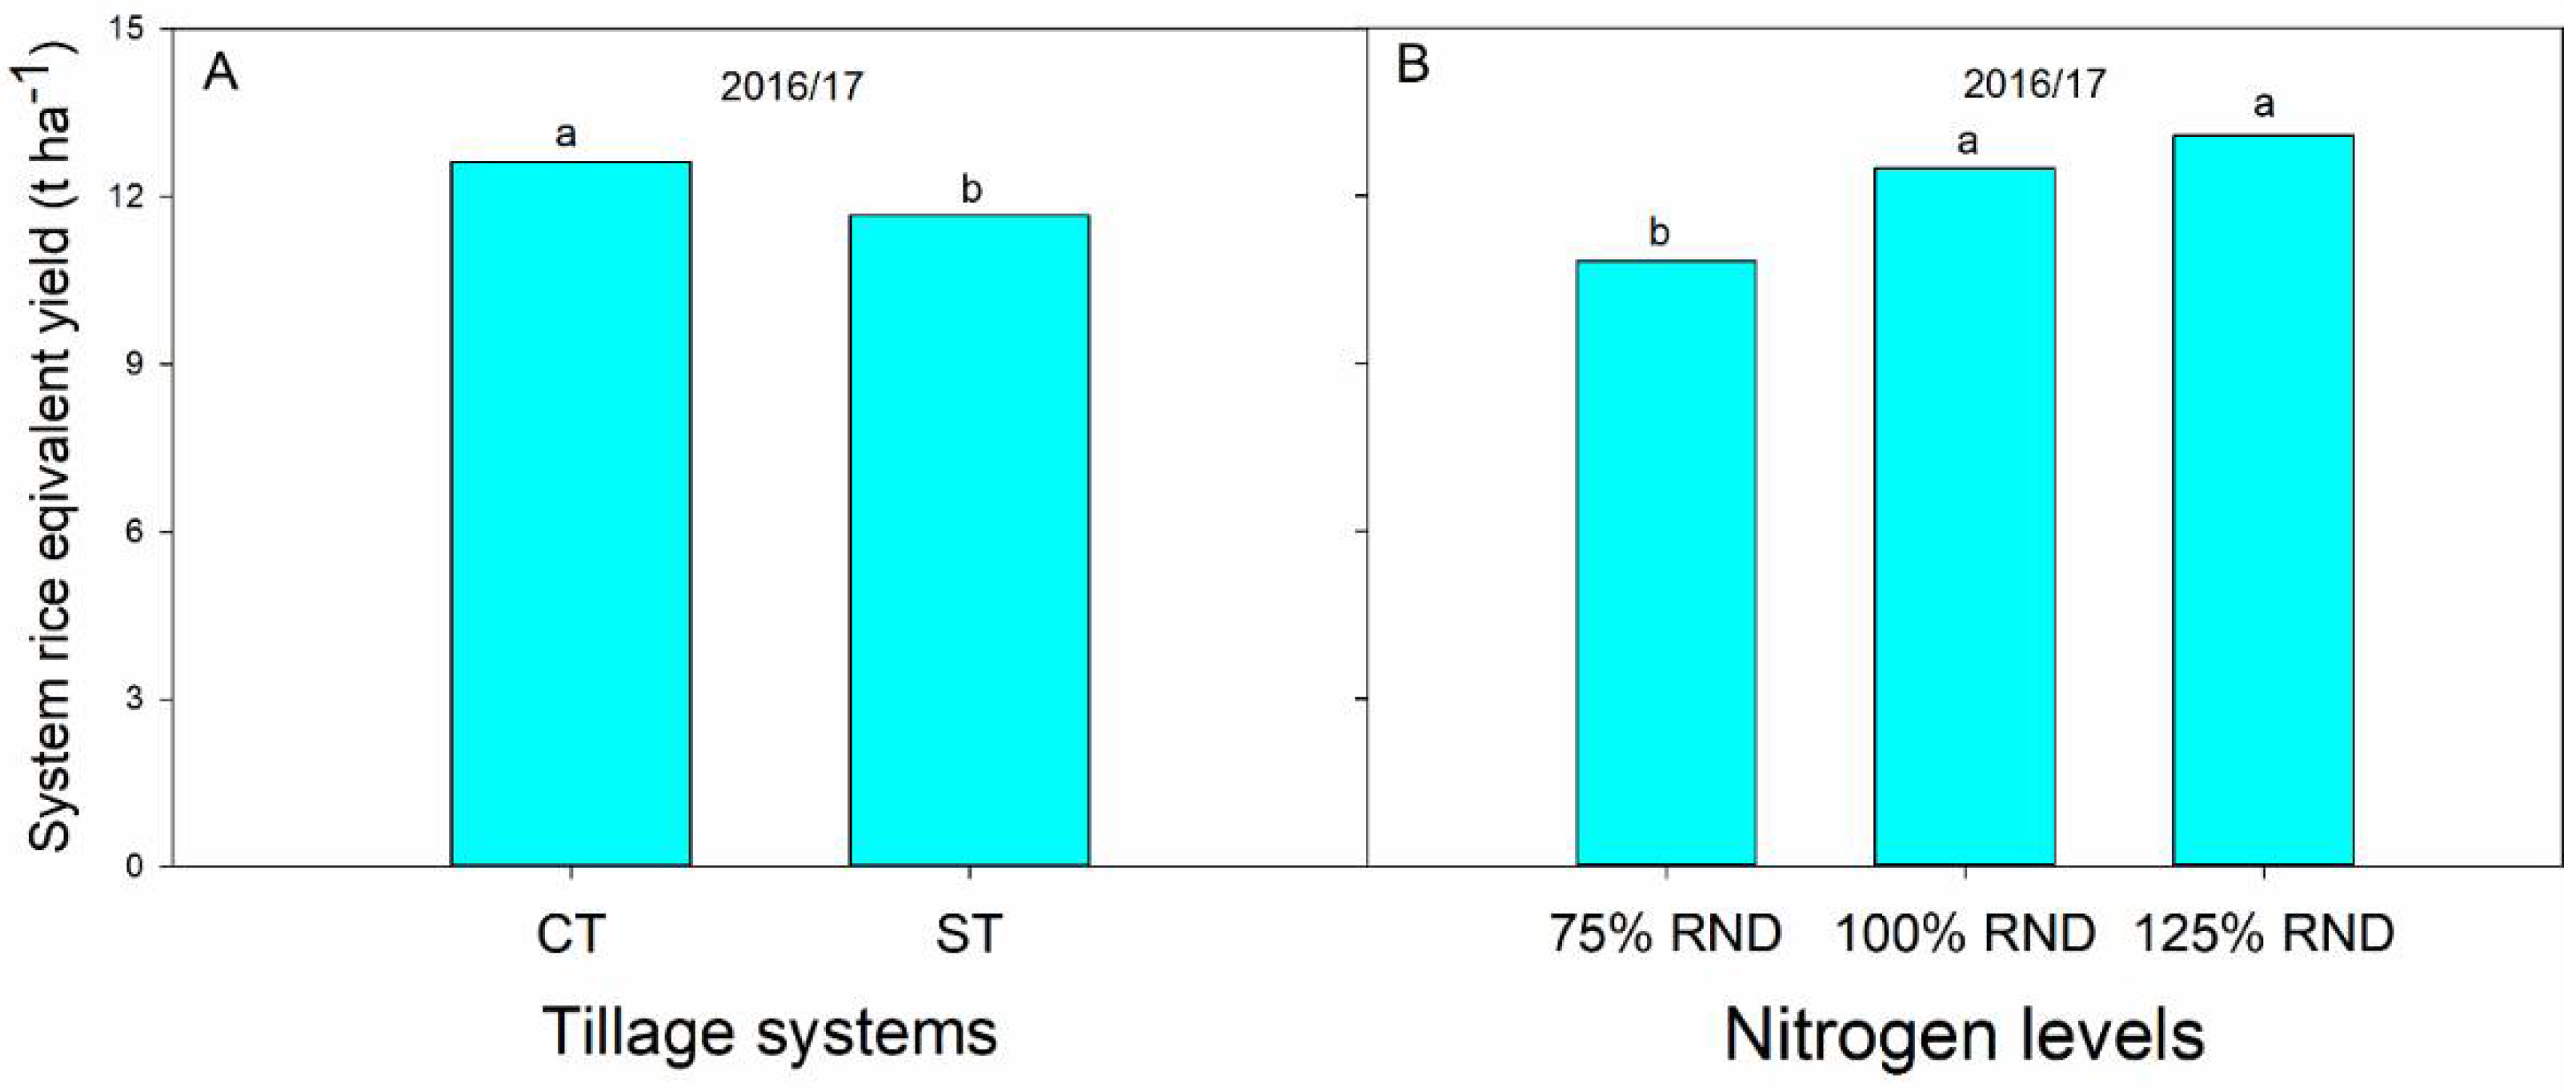
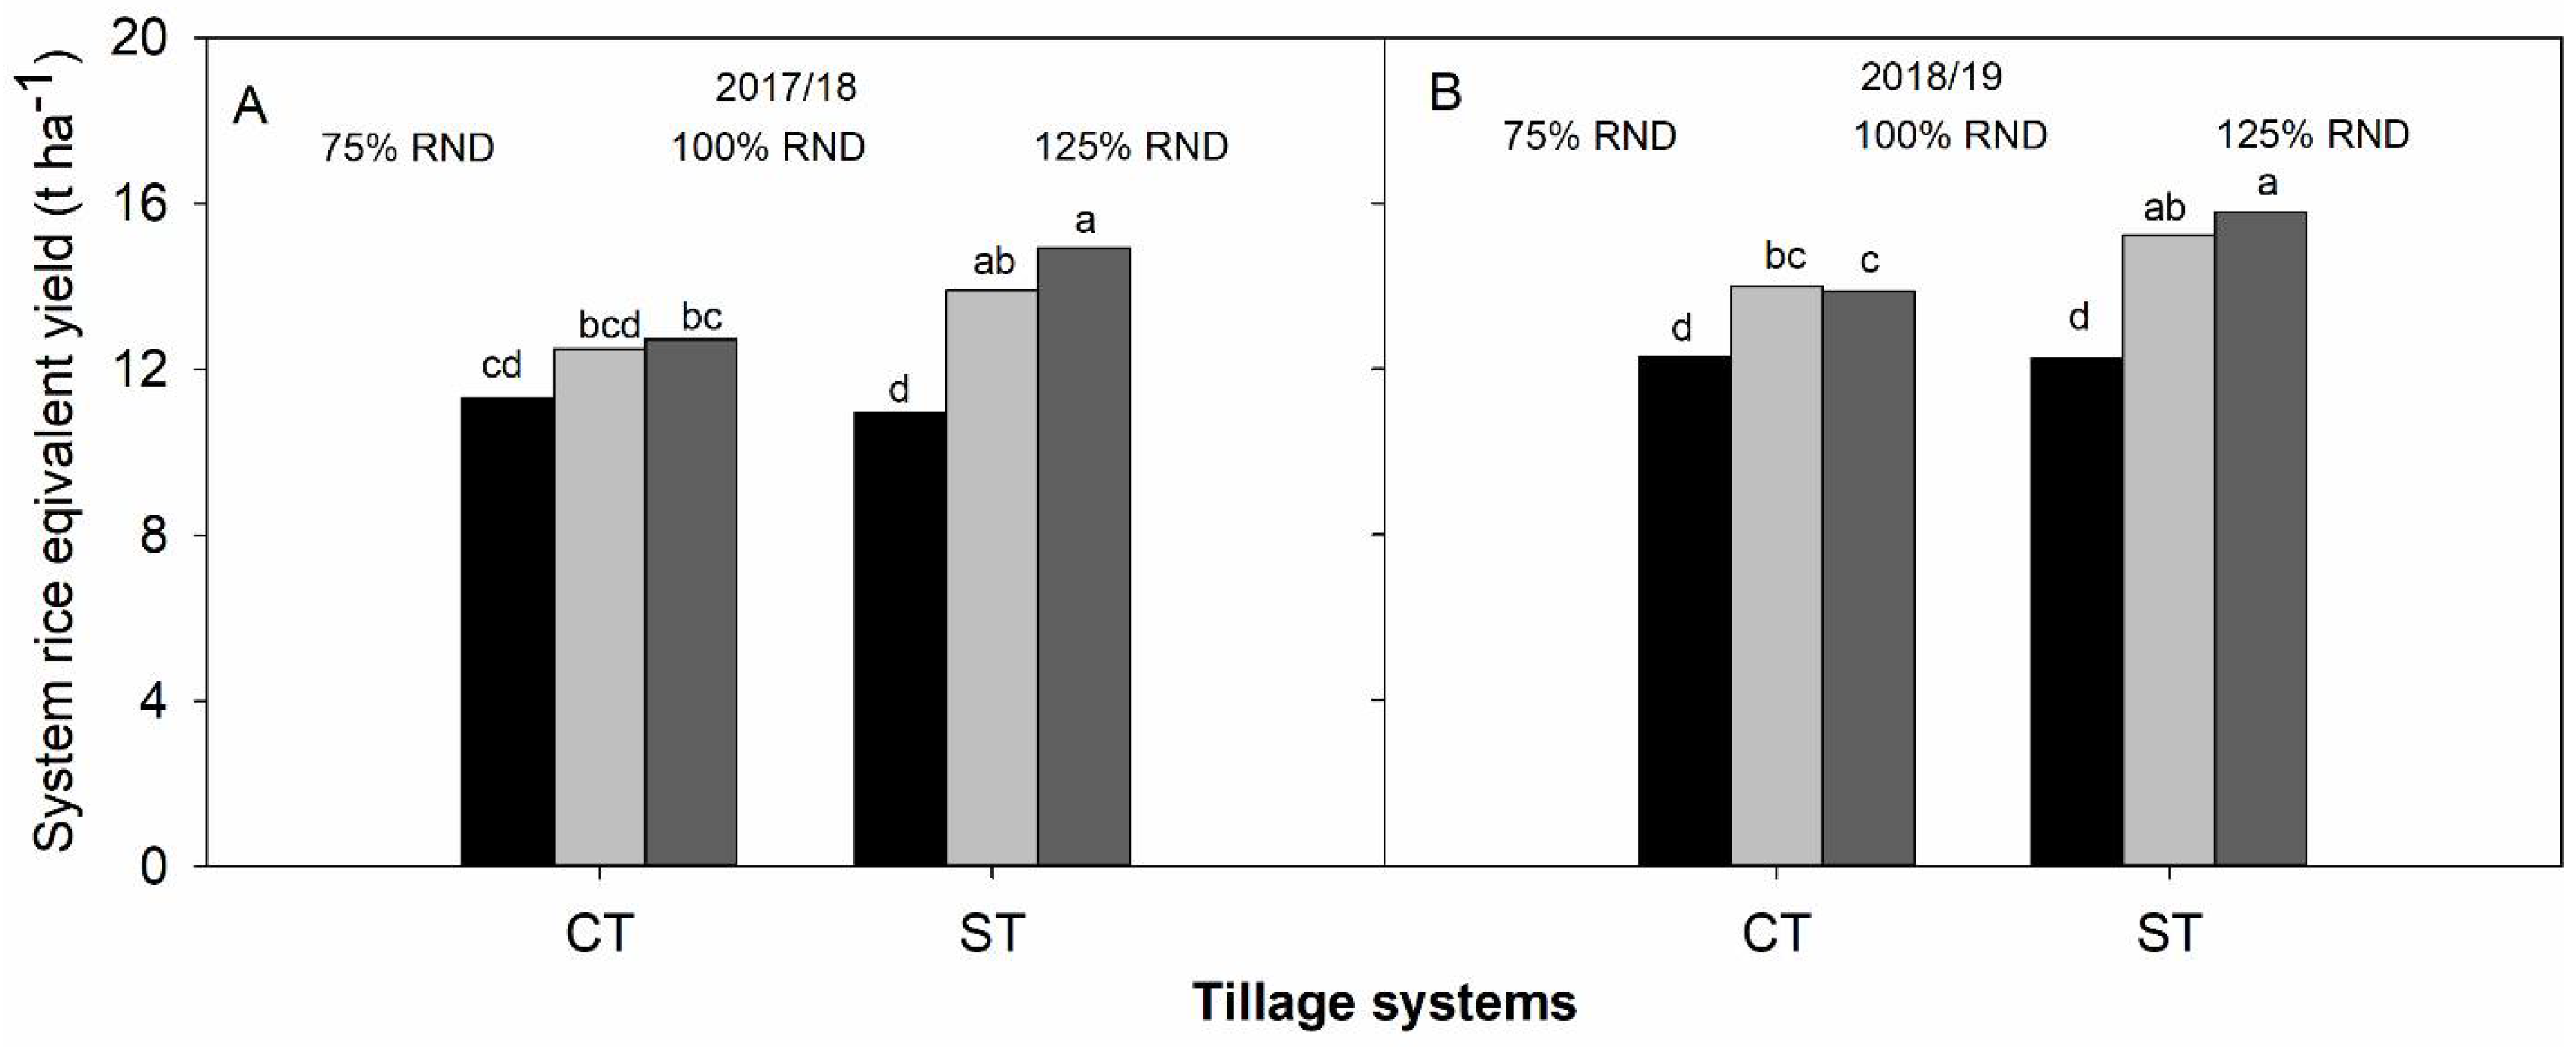
3.3. System Rice Equivalent Yield (SREY)

SREY differed among the years, and in the 2016/17 season, there was no interaction between tillage systems and N levels on SREY, but the individual effect was significant (Table 6 and Figure 7). Across N levels, the tillage system CT had higher (8%) SREY than the tillage system ST (Figure 7A). Across tillage systems, N levels 125% RND and 100% RND had similar but significantly higher (13–17%) SREY than the 75% RND (Figure 7B).
In the 2017/18 and 2018/19 seasons, there was an interaction between tillage systems and N levels on SREY (Figure 8). In both cropping seasons, the highest SREY (14.9 to 15.8 t ha−1) was recorded from the tillage system ST with N level 125% RND, which was at par with the same tillage system with N level 100% RND. Across N levels, the tillage system ST had 7–9% higher SREY than the CT in cropping seasons 2017/18 and 2018/19.

3.4. Soil Physical and Chemical Properties and Soil Nutrient Parameters

During the third mustard crop and after the completion of the third year’s last crop, the soil physical and chemical properties and nutrient parameters of soil (except Zn) were varied by tillage systems but not N levels or the interactions of tillage systems and N levels (Table 8 and Table 9).
The soil penetration after harvest was always higher for conventional tillage systems than ST (Table 8). Similar to the soil penetration, the bulk density (BD) was also higher for the CT than ST, but organic matter (OM), total nitrogen (TN), phosphorus (P), potassium (K), and boron (B) content were higher for the tillage system ST than the CT (Table 7). Soil OM was increased by 14.8% in ST relative to CT, while N concentration increase in soil under ST was also recorded compared to CT (14.9%). After the three cropping patterns, P, K, S, and B also had increased concentrations in soils under ST practices, which were 33.8, 72.7, 17.2, and 29.4 % higher than the concentrations recorded in CT practice, respectively (Table 9).

3.5. Economics

Total production cost, gross return, and net profit varied over the years. The production cost was not affected by the interactions of tillage systems and N levels; however, their individual effect was significant (Table 10). Across N levels, the tillage system CT had a 2–4% higher production cost than the ST. Across tillage systems, total production cost increased with the increase in N levels.
There was an interaction between the tillage systems and N levels on gross return and net profit (Table 11). In the first cropping season, the system total gross return and net profit were highest for the treatment combinations of tillage system CT with N level 125% RND, which was at par with the same tillage system with 100% RND and tillage system ST with 125% RND. On the other hand, in the second and the third cropping seasons, the highest gross return and net profit were recorded from the tillage system ST with N level 125% RND, which was at par with the same tillage system with 100% RND (Table 11). The lowest gross return and net profit were recorded from the N level 75% RND in both tillage systems.

4. Discussion

4.1. Crop Performance across Tillage Systems

The growth, yield, and yield-contributing parameters of rice and mustard were varied due to different N levels. The 125% recommended N level had statistically identical SREY to the 100% RND N level but significantly (13–17%) higher SREY than recorded in N level 75% RND. The results revealed that for obtaining the present yield of rice and mustard, the N level RND is adequate, but farmers can use the N level of 125% RND when they expect a high yield goal. In the initial year of CA adoption, the N level of 125% RND can be used for crop production while not sacrificing the yield of crops, as evidenced by the results of Pittelkow et al. [27] and Lundy et al. [28]. Nitrogen management is crucial in conservation tillage under intensive cropping systems [29,30]. The CA in the initial year can perform well if the N rate and management are adjusted, as reported by Lundy et al. [28]. Sah et al. [31]) showed that zero tillage (ZT) with residue retention increases soil organic matter and total N in soil and therefore induces major changes in N management. They also mentioned that ZT may outperform the other tillage methods in terms of yield if N management is optimized.
Over the years, with the progress of growing crops in CA, from the second years (in the 2017/18 and 2018/19 seasons), the effect of the combination of strip tillage (ST)/non-puddling (NP) and N levels on SREY was varied. In both cropping seasons, the highest SREY (14.9 to 15.8 t ha−1) was recorded from the tillage system ST with a 125% recommended N level, which was statistically similar to ST/NP with an N level of 100% RND. This indicates that from the second year, ST/NP tillage systems don’t require extra fertilizers for higher yield performance of crops in the intensive cropping system, or 25% extra fertilizer application under both the tillage systems was less effective on yield and SREY as compared to N level 100% RND. After five years of CA implementation, even the ST for highland crops and non-puddling rice crops require less nitrogen fertilizer [5].
In conservation tillage and residue retention (CA), an optimum N-containing fertilizer rate is a suggested management approach for limiting crop yield reduction [27,28,32,33]. Increased N fertilizer rates are critical for cropping in CA in the tropics. Lundy et al. [28] found that low N fertilization reduced crop yields in the first two years of CA adoption. In the Indo-Gangetic Plains, Oyeogbe et al. [32,34] showed that optimizing the N fertilizer dose in maize and wheat increased the grain yield by 20 and 14%. Wheat grain yields increased by 14% in northwest India when precise N management was used instead of traditional fertilization [35]. Küstermann et al. [36] found that increasing the nitrogen supply from 65 to 105 kg N ha−1 in the preliminary years of maize cropping resulted in a significant improvement in yield of up to 16% using a conservation tillage system in Germany [36]. However, in the current study, the recommended dose and adjustment of the recommended N dose up to 125% resulted in yield increases of 5.5%, 7.2%, and 4.5% using conservation tillage systems in the first, second, and third years, respectively, for all three crops in rice-rice-mustard cropping systems.

4.2. Crop Performance across N Levels

None of the growth parameters, yield-contributing characters, and yields of irrigated rice and monsoon rice in the current study were varied due to different tillage systems. The results of this study were in agreement with the previous study by Bell et al. [4], who found modification of tillage systems, i.e., strip tillage for upland crops and non-puddled transplanting systems for rice (ST/NP) perform equal to or better than conventional systems. Islam [9], Haque et al. [3], and Salahin [37] also found similar yield results with ST/NP compared to CT practice (deep tillage for upland crops and puddling for rice crops).
Tillage having no effect on rice yield and growth parameters was also supported by the study of Rieger et al. [38], who found no significant differences in grain yield amongst tillage approaches. On the other hand, in a global meta-analysis of more than 250 studies, Pittelkow et al. [33] concluded that ZT performed the best in rainfed conditions, where yields were recorded equal to or higher than for CT practices. Although rice performance was similar under both tillage systems, in the second and third years, mustard performed better under tillage system ST than CT. Only for the mustard crop in the cropping system was the yield performance under ST significantly higher than conventional practice.
Yadav et al. [39] reported enhanced productivity of upland crops in a rice-based system with the adoption of CA involving reduced/no tillage and judicious nutrient management in Indo-Gangetic plains. Yadav et al. [39] found that incorporating minimum soil disturbance into farmers’ practices improved soil health and increased crop output by around 30.6%. The increase in production under CA with improved nutrient dose can be attributed to localized nutrient management and soil fertility development over time [40].

4.3. Economic Performance

In the initial years of CA adoption, total gross return and net profit for growing crops in the cropping system were higher for CT with 100 and 125% RND levels, which was statistically similar to N level 125% RND in ST. On the other hand, in the second and the third cropping seasons, the highest gross return and net profit were recorded from the ST/NP with N levels of 100 and 125% RND (Table 11). In the early years of CA-based cropping systems, N immobilization is a major setback in resource use efficiency and sustainability. In the early (first three) years of transitioning from the CT to the CA cropping system, incorporating N management strategies into the CA farming system may contribute to enhanced crop yields. Several studies on CA cropping have found a decrease in crop yields during the early years of the transition [27,28,32,41,42], which can be attributed to N immobilization by crop residue retention limiting N availability in soils for crop growth. As a result, many previous studies have advocated the need for proper N management [43,44]. Optimizing N management in CA-based cropping systems can boost crop yields while improving soil organic matter efficiency.
Better yields and lower costs for crop establishment, weed management, and human factors were responsible for the higher gross return and net profit in later years in ST/NP method. Zentner et al. [45], and Choudhary and Behera [29] found comparable results on economic return from their studies. Choudhary et al. [46] found crop residue retention under CA (ZT) practices in the areas where it has other economic values shrunk the B:C ratio significantly over the CT practices. However, a rise in N levels from 75 to 125% RND increased gross returns in the current study.

4.4. Effect of CA on Soil Performance

After 3 years of study, the NP/ST with crop residue retention sequestered more C and N in soils under the mustard-rice-rice cropping system. Crop residue return as cover, low soil disturbance for crop establishment, and growing crops in rotation can all be attributed to the increase in SOC and total N. The ST for upland crops and the NP for rice both improve soil N levels by modifying N cycling, lowering the amount of N available to plants when crop demand is low and coordinating crop demand and N release. Alam et al. [5,40] found a 9–62% rise in C and N in NP/ST, as well as strong residue retention compared to bed planting and low crop residue retention in CT. Under CA practices, improvements in soil physical and other chemical parameters (e.g., reduced BD and increased P, K, S, and B content in soils) can be linked to C accumulation. After five years of CA practices, the BD of the soils is reduced by 0.12 g cm3 according to Alam et al. [5,40], while Islam [9] found an increase in N, P, K, and S content in the Eastern Gangetic Plain (Bangladesh section) compared to the CT with minimal residue retention treatment.
The yield advantage and gradual good performance of crops in the rice-based cropping systems may be associated with improved soil properties, which were recorded after three years in the present study. Soil OM was increased by 14.8%, N by 15% in ST relative to CT, and P, K, S and B had increased concentration in soils. Islam [9] also recorded similar results and recorded higher lentil and rice yields in rice-based triple cropping systems, which he associated with soil property improvement by degrees due to following CA practices. Alam et al. [47] also followed ZT for upland crops and no-tillage for rice and recorded the gradual increase in yield over the five years of experimentation. The incremental yield performances of rice and upland crops in Alam et al. [47] were attributed to consistent soil property improvement over the five years.

5. Conclusions

In rice-based intensive crop production, sustainable agricultural development attempts to find the right balance between grain yield and environmental impact. To reduce N fertilizer-derived environmental concerns while boosting crop output, sound agronomic and ecologically acceptable management approaches are urgently needed. The non-puddled transplanting of both Boro and aman rice in the current study performed similarly to the conventional puddled systems (intensive wet tillage); however, for the dry season crop (mustard), the CA-based tillage (strip tillage) outperformed the conventional systems (repeated tillage under dry condition) in terms of yield, economic return, and soil property improvement. During the initial years under CA, the crop responds to a relatively higher N dose than the conventional practices to compensate for the yield due to the higher microbial immobilization. But after three years of experimentation, the 100% RND was enough for the CA to produce an equivalent yield or higher yield than the conventional practice. The yield advantage of CA may be more prominent when it is practiced in the long run. The soil’s physical and chemical properties recorded in the study also demonstrated improvements due to the effect of minimum tillage and N fertilizer management. To know the actual requirement of N in CA systems, a long-term CA-based cropping system trial is required for its precision evaluation.

Author Contributions

Conceptualization, N.S. and M.K.A.; methodology, M.K.A. and N.C.S.; software, S.A.; validation, N.S., M.K.A. and A.T.M.A.I.M.; formal analysis, S.A.; investigation, N.S., M.K.A. and M.J.A.; resources, M.K.A. and N.C.S.; data curation, N.S. and S.A.; writing—original draft preparation, N.S., M.K.A. and S.A.; writing—review and editing, N.S., M.K.A., M.I.K., A.G. and S.A.; visualization, A.G.; supervision, A.G. and M.K.A.; project administration, M.I.K., M.K.A. and N.C.S.; funding acquisition, A.G. and S.A. All authors have read and agreed to the published version of the manuscript.

Funding

This research was funded by Bangladesh Agricultural Research Institute from its annual research budget and also supported by the Taif University Researchers Supporting Project number (TURSP-2020/39), Taif University, Taif, Saudi Arabia.

Institutional Review Board Statement

Not applicable.

Informed Consent Statement

Not applicable.

Data Availability Statement

Not applicable.

Acknowledgments

The authors acknowledge the support of the Bangladesh Agricultural Research Institute for providing the financial support and allocated research field to conduct this study. Also, the authors extend their gratitude to Taif University Researchers Supporting Project number (TURSP-2020/39), Taif University, Taif, Saudi Arabia.

Conflicts of Interest

The authors declare no conflict of interest.

References

  1. Kassam, A.; Friedrich, T.; Shaxson, F.; Pretty, J. The spread of Conservation Agriculture: Justification, sustainability and uptake. Int. J. Agric. Sustain. 2009, 7, 292–320. [Google Scholar] [CrossRef]
  2. Hobbs, P.R.; Sayre, K.; Gupta, R. The role of conservation agriculture in sustainable agriculture. Philos. Trans. R. Soc. London B Biol. Sci. 2008, 363, 543–555. [Google Scholar] [CrossRef]
  3. Haque, M.; Bell, R.; Islam, M.; Rahman, M. Minimum tillage unpuddled transplanting: An alternative crop establishment strategy for rice in conservation agriculture cropping systems. Field Crop. Res. 2015, 185, 31–39. [Google Scholar] [CrossRef]
  4. Bell, R.W.; Haque, E.; Jahiruddin, M.; Rahman, M.; Begum, M.; Miah, M.A.M.; Islam, A.; Hossen, A.; Salahin, N.; Zahan, T.; et al. Conservation Agriculture for Rice-Based Intensive Cropping by Smallholders in the Eastern Gangetic Plain. Agriculture 2018, 9, 5. [Google Scholar] [CrossRef] [Green Version]
  5. Alam, K.; Bell, R.W.; Hasanuzzaman, M.; Salahin, N.; Rashid, M.; Akter, N.; Akhter, S.; Islam, M.S.; Islam, S.; Naznin, S.; et al. Rice (Oryza sativa L.) Establishment Techniques and Their Implications for Soil Properties, Global Warming Potential Mitigation and Crop Yields. Agronomy 2020, 10, 888. [Google Scholar] [CrossRef]
  6. Ahmmed, S.; Jahiruddin, M.; Razia, S.; Begum, R.A.; Biswas, J.C.; Rahman, A.S.M.M.; Satter, M.A. Fertilizer Recommendation Guide-2018. Bangladesh Agric. Res. Counc. Farmgate Dhaka-P 2018, 1215, 223. [Google Scholar]
  7. Jahiruddin, M.; Islam, M.R.; Miah, M.A.M. Constraints of Farmer’s Access to Fertilizer for Food Production; Final Report; FAO: Mymensingh, Bangladesh, 2009. [Google Scholar]
  8. Salahin, N.; Jahiruddin, M.; Islam, M.; Alam, K.; Haque, M.; Ahmed, S.; Baazeem, A.; Hadifa, A.; EL Sabagh, A.; Bell, R. Establishment of Crops under Minimal Soil Disturbance and Crop Residue Retention in Rice-Based Cropping System: Yield Advantage, Soil Health Improvement, and Economic Benefit. Land 2021, 10, 581. [Google Scholar] [CrossRef]
  9. Islam, M.A. Conservation Agriculture: Its Effects on Crop and Soil in Rice-Based Cropping Systems in Bangladesh. Ph.D. Thesis, Murdoch University, Perth, Australia, 2016; p. 317. [Google Scholar]
  10. Alam, M.K. Assessment of Soil Carbon Sequestration and Climate Change Mitigation Potential under Conservation Agriculture Practices in the Eastern Gangetic Plains. Ph.D. Thesis, Murdoch University, Perth, Australia, 2018; p. 335. [Google Scholar]
  11. Thuy, N.H.; Shan, Y.; Singh, B.; Wang, K.; Cai, Z.; Singh, Y.; Buresh, R.J. Nitrogen Supply in Rice-Based Cropping Systems as Affected by Crop Residue Management. Soil Sci. Soc. Am. J. 2008, 72, 514–523. [Google Scholar] [CrossRef]
  12. Pan, S.-G.; Huang, S.-Q.; Zhai, J.; Wang, J.-P.; Cao, C.-G.; Cai, M.-L.; Zhan, M.; Tang, X.-R. Effects of N Management on Yield and N Uptake of Rice in Central China. J. Integr. Agric. 2012, 11, 1993–2000. [Google Scholar] [CrossRef]
  13. Jahiruddin, M.; Islam, M.R.; Haque, M.A.; Haque, E.; Bell, R.W. Crop response to nitrogen fertilizer under strip tillage and two residue retention levels in a rice-wheat-mungbean sequence. In Conservation Agriculture in Rice-Based Cropping Systems: Its Effect on Crop Performance. Proceedings of the 6th World Congress of Conservation Agriculture, Winnipeg, Canada, 21–25 June 2014; Conservation Technology Information Centre: Winnipeg, Canada, 2014; pp. 23–24. [Google Scholar]
  14. Sutapa, K. Nitrogen Requirement for T. Aman Rice under Strip Tillage System at Two Residue Retention Levels. Master’s Thesis, Department of Soil Science, Bangladesh Agricultural University, Mymensingh, Bangladesh, 2014. [Google Scholar]
  15. Altikat, S.; Celik, A. The effects of tillage and intra-row compaction on seedbed properties and red lentil emergence under dry land conditions. Soil Tillage Res. 2011, 114, 1–8. [Google Scholar] [CrossRef]
  16. Lampurlanés, J.; Cantero-Martínez, C. Soil bulk density and penetration resistance under different tillage and crop management systems and their relationship with barley root growth. Agron. J. 2003, 95, 526–536. [Google Scholar] [CrossRef]
  17. Karim, Z.; Rahman, S.M.; Idris, M.; Karim, A.J.M.S. Soil bulk density: A manual for determination of soil physical parameters. In Soils and Irrigation Division; Bangladesh Agricultural Research Council (BARC): Dhaka, Bangladesh, 1988. [Google Scholar]
  18. Jackson, M.L. Soil Chemical Analysis; Prentice Hall of India Pvt. Ltd.: New Delhi, India, 1973; pp. 38–56. [Google Scholar]
  19. Piper, C.S. Soil and Plant Analysis; Adelaide University: Adelaide, Australia, 1950. [Google Scholar]
  20. Bremner, J.M.; Mulvaney, C.S. Total nitrogen. In Methods of Soil Analysis, Part-2, 2nd ed.; Page, A.L., Miller, R.H., Keeney, D.R., Eds.; American Society of Agronomy: Madison, WI, USA, 1982; pp. 599–622. [Google Scholar]
  21. Olsen, S.R.; Sommers, L.E. Phosphorus. In Methods of Soil Analysis, Part-2, 2nd ed.; Page, A.L., Miller, R.H., Keeney, D.R., Eds.; American Society of Agronomy: Madison, WI, USA, 1982; pp. 403–427. [Google Scholar]
  22. Black, C.A. Method of Soil Analysis (Part-I and II); American Society of Agronomy Inc.: Madison, WI, USA, 1965. [Google Scholar]
  23. Fox, R.L.; Olson, R.A.; Rhoades, H.F. Evaluating the Sulfur Status of Soils by Plant and Soil Tests. Soil Sci. Soc. Am. J. 1964, 28, 243–246. [Google Scholar] [CrossRef]
  24. Lindsay, W.L.; Norvell, W.A. Development of a DTPA soil test for zinc, iron, manganese, and copper. Soil Sci. Soc. Am. J. 1978, 42, 421–428. [Google Scholar] [CrossRef]
  25. Anjeneyul, V.R.; Singh, S.P.; Paul, M. Effect of competition free periods and techniques and pattern of pearl millet planting on growth and yield of mungbean inter-cropping systems. Indian J. Agron. 1982, 27, 219–226. [Google Scholar]
  26. Chowdhury, A.K.M.H.U.; Haque, M.E.; Hoque, M.Z. Farmers response towards cultivation of BRRI dhan47 in the coastal saline area. Int. J. Sustain. Agril. Tech. 2012, 8, 13–18. [Google Scholar]
  27. Pittelkow, C.M.; Liang, X.; Linquist, B.A.; van Groenigen, K.J.; Lee, J.; Lundy, M.E.; van Gestel, N.; Six, J.; Venterea, R.T.; van Kessel, C. Productivity limits and potentials of the principles of conservation agriculture. Nature 2015, 517, 365–368. [Google Scholar] [CrossRef]
  28. Lundy, M.E.; Pittelkow, C.M.; Linquist, B.A.; Liang, X.; van Groenigen, K.J.; Lee, J.; Six, J.; Venterea, R.T.; van Kessel, C. Nitrogen fertilisation reduces yield declines following no-till adoption. Field Crop Res. 2015, 183, 204–210. [Google Scholar] [CrossRef] [Green Version]
  29. Choudhary, R.L.; Behera, U.K. Effect of Conservation agriculture and nitrogen management in maize–wheat cropping system: Effect on growth, productivity and economics of wheat. Int. J. Chem. Stud. 2020, 8, 2432–2438. [Google Scholar] [CrossRef]
  30. Salahin, N.; Alam, M.; Shil, N.; Mondol, A.A.; Alam, M. Effects of tillage practices and nutrient management on crop productivity and profitability in Jute-T. aman rice- onion cropping system. Bangladesh J. Agric. Res. 2019, 44, 387–399. [Google Scholar] [CrossRef] [Green Version]
  31. Sah, G.; Shah, S.C.; Sah, S.K.; Thapa, R.B.; McDonald, A.; Sidhu, H.S.; Gupta, R.K.; Wall, P.C. Productivity and soil attributes as influenced by resource conservation technologies under rice- wheat system in Nepal. Agron. J. Nepal 2013, 3, 64–72. [Google Scholar] [CrossRef]
  32. Oyeogbe, A.I.; Das, T.K.; Bandyopadhyay, K.K. Agronomic productivity, nitrogen fertilizer savings and soil organic carbon in conservation agriculture: Efficient nitrogen and weed management in maize-wheat system. Arch. Agron. Soil Sci. 2018, 64, 1635–1645. [Google Scholar] [CrossRef]
  33. Pittelkow, C.M.; Linquist, B.A.; Lundy, M.E.; Liang, X.; van Groenigen, K.J.; Lee, J.; van Gestel, N.; Six, J.; Venterea, R.T.; van Kessel, C. When does no-till yield more? A global meta-analysis. Field Crop. Res. 2015, 183, 156–168. [Google Scholar] [CrossRef] [Green Version]
  34. Oyeogbe, A.I.; Das, T.K.; Bhatia, A.; Singh, S.B. Adaptive nitrogen and integrated weed management in conservation agriculture: Impacts on agronomic productivity, greenhouse gas emissions, and herbicide residues. Environ. Monit. Assess. 2017, 189, 247. [Google Scholar] [CrossRef]
  35. Sapkota, T.B.; Majumdar, K.; Jat, M.L.; Kumara, A.; Bishnoi, D.K.; McDonald, A.J.; Pampolino, M. Precision nutrient management in conservation agriculture based wheat production of North-west India: Profitability, nutrient use efficiency and environmental footprint. Field Crops Res. 2014, 155, 233–244. [Google Scholar] [CrossRef]
  36. Küstermann, B.; Munch, J.C.; Hülsbergen, K.J. Effects of soil tillage and fertilisation on resource efficiency and greenhouse gas emissions in a longterm field experiment in Southern Germany. Eur. J. Agron. 2013, 49, 61–73. [Google Scholar] [CrossRef]
  37. Salahin, N. Influence of Minimum Tillage and Crop Residue Retention on Soil Organic Matter, Nutrient Content and Crop Productivity in the Rice-Jute System. Ph.D. Thesis, Bangladesh Agricultural University, Mymensingh, Bangladesh, 2017; p. 246. [Google Scholar]
  38. Rieger, S.; Richner, W.; Streit, B.; Frossard, E.; Liedgens, M. Growth, yield, and yield components of winter wheat and the effects of tillage intensity, preceding crops, and N fertilisation. Eur. J. Agron. 2008, 28, 405–411. [Google Scholar] [CrossRef]
  39. Yadav, G.S.; Lal, R.; Meena, R.S.; Babu, S.; Das, A.; Bhowmik, S.N.; Datta, M.; Layak, J.; Saha, P. Conservation tillage and nutrient management effects on productivity and soil carbon sequestration under double cropping of rice in north eastern region of India. Ecol. Ind. 2019, 105, 303–315. [Google Scholar] [CrossRef]
  40. Alam, K.; Bell, R.W.; Haque, M.E.; Kader, M.A. Minimal soil disturbance and increased residue retention increase soil carbon in rice-based cropping systems on the Eastern Gangetic Plain. Soil Tillage Res. 2018, 183, 28–41. [Google Scholar] [CrossRef]
  41. Giller, K.E.; Witter, E.; Corbeels, M.; Tittonell, P. Conservation agriculture and smallholder farming in Africa: The heretics’ view. Field Crop. Res. 2009, 114, 23–34. [Google Scholar] [CrossRef]
  42. Tittonell, P.; Scopel, E.; Andrieu, N.; Posthumus, H.; Mapfumo, P.; Corbeels, M.; van Halsema, G.; Lahmar, R.; Lugandu, S.; Rakotoarisoa, J.; et al. Agroecology-based aggradation-conservation agriculture (ABACO): Targeting innovations to combat soil degradation and food insecurity in semi-arid Africa. Field Crop. Res. 2012, 132, 168–174. [Google Scholar] [CrossRef]
  43. Sommer, R.; Thierfelder, C.; Tittonell, P.; Hove, L.; Mureithi, J.; Mkomwa, S. Fertiliser use should not be the fourth principle to define conservation agriculture. Field Crops Res. 2014, 169, 145–148. [Google Scholar] [CrossRef]
  44. Vanlauwe, B.; Wendt, J.; Giller, K.E.; Corbeels, M.; Gerard, B.; Nolte, C. A fourth principle is required to define conservation agriculture in sub-Saharan Africa: The appropriate use of fertiliser to enhance crop productivity. Field Crops Res. 2014, 155, 10–13. [Google Scholar] [CrossRef]
  45. Zentner, R.; Lafond, G.; Derksen, D.; Campbell, C. Tillage method and crop diversification: Effect on economic returns and riskiness of cropping systems in a Thin Black Chernozem of the Canadian Prairies. Soil Tillage Res. 2002, 67, 9–21. [Google Scholar] [CrossRef]
  46. Choudhary, M.; Panday, S.; Meena, V.S.; Singh, S.; Yadav, R.; Pattanayak, A.; Mahanta, D.; Bisht, J.K.; Stanley, J. Long-term tillage and irrigation management practices: Strategies to enhance crop and water productivity under rice-wheat rotation of Indian mid-Himalayan Region. Agric. Water Manag. 2020, 232, 106067. [Google Scholar] [CrossRef]
  47. Alam, M.K.; Salahin, N.; Islam, S.; Begum, R.A.; Hasanuzzaman, M.; Islam, M.S.; Rahman, M.M. Patterns of change in soil organic matter, physical properties and crop productivity under tillage practices and cropping systems in Bangladesh. J. Agric. Sci. 2017, 155, 216–238. [Google Scholar] [CrossRef]
Figure 1. Daily minimum and maximum temperatures as well as rainfall at the experiment site from November 2016 to October 2017 (2016/17), November 2017 to October 2018 (2017/18), and November 2018 to October 2019 (2018/19).
Agronomy 12 01671 g001
Figure 2. Effect of N levels on rice grain and straw yield in aman. Different lowercase letters on top of the bars indicate significant differences at a 5% level of probability. 75% RND: 75% of recommended N—fertilizer dose (RND); 100% RND: 100% of recommended N—fertilizer dose; 125% RND: 125% of recommended N—fertilizer dose.
Agronomy 12 01671 g002
Figure 3. Effect of N levels on rice grain and straw yield in boro. Different lowercase letters on top of the bars indicate significant differences at a 5% level of probability. 75% RND: 75% of recommended N—fertilizer dose (RND); 100% RND: 100% of recommended N—fertilizer dose; 125% RND: 125% of recommended N—fertilizer dose.
Agronomy 12 01671 g003
Figure 4. Interactive effect of different tillage systems and nitrogen levels on (A) plant height (cm), (B) branch plant−1, (C) siliqua plant−1, and (D) seed siliqua−1 of mustard in 2018/19. Different lowercase letters on top of the bars indicate significant differences at a 5% level of probability. CT: conventional tillage; ST: strip-tillage; 75% RND: 75% of recommended N—fertilizer dose (RND); 100% RND: 100% of recommended N—fertilizer dose; 125% RND: 125% of recommended N—fertilizer dose.
Agronomy 12 01671 g004
Figure 5. Effect of N levels and tillage systems on seed and straw yield of mustard in 2016/17 and 2017/18. (A,B) represent the yield of mustard seeds and straw in 2016/17, respectively, as influenced by various N levels; (C,D) represent the yield of mustard seed and straw in 2017/18, respectively, as affected by various tillage systems; while (E,F) represent the yield of mustard seeds and straw in 2017/18, respectively, as affected by various N levels. Different lowercase letters on top of the bars indicate significant differences at a 5% level of probability. 75% RND: 75% of recommended N—fertilizer dose (RND); 100% RND: 100% of recommended N—fertilizer dose; 125% RND: 125% of recommended N—fertilizer dose. CT: conventional tillage; ST: strip tillage.
Agronomy 12 01671 g005
Figure 6. Interactive effect of N levels and tillage systems on seed (A) and straw yield (B) of mustard in 2018/19. Different lowercase letters on top of the bars indicate significant differences at a 5% level of probability. CT: conventional tillage; ST: strip-tillage; 75% RND: 75% of recommended N—fertilizer dose (RND); 100% RND: 100% of recommended N—fertilizer dose; 125% RND: 125% of recommended N—fertilizer dose.
Agronomy 12 01671 g006
Figure 7. Effect of tillage systems (A) and N levels (B) on system rice equivalent yield in 2016/17 cropping season. Different lowercase letters on top of the bars indicate significant differences at a 5% level of probability. CT: conventional tillage, ST: strip-tillage; 75% RND: 75% of recommended N—fertilizer dose (RND); 100% RND: 100% of recommended N—fertilizer dose; 125% RND: 125% of recommended N—fertilizer dose.
Agronomy 12 01671 g007
Figure 8. Interactive effect of N levels and tillage systems on system rice equivalent yield in 2017/18 (A) and 2018/19 (B) cropping seasons. Different lowercase letters on top of the bar indicate significant differences at a 5% level of probability. CT: conventional tillage; ST: strip-tillage; 75% RND: 75% of recommended N—fertilizer dose (RND); 100% RND: 100% of recommended N—fertilizer dose; 125% RND: 125% of recommended N—fertilizer dose.
Agronomy 12 01671 g008
Table 1. Initial particle size, textural class, bulk density, soil pH, soil organic matter (SOM), soil total N, exchangeable K, and available P, S, Zn and B contents found in the experimental field.
Soil Depth (cm)Soil Particle SizeTextural ClassBulk DensitypHSOMTotal NExchangeable K
(meq 100 g soil−1)
Available Other Nutrients
Sand%Silt%Clay%(g cm−3)(%)PSZnB
(mg kg−1)
0–15502525Sandy clay loam1.406.31.020.0550.128.0150.900.15
Table 2. Description of each treatment for each crop.
TreatmentsTreatment Description
Tillage practicesConventional tillage
(CT)
Mustard: Full tillage by four passes followed by three ladderings using a power tiller machine.
Rice: For both seasons of rice, the land was prepared by puddling using a power tiller machine with four wet-tillage operations followed by three ladderings.
Strip tillage (ST)Mustard: ST was accomplished in a single pass using a power tiller operated seeder (PTOS) that used rotating blades and maintained 30 cm spacing between rows.
Rice: In non-puddled fields, 18 h before rice transplanting, the strip was accomplished in one pass with PTOS rotating blades with 20 cm spacing between rows.
N doses
(kg ha−1)
N1: 75% of RNDMustard: Fertilizers such as urea, triple super phosphate, muriate of potash, gypsum, zinc sulphate, and boric acid were applied at the rate of 77-22-54-10-2-1 kg ha−1 of N-P-K-S-Zn-B, respectively. Half of the urea was applied during final land preparation with additional fertilizers, and the other half was applied at 25 days after sowing (DAS).
Boro rice: Nutrients N-P-K-S-Zn were applied at the rate of 115-13-72-12-2 kg ha−1, respectively, as a form of fertilizer urea, triple super phosphate, muriate of potash, gypsum, and zinc sulphate. Except for urea, which was applied in three equal splits at 10 days after transplanting (DAT), 30–35 DAT, and 50–55 DAT, fertilizers were applied as a basal dose.
Aman rice: Nutrients N-P-K-S-Zn were applied at the rate of 51-10-48-7-1 kg ha−1, respectively, as a form of fertilizer urea, triple super phosphate, muriate of potash, gypsum, and zinc sulphate. Except for urea, which was applied in three equal splits at 10–12, 25–30, and 40–45 DAT, fertilizers were applied as a basal dose.
N2: 100% of RNDMustard: 102 kg ha−1 N as a form of urea. Other fertilizers’ dose and application times were similar to N1.
Boro rice: 153 kg N ha−1 as a form of urea fertilizer. Other fertilizers’ dose and application times were similar to N1.
Aman rice: 68 kg N ha−1 as a form of urea fertilizer. Other fertilizers’ dose and application times were similar to N1.
N3: 125% of RNDMustard: 128 kg N ha−1 as a form of urea fertilizer. Other fertilizers’ dose and application times were similar to N1.
Boro rice: 191 kg N ha−1 as a form of urea fertilizer. Other fertilizers’ dose and application times were similar to N1.
Aman rice: 85 kg N ha−1 as a form of urea fertilizer. Other fertilizers’ dose and application times were similar to N1.
Table 3. Analysis of variance results (p < 0.05) for different parameters measured in the aman and boro rice.
Source of VariancePlant HeightProductive Tillers Hill−1Panicle LengthFilled Grain Panicle−1Unfilled Grain Panicle−11000-Grain WeightGrain YieldStraw Yield
Aman
YearNS0.0001NSNS<0.0001NS0.0007<0.0001
Tillage (T)NSNSNSNSNSNSNSNS
N levels (N)<0.0001<0.0001<0.0001<0.00010.00050.023<0.0001<0.0001
T × N NSNSNSNSNSNSNSNS
Boro
Year0.008<0.0001<0.0001NSNSNS<0.0001<0.0001
TillageNSNSNSNSNSNSNSNS
N levels<0.0001<0.0001<0.0001<0.0001NSNS0.021<0.0001
Tillage × N levelsNSNSNSNSNSNSNSNS
Table 4. Effect of N levels on plant height (cm), productive tillers hill−1, panicle length (cm), filled grain panicle−1, unfilled grain panicle−1, and 1000-grain weight in aman rice.
N LevelsPlant Height
(cm)
Productive Tillers
Hill−1
Panicle Length (cm)Filled Grain Panicle−1Unfilled Grain
Panicle−1
1000-Grain Weight (gm)
Average201720182019AverageAverage2017201820192019
75% RND104 c9.3 b10.5 c9.5 b26.8 b92 b44 b41 b36 b27 b
100% RND109 b10.5 ab12.4 b10.6 ab27.6 a115 a45 b43 b41 b28 ab
125% RND113 a11.2 a13.8 a11.5 a28.1 a121 a59 a57 a43 a28 ab
Different lowercase letters of the same column indicate significant differences at a 5% level of probability. 75% RND: 75% of recommended N—fertilizer dose (RND); 100% RND: 100% of recommended N—fertilizer dose; 125% RND: 125% of recommended N—fertilizer dose.
Table 5. Effect of different N levels on plant height (cm), effective tiller hill−1, panicle length (cm), and filled grain panicle−1 in boro rice.
N LevelsPlant Height (cm)Productive Tiller Hill−1Panicle Length (cm)Filled Grain Panicle−1
Y1Y2Y3Y1Y2Y3Y1Y2Y3Y1Y2Y3
75% RND95 b88 b84 c12.7 b16.9 b10.3 b23.9 b22.2 b24.6 b98.3 b96.2 b95 b
100% RND99 a94 a93 b13.2 b17.7 ab12.7 a25.8 ab23.7 a26.4 a106 a109.8 a106 a
125% RND101 a95 a102 a14.8 a19.1 a14.0 a26.3 a24.1 a27.4 a107 a119.3 a111 a
Different lowercase letters of the same column indicate significant difference at a 5% level of probability. 75% RND: 75% of recommended N—fertilizer dose (RND); 100% RND: 100% of recommended N—fertilizer dose; 125% RND: 125% of recommended N—fertilizer dose. Y1 = 2016/17; Y2 = 2017/18; Y3 = 2018/19.
Table 6. Analysis of variance results (p < 0.05) for different parameters measured in the mustard.
Source of VariancePlant HeightBranch Plant−1Siliqua Plant−1Seed Siliqua−11000-Grain WeightRoot WeightSeed YieldStraw YieldSystem Rice Equivalent Yield
Year<0.0001NS0.0003NS<0.0001NS<0.0001<0.0001<0.0001
Tillage (T)0.0248<0.0001NS0.0095NS<0.00010.0171<0.00010.03
N levels (N)0.0004<0.00010.00050.0002NS<0.0001<0.0001<0.0001<0.0001
T × N 0.030.010.03NSNSNS0.0020.040.04
Table 7. Effect of tillage systems and N levels on plant height (cm), branch plant−1, siliqua plant−1, seed siliqua−1, and root weight of mustard.
Plant Height (cm)Branch Plant−1Siliqua Plant−1Seed Siliqua−1Root Weight
Tillage System2016/172017/182016/172017/182016/172017/182016/172017/182016/172017/182018/19
CT94 a76 a6.55.8 b49.046.9 b2425.2 b1.6 b1.3 b1.4 b
ST86 b73 b6.77.4 a47.453.4 a2628.7 a2.0 a1.9 a2.1 a
N levels
75% RND87 b69 b6.0 b5.8 b45.2 b45.2 b22 b25.5 b1.4 b1.5 b1.4 b
100% RND89 b73 ab6.7 a7.0 a49.9 a51.8 a25 a27.1 ab1.8 ab1.7 a1.8 a
125% RND93 a76 a6.9 a7.1 a51.4 a53.4 a27 a28.2 a2.1 a1.8 a2.1 a
Different lowercase letters of the same column indicate significant differences at a 5% level of probability. 75% RND: 75% of recommended N—fertilizer dose (RND); 100% RND: 100% of recommended N—fertilizer dose; 125% RND: 125% of recommended N—fertilizer dose. CT: conventional tillage; ST: strip tillage.
Table 8. Analysis of variance results (p < 0.05) for different soil and nutrient parameters.
Source of VarianceBDSoil PenetrationOMTNPKSZnB
PR 30PR 60Harvest
Tillage (T)<0.0001<0.00010.007<0.0001<0.0001<0.0001<0.0001<0.0001<0.0001NS0.001
N levels (N)NSNSNSNSNSNSNSNSNSNSNS
T × N NSNSNSNSNSNSNSNSNSNSNS
BD: bulk density; PR: soil penetration rate; OM: organic matter; TN: total nitrogen; P: phosphorus; K: potassium; S: sulfur; Zn: zinc; B: boron. NS: not significant.
Table 9. Effect of different tillage systems on soil penetration in last mustard crop and different soil physical and chemical properties after harvest of the final crop.
Tillage SystemsSoil PenetrationBD (g cm−3)OM (%)TN (%)P (mg kg−1)K (meq 100 g soil−1)S (mg kg−1)Zn (mg kg−1)B (mg kg−1)
30 DAS60 DASHarvest
CT2.22 a2.59 a2.74 a1.44 a1.01 b0.054 b9.67 b0.11 b16.06 b1.010.17 b
ST1.22 b1.57 b1.54 b1.40 b1.16 a0.062 a12.94 a0.19 a18.83 a1.030.22 a
Different lowercase letters of the same column indicate significant differences at a 5% level of probability. DAS, days after sowing; BD, bulk density; OM, organic matter; TN, total nitrogen; P, phosphorus; K, potassium; S, sulfur; Zn, zinc; B, boron.
Table 10. Effect of different tillage systems and N levels on system total production cost.
Total Production Cost (USD)
2016/172017/182018/19
Tillage systems
CT2400 a2447 a2368 a
ST2365 b2350 b2285 b
N levels
75% RND2313 c2328 c2257 c
100% RND2389 b2404 b2321 b
125% RND2446 a2461 a2401 a
Different lowercase letters of the same column indicate significant differences at a 5% level of probability. CT: conventional tillage; ST: strip-tillage; 75% RND: 75% of recommended N—fertilizer dose (RND); 100% RND: 100% of recommended N—fertilizer dose; 125% RND: 125% of recommended N—fertilizer dose.
Table 11. Effect of different tillage systems and N levels on system total gross return and net profit.
Total Gross Return (USD)Total Net Profit (USD)
2016/172017/182018/192016/172017/182018/19
Tillage SystemsN Levels
CT75% RND4049 cd3996 cd4325 c1726 bc1628 c2034 c
100% RND4788 a4410 bc4901 b2375 a1956 bc2530 bc
125% RND4894 a4493 bc4877 b2429 a1973 bc2434 c
ST75% RND3881 d3868 d4308 c1578 c1486 c2084 c
100% RND4299 bc4864 ab5287 ab1934 bc2413 ab3017 ab
125% RND4567 ab5167 ab5438 ab2140 ab2647 ab3086 ab
Different lowercase letters of the same column indicate significant differences at a 5% level of probability. CT: conventional tillage; ST: strip-tillage; 75% RND: 75% of recommended N—fertilizer dose (RND); 100% RND: 100% of recommended N—fertilizer dose; 125% RND: 125% of recommended N—fertilizer dose.
Publisher’s Note: MDPI stays neutral with regard to jurisdictional claims in published maps and institutional affiliations.

