Abstract
The δ13C value is regarded as an important indicator for tolerance to drought stress (DS), which is a severe abiotic stress that influences rice productivity. However, exploration of drought-responsive genes (DRGs) related to δ13C regulation is less reported. In this study, we investigated the natural variation in δ13C values in 102 japonica rice accessions. Among them, two rice accessions with contrasting δ13C values, Longdao 10 (LD10, DS-tolerant) and Binxu (BX, DS-sensitive), were used for further analysis. LD10 possesses better drought resistance with 2% lower δ13C values, 35% lower stomatal length and density, 33% lower water loss, and 11% lower stomatal conductance in comparison to BX. Transcriptome analysis shows that there are 2325 and 1378 differentially expressed genes (DEGs) induced by DS in LD10 and BX at the tillering stage, respectively, while there are 1076 and 492 DEGs in LD10 and BX at the graining stage, respectively. In total, 21 overlapped DEGs (defined as DRGs) were identified due to DS effects across two rice accessions over two stages. Among them, the expression levels of six genes, including chloride transporter (CLT1) and photosystem II polypeptide (PSBP), were further tested using qRT-PCR. Furthermore, we found that four methyltransferase genes were upregulated in BX compared to LD10 under DS. Consistently, the methylation levels of CLT1 and PSBP were higher along both promoter and CDS regions for CG, CHG, and CHH types. This study highlights the importance of the expression of these DRGs in response to DS and provides deep insights into DNA methylation-driven gene expression conferring different drought responses in rice.
1. Introduction
Rice (Oryza sativa L.) represents the most widely grown food crop in the world. However, rice is a semi-aquatic plant that originated in swamps and consumes a huge amount of water [1]. The water consumption for rice production accounts for about 70% of agricultural water. According to the International Rice Research Institute (IRRI), a water consumption of 5000 L is needed to produce one kilogram of rice during the whole growth season, about twice the water consumption of other cereal crops, such as maize and wheat (www.irri.org). With the decrease in freshwater resources available for agriculture, it is imperative to improve the water use efficiency (WUE) and drought resistance of rice [2] and to take full advantage of the potential of biological water conservation, which guides appropriate agronomic measures in applicable areas.
Leaf WUE can be expressed as the ratio of photosynthesis rates (A) to transpiration (E). This trait can be also evaluated by carbon isotope discrimination (δ13C), which is extensively used as an important index for drought resistance [3,4]. Large natural variation was observed in δ13C in the rice population [2,5], which suggests that δ13C is an improvable trait and that there is great room for its improvement. Massive studies on mining novel QTLs and genes responsible for δ13C were reported in different species [5], and many genes of interest were documented, such as SnRK2, NHX2, and SLAC1 [6,7,8]. However, drought resistance is a very complex trait and is governed by various regulatory pathways that stimulate the drought-responsive genes (DRGs). It seems difficult to point out a single gene with a major effect explaining the changes in drought resistance levels among different genotypes.
Currently, multiple-omics is becoming a robust tool for identifying the pivotal biological pathways involved in drought response [9]. This tool consists of utilizing different combinations of omics techniques to study the transcriptome, proteomics, metabolism, methylome, and phenome. The transcriptome represents global gene expression abundance in plants experiencing some environmental stimulus [10]. In addition, the methylome is used to depict the DNA methylation levels at genomic levels. For example, a methylome is an important tool for promoting the development of epigenetics, which means heritable information that is conveyed without changing the DNA sequence [11]. DNA methylation is brought about by DNA methyltransferase catalyzing a covalent binding reaction on a methyl group at the fifth carbon position of cytosine in genomic CpG dinucleotides. It leads to the alteration of gene expression levels through altering chromatin structure, DNA conformation, and DNA stability.
In this study, we adopted a combination of transcriptome and methylome analysis to investigate the reprogrammed biological pathways and DRGs under drought stress. To ensure sufficient DRGs were detected, we started by screening δ13C values from 102 rice accessions derived from the japonica population [12]. Two rice accessions with contrasting drought resistance and δ13C values were selected for the multiple-omic analysis. To identify the list of DRGs with conserved functional roles in drought resistance, we performed the transcriptome analysis over two developmental stages during drought treatment. The overlapped DRGs between the two developmental stages were further analyzed for methylation differences. A proposed model of DNA methylation driving DRGs in rice is provided; it will help guide precise rice design for drought breeding.
2. Materials and Methods
2.1. Materials and Growth Condition
In total, 102 japonica rice accessions were used for screening the natural variation in δ13C (Table S1). These accessions were collected from different geographic regions in the northeast of China, including Heilongjiang, Jilin, and Liaoning, and some materials were derived from Japan. Seeds were provided by the Rice Research Laboratory of the Institute of Farming and Cultivation, Heilongjiang Academy of Agricultural Sciences. Relevant permission for the collection of the seeds of japonica rice accessions was obtained. Plants were grown in the rice field base of Heilongjiang Academy of Agricultural Science (126.49° E, 45.50° N) on 15 May 2019. To decrease the boundary effect, 36 plants were planted (6 × 6) for each rice accession, with 20 cm between plants within each row and 20 cm between rows. The rice fields were managed according to standard local agronomic practice with the following fertilizer application guideline: 48 kg N ha−1, 120 kg P2O5 ha−1, and 100 kg K2O ha−1 as the basal fertilizer, with an additional 86 kg N ha−1 at the tillering stage and 28 kg N ha−1 at the booting stage as proposed previously [13].
2.2. δ13C Determination
To estimate the water use efficiency in different rice accessions, we determined carbon isotope ratio (δ13C) values in different rice accessions at the graining stage. An elemental analyzer–isotope ratio mass spectrometer (EA-IRMS, EA model of Flash2000 and IRMS model of MAT253) (Thermo Fisher, Bremen, Germany) was used to determine δ13C. The measurement of the plant δ13C value was based on the PDB (Pee Dee Belemnite) as previously documented [3]. In addition, according to the average tiller, five plants of each cultivar were selected for the determination of plant height, ear weight, and grass weight.
2.3. Drought Stress Treatments
Longdao 10 (LD10) and Binxu (BX) from 102 rice accessions were selected with contrasting δ13C values for DS evaluation. Plants were grown in pots (2 L volume) in a growth chamber with a completely randomized design. Three biological replicates for drought stress treatment were used. Air temperature, humidity, and photoperiod in the growth chamber were maintained at 26 °C, 67–80%, and 12 h/12 h, respectively. Daily water irrigation was used as control, and limited irrigation was applied for DS treatment 20 days after seed germination. The tensiometer developed by Nanjing Soil Research Institute was used to monitor soil moisture. For limited irrigation treatment, 1~2 L water was added to maintain the tensiometer reading between −15 and −20 kPa.
2.4. Photosynthesis Rate Measurements
To describe the plant status in response to DS, we measured the photosynthetic rates under saturated light (1500 μmol m−2 s−1), using the LICOR 6400-XT Portable Photosynthesis System (LI-COR, Lincoln, NE, USA). Block temperature in the leaf cuvette chamber was 25 °C, relative humidity was maintained at ~60%, and CO2 concentration was 400 ppm. Four biological replicates were conducted. For chlorophyll contents, leaf samples were extracted with 15 mL of 80% acetone. The samples were stored in the dark for 24 h before using the colorimetric method to determine the leaf chlorophyll contents, which were expressed as mg g−1 FW [14].
In addition, we measured photochemical efficiency by using Multi-Function Plant Efficiency Analyser (M-PEA, PP-Systems). The Fo (minimum fluorescence) and Fm (maximal fluorescence) of leaves in the dark for 20 min were measured. After actinic light and saturation pulse values were applied, leaf chlorophyll fluorescence parameters, Fv/Fm (maximum efficiency of PSII photochemistry under dark-adaption), and ΦPSII (quantum yield of PSII) were calculated [15].
2.5. Stomatal Aperture Determinations
The top fully expanded leaves of each plant were selected to cut and stored in a formalin–acetic acid–alcohol (FAA) fixative solution for future use. The detailed process of stomatal observation was followed as previously documented [5]. A TM-1000 desktop scanning electron microscope was used to observe stomatal characteristics on the adaxial leaf surface. The stomatal density (stomata per unit area) and stomatal length for each leaf sample on the adaxial leaf surface were recorded following the previous protocols [5]. Three stomata images were randomly selected from each field to measure the stomatal length and stomatal density.
2.6. RNA Extraction
To identify the DRGs in the two rice accessions (LD10 and BX), we performed a transcriptome analysis in different rice accessions. The top fully expanded leaves from each plant with or without drought treatment were sampled for transcriptome analysis. Total RNA was extracted from the leaves using TRIzol Reagent (Invitrogen, Waltham, MA, USA). Genomic DNA was removed with DNase I (Takara, Kusatsu, Japan). RNA quality was quantified using the ND-2000 (NanoDrop Technologies, Wilmington, DE, USA) for further library construction.
2.7. Library Preparation and Illumina Hiseq 4000 Sequencing
In this study, ~5 μg of total RNA was used to construct the transcriptome library using the TruSeq RNA sample preparation kit (Illumina, San Diego, CA, USA). We synthesized cDNA to end-repair and selected target cDNA fragments in the range of 200–400 bp for library construction. The paired-end RNA-seq library was finally sequenced using the Illumina HiSeq 4000 platform (Illumina).
2.8. Read Mapping and Differential Expression Analysis
For the read mapping step, the raw paired-end reads were first quality controlled using FastQC software (https://github.com/s-andrews/FastQC, accessed on 3 September 2020). Then the clean reads were mapped to the reference genome (Nipponbare, RAP-DB) using (https://github.com/DaehwanKimLab/hisat2, accessed on 3 March 2022) [16]. To identify DRGs over two developmental stages, a fragments per kilobase of transcript per million mapped reads (FPKM) method was applied to calculate the transcript abundance. FPKM is reported to be a normalization method for RNA-seq reads [17]. Low-expression genes of FPKM < 1 were removed from DEG analysis. In addition, we used RSEM software (http://deweylab.biostat.wisc.edu/rsem/, accessed on 3 March 2022) to estimate gene abundance [18]. R statistical package software EdgeR (http://www.bioconductor.org/packages/2.12/bioc/html/edgeR.html, accessed on 3 March 2022) was finally applied for performing differential expression analysis as documented earlier [19].
2.9. GO and KEGG Analysis
For Gene Ontology (GO) annotation, we used an in-house Perl script UniProtKB GOA file (ftp.ebi.ac.uk/pub/databases/GO/goa, accessed on 3 March 2022). KOBAS (KEGG Orthology Based Annotation System, v2.0) was applied to identify reprogrammed biochemical pathways of each pathway as previously documented [20].
2.10. qRT-PCR
The middle sections of top fully expanded leaves were sampled from BX and LD10 exposed to either normal or DS conditions at the seeding stage. The total RNA was extracted with Ambion PureLink RNA mini kit. cDNA was then reverse transcribed using SuperScript VILO cDNA Synthesis Kit (Invitrogen Life Technologies). The qRT-PCR analysis was performed using SYBR Green PCR Master Mix (Applied Biosystems, Forster City, CA, USA, 4309155) and a real-time PCR system (ABI StepOnePlus, Applied Biosystems, USA). Primers for qRT-PCR were designed using Primer Prime Plus 5 Software Version 3.0 (Applied Biosystems, USA). For internal reference, we used Actin1 gene (Os03g50885). Relative expression of a gene against Actin1 was calculated as 2−ΔΔCT (ΔCT = CT, gene of interest−CT), as described earlier [21]. Three biological replicates were used. The primers used for determining drought-responsive gene expression levels are listed in Table S2.
2.11. Analysis of Genetic Diversity
A total of 69 pairs of simple sequence repeat (SSR) primers for the 12 rice chromosomes were designed and sent for synthesis at the BGI Group (BGI Genomics, Shenzhen, China). Among the 69 pairs of primers, 50 pairs demonstrated polymorphisms among various tested cultivars. The amplification reaction process included pre-denaturation at 94 °C for 5 min; denaturation at 92 °C for 30 s, annealing for 30 s, and extension at 72 °C for 1 min, for a total of 35 cycles; extension at 72 °C for 7 min; and storage at 15 °C. Structure V2.2 was used to analyze the population genetic structure as previously reported [22]. POPGENE V1.32 was used to calculate the genetic consistency and genetic distance between cultivars.
2.12. DNA Methylome Analysis
To determine global DNA methylation status, DNA methylome analysis was performed as documented previously [23]. We extracted the total genomic DNA from LD10 and BX leaves at 10 DAT and treated DNA fragments using EZ DNA Methylation-Gold Kit (Zymo Research, Irvine, CA, USA). The Pico Methyl-Seq Library Prep Kit (D5456; Zymo Research) was used following the manufacturer’s instructions. The libraries were sequenced by Biomarker Technologies (Qingdao, China) using Illumina HiSeq 2500 (San Diego, CA, USA). Paired-end reads (150 bp) were generated. Adapters and low-quality bases in the WGBS reads were trimmed using Trimmomatic v.0.36 (http://www.usadellab.org/cms/, accessed on 3 March 2022). The trimmed reads were mapped to the assembled pseudogenomes with Bismark software v0.14.5 (https://www.bioinformatics.babraham.ac.uk/projects/bismark/, accessed on 3 March 2022).
We extracted the methylation information for each cytosine site after removing the duplicate reads. The cysteines with >4× genome coverage were applied in the methylation state test, and the methylation states of each rice accession were evaluated using the binomial test with false discovery rate with p-value <0.05. Differentially methylated regions between the two rice accessions exposed to drought conditions were identified using Model Based Analysis of Bisulfite Sequencing (MOABS) software (http://code.google.com/p/moabs/, accessed on 3 March 2022).
3. Results
In this study, we first investigated the population structure in 102 rice accessions using 69 SSR markers. Results show that three groups were classified given that K = 3, where ΔK is the maximum (Figure 1A), suggesting the clear stratification of the population. From the information on the location for each accession collected in this study, we found that the accessions from the same location were not clustered together, suggesting the diversity of these traits (Figure 1B). In addition, the δ13C is not significantly altered at different locations (Figure 1C). These pieces of evidence reveal that different geographic locations do not shape the structure of the population used in this study.
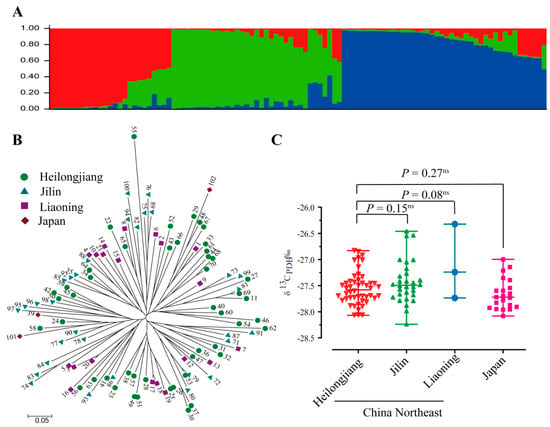
Figure 1.
Natural variation in δ13C values in 102 rice accessions derived from different geographic regions. (A) Population structure analysis of 102 rice accessions. (B) Polygenetic analysis of 69 SSR markers in 102 rice accessions. (C) Distribution of δ13C in accessions originating from different geographic regions.
In order to uncover the significance of δ13C in drought tolerance, we first analyzed the correlation between δ13C and gross seed weight. A significantly negative correlation between them was observed (r = −0.36) (Figure 2A). These 102 rice accessions exhibit large natural variation in δ13C ranging from −28.3% to −26.5% (Figure 2B). Among them, we chose two rice accessions, namely LD10 and BX, with −27.3% and −28.0% δ13C values, respectively (Figure 2B). Results show that following the prolonged DS treatments within 15 days, the leaves of plants appear to be withered, especially for BX (Figure 2C). In addition, BX shows higher absolute terms of δ13C and exhibits greater differences in plant height compared with LD10 (Figure 2D,E). Consistently with δ13C differences, this indicates that LD10 is a drought-tolerant rice genotype while BX is a drought-sensitive rice genotype.
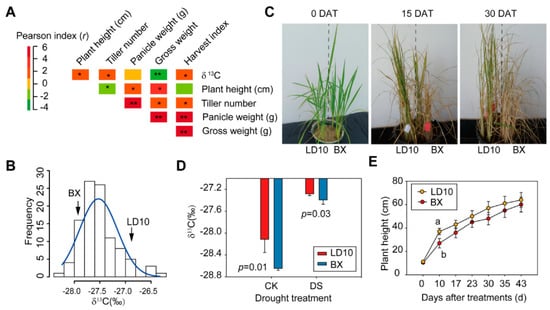
Figure 2.
δ13C strongly correlates with drought resistance. (A) Pearson correlation coefficient among different morphological traits and physiological traits in 102 accessions. (B) Distribution of δ13C in 102 rice accessions. Two rice accessions with contrasting δ13C were selected to evaluate the drought stress (DS) resistance. (C) Images of LD10 and BX plants exposed to drought treatments after different days (DAT). (D) Comparison of δ13C between LD10 and BX at 10 DAT. Values represent mean ± standard deviation (n = 3). (E) Plant height compared between LD10 and BX on different days after drought treatments. Values represent mean ± standard deviation (n = 6). Student’s t-test was used to represent the significant levels, where different letters stand for significant levels at p < 0.05. *, ** Significant at p < 0.05 and p < 0.01, respectively.
Furthermore, epidermal cell stomatal profilings were determined to analyze the potential effects on drought performance. Results show that the stomatal density and stomatal length in BX are 30% and 35% higher than those in LD10 under DS conditions (Figure 3A–D). In addition, the water loss calculated at the whole-plant level in BX was 33% higher than that in LD10 (Figure 3E). Stomatal conductance (gs) in BX was 11% higher than that in LD10 in DS condition (p > 0.05) (Figure 3F). In terms of DS effects, it induces up to 25% reduction in stomatal length, 40% reduction in water loss, and 350% reduction in stomatal conductance for both rice accessions (Figure 3E–H). In contrast, stomatal density was increased by 20% due to DS effects for both rice accessions (Figure 3C).
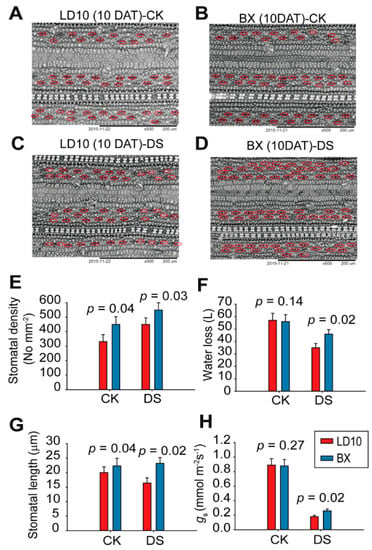
Figure 3.
The changes in stomatal profilings between LD10 and BX exposed to drought treatments after 10 days. (A–D) Epidermis images of LD10 and BX after 10 days of treatment under control (A,B) and DS conditions (C,D). Red circles were used to label the stomatal apertures. (E,F) Stomatal density and stomata length of the two rice accessions with or without drought treatments. Values represent mean ± standard deviation (n = 30). (G,H) Water loss per plant and leaf stomatal conductances of two rice accessions exposed to drought treatments. Values represent mean ± standard deviation (n = 6). Student’s t-test was used to represent the significant levels, where different letters stand for significant levels at p < 0.05.
The quality and features of reads mapped to reference genomes were analyzed. We found that the total number of reads was 45 million, while there were 40 million and 35 million mapped reads and unique reads, respectively (Table S3). In addition, there were 21 million clean reads, and the GC content was 53% with 95% QC values (Table S4). The percentage of bases with different positions was around 25% for all bases (A, C, G, and T), while the percentage for G across reads was 8%, relatively lower than that of the other three nucleotides (Figure S1A). The density for all FPKM values across the samples shows a normal distribution, ranging from −5 to 5 log10(FPKM) values (Figure S1B). Consistently, the mean of log10(FPKM) across all samples was around 0.5 (Figure S1C). The FPKM with differential intervals increased dramatically following 25~50% mapped reads and plateaued when mapped reads reached 75% (Figure S1D).
From principal component analysis, we found that the samples within the same group were clustered together, with 68.2% and 23.4% for PC1 and PC2, respectively (Figure S2A). The Pearson correlation coefficient (r) ranged from 0.33 to 0.97 for different comparisons of biological samples (Figure S2B). These pieces of evidence suggest that the samples had good consistency within the group in terms of the transcriptome.
Furthermore, we found that there were 1080 and 523 upregulated genes in LD10 and BX at tillering stage (~10 DAT) induced by DS relative to CK, respectively (Figure 4A,B). There were 1245 and 855 downregulated genes induced by DS relative to CK in LD10 and BX at tillering stage, respectively (Figure 4A,B). At the graining stage (~20 DAT), there were 136 and 219 upregulated genes induced by DS relative to CK in LD10 and BX, respectively (Figure 4C,D). These findings suggest that more differentially expressed genes (DEGs) were identified in LD10 than in BX due to DS effects for both developmental stages (10 DAT and 20 DAT).
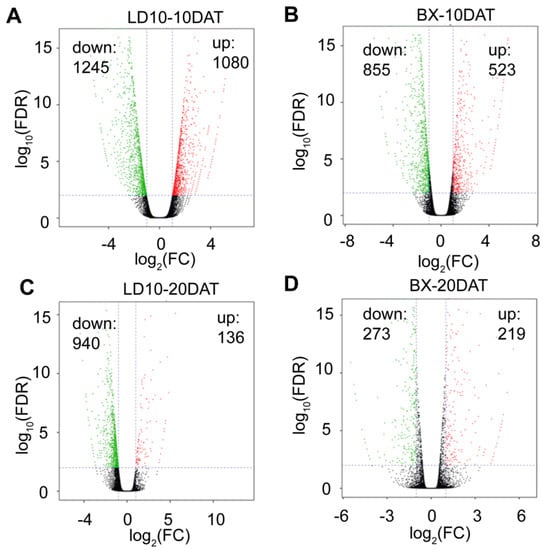
Figure 4.
More differentially expressed genes were identified in LD10 than in BX induced by drought stress over two stages. (A,B) Differentially expressed genes (DEGs) for LD10 and BX at 10 days after drought treatment (10 DAT). (C,D) DEGs for LD10 and BX at 20 DAT.
To decipher the reprogrammed biological pathways that are induced by DS, we performed both GO and KEGG analyses. Results show that some pathways of nuclease activity, RNA binding, Rubisco-bisphosphate carboxylase activity, and glutamate synthase (NADH) activity were significantly enriched in the upregulated DEGs in LD10 versus BX at 10 DAT (Figure 5A). For KEGG analysis, carbon fixation in photosynthetic organisms; glycine, serine, and threonine metabolism; and alanine, aspartate, and glutamate metabolism were enriched in the upregulated DEGs in LD10 versus BX at 10 DAT (Figure 5B). For downregulated DEGs, we found that calcium ion binding, oxidoreductase activity, and carbohydrate binding were significantly enriched (Figure S3A). Flavonoid biosynthesis, starch and sucrose metabolism, and glutathione metabolism were significantly enriched in the list of upregulated DEGs based on KEGG analysis (Figure S3B).
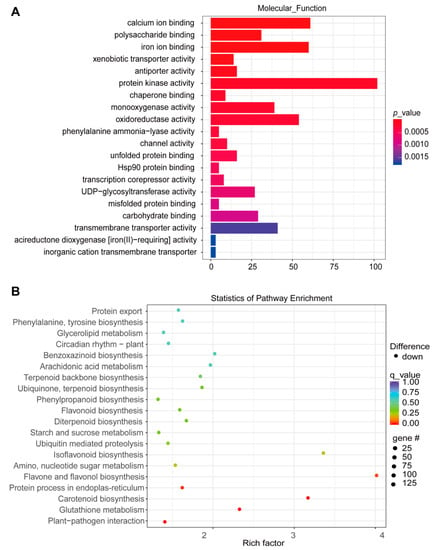
Figure 5.
GO and KEGG analysis of upregulated genes in LD10 relative to BX at 10 DAT. (A) Molecular function extracted from GO analysis of the list of upregulated genes. (B) KEGG analysis of the list of upregulated genes.
The overlapped DEGs due to DS effects between LD10 and BX over two developmental stages were used to represent drought-responsive genes (DRGs). There are 251 DEGs over the two stages for LD10 (Figure 6A) and 112 DEGs over the two stages for BX (Figure 6B). Based on this, we found 21 DRGs between two rice accessions over two developmental stages (10 DAT and 20 DAT) (Figure 6C). The relative abundance of these 21 DRGs is presented in Table S5 and Figure 6D.
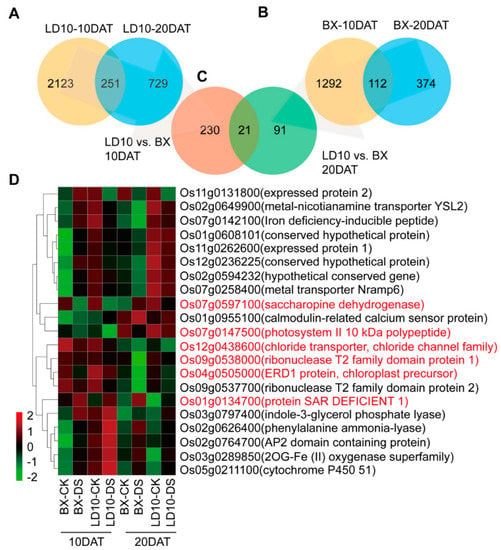
Figure 6.
Six drought-responsive genes of interest identified in two rice accessions over two stages. (A,B) Venn diagram representing overlapped genes in LD10 (A) and BX (B) between the two stages for each rice accession. (C) Overlapped genes in LD10 and BX across the two stages. (D) Heatmap representing the 21 overlapped genes for drought-responsive genes.
Furthermore, there are 14 DRGs excluding some unexpressed or transposon annotated genes (Table S6; Figures S4 and S5). Among them, chloride transporter (CLT1), ribonuclease 1 (RIB1), ribonuclease 2 (RIB2), photosystem II polypeptide (PSBP), and ERD1 protein (ERD1) were upregulated by DS in both rice accessions across the two stages (Figures S4A,D,E and S5E,G). In contrast, protein SAR DEFICIENT 1 (SARDE1), cytochrome P450 (cytoP450), indole-3-glycerol phosphate lyase (I3GPL), AP2 domain-containing protein (AP2CP), and calmodulin-related calcium sensor (OsCML31) were downregulated by DS in the two rice accessions over two stages (Table S6; Figures S4B,C and S5D,F,H). For the remaining four DRGs, i.e., saccharopine dehydrogenase (SAD1), metal transporter Nramp6 (Nramp6), expressed protein 1 (EP1), and expressed protein 2 (EP2), the expression levels have no correlation with trends of δ13C in BX and LD10 either during tillering stage (10 DAT) or graining stage (20 DAT) (Figures S4F and S5A–C).
Furthermore, the expression levels of 6 out of 14 DRGs were examined using qRT-PCR, and we found that CLT1, PSBP, ERD1, SAD1, and RIB2 genes show greater upregulation by DS in LD10 than in BX at 10 DAT (Figure 7A–E). In contrast, SARDE1 shows a greater scale of downregulation by DS in BX than in LD10 across two stages (Figure 7F). These findings suggest that CLT1, PSBP, ERD1, SAD1, and RIB2 are probably positive regulators, while SARDE1 is a negative regulator responsible for drought tolerance.
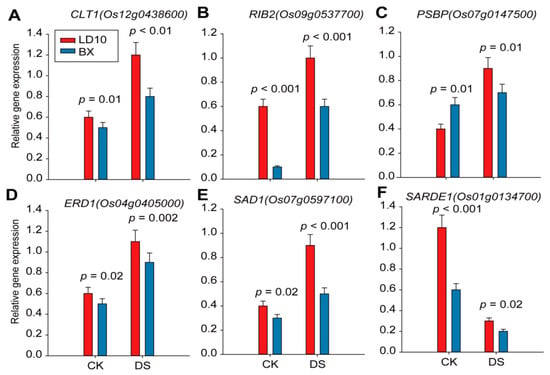
Figure 7.
qRT-PCR results showing the relative expression levels of six genes that tightly correlated with δ13C values in two rice accessions in either CK or drought conditions at 10 DAT. (A–F) Relative expression levels of genes, namely CLT1 (Os12g0438600), RIB2 (Os09g0537700), PSBP (Os07g0147500), ERD1 (Os04g0405000), SAD1 (Os07g0597100), and SARDE1 (Os01g0134700). Values represent mean ± standard deviation (n = 3). Student’s t-test was used to represent the significant levels, where different letters stand for significant levels at p < 0.05.
The occurrence of DNA methylation is attributed to the effects of methyltransferase. There are 35 methyltransferase genes annotated based on transcriptome analysis (Table S7), and we found that the abundances of four methyltransferase genes were significantly different between BX and LD10 over two developmental stages based on transcriptome data (Figure S6). These methyltransferase genes were significantly increased in BX compared to LD10 at 10 DAT (Figure S6). Under CK conditions, interestingly, the expression levels of methyltransferase genes were similar or decreased in BX compared to LD10 (Figure S6). These pieces of evidence suggest that DNA methylation levels of BX might be higher than those of LD10 and that DNA methylation levels under DS lead to higher expression than those under CK.
To learn the potential mechanism of the alteration of the gene expression levels for the six DRGs, we performed a global DNA methylome analysis for BX and LD10 determined at the tillering stage (10 DAT). Results suggest that the methylation levels in two rice accessions exposed to either CK or DS exhibit a similar pattern across three types of DNA methylation (CG, CHG, and CHH) (Figure S7). The methylation levels of the CG type are relatively higher than those of the CHG and CHH types. Consistently, we found that a higher abundance of gene methylation levels for both CLT1 and PSBP was detected upstream of the 2k promoter region than in the CDS region (Figure 8 and Figure S8). In addition, we found that the methylation levels of the two genes, i.e., CLT1 gene (Os12g0438600) and PSBP (Os07g0147500), at the 2k promoter region were lower under DS than under CK (Figure 8 and Figure S8). Collectively, we found that the expression levels of two DRGs (CLT1 and PSBP) were positively correlated with trends of δ13C in two rice accessions over two developmental stages during DS; this regulation modern is closely related to DNA methylation regulation.
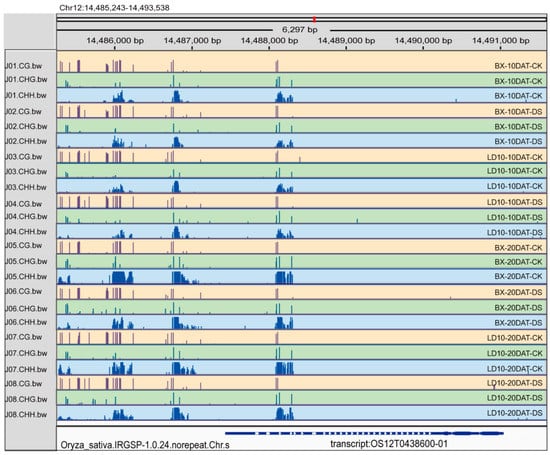
Figure 8.
Distribution of the expression level of three methylation types (CG, CHG, and CHH) for the CLT1 (Os12g0438600) gene in two rice accessions with or without drought stress treatment.
4. Discussion
WUE is a complex quantitative trait and is affected by different internal factors, including photosynthetic efficiency, hormones, canopy structure, and root morphology [24]. In general, it is believed that although cultivated rice exerts a huge variation in the WUE trait, this variation is relatively smaller than that in wild ancestors [3]. The reason may be partly because breeders prefer to select high-yield cultivars for breeding, resulting in large leaf stomatal conductance in modern rice cultivars to ensure sufficient CO2 exchange rates (photosynthetic efficiency) [2]. However, this always leads to over-transpiration of leaves exposed to high temperature and drought stress conditions when stomata are not appropriately closed [4]. In this study, we performed a large-scale measurement of δ13C, which is an important parameter representing WUE, in 102 japonica rice accessions. The majority of these accessions were widely cultivated in the northeast of China. We found that δ13C ranged from −26.5 to −28‰, which is relatively less than that observed in the 203 MiniCore rice population consisting of landraces and modern cultivars [2,4,25]. This suggests that artificial selection shapes the genomic diversity indices.
The molecular mechanisms of plants acclimating to drought stress by regulating various genes or biological pathways have been extensively reported [7]. First, ROS signaling is an extensive regulation pathway that is involved in various metabolic processes. Under DS conditions, the cellular metabolic process is interrupted, which inevitably drives ROS production [26]. Therefore, the avoidance of ROS production during DS is also an important strategy that enables plants to cope with limited-irrigation environments [26]. In this study, we found that in the drought-resistant rice line, LD10, many biological pathways related to the antioxidant system were upregulated, such as glutamate synthase; protochlorophyllide reductase activity; and alanine, aspartate, and glutamate metabolism, in the list of upregulated DEGs, relative to the drought-sensitive line, BX, exposed to 10 DAT DS (Figure 5A,B). In contrast, ROS-production-related pathways such as oxidoreductase, phenylalanine ammonia-lyase activity, and glutathione metabolism were inhibited (Figure S3A,B). This supports that ROS signaling plays important roles in drought resistance in LD10 during DS treatments.
Another important pathway for drought response is ABA signaling transduction. It is clear that ABA binds directly to the PYR/PYL family of ABA receptors, resulting in the inhibition of type 2C phosphatases (PP2C) and activation of downstream ABA signaling, hence inducing the expression of various DRGs, such as ABI1 and ABI2 [7,27]. Among these DRGs, an anion channel responsible for the stomatal closure gene (SLAC1) was documented [6]. It promotes the release of Cl− out of vacuole to maintain ion homeostasis for better adaption to DS. In our study, we found a chloride transporter (CLT1, also named OsALMT1, Os12g0438600) was stimulated by DS, and it shows higher expression together with lower DNA methylation levels when compared to the CK condition (Figure 7A and Figure 8). CLT1 is reported as a vacuolar chloride channel having a major role in controlling stomata aperture [28]. Under long-term drought stress, plants have to maintain an appropriate stomatal aperture to balance between gas exchange and transpiration [2]. As observed in our study, photosynthesis pathways and ribulose-phosphate carboxylase activity were significantly enriched in the list of upregulated DEGs in LD10 vs. BX exposed to DS (Figure 5A,B). Consistently, photosynthesis genes, such as photosystem II 10 kDa polypeptide (Os07g0147500), were highly expressed in LD10 exposed to DS with low methylation levels (Figure S8). Collectively, we reported here that DNA methylation as an alternative regulation underlies gene expression in addition to ABA signaling.
5. Conclusions
Drought resistance is a very complicated trait and is related to a range of biological processes. The molecular mechanisms of plant adaption to DS have been extensively reported. However, studies about DNA methylation-driven gene expression in response to DS remain very rare. In this study, we used two rice accessions with contrasting drought resistance identified by screening δ13C values in 102 japonica rice accessions. Photosynthetic and stomatal physiology parameters were investigated to confirm the drought resistance in two rice accessions. We found that the drought-resistant line, LD10, possesses better drought resistance by maintaining 2%, 35%, 33%, and 11% lower δ13C values, stomatal density, water loss, and stomatal conductance, respectively, compared to BX under DS. To describe the DRGs, we compared the overlapped DEGs in the two rice accessions over two developmental stages. In this regard, we found 14 DRGs, and the expression levels of these genes were further confirmed by qRT-PCR. Methylation levels of the PSBP and CLT1 genes were lower in LD10 than in BX, which is in line with the results for four methyltransferase genes and the pattern of δ13C in two rice lines over the stages. Collectively, we highlighted the importance of DNA methylation in drought resistance through regulating DRGs.
Supplementary Materials
The following supporting information can be downloaded at: https://www.mdpi.com/article/10.3390/agronomy12061445/s1, Figure S1: Quality control and data processing analysis based on transcriptomes analysis; Figure S2: Principal component analysis and biological sample correlation performed on two rice accessions over two different DAT; Figure S3: GO and KEGG analysis on downreguated genes at 10 DAT in LD10 relative to BX; Figure S4: Abundance of overlapped drought responsive genes in two rice accessions exposed to either drought or control; Figure S5: Abundance of overlapped drought responsive genes in two rice accessions (LD10 and BX) exposed to either drought or control; Figure S6: Abundance of methyltransferase related gene transcripts in BX and LD10 over two developmental stages based on transcriptome dataset; Figure S7: DNA methylation levels of two rice accessions (LD10 and BX) exposed either drought or control condition; Figure S8: Distribution of three methylation types level at PSBP (Os07g0147500) gene in two rice accessions (LD10 and BX) with or without drought treatment; Table S1: δ13C values in 102 rice accessions determined in this study; Table S2: Primer list used in this study; Table S3: Statistical table of sequence alignment results between sample sequencing data and selected reference genomes; Table S4: Quality control of reads from transcriptome analysis; Table S5: Venn diagram representing the overlapping and unique genes between two rice accessions across drought treatment of two stages; Table S6: Overlapped drought responsive genes in two rice accessions exposed to drought stress; Table S7: Annotated 34 methyltransferases genes based on transcriptome analysis.
Author Contributions
G.D. and L.C. were mainly responsible for the overall experimental progress, data collation, and paper writing. S.S. and G.Y. were mainly responsible for the overall thinking of the paper and the revision of the paper. L.C. and T.W. were mainly responsible for the investigation of phenotypic data. L.B. and J.Z. were in charge of rice field management. Y.L. (Yongcai Lai) was responsible for laboratory management. T.W., Z.L., K.L., Y.L. (Yu Luo) and K.L. were responsible for scientific funding management. X.W., G.Y. and R.W. were responsible for molecular experiments. All the authors have approved the final manuscript. All authors have read and agreed to the published version of the manuscript.
Funding
This work was supported by the National Rice Industry Technology System (CARS-01-57), National Key Research and Development Program of Heilongjiang (GZ20210036), Heilongjiang Academy of Agricultural Sciences Outstanding Youth Project (2021JCQN001), and Scientific Research Operating Cost Program of Heilongjiang (CZKYF2021-2-A002, CZKYF2021-2-B013).
Institutional Review Board Statement
The study complied with relevant institutional, national, and international guidelines and legislation.
Informed Consent Statement
Informed consent was obtained from all subjects involved in the study.
Data Availability Statement
All related sequencing data are deposited in NCBI Sequence Read Archive (SRA) database with the link of https://www.ncbi.nlm.nih.gov/sra?term=SAMN24593556 (accessed on 3 March 2022). The bioProject accession is PRJNA793928.
Conflicts of Interest
The authors declare no conflict of interest.
References
- Luo, L.J. Breeding for water-saving and drought-resistance rice (WDR) in China. J. Exp. Bot. 2010, 61, 3509–3517. [Google Scholar] [CrossRef] [PubMed] [Green Version]
- Xu, Y.; This, D.; Pausch, R.C.; Vonhof, W.M.; Coburn, J.R.; Comstock, J.P.; McCouch, S.R. Leaf-level water use efficiency determined by carbon isotope discrimination in rice seedlings: Genetic variation associated with population structure and QTL mapping. Theor. Appl. Genet. 2009, 118, 1065–1081. [Google Scholar] [CrossRef] [PubMed]
- Farquhar, G.; Richards, R. Isotopic Composition of Plant Carbon Correlates with Water-Use Efficiency of Wheat Genotypes. Funct. Plant Biol. 1984, 11, 539–552. [Google Scholar] [CrossRef]
- Qu, M.; Hamdani, S.; Li, W.; Wang, S.; Tang, J.; Chen, Z.; Song, Q.; Li, M.; Zhao, H.; Chang, T.; et al. Rapid stomatal response to fluctuating light: An under-explored mechanism to improve drought tolerance in rice. Funct. Plant Biol. 2016, 43, 727–738. [Google Scholar] [CrossRef] [PubMed] [Green Version]
- Chen, H.; Zhao, X.; Zhai, L.; Shao, K.; Jiang, K.; Shen, C.; Chen, K.; Wang, S.; Wang, Y.; Xu, J. Genetic Bases of the Stomata-Related Traits Revealed by a Genome-Wide Association Analysis in Rice (Oryza sativa L.). Front. Genet. 2020, 11, 611. [Google Scholar] [CrossRef] [PubMed]
- Chater, C.; Gray, J.E. Stomatal Closure: The Old Guard Takes Up the SLAC. Curr. Biol. 2015, 25, R271–R273. [Google Scholar] [CrossRef] [PubMed] [Green Version]
- Zhu, J.-K. Abiotic Stress Signaling and Responses in Plants. Cell 2016, 167, 313–324. [Google Scholar] [CrossRef] [Green Version]
- Qu, M.; Essemine, J.; Xu, J.; Ablat, G.; Perveen, S.; Wang, H.; Chen, K.; Zhao, Y.; Chen, G.; Chu, C.; et al. Alterations in stomatal response to fluctuating light increase biomass and yield of rice under drought conditions. Plant J. 2020, 104, 1334–1347. [Google Scholar] [CrossRef]
- Li, J.; Essemine, J.; Shang, C.; Zhang, H.; Zhu, X.; Yu, J.; Chen, G.; Qu, M.; Sun, D. Combined Proteomics and Metabolism Analysis Unravels Prominent Roles of Antioxidant System in the Prevention of Alfalfa (Medicago sativa L.) against Salt Stress. Int. J. Mol. Sci. 2020, 21, 909. [Google Scholar] [CrossRef] [Green Version]
- Huang, L.; Zhang, F.; Wang, W.; Zhou, Y.; Fu, B.; Li, Z. Comparative transcriptome sequencing of tolerant rice introgression line and its parents in response to drought stress. BMC Genom. 2014, 15, 1026. [Google Scholar] [CrossRef] [Green Version]
- Zhang, H.; Lang, Z.; Zhu, J.-K. Dynamics and function of DNA methylation in plants. Nat. Rev. Mol. Cell Biol. 2018, 19, 489–506. [Google Scholar] [CrossRef] [PubMed]
- Zhang, L.; Dai, W.; Wu, C.; Song, X.; Qiang, S. Genetic diversity and origin of Japonica- and Indica-like rice biotypes of weedy rice in the Guangdong and Liaoning provinces of China. Genet. Resour. Crop Evol. 2012, 59, 399–410. [Google Scholar] [CrossRef]
- Qu, M.; Essemine, J.; Li, M.; Chang, S.; Chang, T.; Chen, G.Y.; Zhu, X.-G. Genome-wide association study unravels LRK1 as a dark respiration regulator in rice (Oryza sativa L.). Int. J. Mol. Sci. 2020, 21, 4930. [Google Scholar] [CrossRef] [PubMed]
- Qu, M.; Zheng, G.; Hamdani, S.; Essemine, J.; Song, Q.; Wang, H.; Chu, C.; Sirault, X.; Zhu, X.-G. Leaf Photosynthetic Parameters Related to Biomass Accumulation in a Global Rice Diversity Survey. Plant Physiol. 2017, 175, 248–258. [Google Scholar] [CrossRef] [PubMed] [Green Version]
- Hamdani, S.; Khan, N.; Perveen, S.; Qu, M.; Jiang, J.; Govindjee; Zhu, X.-G. Changes in the photosynthesis properties and photoprotection capacity in rice (Oryza sativa) grown under red, blue, or white light. Photosynth. Res. 2019, 139, 107–121. [Google Scholar] [CrossRef]
- Trapnell, C.; Pachter, L.; Salzberg, S.L. TopHat: Discovering splice junctions with RNA-Seq. Bioinformatics 2009, 25, 1105–1111. [Google Scholar] [CrossRef]
- Wagner, G.P.; Kin, K.; Lynch, V.J. Measurement of mRNA abundance using RNA-seq data: RPKM measure is inconsistent among samples. Theory Biosci. 2012, 131, 281–285. [Google Scholar] [CrossRef]
- Li, B.; Dewey, C.N. RSEM: Accurate transcript quantification from RNA-Seq data with or without a reference genome. BMC Bioinform. 2011, 12, 323. [Google Scholar] [CrossRef] [Green Version]
- Robinson, M.D.; McCarthy, D.J.; Smyth, G.K. EdgeR: A Bioconductor package for differential expression analysis of digital gene expression data. Bioinformatics 2010, 26, 139–140. [Google Scholar] [CrossRef] [Green Version]
- Xie, C.; Mao, X.; Huang, J.; Ding, Y.; Wu, J.; Dong, S.; Kong, L.; Gao, G.; Li, C.-Y.; Wei, L. KOBAS 2.0: A web server for annotation and identification of enriched pathways and diseases. Nucleic Acids Res. 2011, 39, W316–W322. [Google Scholar] [CrossRef] [Green Version]
- Livak, K.J.; Schmittgen, T.D. Analysis of relative gene expression data using real-time quantitative PCR and the 2−ΔΔCT Method. Methods 2001, 25, 402–408. [Google Scholar] [CrossRef] [PubMed]
- Yang, X.-S.; Su, W.-J.; Wang, L.-J.; Lei, J.; Chai, S.-S.; Liu, Q.-C. Molecular diversity and genetic structure of 380 sweetpotato accessions as revealed by SSR markers. J. Integr. Agric. 2015, 14, 633–641. [Google Scholar] [CrossRef]
- Shen, Y.; Zhang, J.; Liu, Y.; Liu, S.; Liu, Z.; Duan, Z.; Wang, Z.; Zhu, B.; Guo, Y.-L.; Tian, Z. DNA methylation footprints during soybean domestication and improvement. Genome Biol. 2018, 19, 128. [Google Scholar] [CrossRef] [PubMed]
- Leakey, A.D.; Ferguson, J.N.; Pignon, C.P.; Wu, A.; Jin, Z.; Hammer, G.L.; Lobell, D.B. Water Use Efficiency as a Constraint and Target for Improving the Resilience and Productivity of C3 and C4 Crops. Annu. Rev. Plant Biol. 2019, 70, 781–808. [Google Scholar] [CrossRef]
- Agrama, H.A.; Yan, W.; Lee, F.; Fjellstrom, R.; Chen, M.-H.; Jia, M.; McClung, A. Genetic Assessment of a Mini-Core Subset Developed from the USDA Rice Genebank. Crop Sci. 2009, 49, 1336–1346. [Google Scholar] [CrossRef]
- Shi, Y.; Chang, Y.-L.; Wu, H.-T.; Shalmani, A.; Liu, W.-T.; Li, W.-Q.; Xu, J.-W.; Chen, K.-M. OsRbohB-mediated ROS production plays a crucial role in drought stress tolerance of rice. Plant Cell Rep. 2020, 39, 1767–1784. [Google Scholar] [CrossRef]
- Cao, M.; Liu, X.; Zhang, Y.; Xue, X.; Zhou, X.E.; Melcher, K.; Gao, P.; Wang, F.; Zeng, L.; Zhao, Y.; et al. An ABA-mimicking ligand that reduces water loss and promotes drought resistance in plants. Cell Res. 2013, 23, 1043–1054. [Google Scholar] [CrossRef] [Green Version]
- De Angeli, A.; Zhang, J.; Meyer, S.; Martinoia, E. AtALMT9 is a malate-activated vacuolar chloride channel required for stomatal opening in Arabidopsis. Nat. Commun. 2013, 4, 1804. [Google Scholar] [CrossRef] [Green Version]
Publisher’s Note: MDPI stays neutral with regard to jurisdictional claims in published maps and institutional affiliations. |
© 2022 by the authors. Licensee MDPI, Basel, Switzerland. This article is an open access article distributed under the terms and conditions of the Creative Commons Attribution (CC BY) license (https://creativecommons.org/licenses/by/4.0/).