Article

Managing Fertigation Frequency and Level to Mitigate N2O and CO2 Emissions and NH3 Volatilization from Subsurface Drip-Fertigated Field in a Greenhouse

1
State Key Laboratory of Hydrology-Water Resources and Hydraulic Engineering, Hohai University, Nanjing 210098, China
2
College of Agricultural Science and Engineering, Hohai University, Nanjing 210098, China
3
College of Chemical Engineering, Nanjing Forestry University, Nanjing 210037, China
4
Department of Bioresource Engineering, McGill University, Montreal, QC H9X 3V9, Canada
*
Author to whom correspondence should be addressed.
Agronomy 2022, 12(6), 1414; https://doi.org/10.3390/agronomy12061414
Submission received: 5 May 2022 / Revised: 30 May 2022 / Accepted: 10 June 2022 / Published: 12 June 2022

Abstract

:
Agricultural practices such as water and N management can contribute to greenhouse gas (GHG) emissions. Fertigation frequency and level are the two most important factors of irrigation scheduling. Proper irrigation management can establish moderate moist conditions throughout the crop growth period in the root zone and reduce GHG emissions and NH3 volatilization. The main objective was to evaluate the possibility of reducing soil N2O and CO2 emissions and NH3 volatilization without crop yield reduction by manipulating the subsurface-drip fertigation (SDF) frequency and level. An experiment was carried out adopting three SDF frequencies, High-Frequency (7-day, HF), Medium-Frequency (8-day, MF), and Low-Frequency (10-day fertigation intervals, LF), and two irrigation levels, 80% (I80) and 70% (I70) of amount in farmer’s common practice (1500 m3 ha−1). Urea, N > 46.2% at the rate of 90% of traditional fertilization level (270 Kg N ha−1) was injected with irrigation water. Results indicated that soil N2O, CO2, NO3-N, NO2-N, and water-filled pore space increased with fertigation frequency and an opposite pattern for NH4+-N and NH3. HF significantly (p < 0.05) increased crop yield by 45.1% and 49.2% compared to LF, under I80 and I70 levels, respectively. At the same irrigation level, HF was the optimum management practice. Person correlation analysis showed significant correlations between NO2-N and N2O, CO2 and soil temperature, and NH4+-N and NH3. The study suggests that HF of SDF with emitters buried at 0.15 m depth helps to keep high Chinese cabbage yield increases GHG emissions, but is not significant, and decreases NH3 volatilization.

1. Introduction

Water resources are an important factor in ensuring food security. China’s water resources are strained by increasing demand from the rapid development of intensive agriculture [1]. The excessive use of irrigation water has been practiced and caused several environmental problems, such as nitrate leaching (NO3-N), the reduction of water and nitrogen utilization efficiency (WUE, NUE), and the comprehensive greenhouse effect [2,3]. Therefore, it is particularly important to adopt reasonable irrigation techniques and increase the utilization coefficient of irrigation water.
Subsurface drip irrigation (SDI), a water-saving irrigation technology, is widely used worldwide. It offers many advantages, such as: saving water, reducing deep percolation and evaporation, controlling soil water status precisely within the crop root zone, decreasing greenhouse gas (GHG) emissions, and enhancing water and fertilizer use efficiencies [4,5,6]. For example, Kallenbach et al. [7] compared the effects of SDI with flood irrigation (FI) on N2O emissions using a flux chamber method and concluded that SDI reduced N2O emissions by half compared to FI. Maris et al. [5] compared the effects of SDI with drip irrigation (DI) on N2O emissions and reported that SDI decreased N2O emissions by 69.7% and 94.5% in 2011 and 2012, respectively, compared with DI. Meanwhile, nitrogen (N) is another important factor affecting soil nitrogen distribution and thus crop growth, NUE, and GHG emissions. Several previous studies have studied the impacts of different N managements on soil GHG emissions and concluded that higher N application rates generally promote N2O emissions. For instance, Shcherbak et al. [8] studied the response of soil N2O emissions to N fertilizer application and found that higher N application rates generally result in greater N2O emissions. With the development of the economy and the increase of the population, China has become the world’s largest fertilizer user during the past few years, and producers habitually use excessive fertilization to achieve high yields [9]. Therefore, combinations of high-efficiency irrigation technology and fertilization management practices are of great importance to mitigate N2O emissions from the agricultural system while producing high yields.
Irrigation frequency, a key factor of irrigation scheduling, significantly affects soil nitrogen form and distribution, crop growth, GHG emissions, and NH3 volatilization. Generally, the desired irrigation frequency depends on factors such as rainfall, irrigation, crop type, and developmental stage [10,11]. For instance, Beshir [12] reported that irrigation scheduling is a vital management input in the growing crop field to provide optimum soil moisture conditions for proper plant growth and development and optimum yield, water efficiency, and economic benefit. Chafutsa et al. [13] evaluated the yield response of cabbage to various fertilizers under different irrigation frequencies and reported that the irrigation frequency of cabbage varies between 3 and 12 days. Irrigation frequencies of 3 to 7 days’ intervals are common, particularly in the early growth stages, but it might extend up to 7 to 12 days’ intervals at later growth stages. Moreover, optimizing irrigation water application rate could help achieve maximum yield and crop WUE, reduce N2O emissions, and reduce nutrients leaching below the root zone to prevent soil and groundwater pollution and mitigate NH3 volatilization [14]. The amount of irrigation has been shown to influence microbial metabolic processes such as nitrification and denitrification, which are responsible for the release of N2O [14]. Chen et al. [15] investigated the effects of different irrigation amounts on soil CO2, N2O, and CH4 in two growing seasons and concluded that soil N2O emissions increased with increasing irrigation amounts. Holcomb III et al. [16] studied the effect of irrigation rate on NH3 volatilization and revealed that the peak of NH3 volatilization was measured in the lower irrigation rate treatments compared with the higher irrigation rates. Generally, the frequency and intensity of irrigation water application are relatively easy to control, which may provide a chance to improve yield and mitigate N2O emissions simultaneously. However, limited studies have been conducted to understand the effects of irrigation management techniques such as fertigation frequency and level under SDI on GHG emissions under cabbage cultivation. There is a dire need to evaluate the extensive study of fertigation frequency and level with saving water irrigation systems such as SDF for reducing N2O emissions without yield reduction.
Thus, we hypothesized that higher fertigation frequency and level under SDF would result in higher N2O and CO2 emissions and NH3 volatilization due to higher soil moisture content and substrate availability to the soil microbes. The objectives of this study were: (1) to quantify the N2O and CO2 emissions and NH3 volatilization from a subsurface drip-fertigated Chinese cabbage; (2) to evaluate the possibility of reducing these emissions by manipulating the subsurface-drip fertigation frequency and level; and (3) to assess the emissions as a function of the crop to make general recommendations for farmers and policymakers.

2. Materials and Methods

2.1. Descriptions of Study Area

The experiment was carried out in a greenhouse under natural light conditions on Chinese cabbage at Water-Saving Park of Hohai University, Nanjing (31°95′ N, 118°83′ E), Jiangsu province, China, in a suburb of Nanjing at a downstream area of the Yangtze River basin with an average elevation of 15 m above the sea level. The greenhouse was covered by glass and has semi control system supported by shading system on the roof and cooling system in order to reduce heat when the temperature is extreme. The climate of the study area is characterized as humid under the influence of the East Asia Monsoon. The experimental plots were prepared through well-conventional tillage (manually) to a depth of 0.30 m. The soil of the experimental field is clay loam. The soil’s chemical and physical properties are shown in our previous work [17].

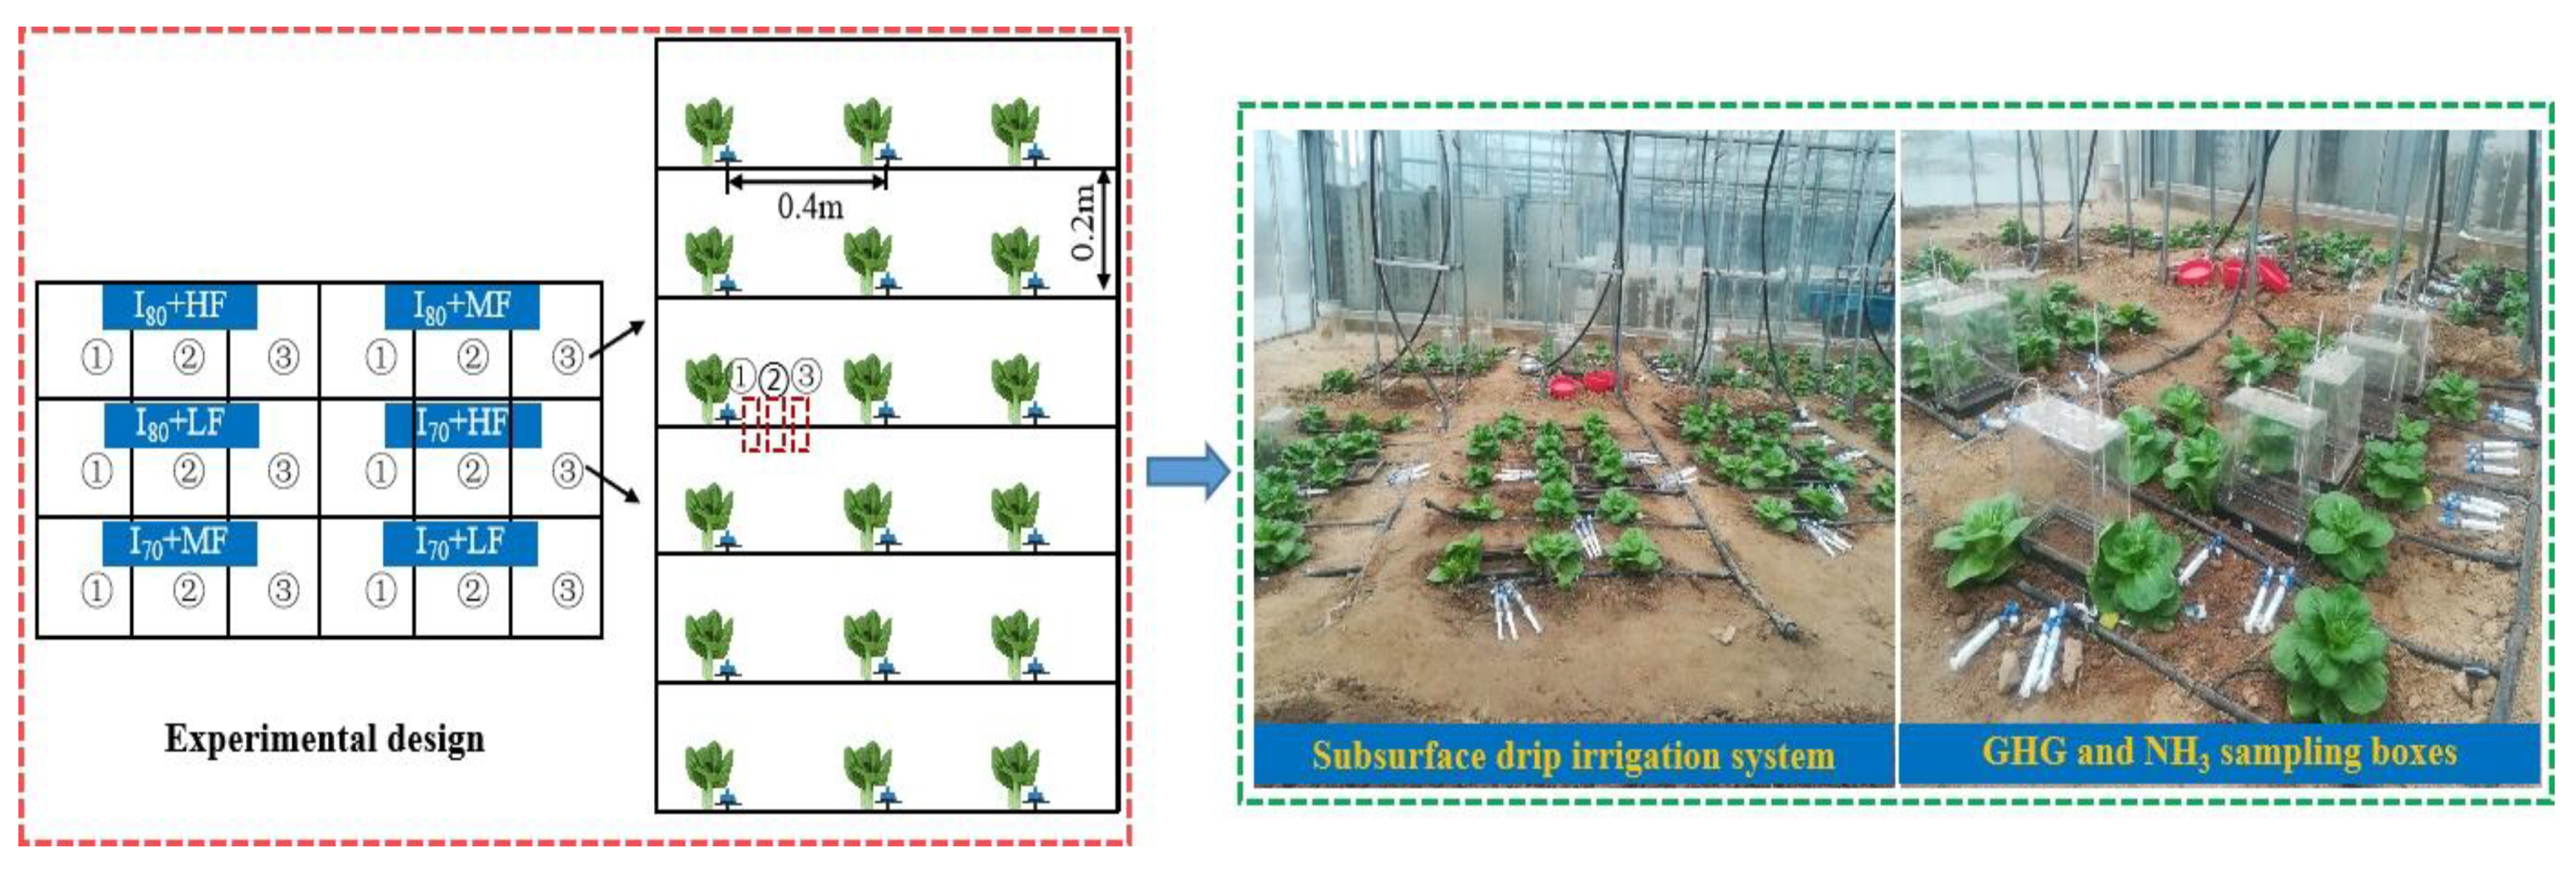
2.2. Experimental Design

The experiment was conducted comprising two experimental factors, three SDF frequencies: High-frequency (7-day fertigation intervals, HF), Medium-frequency (8-day fertigation intervals, MF), and Low-frequency (10-day fertigation intervals, LF), and two irrigation levels: 80% (I80) (1200 m3 ha−1) and 70% (I70) (1050 m3 ha−1) of farmer’s practice (1500 m3 ha−1). Waterproof material with a thickness of 8 mm and a height of 0.50 m was inserted on the ridge of two adjacent plots to reduce the water and N transport between treatments and increase the accuracy and reliability of the research results. A completely randomized block design with six treatments; LF + I80, LF + I70, MF + I80, MF + I70, HF + I80, and HF + I70. The size of each plot area was 0.8 m2 (L × W = 1 m × 0.8 m) approximately. Each treatment had to replicate three plots and be distributed randomly to minimize any effects from the differences between plots, for a total of 18 plots. Chamber bases were mounted in each plot at a depth of approximately 0.05 m and at different horizontal distances of 0.07, 0.14, and 0.20 m (1, 2, and 3) from the emitters (Figure 1). For NH3 measurement, we installed PVC collectors in the center part of each plot to measure NH3 volatilization. Each harboring six lateral lines with a lateral spacing of 0.20 m. Each lateral line has three emitters, spaced 0.40 m apart (Figure 1). Irrigation water was delivered to the plots via a gravity drip system. At the upper end of each plot, a tank in which to store irrigation water was installed at the height of 2 m. Urea-based N-fertilization (N 46.%), Jiangsu Huachang Chemical Co Ltd., Zhangjiagang City, China was incorporated with irrigation water (fertigation) in the water tank, each treatment having a separate drip line.

2.3. Agronomic Practices

The land was prepared, tilled, and leveled using a hand shovel. The soil was thoroughly mixed to raise the beds manually. Two weeks old Chinese cabbage seedlings were transplanted into the experimental plots in 0.2 m line spacing and 0.4 m plant spacing on 10 May 2021 and harvested on 29 June 2021. Surface drip fertigation with emitters buried at 0.15 m depth was applied. Urea-based N-fertilization (N > 46.2%, Jiangsu Huachang Chemical Co Ltd., Zhangjiagang, China) at application rate (270 kg N ha−1) was applied with irrigation water. At the end of the experiment, Chinese cabbage was weighed in the field immediately after cutting the above-ground part of the plants to determine the crop yield. Weeds and insects were controlled whenever necessary.

2.4. Gas Sampling and Analyses

Before running the experiment, three rectangular stainless-steel chamber bases were mounted in each plot at a depth of approximately 0.05 m and different horizontal distances from the emitters. The bases served to mitigate lateral gas diffusion during gas sampling and remained open throughout the crop growing period except during gas sampling. The chambers (length × width × height = 0.20 × 0.10 × 0.20 m) were made of polyvinyl chloride and fitted with thermometers (Figure 1). The chambers were closed by placing them into rings made of stainless steel, which were sunk into the soil. Gas samples were obtained using 10-mL syringes linked to the chambers by a pipe and valve system. During the growing season, the bases of the chambers were left to prevent soil disruption. The samples of gas (N2O and CO2) were obtained between 10:00 and 10:30 a.m. Three gas samples were collected from each chamber at 15-min intervals. During each sampling, air temperatures inside the chambers were recorded using thermometers. A gas chromatograph (Agilent 7890A, Santa Clara, CA, USA) was used to analyze the N2O using an electron capture detector (ECD). While CO2 concentration was measured using a thermal conductivity detector TCD. The average daily emission of each treatment is calculated according to the proportion of wetted body area and the emission weighting of the corresponding distance. Then the cumulative emissions of gases were calculated by integrating daily values along the sampling period [18].

2.5. Ammonia Volatilization Measurement and Analyses

NH3 volatilization loss from each plot was measured via the ventilation method using 0.20 m high PVC collectors (diameter = 0.16 m) located in the central part of each plot, with a sponge moistened with a phospho-glycerol solution as an absorbent [19]. The samples collected in the phospho-glycerol-soaked sponge were immediately immersed in 0.3 dm3 of 1.0 mol dm−3 KCl solution in 0.5 dm3 containers, sealed, and then shaken for one hour. NH3 quantities in the KCl extracted solution were analyzed using colorimetry (λ = 630 nm) using a UV–VIS spectrophotometer (Unico, Shanghai, China). The NH3 volatilization rate was calculated using Equation (1) [20].
R AV = M D · A × 10 2
where: RAV is the ammonia volatilization rate (kg N ha−1d−1), M is the amount of ammonia N collected by the PVC collector (mg), A is the cross-sectional area of the PVC collector (m2), and D is the interval for AV sample collection (days).

2.6. Soil Analyses

In each treatment plot, 20–30 g soil samples were collected using a 0.05 m diameter hand auger from varying depths (0.05, 0.10, 0.15, 0.20, and 0.25 m) and at three horizontal distances from the emitter 0.07, 0.14, and 0.20 m named as point1, point2, and point3, respectively. The samples were immediately taken to the laboratory to determine soil moisture content (θ), determined by the traditional drying method (105 °C, 8 h). Water-filled pore space (WFPS) was then determined by dividing the volume of gravimetric water by the soil’s total porosity ( ϕ ), itself determined by the calculating soil’s bulk density by the following relationship:
ϕ = 1 ρ b ρ p
where: ρ b and ρ p are the bulk density and particle density, respectively. The ρ p was estimated to be 2.65 g cm−3 [21]. A further 10 g of soil was extracted with 1 M KCl solution shaken at 300 rpm for 1 h, and filtered through filter paper (Whatman No. 42). Using the colorimetric method [20,22], the contents of soil ammonium (NH4+-N), nitrate (NO3-N), and nitrite (NO2-N) in the filtrate were measured by colorimetric (λ = 630 nm) using an UV–VIS spectrophotometer (Unico, Shanghai, China). The details are as follows: first, we weighed 10 g of the soil sample, put it into a 100 mL conical flask, then measured 50 mL of 1 M KCl solution, sealed the mouth of the conical flask, and then used a 300 rpm shaking box for 1 h (H). Then left for 4 H at 4 °C. The supernatant was extracted and analyzed by using a flow injection apparatus. For NO3-N and NO2-N, we prepared 3 buffer solutions:
  • E. buffer solution (dilute imidazole in 800 mL of distilled water. Adjust pH to 8.2 ± 0.1 with hydrochloric acid (32%). Add distilled water to 1 L, add Brij35 and mix
  • F. Buffer solution (dilute ammonium chloride in 800 mL distilled water. Adjust pH to 8.2 ± 0.1 with NH3. Add distilled water to 1 L, add Brij35 and mix)
  • G. Color developing solution (dissolve phosphoric acid in 700 mL distilled water, adding sulfonamide and α- Naphthyl ethylene diamine, add distilled water to 1 L and dissolve). For NH3 nitrogen, we have prepared 4 kinds of buffer solutions:
  • A. buffer solution (in distilled water, dissolve potassium sodium tartrate and sodium citrate, set the volume to 1000 mL, add Brij 35 (30%), and thoroughly mix)
  • B. Sodium salicylate solution
  • C. Sodium nitroprusside solution
  • D. Sodium dichloroisocyanurate solution.
In addition, considering the instability of nitrite nitrogen, it is easily oxidized. In order to minimize the error of nitrite, we analyze the concentration of nitrite nitrogen in the extracted water samples within 2 h, and then analyze nitrate nitrogen and ammonium nitrogen.

2.7. Statistical Analysis

Statistical analyses of the data were performed using the IBM-SPSS (IBM-SPSS, 19, Chicago, IL, USA) analytical software package. ANOVA was carried out to test whether the differences between all the treatments were significant at the 0.05 probability level. When the F-test was statistically significant (p < 0.05), mean comparisons were made using the least significant difference (LSD) at the 0.05 probability level. The correlation between the cumulative N2O emissions and NO2-N concentrations, CO2 emissions, and soil temperature, and NH3 volatilization and NH4+-N concentration was analyzed using the Pearson correlation coefficients at the 0.05 probability level.

3. Results

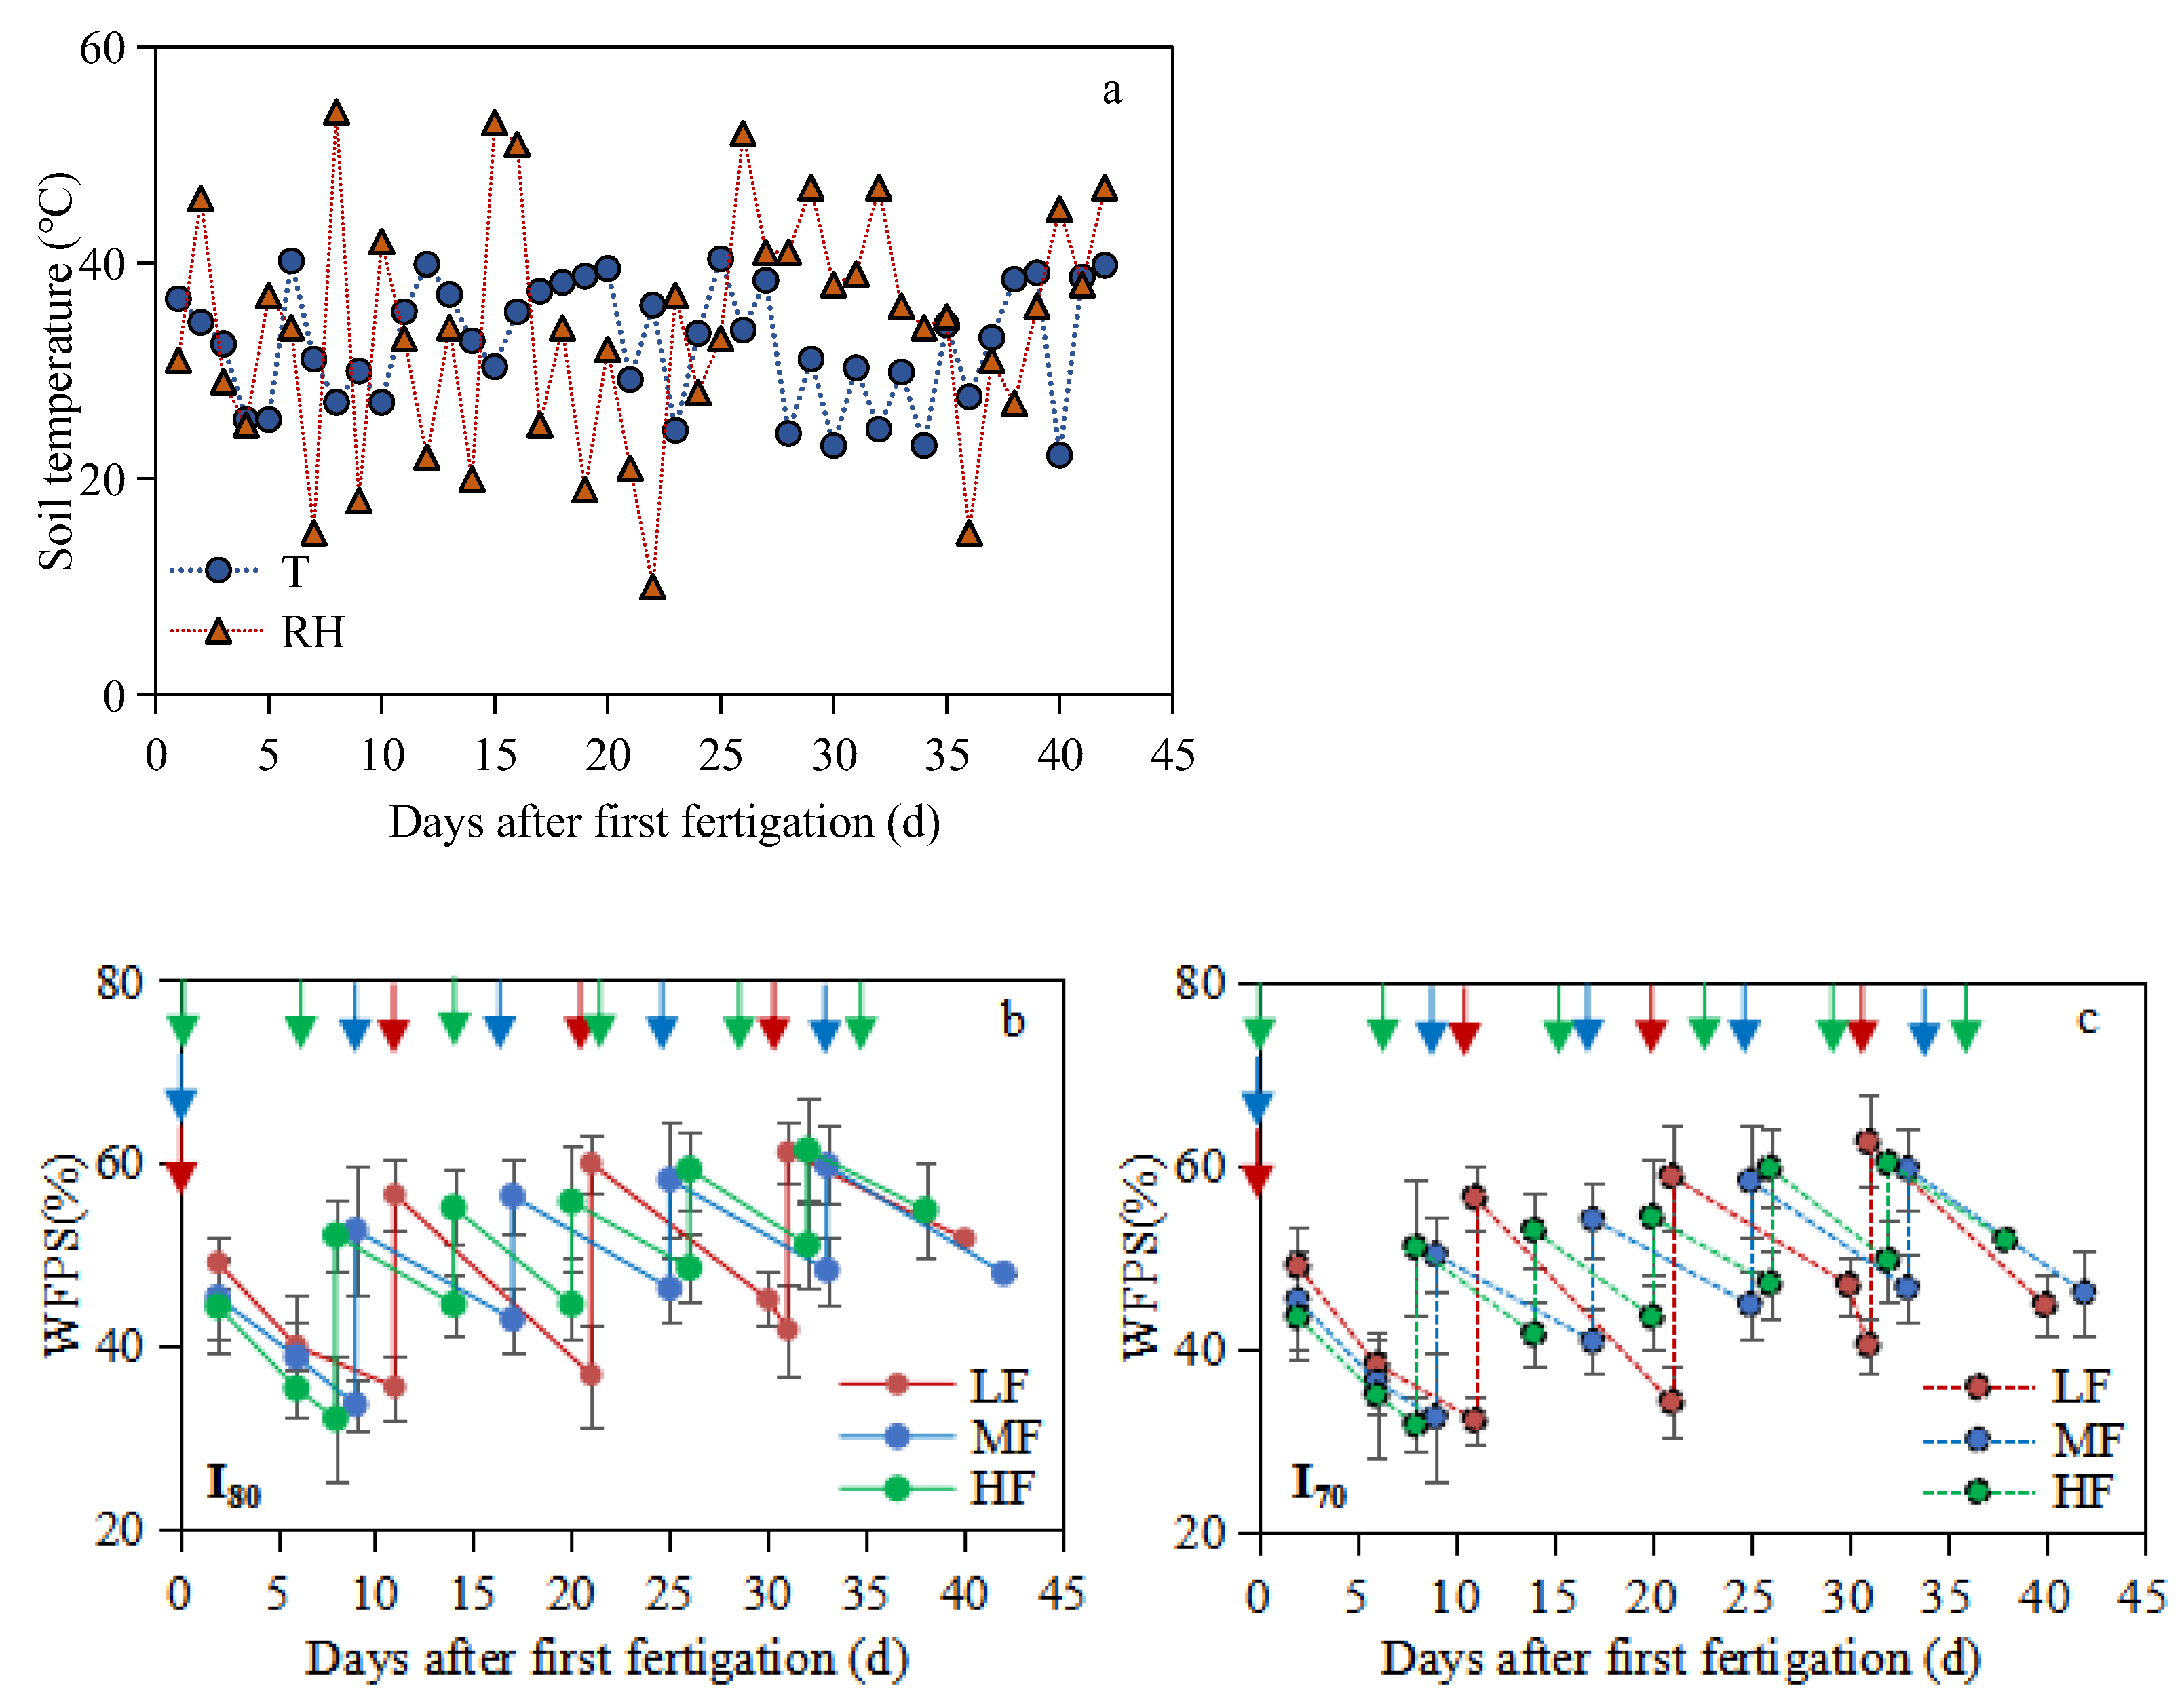
3.1. Soil Temperature, Relative Humidity, and WFPS

Over the whole experimental period, the average daily soil temperature and relative humidity inside the greenhouse were 32.6 °C and 35.3%, respectively (Figure 2a). The highest WFPS were 61.2% and 60.7%, 59.8% and 59.8%, and 61.5% and 60.4% for LF, MF, and HF treatments under I80 and I70, respectively. The mean soil WFPS of 0–0.25 m soil depth was significantly different between treatments under both irrigation levels (p < 0.05), and the WFPS from HF treatment was 2.6% and 1.8%, and 3.1% and 2.1% higher than those from LF and MF treatments under I80 and I70 irrigation levels, respectively (Figure 2b,c).

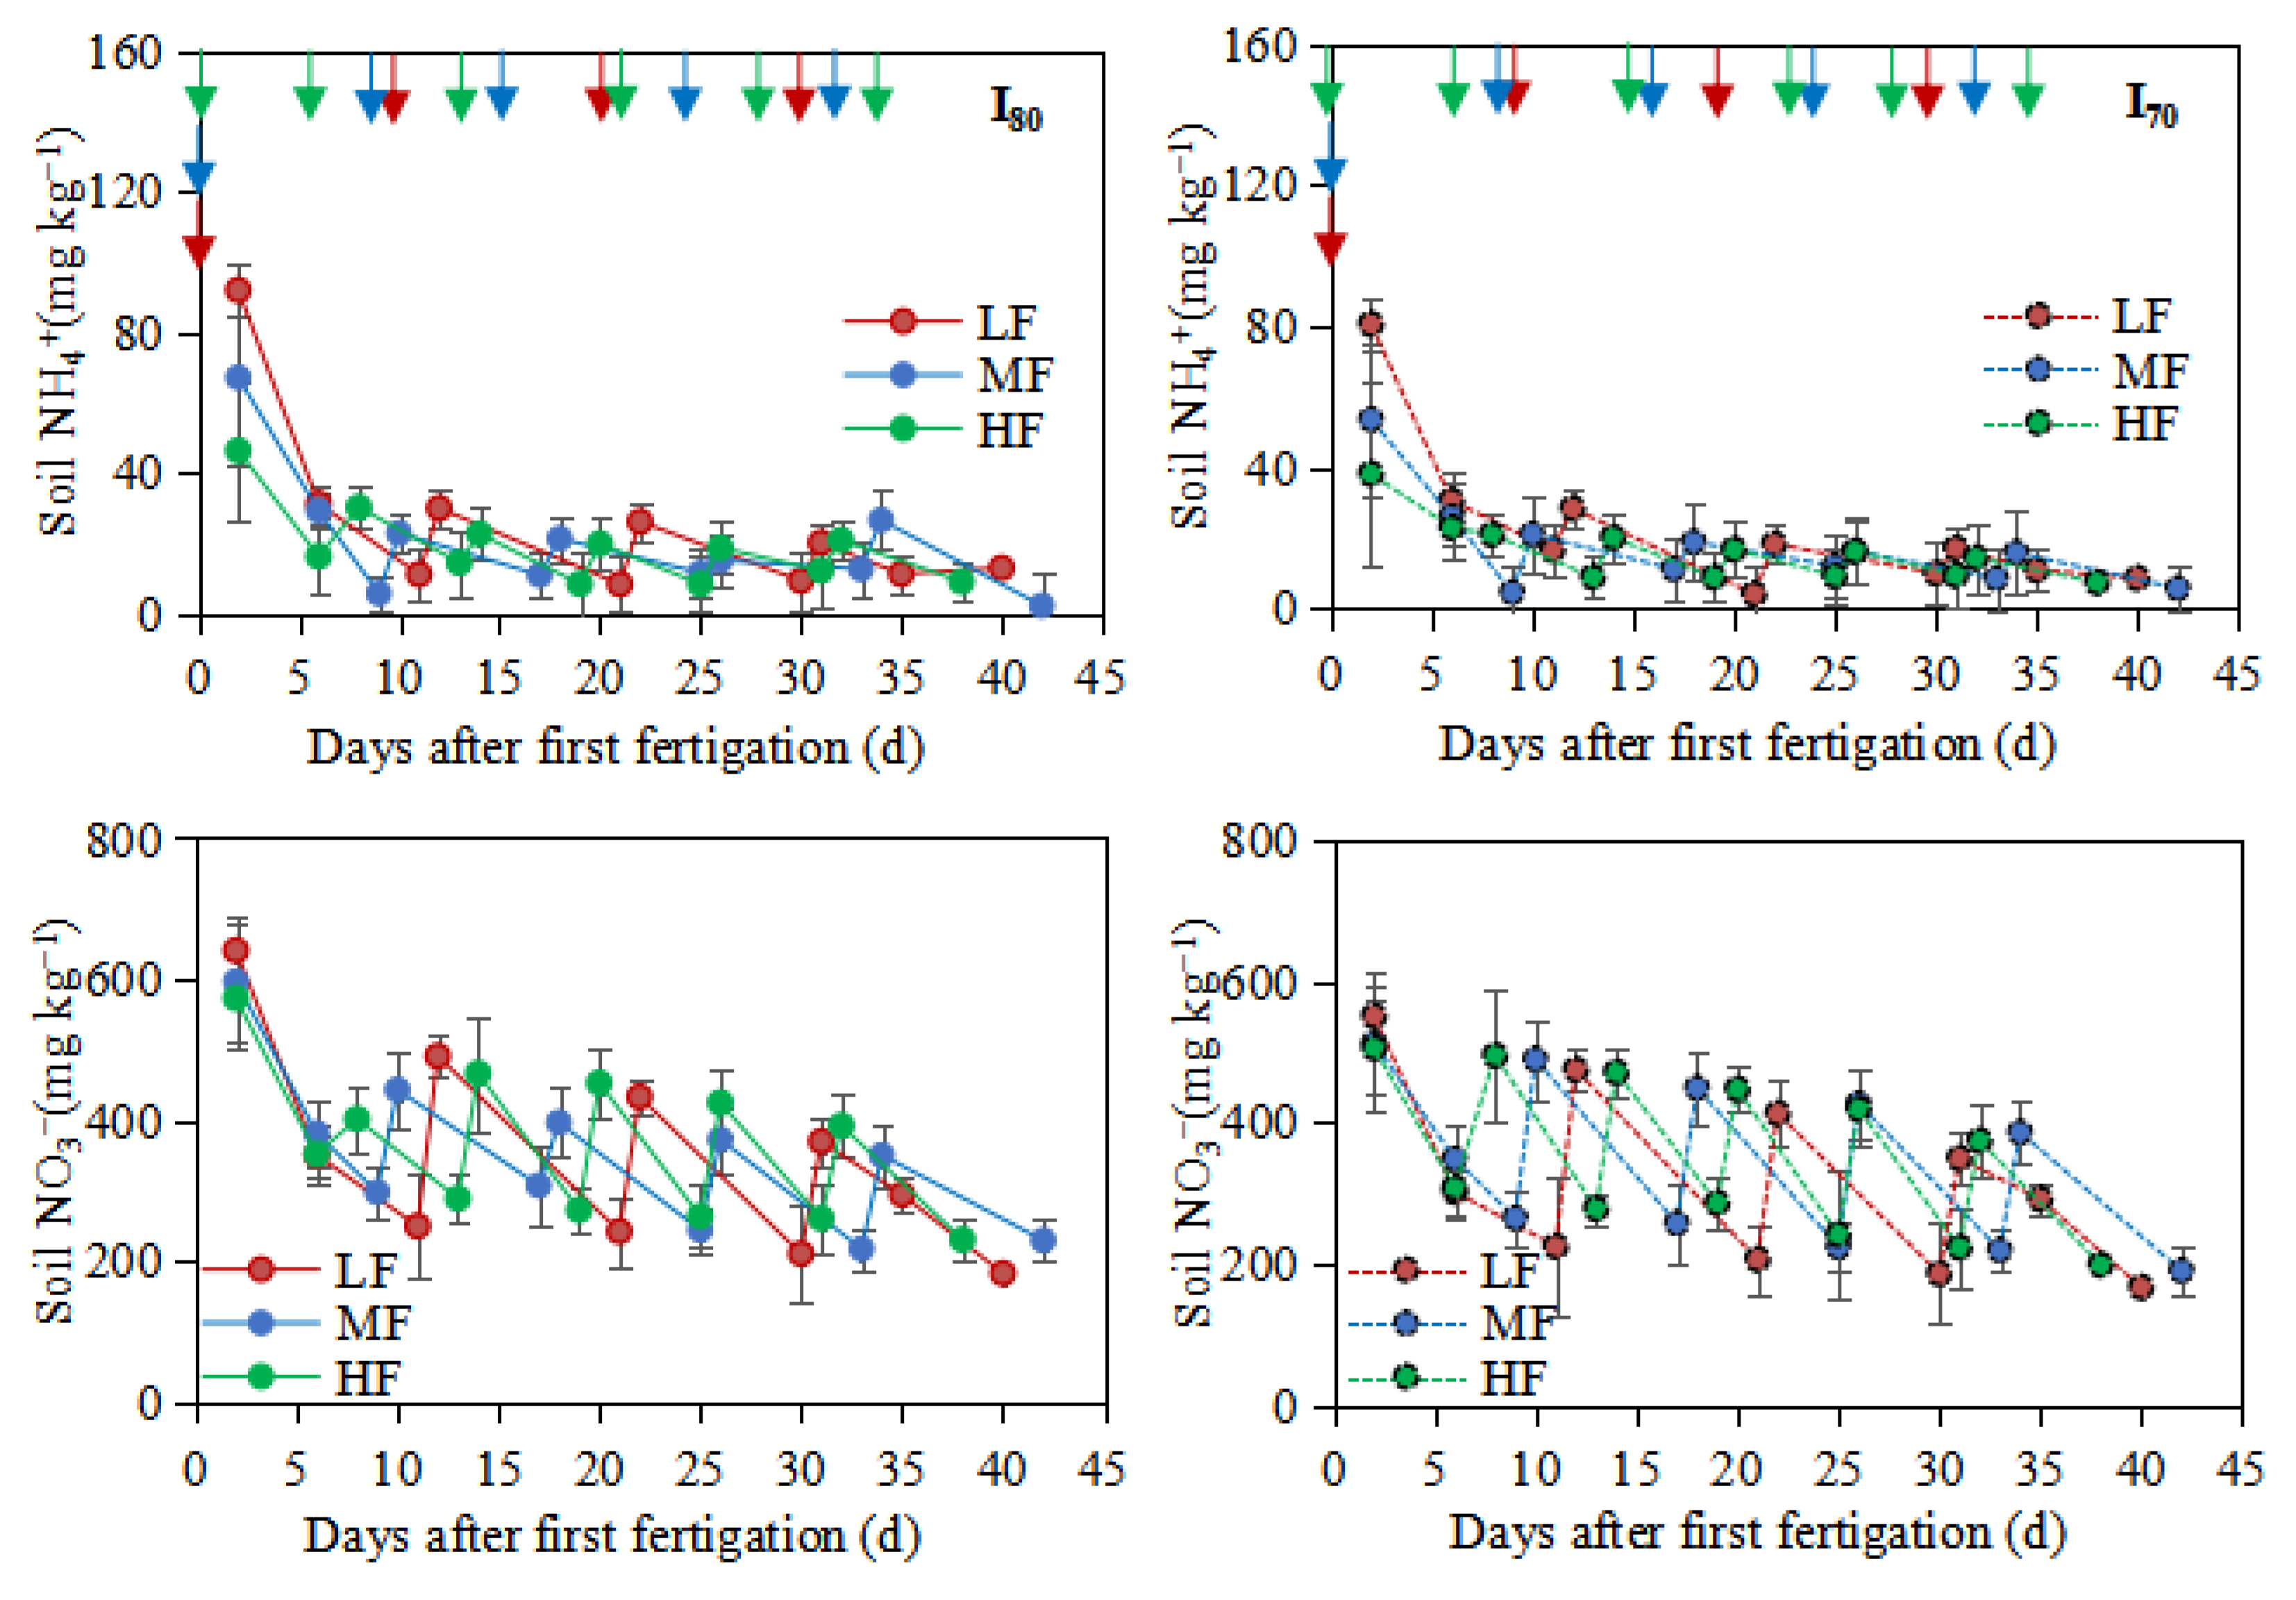
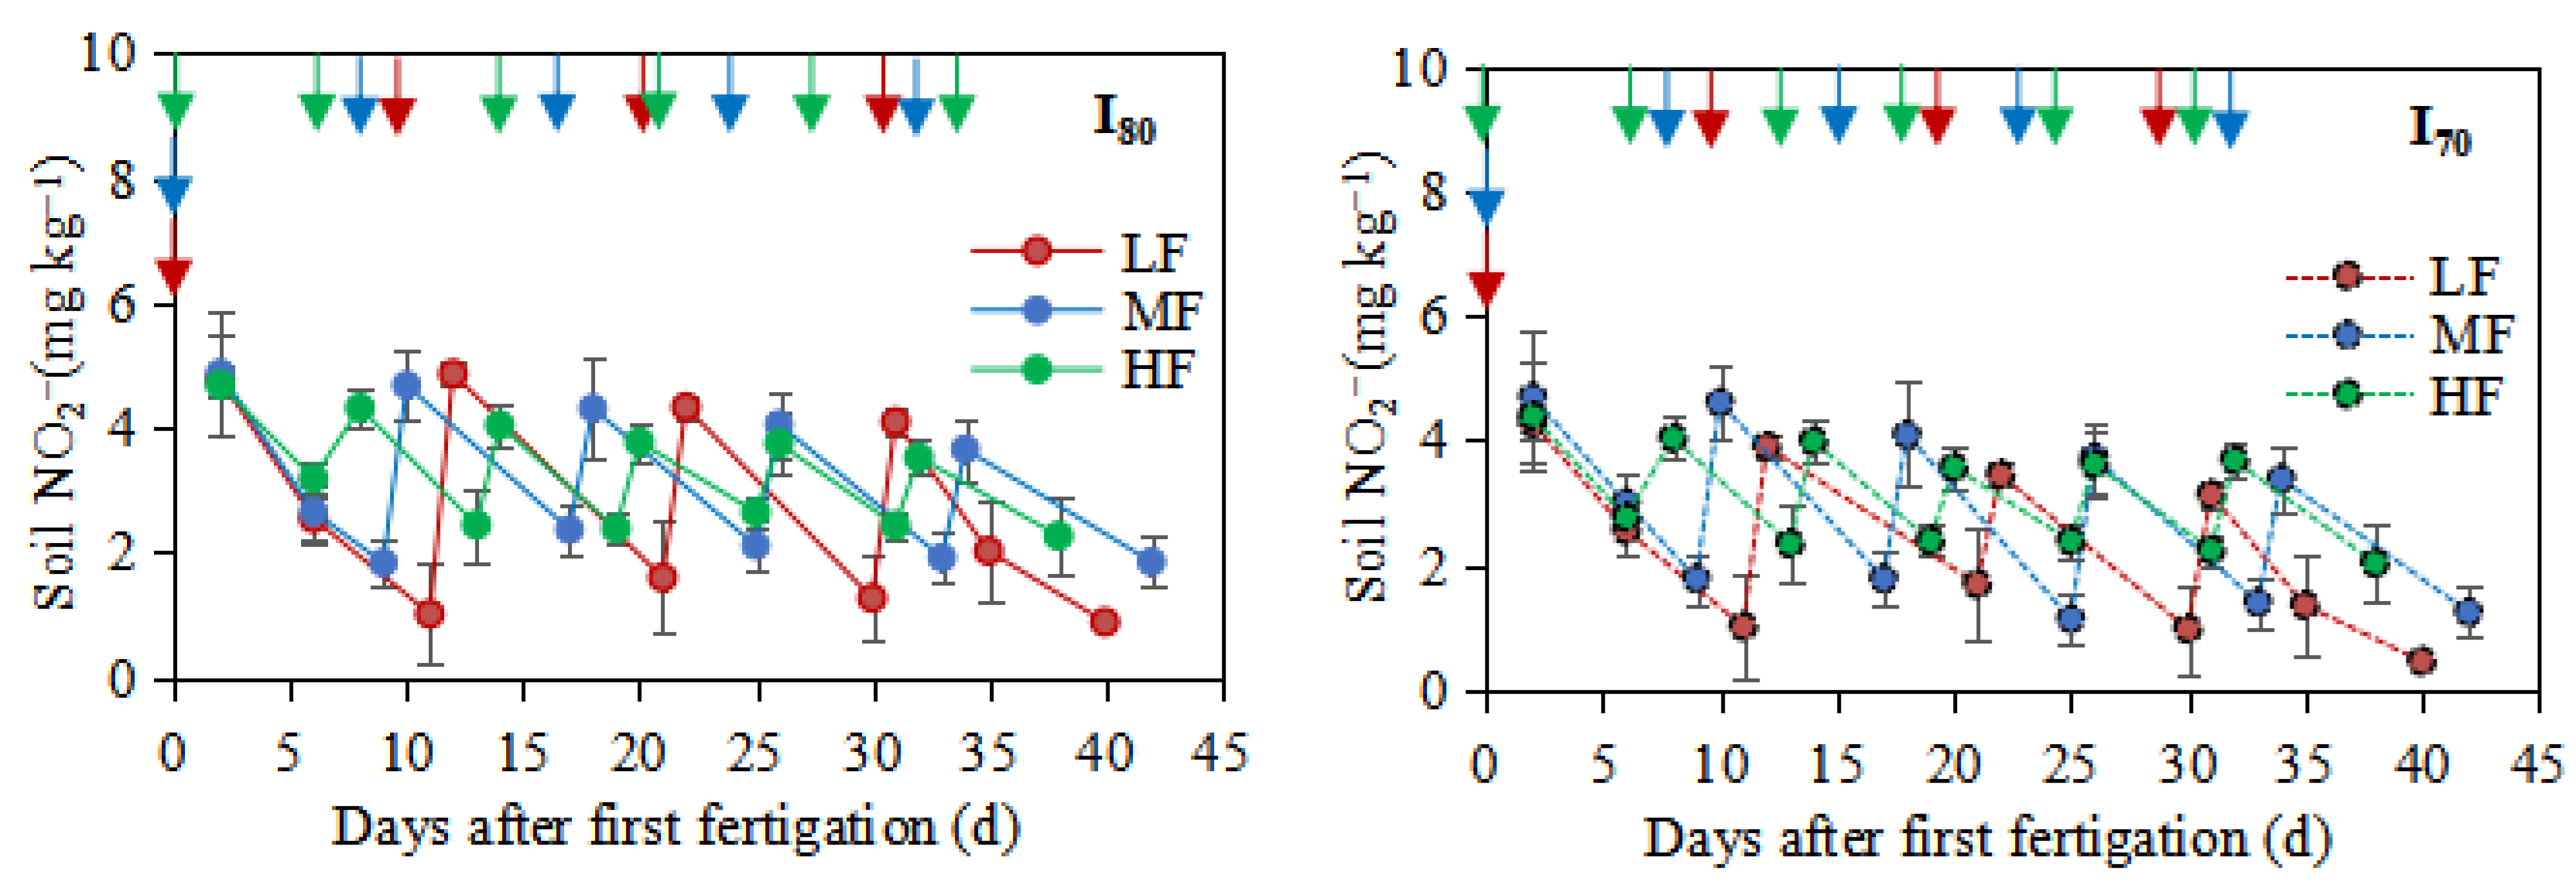
3.2. Soil Inorganic Nitrogen

As shown in Figure 3, the highest NH4+-N concentrations from the LF treatment were significantly higher than those from MF and HF treatments under both irrigation levels (p < 0.05). Generally, NH4+-N concentration was maintained at a high level after the first fertigation, with the largest peaks of 91.8 and 80.6 mg NH4+-N kg−1, 67.0 and 53.7 mg NH4+-N kg−1, and 46.2 and 38.2 mg NH4+-N kg−1 for LF, MF and HF, under I80 and I70, respectively, then the values decreased gradually until to the following fertigation event (Figure 3). Among different fertigation frequencies, the order of mean NH4+-N (0–0.25 m) concentration was: LF > MF > HF, and the values for LF and MF treatments were enhanced by 21.9% and 11.7%%, and 23.9% and 8.5% when compared to HF, under I80 and I70, respectively.
NO3-N showed a similar trend to that of NH4+-N. The pulse NO3-N concentrations were measured immediately after fertigation events in each treatment; then, the values decreased gradually to the next fertigation event (Figure 3). The largest peaks were observed after the first fertigation with values of 641.0, 596.9, and 573.12 mg NO3-N kg−1 for LF, MF, and HF under I80 level; and 551.4, 513.4, and 506.2 mg NO3-N kg−1 under I70 level. Over the whole experimental period, the mean NO3-N concentrations under the I80 level were 346.6, 349.0, and 365.0 mg NO3-N kg−1 for LF, MF, and HF, while under the I70 level were significantly lower, and the sequence as follows: LF < HF < MF. Compared to HF, the concentrations from LF and MF treatments were decreased by 5.3% and 4.6%, and 11.5% and 3.3% under I80 and I70, respectively.
The result indicated a significant difference between fertigation frequencies on soil NO2-N concentrations, and the mean soil NO2-N concentrations at 0–0.25 m soil depth increased with the increase of fertigation frequency (p < 0.05), and the order is as follows: LF < MF < HF. Compared to HF, the values from LF and MF treatments were decreased by 20.7% and 9.4%, and 23.1% and 3.2%, under I80 and I70, respectively. While no significant difference was found in NO2-N concentrations between irrigation levels, the high NO2-N was found within each treatment after the fertigation event and then decreased to the next fertigation event (Figure 3).

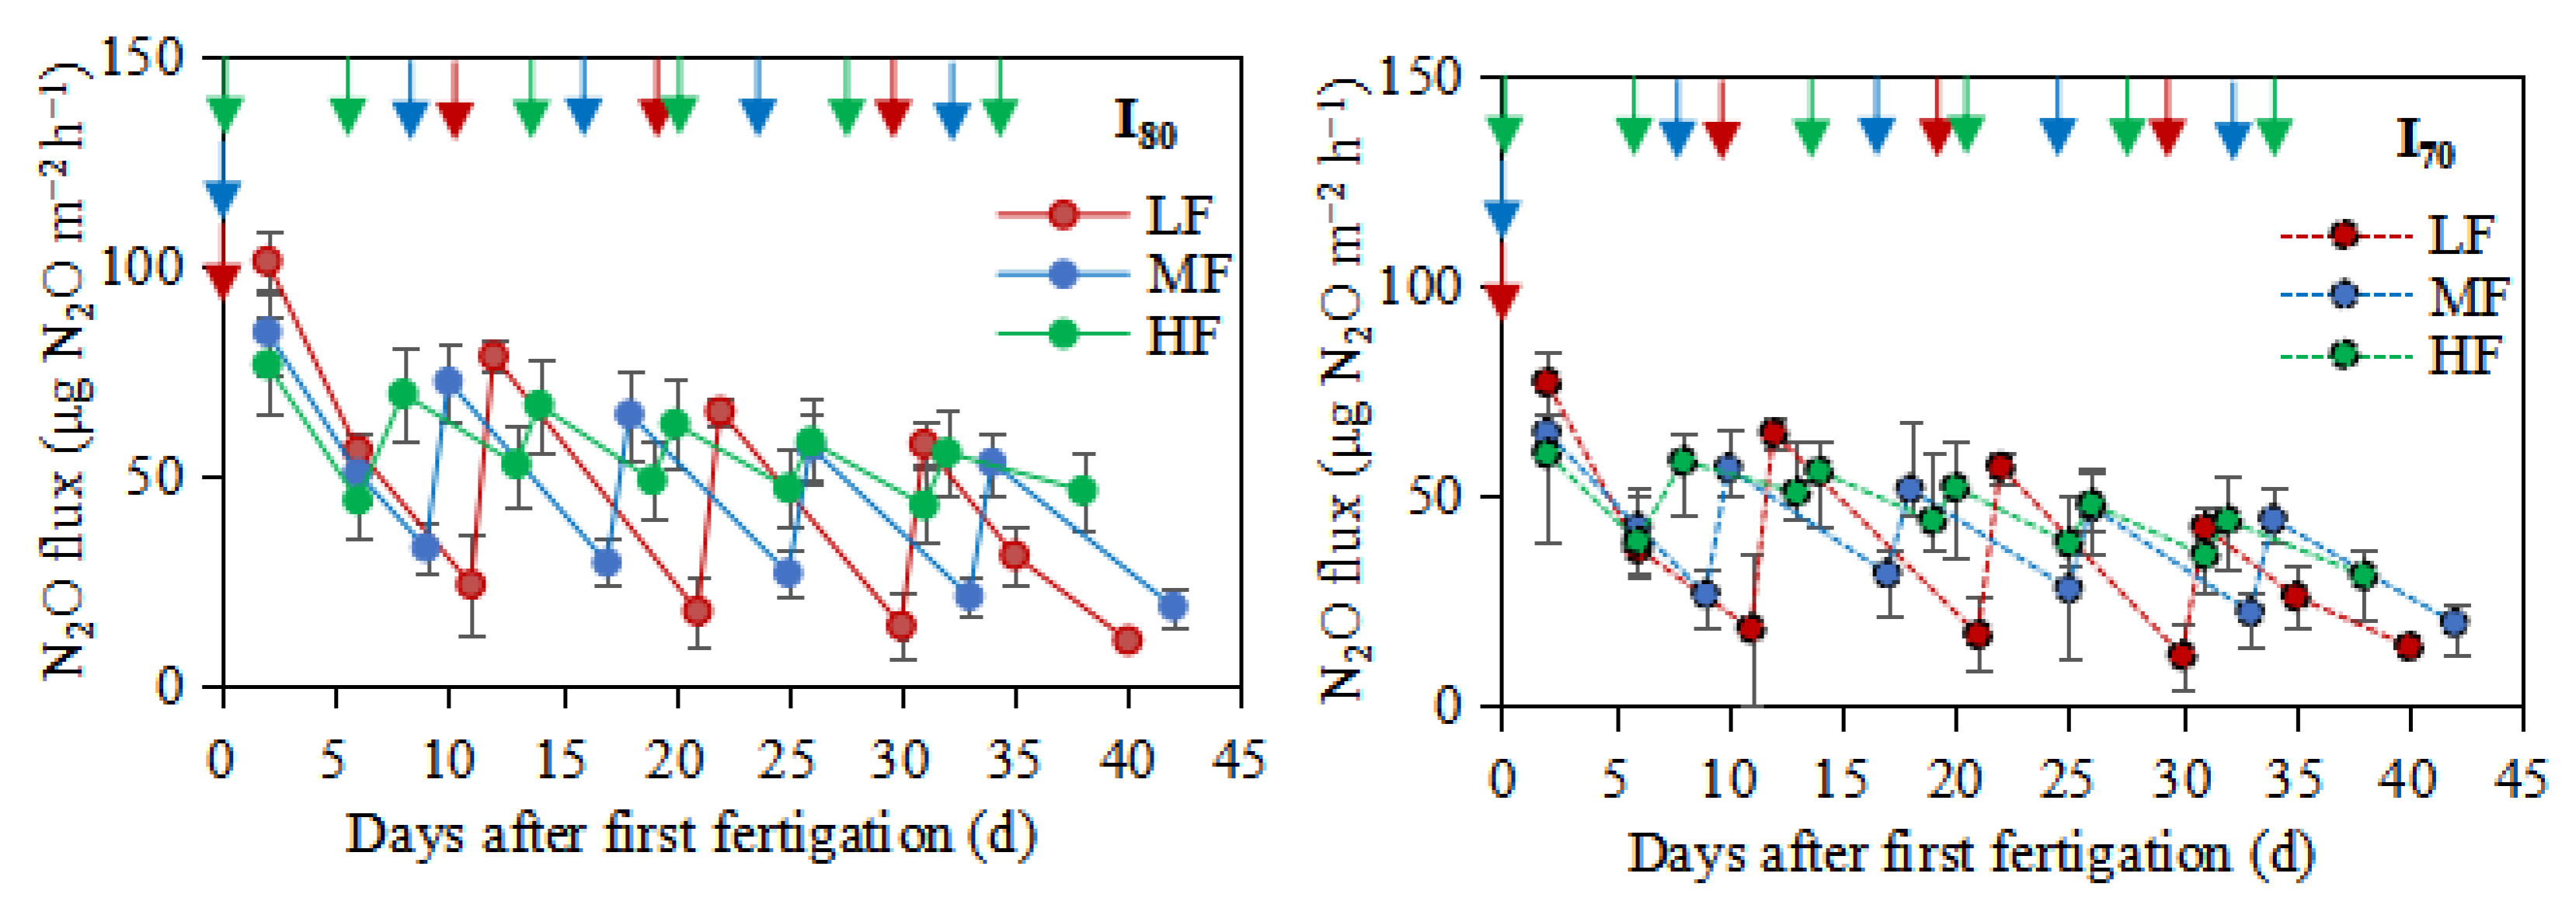
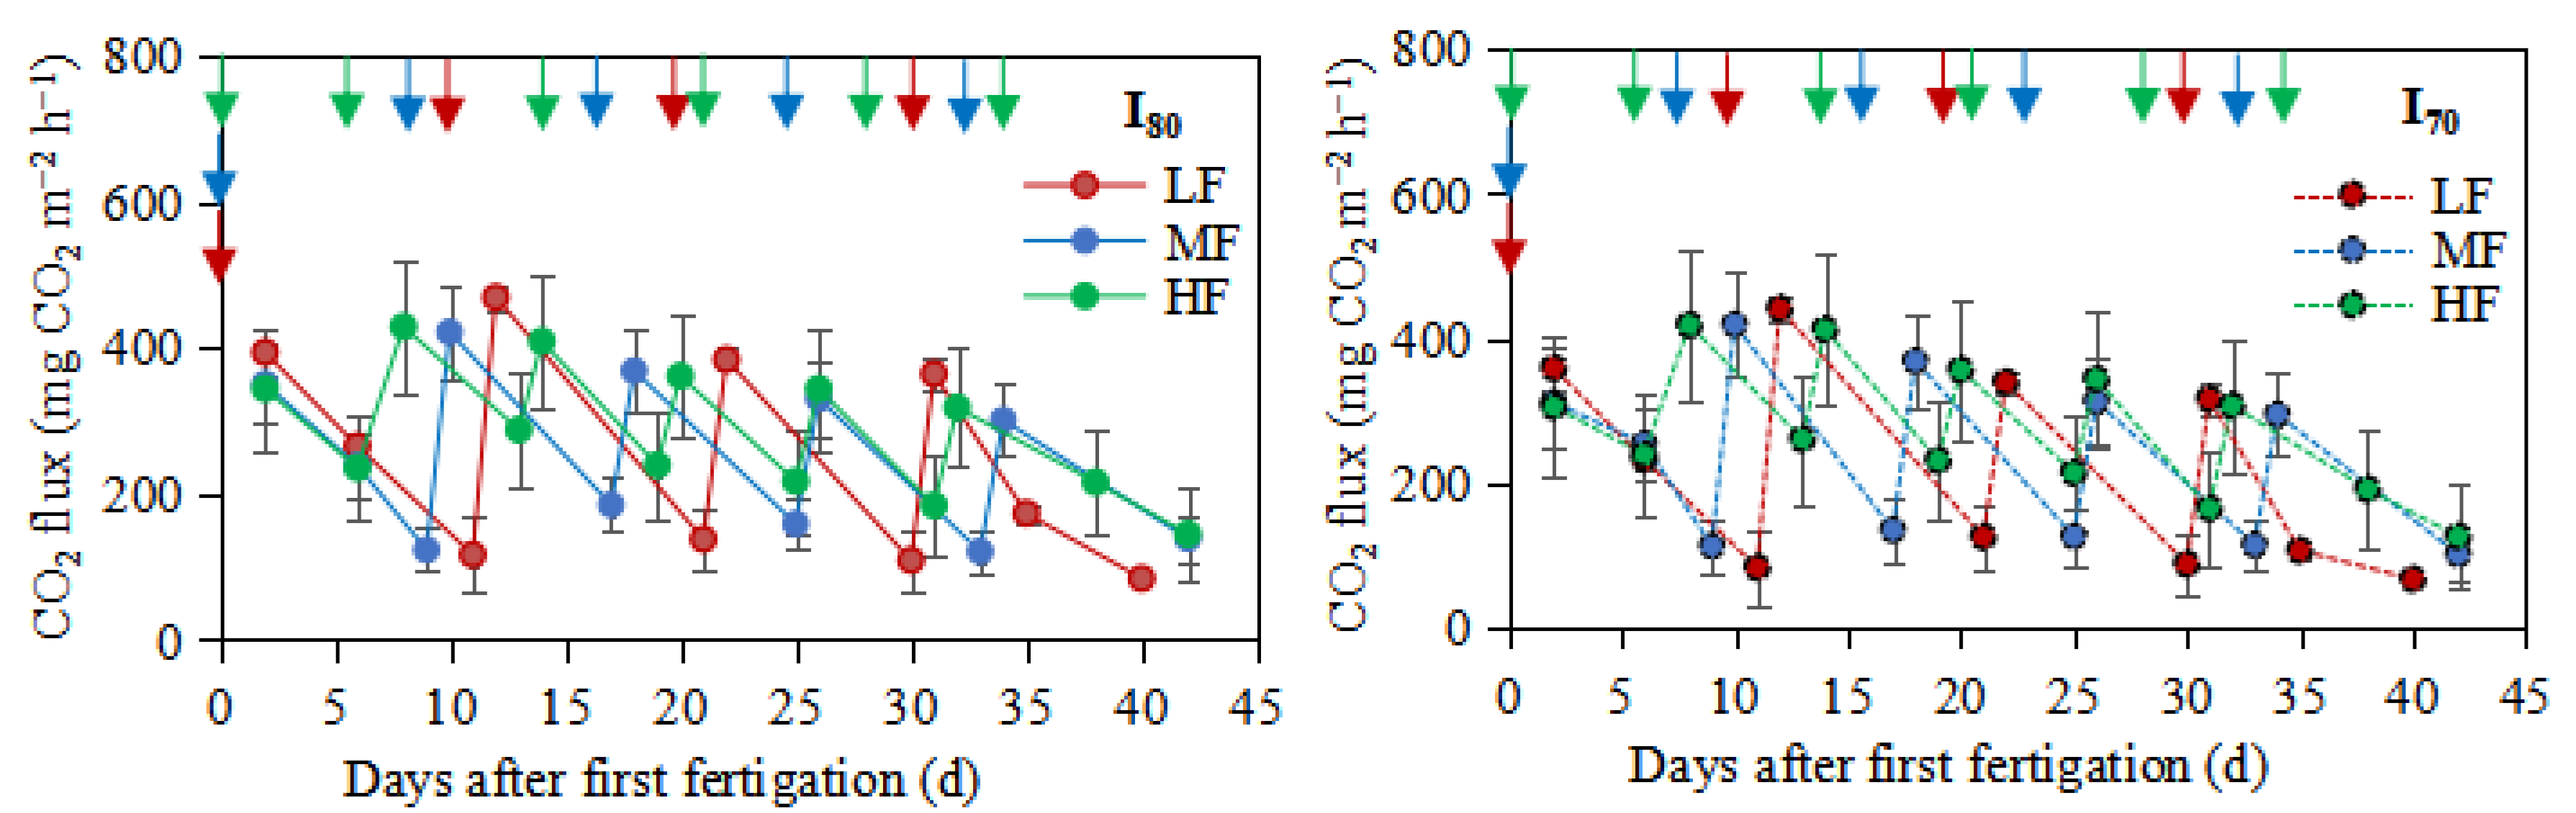
3.3. N2O and CO2 Fluxes

Several N2O peaks were observed after fertigation application (Figure 4). The highest N2O peaks (101.3, 84.3, and 76.5 μg N2O m−2 h−1) and (77.1, 65.1, and 60.1 μg N2O m−2 h−1) were measured after the first fertigation for the LF, MF, and HF under I80 and I70, respectively. It is clear that N2O increased after each fertigation within a short period and then decreased the following fertigation (Figure 4). The largest mean pulses from HF treatment were always observed for distance 1 (0.07 m from the emitter), with the emissions from this zone being significantly higher than those from distances 2 (0.14 m) and 3 (0.20 m) to the emitter (Table 1). Under the I80 level, the mean N2O emissions increased by 1.1% and 1.4% for MF and HF, respectively, compared to LF. In addition, under I70 level followed the same trend with values of 3.1% and 3.5%. Over the whole growing period, the cumulative N2O emissions were (p >0.05) higher for HF treatment under both I80 (57.3 mg N2O m−2) and I70 (46.7 mg N2O m−2) levels (Table 2).
Fertigation frequencies did not significantly affect CO2 emissions, while with the increase in fertigation frequency, the CO2 emissions increased (Table 2). Similarly, the irrigation level also did not significantly affect CO2 emissions, but the values under I80 were higher than I70. As shown in Figure 5, the highest CO2 peaks were 469.0, 421.4, and 428.9 mg CO2 m−2 h−1 for the LF, MF, and HF treatments under I80, respectively. The same trend was noticed under the I70 irrigation level. The result demonstrated that the highest CO2 peak occurred after each fertigation and then decreased with moisture to the next fertigation event (Figure 5). Under I80, the emissions from a distance 1 were significantly higher than those from distances 2 and 3 (Table 1). The cumulative CO2 emissions were (p > 0.05)higher for HF treatment, under both I80 (318.39g CO2 m−2) and I70 (308.05g CO2 m−2) irrigation levels, in comparison with MF and LF treatments (Table 2).

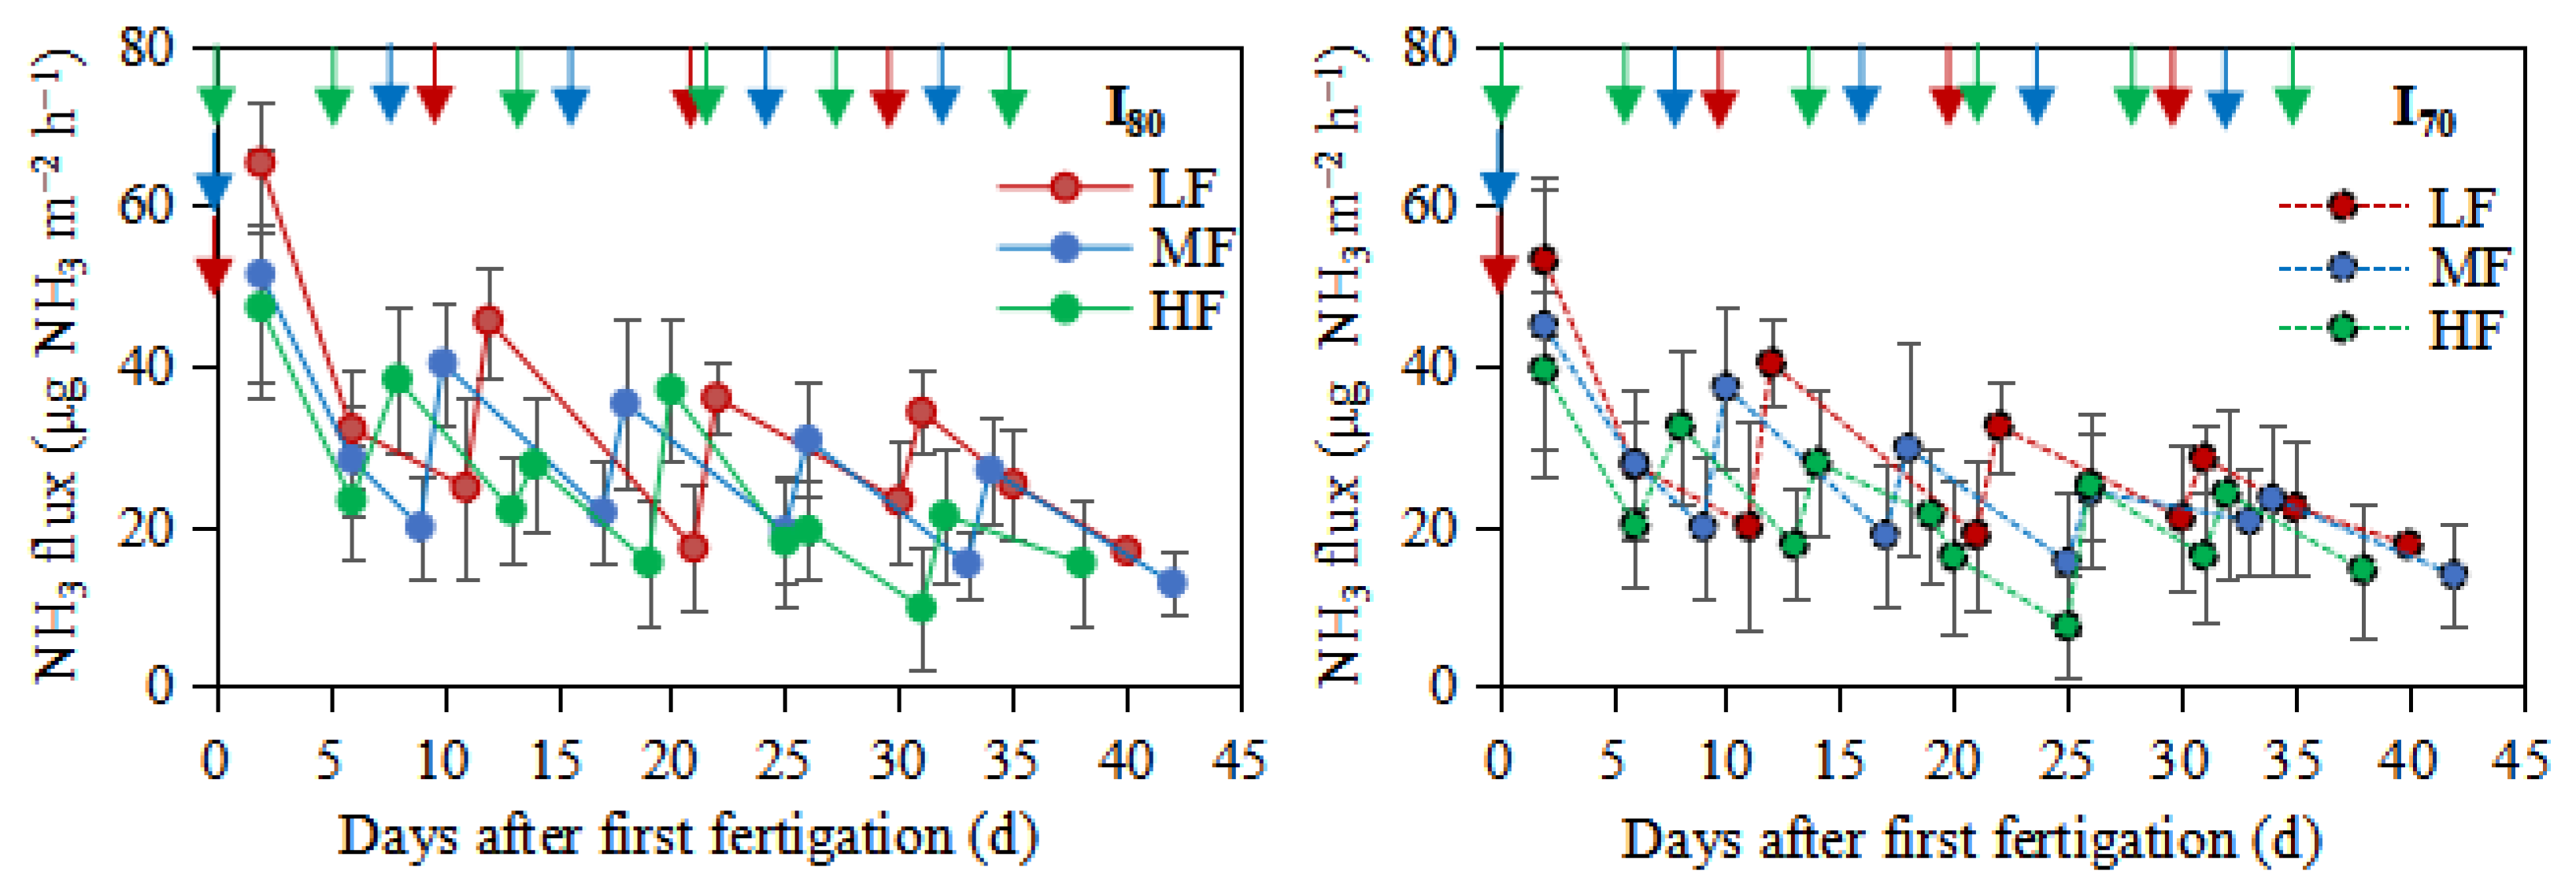
3.4. NH3 Volatilization

As shown in Figure 6, the peak NH3 from all treatments generally occurred after each fertigation, then decreased until the following fertigation event. Over the whole experimental period, the highest NH3 peaks (65.3, 51.46, and 47.33 μg NH3 m−2 h−1) and (53.1, 45.01, and 39.51 μg NH3 m−2 h−1) were observed immediately after the first fertigation for the LF, MF, and HF under I80 and I70, respectively. The cumulative NH3 emissions from HF treatment were significantly lower than those from LF and MF treatments (p < 0.05), but no significant differences were observed between LF and MF treatments (Table 2).

3.5. Crop Yield and Yield-Scaled Global Warming Potential

HF treatment significantly increased Chinese cabbage yield by 31.0% and 20.6% for I80 and 41.5%, and 20.8% for I70 irrigation levels. As expressed on a CO2-equivalent basis, global warming potential (GWP) incorporates GHGs to exhibit a production system’s overall global warming impact and each GHG’s contribution to the global warming process. The current study showed that HF reduced GWP/Y by 1.9% and 6.1% for I80 and I70, respectively, relative to LF (Table 3).

4. Discussion

4.1. Effect of Subsurface Drip Fertigation Frequency and Irrigation Level on Soil Inorganic N

Both irrigation frequency and level significantly affected inorganic N concentration [23,24,25]. In the current research, the LF and MF treatments increased NH4+-N concentration by 21.9% and 11.7%, and 23.9% and 8.5% under I80 and I70 levels, respectively, compared to HF. That might be explained by the fact inadequate moisture content limited the transformation of NH4+-N to NO3-N, resulting in an availability of NH4+-N concentration in the soil under LF and MF treatments compared to HF. The result is supported by Liu et al. [26], who found that insufficient soil water limited the downward movement of soil NH4+-N, and therefore more NH4+-N ions are readily emissions. Meanwhile, the current results showed that the mean soil NO3-N concentration increased with fertigation frequency. This agrees well with Chang et al. [23], who showed that soil NO3-N concentration increased with increases in irrigation frequency by studying the effects of irrigation levels and irrigation frequencies on soil NO3-N, tomato growth, and yield. The largest effect of NO3-N leaching was achieved by improved water management, which was significantly different from the other strategies [27]. In the current study, subsurface drip fertigation with emitters buried at of 0.15 m was used, and the average soil moisture under the I80 level is mainly maintained at 32.2~61.5% WFPS; Under the I70 level, the soil moisture was mainly maintained at 31.8–61.2% WFPS which is aerobic condition it is confirmed by the existing literature that in the range of 30–90% WFPS, for example [28] found nitrification an important source of N2O released from the soil at low soil water contents (<62% WFPS). The microbial activity increases with the increase of soil moisture, which is more conducive to the nitrification process, that will transform NH4+ to NO3, thus producing and releasing N2O into the atmosphere. For example Hosono et al. [29] reported that N2O was produced at WFPS values ranging from 30% to 90% but reached a peak near 60% WFPS. Since the WFPS of our study were generally less than 70% WFPS, we assume the majority of N2O measured was produced from aerobic nitrification.

4.2. Effect of Subsurface Drip Fertigation Frequency and Irrigation Level on N2O and CO2 Emissions and NH3 Volatilization

Soil moisture is a key factor affecting N2O emissions in agricultural soils [30,31,32]; It can promote the movement of the soil matrix and create a good micro-environment for microorganisms activities that mediate N2O production [21]. The studies indicate that less frequent irrigation events lead to lower N2O emissions, though the amount is dependent upon local climate. A likely mechanism for this trend is that less frequent water application allows more time for oxygen to penetrate into the soil matrix between irrigation events, which would favor microbial nitrification; when the soil water content is low enough, these factors lead to a suppression of all microbial activity in the soil and hence an overall decrease in N2O emission [29]. Moreover, in the current study, soil N2O emissions from HF treatment were higher than those from LF and MF treatments under both irrigation levels. That is because HF fertigation increases the number of dry-wet alternations, resulting in more O2 entering the soil and promoting soil nitrification. For example, Han et al. [33] studied the effects of different irrigation regimes on N2O emissions in greenhouse tomato fields. They found that irrigation frequency was associated with higher irrigation amount, which would induce more frequent dry-wet cycles and cause the greatest N2O emissions. On the other hand, HF causes increases in soil moisture and reduces O2 concentrations, thus inducing nitrifier denitrification and denitrification. Additionally, the results are supported by Schindlbacher et al. [34], who demonstrated that N2O emission is positively related to soil moisture content. Generally, when the soil moisture is less than 80%, the soil is in aerobic condition [26]. However, under the condition of high water content, on the one hand, the relatively significant alternation of dry and wet may create a good microenvironment for microorganisms. On the other hand, the higher water content promotes the migration of soil nitrogen [35], which may promote the increase of microbial activity and its energy matrix source, thus leading to the increase in N2O emissions.
Soil CO2 emissions originate primarily from plant roots and microbial respiration [36]. Soil moisture content is one of the factors with a higher impact on CO2 fluxes from soils [37]. Our study demonstrated that fertigation frequency showed a p > 0.05 effect on CO2 emissions. The MF and HF irrigation treatments increased CO2 emissions by 0.6% and 10.4%, and 3.0% and 12.9% under I80 and I70 levels, respectively, compared to LF. This may be because MF and HF fertigation resulted in more uniform soil moistening throughout the entire research period. Uniform humidity (without excesses and deficits of water) contributes to the balanced development of microorganisms that were constantly involved in the transformation of soil nitrogen and supplied in the form of fertigation. At the same time, the soil enzymatic activity of microorganisms resulted in higher CO2 emissions. The peak WFPS of the current study is about 61.5%, close to the optimum 70% for stimulating microbial activity and enhancing root respiration, thereby increasing CO2 emission. The result is in line with Abalos et al. [38] and Sapkota et al. [39], who reported that increased soil water content accelerates microbial respiration of the soil, which enhances CO2 flux. The findings are also coherent with [38], who stated that high-frequency irrigation significantly increased CO2 emissions. Furthermore, evidence is shown by the positive correlation between WFPS and CO2 fluxes and significantly higher emissions measured from the zone close to the emitter point.
The main source of NH3 volatilization worldwide comes from the agriculture system. It does not only reduce the utilization rate of nitrogen fertilizer but also leads to the waste of resources and environmental problems [40]. Two factors affect the NH3 volatilization from the viewpoint of agricultural practices. One is the rate of N fertilizer used for each application, and the other is the water depth at the time of the application of N fertilizer [41]. The present study showed that NH3 volatilization was significantly affected by fertigation frequency and level. Compared to LF, HF fertigation significantly decreased NH3 volatilization by 28.1% and 22.7% under I80 and I70 levels (p < 0.05), respectively. This may be attributed to the low soil moisture under LF limited microorganisms activates to transform NH4+-N to NO2-N, and thus enhanced NH3 volatilization. The result is in line with Liu et al. [26], who concluded that the lack of adequate soil water content restricted downward transport of NH4+-N in the soil and thus rendered applied NH4+-N readily available for NH3 volatilization. Increased irrigation decreased NH3 losses from volatilization [16]. Further, the NH3 volatilization rate is affected by NH4+-N concentration. The Pearson correlation analysis demonstrated a strong and positive correlation between NH3 volatilization rate and NH4+-N concentration (R2 = 0.75, p < 0.05) (Figure 7), which agreed well with other literature [22,42,43]. We speculate that insufficient soil water limits NH4+-N movement to NO3-N, thus promoting NH3 volatilization [42].
Similarly, a positive correlation was found between N2O fluxes and NO2-N concentrations (R2 = 0.8, p < 0.05) (Figure 7). This likely indicates that microbial processes are responsible for the N2O produced by NO2-N. The result is consistent with the findings of Maharjan and Venterea [43] and Li et al. [22], who revealed a significant positive correlation between N2O fluxes and NO2-N. Furthermore, the correlation analysis showed that CO2 flux positively correlated with soil temperature. On the other hand, air temperature also increases CO2 emissions (Figure 7). This is because the temperature is one of the most important factors affecting the activity of microorganisms and soil respiration. The study by Kamali et al. [44] investigated the impacts of wind erosion and seasonal changes on soil CO2 emission and found a positive correlation between air temperature and CO2 emission.

4.3. Influence of Subsurface Drip Fertigation Frequency and Irrigation Level on Chinese Cabbage Yield

Badr and El-Yazied [45] conducted the effects of N application rates and fertigation frequencies on tomato yield and concluded that high-frequency fertigation is a vital management variable for subsurface drip-fertigation tomatoes. El Naim and Ahmed [46] investigated the effect of irrigation intervals and inter-row spacing on the yield and WUE of the sunflower. They observed that irrigation every 7 days increased the head diameter of the sunflower. Chafutsa et al. [13] evaluated the yield response of cabbage to various fertilizers and irrigation frequencies and found that cabbage irrigation is carried out every 3 to 12 days, depending on the environment, crop development, and soil type. Similarly, fertigation intervals of 3 to 7 days are common, especially in the early growth stages, but they can extend up to 7 to 12 days. In the current research, the yield from HF fertigation treatment (7-day fertigation intervals) was 31.0% and 20.6%, and 41.5% and 20.8% higher than those from the LF and MF treatments, under I80 and I70 irrigation levels (p < 0.05), which is more consistent with the conclusion that fertigation with an interval of 7 days can increase crop yield [13]. This may be due to the fact that high-frequency fertigation provides suitable conditions for crop roots to uptake water and nutrients more easily. On the other hand, high-frequency fertigation could increase the soil dry-wet alternating process and promote the increase of soil O2 concentration. Both reasons together may account for the increased crop yield in HF treatment. Silber et al. [47] found that high-frequency fertigation may improve crop performance due to increased nutrient and water availability by examining the effects of fertigation frequency and potassium application rate on bell pepper growth. Similarly, Wang et al. [48] studied the effect of irrigation frequency on potato root distribution and yield. They pointed out that increasing the irrigation frequency can help plant roots better absorb water in the soil, which is beneficial for improving the yield of crops. In addition, our study indicated that the crop yield under high irrigation level (I80) were higher than those under low irrigation level (I70); this indicates that I80 creates favorable moisture conditions in the crop root zone, which enables crop roots to uptake water and nutrient to the plant. This is consistent with the findings by Chafutsa et al. [23] and Gu et al. [49], who indicated that a higher amount of irrigation could increase crop yield due to better soil moisture conditions. These results implied that a proper irrigation technique and scheduling should be recognized as keys to increasing crop production on a sustainable basis.

4.4. The Implications of Subsurface Drip-Fertigation Management

As one of the largest vegetable production countries globally, China’s annual planting area of Chinese cabbage is about 2.7 million ha, accounting for about 15% of the total planting area of vegetables in China. According to the current results, if SDF with fertigation at a 7-day interval (HF) is applied, when irrigation water is under 80% of the traditional irrigation level (1200 m3 ha−1), the NH3 volatilization will be reduced by 758.9 t, and the yield will increase by 1.2 × 10⁹ t, compared to LF. These results imply that a reasonable irrigation schedule (fertigation frequency and irrigation level) of SDF can alleviate the environmental impacts under high N load and helps reduce the comprehensive greenhouse effect of GHG emissions, NH3 volatilization, and realize cleaner production in greenhouse cabbage cultivation. However, there are still some difficulties that need to be solved in the process of transforming and popularizing these technical achievements. For example, the cost of drip irrigation pipes and fertilizer tanks needs to be controlled, which can be realized by developing corresponding integrated water and fertilizer devices. In addition, large-scale training and publicity are required for farmers to understand and accept the importance of this management measure as soon as possible. Training groups should be established to create conditions for the continuation of training. From the practical viewpoint of this research, the findings demonstrated that high-frequency fertigation treatment (7-day fertigation intervals) generally caused the lowest yield-scaled global warming potential (Y/GWPs) and NH3 volatilization losses compared with MF and LF, regardless of irrigation levels. These results likely suggest that the management strategy of “small amount and several times” of SDF could increase yield-scaled global warming potential and reduce NH3 volatilization and should be a promising strategy for farmers and decision-makers to achieve an acceptable yield while maintaining the environment. Moreover, the results are mainly based on a plot experiment with three subsurface drip-fertigation frequencies and two irrigation levels on GHG emissions, NH3 volatilization, and yield. As climate conditions and soil characteristics will be largely varied among different regions, similar research in field experiments with more crops and water-fertilizer management is needed to investigate the most suitable irrigation-fertilization scheduling for different crops under the background of climate change, with the characteristics of low cost, increasing crop production, and reducing GHG emissions and NH3 volatilization.

5. Conclusions

The experiment was conducted to evaluate the effects of fertigation frequency and level on N2O and CO2 emission, NH3 volatilization, and Chinese cabbage yield. The results demonstrated that N2O and CO2 were increased with fertigation frequency and irrigation level. Soil NH4+-N and NH3 volatilization were decreased with fertigation frequency increase while soil NO2-N, NO3-N, and water-filled pore space increased with fertigation frequency. Chinese cabbage yield significantly increased in high fertigation frequency treatment under both irrigation levels. High irrigation level increased crop yield relative to low irrigation level. It is a challenge to balance crop requirements and emissions reduction simultaneously. This study provides a basis for the practical application of fertigation scheduling and irrigation levels that could reduce greenhouse gas emissions and improve Chinese cabbage yield in greenhouse cultivation. From a practical viewpoint, we recommend high-frequency fertigation with a 7-day interval under subsurface drip fertigation to help keep high Chinese cabbage yield with negligible GHG effect. In addition, we speculate that current fertigation scheduling can be applied for other crops besides Chinese cabbage. More studies are necessary to completely understand the influence of fertigation frequency on greenhouse gas emissions and NH3 volatilization in vegetable cultivation.

Author Contributions

Conceptualization, A.A.A.H., J.X. and Q.W. (Qi Wei); supervision, J.X.; methodology, A.A.A.H., X.L. and Q.W.; investigation, M.H. and H.S.; writing—original draft, A.A.A.H. and Q.W.’ (Qi Wei’); writing—review and editing, Y.A.H. and Z.Q. All authors have read and agreed to the published version of the manuscript.

Funding

This research was funded by the Fundamental Research Funds for the Central Universities (B200201004), the National Natural Science Foundation of China (51809077), the Belt and Road Special Foundation of the State Key Laboratory of Hydrology-Water Resources and Hydraulic Engineering, Hohai University, grant number 2019490411, and Key Research and Development Program of Jiangsu Province (BE2019392).

Institutional Review Board Statement

Not applicable.

Informed Consent Statement

Not applicable.

Data Availability Statement

Not applicable.

Conflicts of Interest

The authors declare no conflict of interest.

References

  1. He, G.; Wang, Z.; Cui, Z. Managing irrigation water for sustainable rice production in China. J. Clean. Prod. 2020, 245, 118928. [Google Scholar] [CrossRef]
  2. Ju, X.T.; Kou, C.L.; Zhang, F.S.; Christie, P. Nitrogen balance and groundwater nitrate contamination: Comparison among three intensive cropping systems on the North China Plain. Environ. Pollut. 2006, 143, 117–125. [Google Scholar] [CrossRef]
  3. Gu, Z.; Qi, Z.; Burghate, R.; Yuan, S.; Jiao, X.; Xu, J. Irrigation scheduling approaches and applications: A review. J. Irri. Drain Eng. 2020, 146, 04020007. [Google Scholar] [CrossRef]
  4. Jha, S.K.; Ramatshaba, T.S.; Wang, G.; Liang, Y.; Liu, H.; Gao, Y.; Duan, A. Response of growth, yield and water use efficiency of winter wheat to different irrigation methods and scheduling in North China Plain. Agric. Water Manag. 2019, 217, 292–302. [Google Scholar] [CrossRef]
  5. Maris, S.; Teira-Esmatges, M.; Arbonés, A.; Rufat, J. Effect of irrigation, nitrogen application, and a nitrification inhibitor on nitrous oxide, carbon dioxide and methane emissions from an olive (Olea europaea L.) orchard. Sci. Total Environ. 2015, 538, 978–996. [Google Scholar] [CrossRef] [PubMed]
  6. Reyes-Cabrera, J.; Zotarelli, L.; Dukes, M.D.; Rowland, D.L.; Sargent, S.A. Soil moisture distribution under drip irrigation and seepage for potato production. Agric. Water Manage. 2016, 169, 183–192. [Google Scholar] [CrossRef]
  7. Kallenbach, C.M.; Rolston, D.E.; Horwath, W.R. Cover cropping affects soil N2O and CO2 emissions differently depending on type of irrigation. Agric. Ecosys. Environ. 2010, 137, 251–260. [Google Scholar] [CrossRef]
  8. Shcherbak, I.; Millar, N.; Robertson, G.P. Global metaanalysis of the nonlinear response of soil nitrous oxide (N2O) emissions to fertilizer nitrogen. Proc. Nati. Acad. Sci. USA 2014, 111, 9199–9204. [Google Scholar] [CrossRef]
  9. Li, H.; Cong, R.; Ren, T.; Li, X.; Ma, C.; Zheng, L.; Zhang, Z.; Lu, J. Yield response to N fertilizer and optimum N rate of winter oilseed rape under different soil indigenous N supplies. Field Crops Res. 2015, 181, 52–59. [Google Scholar] [CrossRef]
  10. Hanson, B.R.; May, D.M.; Schwankl, L.J. Effect of irrigation frequency on subsurface drip irrigated vegetables. Hort Technol. 2003, 13, 115–120. [Google Scholar] [CrossRef]
  11. Sensoy, S.; Ertek, A.; Gedik, I.; Kucukyumuk, C. Irrigation frequency and amount affect yield and quality of field-grown melon (Cucumis melo L.). Agric. Water Manag. 2007, 88, 269–274. [Google Scholar] [CrossRef]
  12. Beshir, S. Review on estimation of crop water requirement, irrigation frequency and water use efficiency of cabbage production. J. Geosci. Environ. Prote. 2017, 5, 59. [Google Scholar] [CrossRef]
  13. Chafutsa, W.; Fandika, I.; Kadyampakeni, D.; Chiipanthenga, M.; Mapwesera, H.; Mafunga, G. In Comparative response of cabbage (Brassica oleraceae) to tea fertilizers, compost manure and inorganic fertilizer under furrow irrigation, Annual Report-Soil and Agricultural Engineering Commodity Group, 2007/08. In Proceedings of the DARS Annual Planning Meeting Held at Andrews Holiday Resort, Mangochi City, Chikwawa Distric, Malawi, 14–19 September 2008; Department of Agricultural Research Services Headquarters: Washington, DC, USA, 2018; pp. 162–176. [Google Scholar]
  14. Faiz-ul Islam, S.; van Groenigen, J.W.; Jensen, L.S.; Sander, B.O.; de Neergaard, A. The effective mitigation of greenhouse gas emissions from rice paddies without compromising yield by early-season drainage. Sci. Total Environ. 2018, 612, 1329–1339. [Google Scholar] [CrossRef] [PubMed]
  15. Chen, H.; Shang, Z.; Wang, Y.F.; Zhu, Y.; Cai, H. Effects of irrigation amounts on soil CO2, N2O and CH4 emissions in greenhouse tomato field. J. Appl. Ecolo. 2019, 30, 3126–3136. [Google Scholar] [CrossRef]
  16. Holcomb III, J.C.; Sullivan, D.M.; Horneck, D.A.; Clough, G.H. Effect of irrigation rate on ammonia volatilization. Soil Sci. Soc. Am. J. 2011, 75, 2341–2347. [Google Scholar] [CrossRef]
  17. Hamad, A.A.A.; Xu, J.; Wei, Q.; Hamoud, Y.A.; Shaghaleh, H.; Wang, K.; Hameed, F.; Xu, L. Effect of different irrigation and nitrogen management options on growth, yield and water use efficiency of Chinese cabbage in greenhouse cultivation. Pak. J. Agric. Sci. 2021, 58. [Google Scholar] [CrossRef]
  18. Wei, Q.; Xu, J.; Li, Y.; Liao, L.; Liu, B.; Jin, G.; Hameed, F. Reducing surface wetting proportion of soils irrigated by subsurface drip irrigation can mitigate soil N2O emission. Int. J. Environ. Res. Public Health 2018, 15, 2747. [Google Scholar] [CrossRef]
  19. Wang, Z.-H.; Liu, X.-J.; Ju, X.-T.; Zhang, F.-S.; Malhi, S. Ammonia volatilization loss from surface-broadcast urea: Comparison of vented-and closed-chamber methods and loss in winter wheat–summer maize rotation in North China Plain. Comm. Soi. Sci. Plant Anal. 2004, 35, 2917–2939. [Google Scholar] [CrossRef]
  20. Xu, J.; Peng, S.; Yang, S.; Wang, W. Ammonia volatilization losses from a rice paddy with different irrigation and nitrogen managements. Agric. Water Manag. 2012, 104, 184–192. [Google Scholar] [CrossRef]
  21. Nie, T.; Chen, P.; Zhang, Z.; Qi, Z.; Lin, Y.; Xu, D.; Health, p. Effects of different types of water and nitrogen fertilizer management on greenhouse gas emissions, yield, and water consumption of paddy fields in cold region of China. Int. J. Environ. Res. 2019, 16, 1639. [Google Scholar] [CrossRef]
  22. Li, Y.; Xu, J.; Liu, S.; Qi, Z.; Wang, H.; Wei, Q.; Gu, Z.; Liu, X.; Hameed, F. Salinity-induced concomitant increases in soil ammonia volatilization and nitrous oxide emission. Geoderma 2020, 361, 114053. [Google Scholar] [CrossRef]
  23. Chang, T.; Zhang, Y.; Zhang, Z.; Shao, X.; Wang, W.; Zhang, J.; Yang, X.; Xu, H. Effects of irrigation regimes on soil NO3-N, electrical conductivity and crop yield in plastic greenhouse. Int. J. Agric. 2019, 12, 109–115. [Google Scholar] [CrossRef]
  24. Wang, X.; Zou, C.; Gao, X.; Guan, X.; Zhang, Y.; Shi, X.; Chen, X.; Research, P. Nitrate leaching from open-field and greenhouse vegetable systems in China: A meta-analysis. Environ. Sci. Pollut. Res. 2018, 25, 31007–31016. [Google Scholar] [CrossRef] [PubMed]
  25. Fan, Y.; Hao, X.; Ding, R.; Kang, S. Soil water and nitrogen dynamics from interaction of irrigation and fertilization management practices in a greenhouse vegetable rotation. Soil Sci. Soc. Am. J. 2020, 84, 901–913. [Google Scholar] [CrossRef]
  26. Liu, G.; Li, Y.; Alva, A. High water regime can reduce ammonia volatilization from soils under potato production. Comm. Soil Sci. Plant Anal. 2007, 38, 1203–1220. [Google Scholar] [CrossRef]
  27. Quemada, M.; Baranski, M.; Nobel-de Lange, M.; Vallejo, A. Meta-analysis of strategies to control nitrate leaching in irrigated agricultural systems and their effects on crop yield. Agric. Ecosyst. Environ. 2013, 174, 1–10. [Google Scholar] [CrossRef]
  28. Linn, D.M.; Doran, J.W. Effect of Water-Filled Pore Space on Carbon Dioxide and Nitrous Oxide Production in Tilled and Nontilled Soils. Soil Sci. Soc. Am. J. 1984, 48, 1267–1272. [Google Scholar] [CrossRef]
  29. Hosono, T.; Hosoi, N.; Akiyama, H.; Tsuruta, H. Measurements of N2O and NO emissions during tomato cultivation using a flow-through chamber systemin a glasshouse. Nutr. Cycl. Agroecosyst. 2006, 75, 115–134. [Google Scholar] [CrossRef]
  30. Liu, T.; Liang, Y.; Chu, G. Nitrapyrin addition mitigates nitrous oxide emissions and raises nitrogen use efficiency in plastic-film-mulched drip-fertigated cotton field. PLoS ONE 2017, 12, e0176305. [Google Scholar] [CrossRef]
  31. Tian, D.; Zhang, Y.; Mu, Y.; Zhou, Y.; Zhang, C.; Liu, J. The effect of drip irrigation and drip fertigation on N2O and NO emissions, water saving and grain yields in a maize field in the North China Plain. Sci. Total Environ. 2017, 575, 1034–1040. [Google Scholar] [CrossRef]
  32. Kuang, W.; Gao, X.; Tenuta, M.; Gui, D.; Zeng, F. Relationship between soil profile accumulation and surface emission of N2O: Effects of soil moisture and fertilizer nitrogen. Biol. Fert. Soils 2019, 55, 97–107. [Google Scholar] [CrossRef]
  33. Han, B.; Ye, X.; Li, W.; Zhang, X.; Zhang, Y.; Lin, X.; Zou, H. The effects of different irrigation regimes on nitrous oxide emissions and influencing factors in greenhouse tomato fields. J. Soils Sedim. 2017, 17, 2457–2468. [Google Scholar] [CrossRef]
  34. Schindlbacher, A.; Zechmeister-Boltenstern, S.; Butterbach-Bahl, K. Effects of soil moisture and temperature on NO, NO2, and N2O emissions from European forest soils. J. Geophys. Res. Atmos. 2004, 109. [Google Scholar] [CrossRef]
  35. Tirado-Corbalá, R.; Gao, S.; Ayars, J.E.; Wang, D.; Phene, C.J.; Phene, R.C. Carbon and Nitrogen Dynamics Affected by Drip Irrigation Methods and Fertilization Practices in a Pomegranate Orchard. Horticulturae 2019, 5, 77. [Google Scholar] [CrossRef]
  36. Chen, D.; Wang, Y.; Lan, Z.; Li, J.; Xing, W.; Hu, S.; Bai, Y. Biotic community shifts explain the contrasting responses of microbial and root respiration to experimental soil acidification. Soil. Biol. Biochem. 2015, 90, 139–147. [Google Scholar] [CrossRef]
  37. Jabro, J.; Sainju, U.; Stevens, W.; Evans, R. Carbon dioxide flux as affected by tillage and irrigation in soil converted from perennial forages to annual crops. J. Environ. Manag. 2008, 88, 1478–1484. [Google Scholar] [CrossRef] [PubMed]
  38. Abalos, D.; Sanchez-Martin, L.; Garcia-Torres, L.; van Groenigen, J.W.; Vallejo, A. Management of irrigation frequency and nitrogen fertilization to mitigate GHG and NO emissions from drip-fertigated crops. Sci. Total Environ. 2014, 490, 880–888. [Google Scholar] [CrossRef] [PubMed]
  39. Sapkota, A.; Haghverdi, A.; Avila, C.C.E.; Ying, S.C. Irrigation and Greenhouse Gas Emissions: A Review of Field-Based Studies. Soil Syst. 2020, 4, 20. [Google Scholar] [CrossRef]
  40. Song, C.; Jiao, Y.; Yang, W.; Yu, Y.; Zhang, J.; Liu, Y. Research Progress on the Influence of Irrigation Methods on Ammonia Volatilization in Farmland; IOP Conference Series: Earth and Environmental Science; IOP Publishing: Bristol, UK, 2021; p. 012170. [Google Scholar] [CrossRef]
  41. Hayashi, K.; Nishimura, S.; Yagi, K. Ammonia volatilization from a paddy field following applications of urea: Rice plants are both an absorber and an emitter for atmospheric ammonia. Sci. Total Environ. 2008, 390, 485–494. [Google Scholar] [CrossRef]
  42. Cao, Y.; Tian, Y.; Yin, B.; Zhu, Z. Assessment of ammonia volatilization from paddy fields under crop management practices aimed to increase grain yield and N efficiency. Field Crops Res. 2013, 147, 23–31. [Google Scholar] [CrossRef]
  43. Maharjan, B.; Venterea, R.T. Nitrite intensity explains N management effects on N2O emissions in maize. Soil. Biol. Biochem. 2013, 66, 229–238. [Google Scholar] [CrossRef]
  44. Kamali, N.; Siroosi, H.; Sadeghipour, A. Impacts of wind erosion and seasonal changes on soil carbon dioxide emission in southwestern Iran. J. Arid. Land. 2020, 12, 690–700. [Google Scholar] [CrossRef]
  45. Badr, M.; El-Yazied, A. Effect of fertigation frequency from subsurface drip irrigation on tomato yield grown on sandy soil. Aust. J. Basic Appl. Sci. 2007, 1, 279–285. [Google Scholar]
  46. El Naim, A.M.; Ahmed, M. Effect of Irrigation Intervals and Interrow Spacing on Yield, Yields Components and Water Use Efficiency of Sunflower (Helianthus annuus L). J. Appl. Sci. Res. 2010, 6, 1446–1451. [Google Scholar]
  47. Silber, A.; Bruner, M.; Kenig, E.; Reshef, G.; Zohar, H.; Posalski, I.; Yehezkel, H.; Shmuel, D.; Cohen, S.; Dinar, M. High fertigation frequency and phosphorus level: Effects on summer-grown bell pepper growth and blossom-end rot incidence. Plant Soil 2005, 270, 135–146. [Google Scholar] [CrossRef]
  48. Wang, F.-X.; Kang, Y.; Liu, S.-P. Effects of drip irrigation frequency on soil wetting pattern and potato growth in North China Plain. Agric. Water Manag. 2006, 79, 248–264. [Google Scholar] [CrossRef]
  49. Gu, Z.; Zhu, T.; Jiao, X.; Xu, J.; Qi, Z. Neural network soil moisture model for irrigation scheduling. Comp. Elect. Agric. 2021, 180, 105801. [Google Scholar] [CrossRef]
Figure 1. Plot layout of subsurface drip fertigation system. LF, MF, and HF represent low, medium, and high fertigation frequencies, respectively. I80 and I70 denote 80% and 70% irrigation levels of farmer’s practice.
Agronomy 12 01414 g001
Figure 2. Soil temperature (°C), relative humidity (%) (a), and mean soil WFPS of 0–0.25m (%) (b,c) during the experimental period for all treatments, respectively. LF, MF, and HF represent low, medium, and high fertigation frequencies, respectively. Corresponding colors red, blue, and green represent low, medium, and high fertigation frequencies, respectively. I80 and I70 denote 80% and 70% irrigation levels of farmer’s practice. The arrows indicate fertigation events. Error bars indicate standard deviations.
Agronomy 12 01414 g002
Figure 3. Soil NH4+-N, NO3-N, and NO2-N concentrations in the 0–0.25m soil layer during the experimental period LF, MF, and HF represent low, medium, and high fertigation frequencies, respectively. Corresponding colors red, blue, and green represent low, medium, and high fertigation frequencies, respectively. I80 and I70 denote 80% and 70% irrigation levels of farmer’s practice. Data are provided separately for the different irrigation level treatments. Vertical arrows represent fertigation days. Error bars indicate standard deviations.
Agronomy 12 01414 g003aAgronomy 12 01414 g003b
Figure 4. N2O fluxes over the experimental period. LF, MF, and HF represent low, medium, and high fertigation frequencies, respectively.Corresponding colors red, blue, and green represent low, medium, and high fertigation frequencies, respectively. I80 and I70 denote 80% and 70% irrigation levels of farmer’s practice. Data are provided separately for the different irrigation level treatments. Vertical arrows represent fertigation days. Error bars indicate standard deviations.
Agronomy 12 01414 g004
Figure 5. CO2 fluxes over the experimental period. LF, MF, and HF represent low, medium, and high fertigation frequencies, respectively.Corresponding colors red, blue, and green represent low, medium, and high fertigation frequencies, respectively. I80 and I70 denote 80% and 70% irrigation levels of farmer’s practice. Data are provided separately for the different irrigation level treatments. Vertical arrows represent fertigation days. Error bars indicate standard deviations.
Agronomy 12 01414 g005
Figure 6. NH3 fluxes over the experimental period. LF, MF, and HF represent low, medium, and high fertigation frequencies, respectively. Corresponding colors red, blue, and green represent low, medium, and high fertigation frequencies, respectively. I80 and I70 denote 80% and 70% irrigation levels of farmer’s practice. Vertical arrows represent fertigation days. Error bars indicate standard deviations.
Agronomy 12 01414 g006
Figure 7. Pearson correlation analysis of cumulative N2O emissions vs. NO2-N concentrations (a), cumulative CO2 emissions vs. soil temperature (b), and cumulative NH3 flux vs. NH4+-N (c) during the experimental period.
Agronomy 12 01414 g007
Table 1. Mean N2O and CO2 fluxes under high and low irrigation levels (I80 and I70) on three fertigation frequencies (LF, MF, and HF) at three different distances (1, 2, and 3) from the emitter.
GHGHorizontal Distances from EmitterI80I70
LFMFHFLFMFHF
N2O163.4 ± 4.4 a60.7 ± 4.2 a69.5 ± 4.9 a48.2 ± 3.4 a48.4 ± 3.4 a56.4 ± 3.9 a
233.5 ± 2.3 c36.1 ± 2.5 c45.3 ± 3.2 c28.7 ± 2.3 c32.6 ± 2.3 c39.0 ± 2.7 c
339.6 ± 2.8 b42.2 ± 2.9 b52.8 ± 3.7 b32.8 ± 2.3 b37.3 ± 2.6 b43.9 ± 3.1 b
CO21298.1 ± 20.8 a293.8 ± 20.5 a336.6 ± 23.5 a247.4 ± 17.3 a260.9 ± 18.2 a302.7 ± 21.2 a
2215.4 ± 15.1 c209.4 ±14.6 c246.3 ± 17.2 c179.6 ± 12.6 c198.0 ± 13.8 c239.2 ± 16.7 b
3247.5 ± 17.3 b243.7 ± 17 b278.2 ± 19.4 b220.1 ± 15.4 b236.6 ± 16.5 b282.1 ± 19.7 a
Note: LF, MF, and HF represent low, medium, and high fertigation frequencies, respectively. I80 and I70 denote 80% and 70% irrigation levels of farmer’s practice. Different letters within columns indicate significant differences by applying the Least Significant Difference (LSD) test at p < 0.05.
Table 2. Cumulative N2O and CO2 emissions and NH3 volatilization over the whole experimental period.
Irrigation Level (I)Fertigation Frequency (F)N2OCO2NH3
(mg N2O m−2)(g CO2 m−2)(mg NH3 m−2)
I80LF56.48 ± 2.38 a309.22 ± 13.02 a34.76 ± 1.46 a
MF57.11 ± 2.40 a310.96 ± 13.09 a31.86 ± 1.34 b
HF57.29 ± 2.41 a318.39 ± 13.41 a24.99 ± 1.05 e
I70LF45.14 ± 1.90 b273.05 ± 11.50 b30.19 ± 1.27 c
MF46.53 ± 1.96 b301.51 ± 12.70 a27.79 ± 1.18 d
HF46.71 ± 1.97 b308.05 ± 12.97 a23.34 ± 0.98 f
F nsns*
I ***
F × I nsnsns
Note: LF, MF, and HF represent low, medium, and high fertigation frequencies, respectively. I80 and I70 denote 80% and 70% irrigation levels of farmer’s practice. F: frequency, I: Irrigation. Different letters within columns indicate significant differences by applying the Least Significant Difference (LSD) test at p < 0.05. * 0.05 probability level. ns: no significant difference.
Table 3. Crop yield and yield-scaled Global Warming Potential (GWP/yield).
Irrigation LevelFertigation FrequenciesYield (kg m−2)GWP/Y
(mg CO2 eq kg−1)
I80LF1.71 ± 0.12 b3.12 ± 0.22 a
MF1.97 ± 0.14 b2.68 ± 0.19 b
HF2.48 ± 0.17 a2.63 ± 0.18 b
I70LF1.55 ± 0.07 c2.67 ± 0.19 a
MF1.83 ± 0.08 b2.31 ± 0.16 b
HF2.31 ± 0.10 a2.17 ± 0.15 b
F **
I **
F × I nsns
Note: LF, MF, and HF represent low, medium, and high fertigation frequencies, respectively. I80 and I70 denote 80% and 70% irrigation levels of farmer’s practice. F: frequency, I: Irrigation. Different letters within columns indicate significant differences by applying the Least Significant Difference (LSD) test at p < 0.05. *: Significant difference at the probability of 0.05 (p < 0.05). ns: no significant difference.
Publisher’s Note: MDPI stays neutral with regard to jurisdictional claims in published maps and institutional affiliations.

