Article

Foliar Application of GA3 Stimulates Seed Production in Cauliflower

1
Department of Horticulture, Faculty of Agriculture, Bangabandhu Sheikh Mujibur Rahman Agricultural University, Gazipur 1706, Bangladesh
2
Department of Genetics and Plant Breeding, Faculty of Agriculture, Bangabandhu Sheikh Mujibur Rahman Agricultural University, Gazipur 1706, Bangladesh
3
Department of Horticulture, Agricultural Faculty, Ataturk University, TR-25240 Erzurum, Turkey
4
Laboratory of Functional Ecology and Environment, Faculty of Sciences and Technology, Sidi Mohamed Ben Abdellah University, Imouzzer Street, Fez P.O. Box 2202, Morocco
5
Department of Pharmacognosy, College of Pharmacy, King Saud University, P.O. Box 2455, Riyadh 11451, Saudi Arabia
6
Department of Zoology, College of Science, King Saud University, P.O. Box 2455, Riyadh 11451, Saudi Arabia
7
Zoology Department, Faculty of Science, Cairo University, Giza 12613, Egypt
8
Department of Vegetable and Herbal Crops, University of Life Sciences, Lublin 50A Doswiadczalna Street, 20-280 Lublin, Poland
*
Author to whom correspondence should be addressed.
Agronomy 2022, 12(6), 1394; https://doi.org/10.3390/agronomy12061394
Submission received: 10 May 2022 / Revised: 27 May 2022 / Accepted: 27 May 2022 / Published: 10 June 2022

Abstract

:
This study aimed to evaluate the influence of gibberellic acid on both concentration and time of application on the seed production ability of BU cauliflower-1. The experiment was conducted to determine seed production ability at five concentrations of GA3: G0 = Control, G1 = 100 ppm, G2 = 200 ppm, G3 = 300 ppm, G4 = 400 ppm, along with four application times at different growth stages including T1 = Foliar application at 3 weeks after planting, T2 = Foliar application at 4 weeks after planting, T3 = Foliar application at 5 weeks after planting and T4 = Foliar application at 6 weeks after planting. Results revealed that 200 ppm GA3 gave the highest plant height (44.05 cm), the number of primary (10.88) and secondary flowering branches (31.33), stalk length (79.53 cm), seeded pods per plant (465), pod length (4.975 cm), seeds per pod (10.87), seed yield per plant (16.16 g), seed yield (0.24 ton/ha), and weight of thousand seeds (4.826 g) with the earliest curd (51.02 days) and flower initiation (84.17 days). It also gave the highest net return (Tk. 4.7 lakh/ha) and benefit-cost ratio (4.34). GA3 application at 3 weeks after transplanting had the highest numbers of primary and secondary flowering branches, pods, seeded pods, and seed yield per plant. The treatment combination of G2T1 gave the earliest curd initiation (49.60 days), the highest number of secondary flowering branches (34.87), seed yield per plant (22.75 g), and seed yield (0.27 ton/h). In contrast, the G2T2 treatment resulted in the earliest flower initiation (81.77 days) with the highest pod length (5.20 cm), the number of pods per plant (707), and seeded pods per plant (507), and seeds per pod (11.30). Hence, 200 ppm GA3 applied three weeks after transplanting could be used as the best combination for cauliflower seed production with the highest net return and benefit-cost ratio. Enhancing seed yield is our ultimate goal; hence, we suggest 200 ppm GA3 three weeks after transplanting for increased cauliflower seed production with the highest return and benefit-cost ratio in the study area. As we performed the study in a particular location, we recommend multilocation trials in different agro-ecological regions to study the genotype–environment interaction for final confirmation of the results.

1. Introduction

Cauliflower is an important vegetable crop of the family Brassicaceae and is grown in many countries across the globe. The name cauliflower originated from the Latin words ‘Caulis’ and ‘Floris’, which means cabbage and flower, respectively. It has been rightly described as the “Aristocrat of cole crops” and is grown throughout the world for tender white curds [1]. The world’s cauliflower production and consumption in 2020 were 25.50 million metric tons. Asia is the biggest producer of cauliflower accounting for 75% of the world’s production. In 2020, the cauliflower cultivation area of Bangladesh was 54.25 thousand acres, and its production was approximately 283.16 thousand metric tons [2]. It is an economically important winter vegetable crop grown in Bangladesh [3]. It is a source of protein, thiamin, riboflavin, phosphorus, and potassium, as well as a rich source of dietary fiber, vitamin C, vitamin K, vitamin B6, folate, pantothenic acid, and manganese [4]. Its consumption is rapidly increasing in Bangladesh, as well as in the world, due to its high nutritional value, taste, and attractive color. It is considered a rich source of dietary fiber, and it possesses both antioxidant and anticarcinogenic properties [5]. It has multiple culinary uses such as in salads, frying, and different ingredients of curry. In western countries, it is also consumed pickled. The edible part of the cauliflower is called curd. According to botanical consideration, it is the pre-condition of inflorescence. The lifecycle of cauliflower can be divided into three phases, i.e., growth phase, curd phase, and flower or seed phase [6].
The production of cauliflower largely depends on the availability of seeds and different cultural managements, such as fertilizers, irrigation, and pest control. The seed yield of cauliflower depends on variety, cultivation methods, climatic conditions as well as edaphic factors. The seed quality of cauliflower is also an important factor for higher yield of the crop. Thus, the seed production of this crop is also considered a crucial issue for cauliflower improvement and development.
As a subtropical country, the climatic conditions of Bangladesh are not favorable for the seed production of cauliflower. In Bangladesh, every year, almost all the required cauliflower seeds are directly imported from abroad. As a result, every year, Bangladesh has to spend approximately 160 million Taka importing the majority of the required seeds. In Bangladesh, due to the unfavorable environment, the cauliflower seed yields are low, which is approximately an average of 400 kg per hectare in the experimental plot [7]. However, BU cauliflower-1, a new cultivar released by the Department of Horticulture of the Bangabandhu Shiekh Mujibur Rahman Agricultural University succeed in producing seeds in open field conditions (without any greenhouse facility). This is an opportunity to produce cauliflower seeds in Bangladesh, albeit the average seed yield is quite low compared to the average seed yield in cooler countries.
There are many kinds of literature regarding the utilization of plant growth regulators for enhancing the seed production of many vegetables, including other crops. Gibberellic acid (GA3) is the most widely used plant growth regulator, which increases stem elongation along with plant height, growth, dry matter accumulation as well as yield in various crops [8]. Ali et al. [9] reported that GA3 showed a linear relationship between plant growth and seed yield of onion. The application of gibberellins induced early flowering and affected flower morphology [10]. Mohanta et al. [11] found that the application of 200 ppm GA3 produces the maximum seed of carrot compared with 100 ppm NAA, 100 ppm Ethrel, 50 ppm GA3, 100 ppm GA3, and 150 ppm GA3. The exogenous application of plant growth regulators also significantly increases the seed yield of rice [12]. It stimulates physiological processes, including flowering, stem growth, and seed production. It is also involved in sex expression, development of seedless fruits, and retention of foliage and seed germination [13].
Based on the above literature, we will explore the possibility of enhancing seed production of BU cauliflower-1 through the application of growth regulators such as gibberellic acid, given that there is no current information on the effect of growth regulators (GA3) with the combination of concentrations and time of application for enhancing seed production of cauliflower. For the first time, we applied both combinations of concentrations and time of application of growth regulators (GA3) to study seed production ability in our newly released promising cultivar BU cauliflower-1. Therefore, the attempt was undertaken to fulfill our objectives by determining the appropriate application time and concentration of GA3 to enhance the seed production ability of BU cauliflower-1 and to determine the relative cost and returns for enhancing the cheapest seed production of BU cauliflower-1 in Bangladesh.

2. Materials and Methods

2.1. Experimental Site

The experiment was conducted at the experimental field of Bangabandhu Sheikh Mujibur Rahman Agricultural University (BSMRAU), Bangladesh. The soil of the experimental area was clay loam with shallow Red Brown Terrace type under Salna Series of Madhupur Tract. The site is located in the Agroecological zone (AEZ) 28 (24°23′ N 90°08′ E) having a mean elevation of 8.4 m above sea level [14,15,16,17,18,19,20,21]. The soil conditions were slightly acidic (pH 6.4), low in organic matter (0.87%), total N of 0.09%, and exchangeable K of 0.13 centimol kg−1 [22,23]. The experimental site is in a subtropical zone and has differences in temperatures during summer (maximum 32 °C, minimum 27 °C, and average 29 °C) and winter (maximum 25 °C, minimum 15 °C, and average 19.6 °C). The weather data during the experimentation period are put in Supplementary Table S1.

2.2. Planting Material

The cauliflower seeds (BU cauliflower-1) were collected from the Department of Horticulture, BSMRAU, Bangladesh. Cauliflower seeds were harvested on 1 March 2017 from plants grown in the seed production farm of the Department of Horticulture, BSMRAU, Bangladesh. Dried seeds were preserved in the seed storehouse of the Department of Horticulture. We collected seeds from the departmental storehouse on 1 August 2017.

2.3. Raising of Seedling

Seeds were sown in plastic trays on 14 August 2017. Pot soil consisting of an equal proportion of soil and cow dung and was treated with Provax 200 WP (Carboxin 37.5% + Thiram 37.5%) @ 2.5 g kg−1 of pot soil (Indofil Bangladesh Industries Pvt. Ltd., Dhaka, Bangladesh). The entire seed tray was covered with a sheet of newspaper to conserve soil moisture until germination. For germination, the seed trays were set in a polyethylene shed in the open air. Complete germination of seeds took place within six days of sowing. Eleven-day-old seedlings were transplanted individually in polyethylene bags filled with an equal proportion of soil and cow dung. The chemical compositions of composted cow dung are presented in Supplementary Table S2. Seedlings were also kept in a polyethylene shed (Temperature 28 ± 2 °C, day length 12 h) before transplanting in the main field.

2.4. Experimental Design, Layout, and Transplanting of Seedling Cultural Practices and Aftercare

The experiments were laid out in a two-factor randomized complete block design with three replications. The experiment comprised a factorial design of five different concentrations of gibberellic acid [G0, Control (No GA3); G1, GA3 @ 100 ppm; G2, GA3 @ 200 ppm; G3, GA3 @ 300 ppm; G4, GA3 @ 400 ppm] and 4 different times of application of gibberellic acid (T1, Foliar application at 3 weeks after planting in the field; T2, Foliar application at 4 weeks after planting in the field; T3, Foliar application at 5 weeks after planting in the field; T4, Foliar application at 6 weeks after planting in the field) with twenty treatment combinations. The unit plot size was 2.4 m × 2.5 m having plot to plot and replication to replication distances of 0.5 m and 1 m, respectively. The experiment area was divided into a total of 60 plots. There were three blocks and twenty plots in each block. Before transplanting seedlings, polybags were removed from each seedling to facilitate the growth of root from basal media so that it can easily be established in the field. At the time of removal of polybags, special care was taken to protect the earth ball. Irrigation was given immediately after transplanting to establish the seedling. Strong and healthy thirty-day-old seedlings were transplanted in the main field following 60 cm × 50 cm plot spacing. After seedling establishment, the soil around the base of each seedling was pulverized, and damaged seedlings were replaced with new ones from the same stock. Recommended fertilizer and compost doses and appropriate cultural practices were maintained [24]. Weeding and hoeing were performed at 7-day intervals. To maintain the normal growth of the crop, flood irrigations were provided at 4 days intervals.

2.5. Preparation and Application of GA3

The different concentrations of GA3 at 100, 200, 300, and 400 ppm, were prepared following the procedure mentioned below, and spraying was done at noon by using a hand sprayer. GA3 was applied at 3, 4, 5, and 6 weeks after transplanting. In a control plot, only distilled water was sprayed. To prepare 100, 200, 300, and 400 ppm of the GA3 solution, the laboratory-grade chemical reagent was used. The stock solution of 1000 ppm GA3 was prepared by dissolving 1.0 g of GA3 in 1 L of distilled water. Gibberellic acid was first dissolved in a little quantity of 1 N sodium hydroxide (NaOH), and then the exact volume was made up with distilled water in the volumetric flask to have the desired stock solution. The stock solution was then preserved in glass jars at 4 °C in a refrigerator for preparing solutions with desired concentrations.

2.6. Pest and Disease Control

Birds attacked the crop during the growing period (Bulbuli birds). Aluminum foil was used against the birds to protect the crop. Spraying was done with Malathion to control hairy caterpillars, and Mancozeb was used to control black rot diseases of the crop.

2.7. Harvesting of Seed

When about 75% of the pod turned yellow (2 to 5 March 2018), the seed stalks were cut and dried under shade. The seeds were then threshed, dried, and preserved in dry airtight conditions.

2.8. Collection of Data

The data pertaining to the following characters were recorded from five randomly selected plants from each experimental unit. The following morphological parameters were collected: plant height at 80 days after transplanting (DAT), length of the biggest leaf at 80 DAT, the breath of the biggest leaf at 80 DAT, days to curd initiation, number of leaves at curd initiation, days to flower initiation, length of seed stalk, number of primary flowering branch per plant, number of secondary flowering branch per plant, number of pods per plant, number of empty pods per plant, number of seeded pods per plant, length of pods, days required for seed maturity, number of seed per pod, the weight of seeds per plant, the weight of 1000 seeds, and seed yield. Curd initiation is determined through visual observation when the apex diameter reaches the initiation point at 0.6 mm. Flower initiation was assessed with the disruption of the curd by the elongation of some of the inflorescence branches. Seed maturity was assessed by visual observation of the color of siliquas and seeds. A color change in siliquas and seeds from green to pinkish yellow and brown was thought to be matured. Primary branches were considered to be those branches that arise from the main inflorescence stalk. Secondary branches were considered to be those branches that arise from the primary branches.

2.9. Seed Germination Test

A seed germination test was conducted for each treatment and the results were expressed in percentages. Before sowing, seeds were treated with Vitavax 200 WP (Carboxin + Thiram; Arysta Life science India Limited, Mumbai, India) @ 2.5 g/kg of seed. Following treatment, 100 seeds were selected and kept in a Petri dish. The diameter of Petri dishes used for germination was 100 mm with a height of 15 mm. A blotting paper was set in each Petri dish and then soaked with distilled water. Before setting the seeds in the Petri dishes, excess water was drained out. After setting seeds, the Petri dishes were kept at room temperature (25–28 °C). After eight days, the germinated seeds were counted down and recorded. The seeds that produced healthy plumule and radicles were counted only.

2.10. Statistical Analysis

All the sample data of a trait were averaged for each treatment to obtain a replication mean [25,26,27,28,29,30]. The mean data of various growth and yield contributing characters were statistically and biometrically analyzed following the method of Sarker and Oba [31,32,33,34]. Statistix 8 software was used to analyze the data for analysis of variance (ANOVA) [35,36,37,38,39,40,41,42]. Analysis of variance was done according to Sarker and Oba and Sarker et al. [43,44,45,46,47,48,49,50,51,52]. Mean separation was done by using DMRT at a 5% level of probability.

2.11. Economic Analysis

Economic analysis was done to compare the cost and benefits under different concentrations of GA3. All input costs and interests on fixed cost (land) and running capital were considered for computing the cost of production. Cost and return analysis were done in detail according to previous procedures [3].

3. Results and Discussion

Significant differences were observed for all studied traits which indicated a wide range of variability among the traits. Similar variations were also observed in vegetable amaranth [51,52,53,54,55], rice [56,57,58,59,60,61,62,63,64,65,66,67,68,69,70] maize [71,72,73], coconut [74,75], Okra [76,77,78], and broccoli [79]. The major objectives of the present study were to determine the optimum dose and time of application of GA3 for increased seed yield and also to determine the relative cost and returns for seed production of BU cauliflower-1. The application of GA3 played an important role in the growth and seed yield of cauliflower. Different concentrations of GA3 significantly influenced most of the recorded characteristics.

3.1. Plant Height

Plant height varied significantly due to the foliar application of different concentrations of GA3. The maximum plant height at 80 DAT (44.05 cm) was recorded at 200 ppm GA3, which is statistically similar to 100 and 300 ppm GA3. The lowest plant height (41.30 cm) was recorded from the plants that received 400 ppm GA3 at 80 DAT (Table 1). The effect of time of application of GA3 was not significant (Table 2). The interaction effect between different levels of GA3 and the time of application varied significantly. The tallest plant (45.67 cm) was recorded from 400 ppm GA3 applied at 5 weeks after transplanting (G4T3) and the shortest plant (39.63 cm) from 200 ppm GA3 applied at 4 weeks after transplanting (G2T2) (Table 3). Plant height is one of the vital contributing characteristics for cauliflower growth and seed yield. Differences in plant height may result from the modification of the physiological processes with the concentration of plant growth regulator (GA3) and time of application, which ultimately affected the major growth parameter. Gibberellins are weakly acidic growth hormones having a gibbane ring structure which causes cell elongation of intact plants in the general and increased internodal length of genetically dwarfed plants. Islam [80] reported that GA3 increased the height of the plant and, finally, biomass yield in cabbage. Patil et al. [81] also noted that GA3 increased plant height significantly in cabbage. The augmentation of plant height with GA3 application may be attributed owing to the increase in cell elongation and division in the sub-apical meristem [6].

3.2. Length and Breadth of the Biggest Leaf

Although the breadth of the biggest leaf varied significantly; the length did not vary significantly due to the application of different concentrations of GA3. GA3 at 400 ppm produced the highest leaf length (39.01 cm) and the lowest in the control treatment (37.95 cm). The largest leaf breath was recorded at 100 ppm GA3 (18.05 cm), and the smallest leaf breath was recorded at 300 ppm GA3 (16.92 cm) (Table 1). The application of GA3 at different times had no significant effect on the breadth or length of the largest leaf (Table 2). The length and breadth of the largest leaf of cauliflower varied significantly due to the combined effect of GA3 concentrations and time of application. The largest leaf length (39.93 cm) was recorded in G4T3, while the largest leaf breadth (18.73 cm) was recorded in G2T1. The lowest leaf length (37.27 cm) was recorded in G0T4, whereas the lowest leaf breath (16.67 cm) was recorded in G3T2 (Table 3). The leaves are the source of photosynthesis. Plant transfers photosynthetic products from source to sink. Large size leaf has more length and more breadth. As a result, such leaves have more surface area for photosynthesis and have more opportunity to produce more carbohydrates and supply to sink of the plant (curd, flower, pods, seeds). For this reason, leaf size plays an important role in the efficacy of seed production. The present results differed from the findings of Akhter [82], who recorded the highest length of leaf in cauliflower with the application of GA3 at 100 ppm. Rahman et al. [83] found the highest leaf length and breadth at harvest due to the application of 10 ppm NAA with 70 ppm GA3. This variation might be due to the application of NAA in addition to GA3. The length and breadth of the largest leaf and the number of leaves of cauliflower varied significantly due to the combined effect of GA3 concentration and time of application, while Akhter [81] didn’t find any significant variation in leaf breath with the application of different concentrations of GA3. This variation might be due to varietal differences or the time of application of GA3.

3.3. Number of Leaves at Curd Initiation

No significant variation was found in the case of the number of leaves per plant at curd initiation due to the effect of GA3 with different concentrations (Table 1). The number of leaves per plant at curd initiation was also not significantly influenced by the application time of GA3 in cauliflower (Table 2). The number of leaves of cauliflower varied with treatment combinations at curd initiation. The greatest number of leaves per plant of cauliflower was recorded from treatment combination G0T3 (21.67), and the lowest number of leaves was recorded from treatment combination G2T1 (20.27) (Table 3). Literature has shown that number of leaves is highly correlated with curd initiation of cauliflower [84,85]. The sufficient number of leaves of a plant at the end of the juvenile period is also a stable characteristic for curd initiation [86]. However, at high temperatures, a sufficient number of leaves sometimes does not ensure curd initiation. Williams and Atherton [87] indicated that curd initiation occurred earlier with fewer leaves at a low temperature (5 °C) and that more leaves were required at a warm temperature (20 °C).

3.4. Days to Curd Initiation

A significant difference was noted on days required from transplanting to curd initiation with the application of different concentrations of GA3. The least number of days (51.02) were required from transplanting to curd initiation in 200 ppm GA3, and the maximum number of days until curd initiation (54.87) was observed at control conditions (Table 1). The effect of application time of GA3 on curd initiation of cauliflower was found not significant (Table 2). The treatment combination had a statistically significant effect on curd initiation of cauliflower. The earliest curd initiation days of cauliflower (49.60) were found from G2T1, and later curd initiation days of cauliflower (56.20) were found from G0T3, under control conditions (Table 3). Haque [88] reported minimum days from seed sowing to first curd initiation in cauliflower. Kaur and Mal. [6] found that the minimum days were required for 50% curd initiation in cauliflower with the application of 50 ppm GA3. Application of GA3 reduced the days required for curd initiation which may be attributed to the increase in cell elongation and division in the sub-apical meristem [6]. GA hastens the conversion from the vegetative to the reproductive stage of cauliflower and is consequential in early curd formation. GA3 application exogenously displayed a reduction in the time to flowering in cauliflower. However, the application of GA3 during the early reproductive phase augmented bract development in curds of cauliflower [89,90]. In a study, the application of 50 ppm GA3 ensured a minimum number of days required for 50% curd initiation and 50% marketable curd size in cauliflower [6]. In another study, the minimum days required for cabbage head formation were found at 50 ppm GA3 application [91].

3.5. Days to Flower Initiation

A significant variation was found in days required to flower initiation due to the application of GA3 at different concentrations. The least number of days required (84.17) were from transplanting at GA3 at 200 ppm, and the maximum number of days were required (87.70) at the control conditions. The results showed that with the increasing concentration of GA3, the days required for flower initiation were decreased up to 200 ppm GA3, and then a further increase of GA3 increases the days required for flower initiation (Table 1). The effect of application time of GA3 on days to flower initiation of cauliflower was found not significant (Table 2). The interaction effect between GA3 and time of application had a significant effect on days to flower initiation of cauliflower. The minimum days (81.77) required to flower initiation were recorded in G2T2, and the maximum days (89.00) required to flower initiation were recorded in G4T3 (Table 3). Gibberellins replace vernalization or low-temperature requirement of cauliflower and enhance flowering. Gibberellic acids are diterpene plant hormones that are biosynthesized from geranylgeranyl diphosphate, a common C20 precursor for diterpenoids, which control diverse aspects of growth and development including seed germination, stem elongation, flowering, and fruit development [92]. Literature has shown that exogenous GA3 application significantly promoted flower bud development and new branch growth, as well as improved flowering quality. Furthermore, hormone changes promoted PsSOC1 and PsSPL9 expression and repressed PsSVP expression, which contributed to the improvement of flowering quality in tree peony of forcing culture [93]. GA3 decreased the number of days to flowering (7%) and length of stalk compared to the control in gerbera and chrysanthemum [94,95]. GA3 application at the seedling stage increased pedicel length and flower diameter compared to GA3 treatment at the flower initiation stage which conforms with the current findings [95].

3.6. Length of Seed Stalk at Harvest

The length of the cauliflower seed stalk was significantly affected due to different levels of GA3 application. It revealed that the cauliflower plants receiving 200 ppm GA3 produced the longest seed stalk (79.53 cm), while the shortest (70.78 cm) seed stalk was found under the control condition (Table 1). It was observed that with an increase in concentrations of GA3, the length of cauliflower seed stalk increased up to 200 ppm GA3 and then decreased with the increase in the concentration of GA3. It indicated that the application of GA3 greatly influenced an increase in the length of cauliflower seed stalk. No significant variation was observed in the different levels of application time of GA3 (Table 2). The length of the cauliflower seed stalk varied significantly due to the interaction effect of different levels of GA3 and the time of application. The longest cauliflower seed stalk (86.07 cm) was found from 300 ppm GA3 applied 4 weeks after transplanting G3T4, and the shortest (67.80 cm) was found from G0T1 (Table 3). The seed stalk has photosynthetic pigments, and the green stalk contributes to seed development, grain filling, etc. longer stalk has more photosynthetic area and more possibility to supply food from the stalk (source) to seeds (sink). Sitapara et al. [96] found a higher stem length in cauliflower with the application of 100 ppm GA3 and 0.2 percent boric acid. These differences might be the application of boric acid in addition to GA3. Gibberellins are growth hormones weakly acidic in nature having gibbane ring structure which causes cell elongation of intact plants in the general and increased internodal length of seed stalk of plants. GA3 application stimulates seed stalks elongation in beet plants which is corroborative of our present findings [97].

3.7. Number of Primary Flowering Branches

The number of primary flowering branches were significantly influenced by different level of GA3 application. The greatest number of primary flowering branches (10.88) was recorded from 200 ppm GA3, followed by 100 ppm GA3 (10.82), and the lowest number was obtained from 400 ppm GA3 (9.90) (Table 1). The number of primary flowering branches varied due to GA3 application times. The maximum number of primary flowering branches (11.00) was found from the 1st-time application (T1) of GA3 and the minimum from the 4th-time application (T4) of GA3 (Table 2). The number of primary flowering branches also varied significantly due to the interaction effect of different levels of GA3 and the time of application. The maximum number of primary flowering branches (12.00) was found from G1T1 and the minimum (8.73) from G4T4 (Table 3). It revealed from the study that concentrations, application time, and their interaction had tremendous effects on the primary branching of cauliflower.

3.8. Number of Secondary Flowering Branches

The number of secondary branches was significantly influenced by different concentrations of GA3 in cauliflower. The maximum number of secondary flowering branches (31.42) was recorded from 100 ppm GA3, which was statistically similar to 200 ppm GA3 (31.33) and 300 ppm GA3 (31.20), and the minimum number of secondary flowering branches (26.90) from the control condition (Table 1). The number of secondary flowering branches varied significantly due to the difference in GA3 application time. The maximum number of secondary flowering branches of cauliflower (31.96) were found from GA3 applied at 3 weeks after transplanting (T1), and the minimum number of secondary flowering branches of cauliflower were found from GA3 applied at 6 weeks (T4) after transplanting (Table 2). The interaction effect between GA3 and the time of application was also significantly influenced by the secondary flowering branches of cauliflower. The maximum number of secondary flowering branches (34.87) was recorded from G2T1, and the minimum number of secondary primary flowering branches (23.07) was recorded from G0T4 (Table 3). It is revealed from the study that concentrations, application time, and their interaction had noteworthy effects on the secondary branching of cauliflower. Rastogi et al. [98] found a significant role in enhancing secondary branching, yield, and its related traits in linseed by the application of plant growth regulators. They concluded that the plant growth regulators could be successfully employed to enhance yield attributing traits including secondary branching and ultimately seed yield in linseed plants.

3.9. Length of the Pod

The length of the pod had a significant influence on different concentrations of GA3 in cauliflower. The highest pod length (4.98 cm) was recorded from the plants treated with GA3 200 ppm, and the lowest pod length was (4.63 cm) from the plants treated with GA3 100 ppm, which was statistically similar to GA3 300 ppm, GA3 400 ppm, and control condition (Table 1). The pod length of cauliflower was not significantly different from the GA3 application time (Table 2). Pod length varied significantly due to the interaction effect of different levels of GA3 and time of application. The maximum length of the pod (5.21 cm) was recorded from the G2T2 treatment, and the minimum length of the pod (4.43 cm) was recorded from the G3T2 treatment (Table 3). Singh et al. [99] obtained a significant influence of ethrel (PGR) on the pod length of cauliflower. Exogenous application of GA3, 7 days after emergence at different doses significantly increased pod length in cowpea [8]. Ayyub et al. [100] have shown that the foliar application of GA3 substantially improved the reproductive growth of okra compared to control plants. It was found that application at different growth stages of okra predominantly boosted the length of pods. Foliar application of GA3 on mungbean enhances pod length [101].

3.10. Number of Pods per Plant

The application of GA3 at different concentrations had no significant effect on pod number per plant of cauliflower (Table 4). The time of application of GA3 had a pronounced variation for pods per plant. The highest number of pods (615.2) was found from GA3 applied at 3 weeks after transplanting (T1), and the lowest number of pods (530.5) was found from GA3 applied at 6 weeks (T4) after transplanting. This result showed that with increasing GA3 application time, the pod number per plant decreased gradually (Table 5). The number of pods per plant was also found to significantly differ by different treatments. The highest number of pods (707.0) was found in the G2T2 treatment, which was statistically similar to the G3T1 treatment (705.5), and the lowest number of pods (435.0) was found in the G1T2 treatment (Table 6). Zia [102] found the maximum number of pods per plant in cauliflower with the application of 350 ppm GA3. However, we found a higher number of pods compared to the results of Zia [102], which might be due to the differences in varietal genetic makeup, cultural technique, management process, and deviation of environmental conditions in different locations. Ayyub et al. [100] reported that GA3 application in the foliage at different growth stages of okra significantly enhanced the number of pods per plant. Exogenous application of GA3, seven days after emergence at different doses significantly increased pod number/plant in cowpea [8]. Foliar application of GA3 on mungbean enhances the number of pods per plant [101].

3.11. Number of Seeded Pods per Plant

The pronounced variations among seeded pods per plant were observed with the application of different concentrations of GA3. The highest number of seeded pods (465.0) per plant was produced in plants treated with GA3 200 ppm. The second-highest number of the seeded pods (423.5) per plant was found in GA3 300 ppm, which was statistically similar to GA3 100 ppm (414.5) and GA3 400 ppm (393.5). The lowest number of seeded pods per plant was found in control conditions (Table 4). The number of seeded pods per plant significantly differed from the GA3 application at different times. The highest number of seeded pods (460.1) was found from GA3 applied at 3 weeks (T1), and the lowest number of the seeded pods (371.3) was found from GA3 applied at 6 weeks (T4) after transplanting. This result showed that with the increase in GA3 application time, the seeded pod’s number per plant decreased gradually (Table 5). The number of seeded pods per plant also varied significantly due to the interaction effect of different levels of GA3 and the time of application. The maximum number of seeded pods per plant (570.0) was found in treatment G2T2, and the minimum number of seeded pods per plant (303.7) was found in treatment G3T4, which was statistically similar to G3T4 treatment (304.0) (Table 6). Application of 350 ppm GA3 in cauliflower confirmed a maximum number of seeded pods observed per plant [102]. Nevertheless, we obtained greater seeded pods than the results reported by Zia [102]. The reason may be due to the deviation in genotype performance, growing environments, management practices, or differences in geographical locations. Foliar GA3 application at different growth stages of okra mostly increased the number of seeded pods per plant [100].

3.12. Number of Empty Pods per Plant

There was a significant influence of the different concentrations of GA3 on the number of empty pods per plant in cauliflower. The lowest number of empty pods per plant (135.9) was found from the plant receiving 200 ppm GA3, and the highest number of empty pods (172.7) was found from the plant receiving 300 ppm GA3 (Table 4). The GA3 application did not significantly influence the number of empty pods per plant at different times (Table 5). The number of empty pods per plant varied significantly due to the interaction effect of different levels of GA3 and the time of application. The lowest number of empty pods (118.5) was recorded from the G1T2 treatment, which was statistically similar to the G2T1 treatment (120.1), and the highest number of empty pods (196.6) was recorded from the G3T4 treatment (Table 6). The lowest number of empty pods per plant in cauliflower was reported from the application of 350 ppm GA3 [102]. We also observed lower empty pods which were consistent with the findings of a previous study on cauliflower [102].

3.13. Days to Seed Maturity

There were no significant differences in days to seed maturity at different concentrations of gibberellic acid (Table 4). Similarly, the effect of application GA3 time on days required for seed maturity of cauliflower was found not significant (Table 5). The interaction effect between GA3 and time of application was significantly influenced by the days required until seed maturity in cauliflower. The earliest seed maturity (138.7) was obtained from 100 ppm GA3 application after 5 weeks of transplanting G1T3 treatment, and the latest seed maturity (150.4) was obtained from 100 ppm GA3 application after 4 weeks of transplanting G1T2 treatment (Table 6).

3.14. Number of Seeds per Pod

The number of seeds per pod was influenced significantly due to the different concentrations of GA3 application. The maximum seeds per pod (10.87) were recorded from plants receiving GA3 200 ppm, and the minimum seeds per pod (8.81) were recorded from plants receiving GA3 400 ppm, which were statistically similar to GA3 300 ppm and control conditions (Table 4). The GA3 application did not significantly influence the number of seeds per pod at different times (Table 5). The number of seeds per pod varied significantly due to the interaction effect of different levels of GA3 and the time of application. The highest number of seeds per pod (11.30) was recorded from the G2T2 treatment, which was statistically similar to the G2T1 treatment (11.29), and the lowest number of seeds per pod (7.47) was recorded from the G0T2 treatment (Table 6). Literature has shown that the number of seeds per pod in lady fingers was preponderantly augmented with the application of GA3 at different growth stages [100]. Exogenous application of GA3, seven days after emergence at different doses significantly increased seed number/pod in cowpea [8]. Foliar application of GA3 on mungbean enhances the number of seeds per pod [101]. The application of GA3 significantly increased the number of seeds per pod in okra [103].

3.15. Weight of Seeds per Plant

GA3 200 ppm treated plants produced the greatest weight of (16.16 g) seeds per plant and the lowest weight was recorded in control conditions (12.38 g) (Table 4). The seeds’ weight per plant significantly varied by GA3 application times. The highest seed weight per plant (16.68 g) was found from the GA3 application at three weeks (T1), and the lowest seed weight per plant (13.11 g) was found from the GA3 application at six weeks (T4) after transplanting. This result showed that with increasing GA3 application time, seeds’ weight per plant decreased gradually (Table 5). The weight of seeds per plant varied significantly due to the interaction effect of different levels of GA3 and the time of application. The highest seeds weight (22.75 g) was recorded from the G2T1 treatment, and the lowest seeds weight per plant (10.76 g) was recorded from the G1T4 treatment, which was statistically similar to the G0T3 treatment (120.1) and G3T2 treatment (11.47 g) (Table 6). GA3 influenced the seed yield per plant and the quality of onion. GA3 concentrations significantly varied the seed yield per plant. Higher doses (100 ppm GA3) were more effective and showed a linear relationship in seed yield of onion than the control [9]. Seed weight per plant of okra was improved by applying GA3 on the leaf at different growth stages [100]. Foliar application of GA3 on mungbean enhances the fresh and dry weight of pods [101].

3.16. Weight of 1000 Seeds

The application of different concentrations of GA3 revealed significant variation in regards to weight of 1000 seeds. The highest weight of 1000 seeds (4.823 g) was obtained from 200 ppm GA3, and the lowest weight of 1000 seeds (4.72 g) were recorded from GA3 400 ppm, which was identical to GA3 300 ppm (4.72 g) (Table 4). The weight of 1000 seeds were significantly influenced by the GA3 application at different times. The maximum 1000 seed weight (4.79 g) was found from the 1st-time application (T1) of GA3, which was identical to the 2nd-time (4.79 g) and 3rd-time (4.83 g) GA3 application, and the lowest 1000 seed weight (4.61 g) was recorded from the 4th-time application (T4) of GA3 (Table 5). The interaction effect between GA3 and time of application was significantly influenced by the 1000 seed weight of cauliflower. The maximum 1000 seed weight (5.32 g) was obtained from the G1T3 treatment, and the minimum 1000 seed weight (4.39 g) was obtained from the G1T4 treatment (Table 6). GA3 influenced the seed yield and quality of onion. GA3 concentrations significantly varied the thousand seed weight. Higher doses (100 ppm GA3) were more effective and showed a linear relationship in seed yield of onion than control [9]. Ayyub et al. [100] applied GA3 in the leaves of okra at different growth stages and found improved seed weight. Exogenous application of GA3 seven days after emergence at different doses significantly increased 100 seed weight in cowpea [8]. Foliar application of GA3 on mungbean enhances 1000 seed weight [101].

3.17. Seed Yield

The seed yield of cauliflower per hectare was significantly influenced by the different concentrations of GA3. The highest seed yield (0.24 t/ha) was produced by the plants grown with the 200 ppm GA3 and the second highest (0.22 t/ha) seed yield was found from 300 ppm GA3, which was identical to 400 ppm GA3 (0.21 t/ha) and 100 ppm GA3 (0.21 t/ha). In contrast, the lowest seed yield per plot (0.18 t/ha) was found in the control conditions (Table 4). The seed yield of cauliflower per hectare was not significantly varied due to the GA3 application at different times (Table 5). The seed yield of cauliflower per hectare varied significantly due to the interaction effect of different levels of GA3 and the time of application. The highest seed yield (0.27 t/ha) was recorded from the G2T1 treatment, and the lowest seed yield (0.15 t/ha) was recorded from the G0T2 treatment, which was statistically similar to the G0T3 treatment (0.17 t/ha) and G1T4 treatment (0.17 t/ha) (Table 6). GA3 influenced the seed yield and quality of onion. GA3 concentrations significantly varied the seed yield per plant. Higher doses (100 ppm GA3) were more effective and showed a linear relationship in seed yield of onion than control [9]. The seed yield of okra was significantly augmented with the foliar application of GA3 at different growth stages of okra [100]. Exogenous application of GA3, seven days after emergence at different doses increased ha−1 [8]. Foliar application of GA3 on mungbean enhances seed yield per plant and seed yield per hectare [101]. Mangal et al. [104] reported that GA3 at the rate of 50–250 ppm improved the seed yield of cauliflower. Mohanta et al. [11] reported that the foliar application of 200 ppm GA3 had the highest seed production capacity in carrot seed.

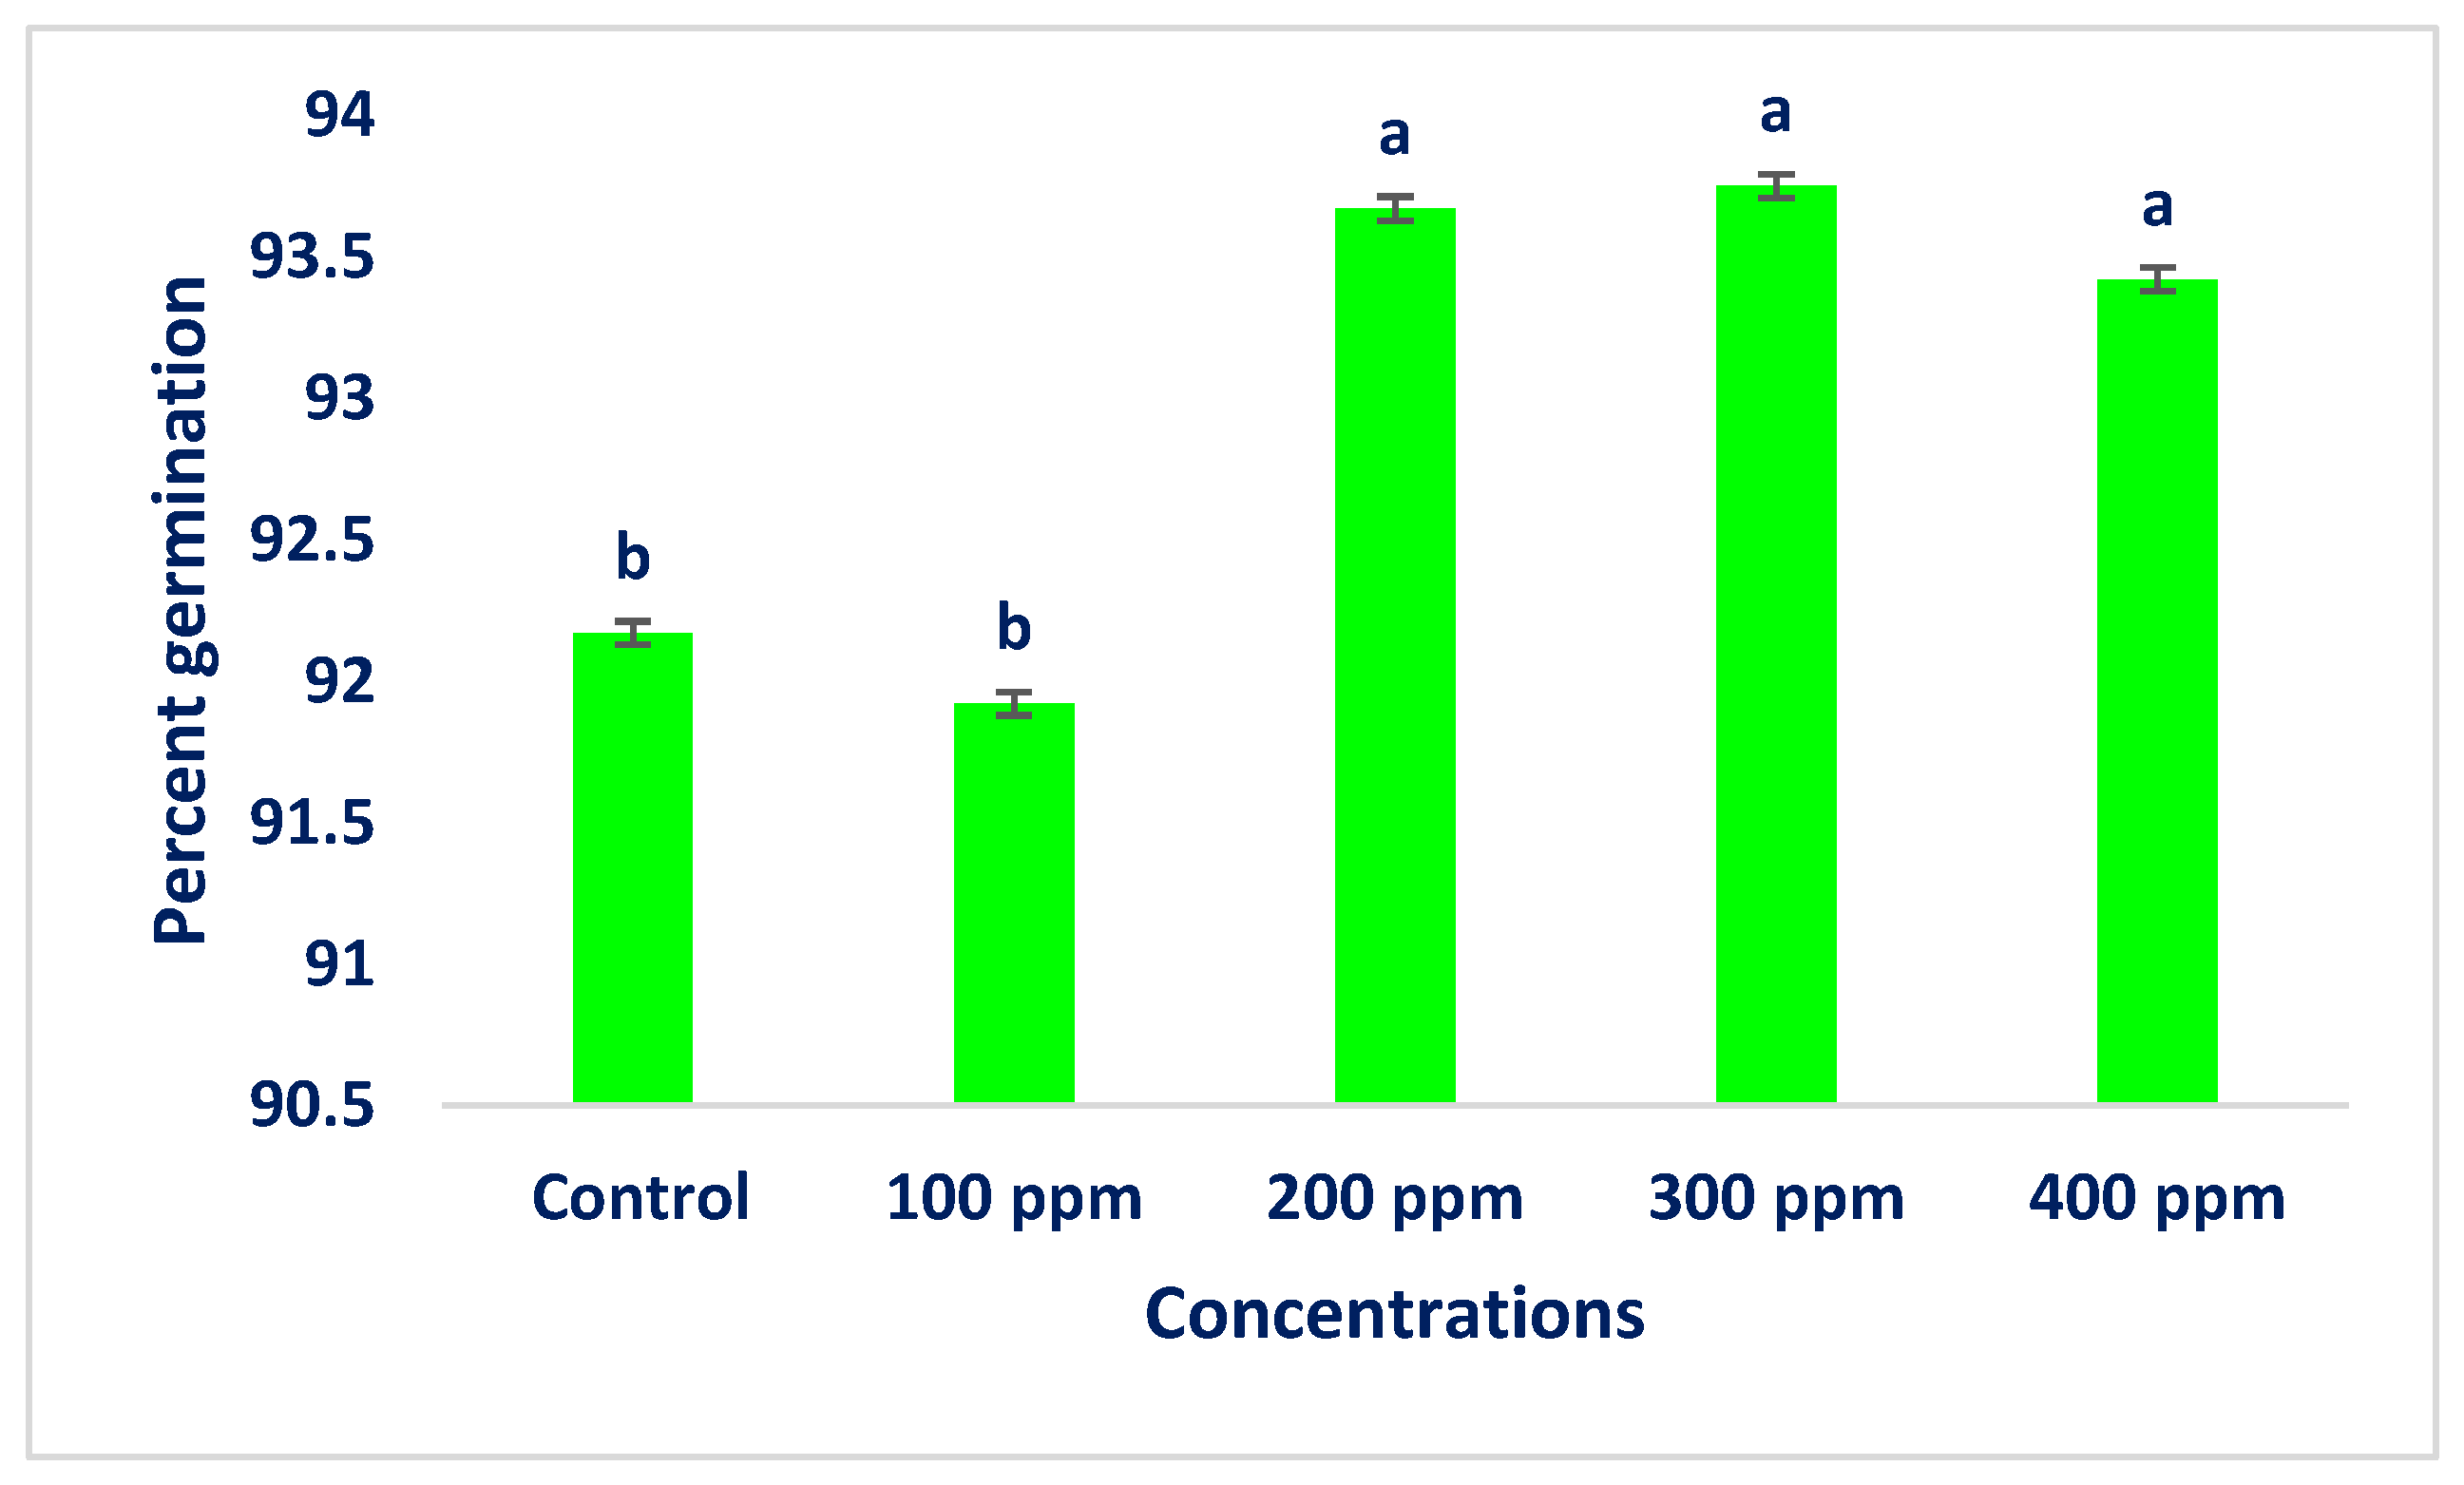
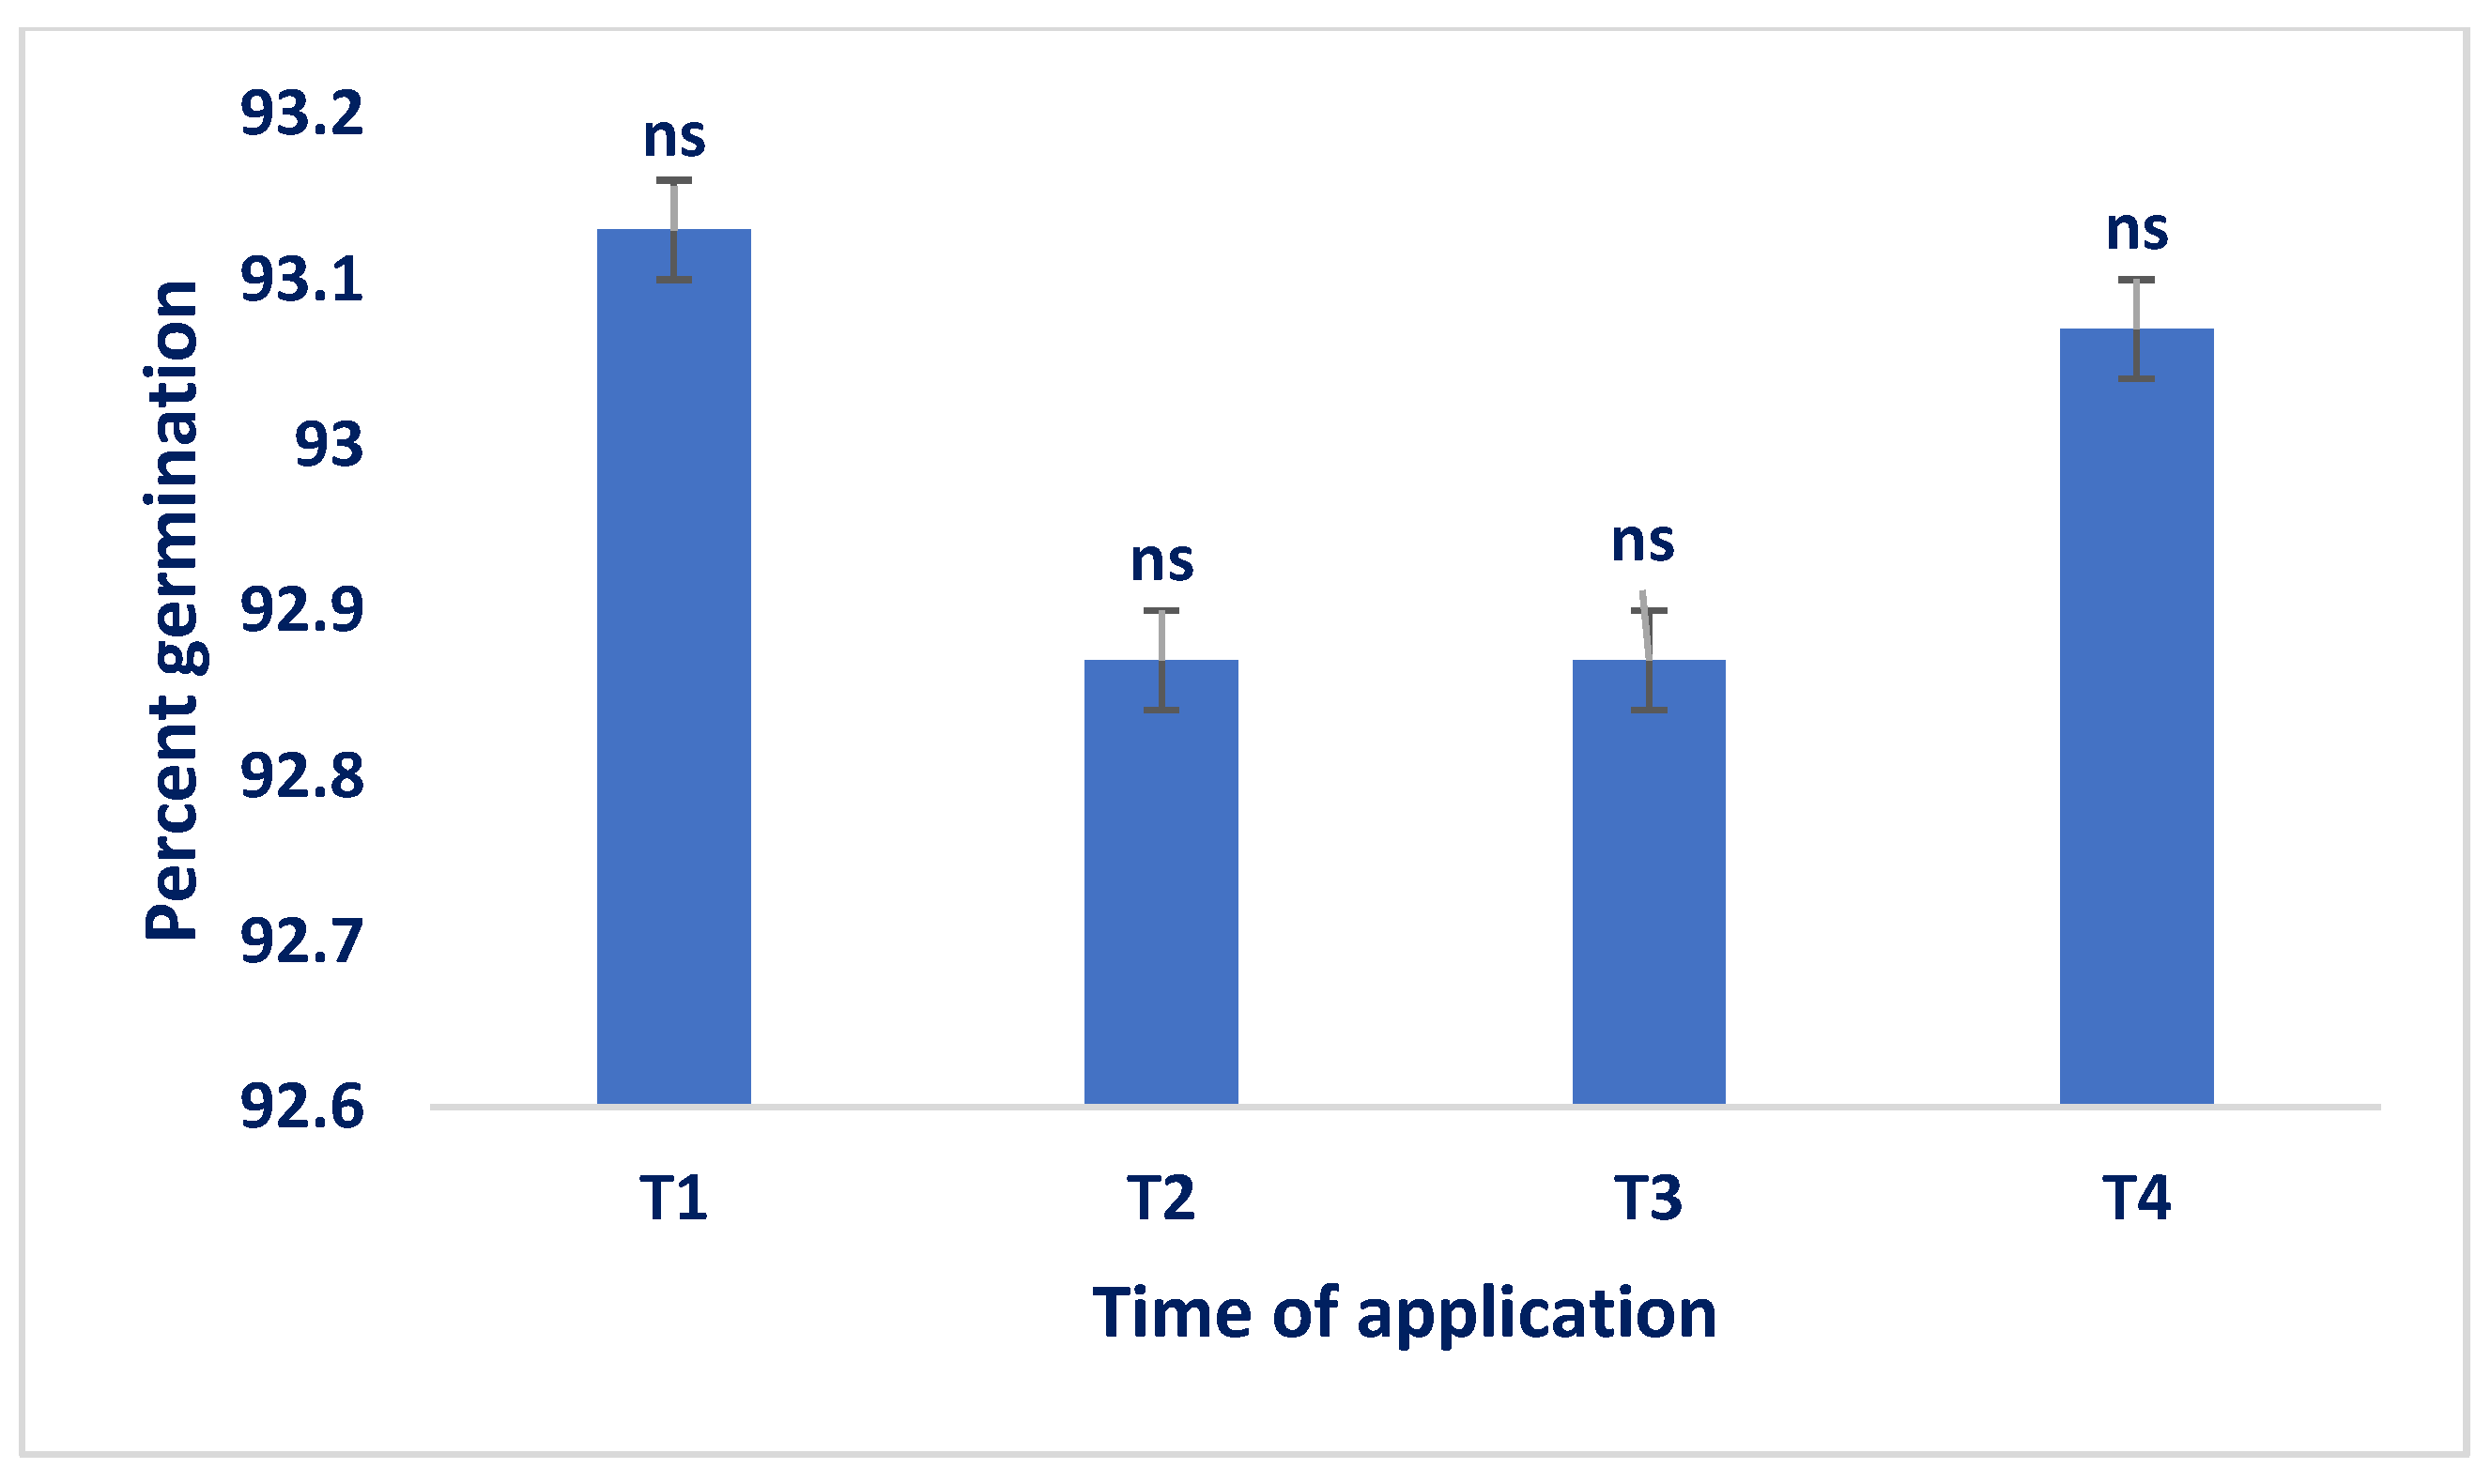
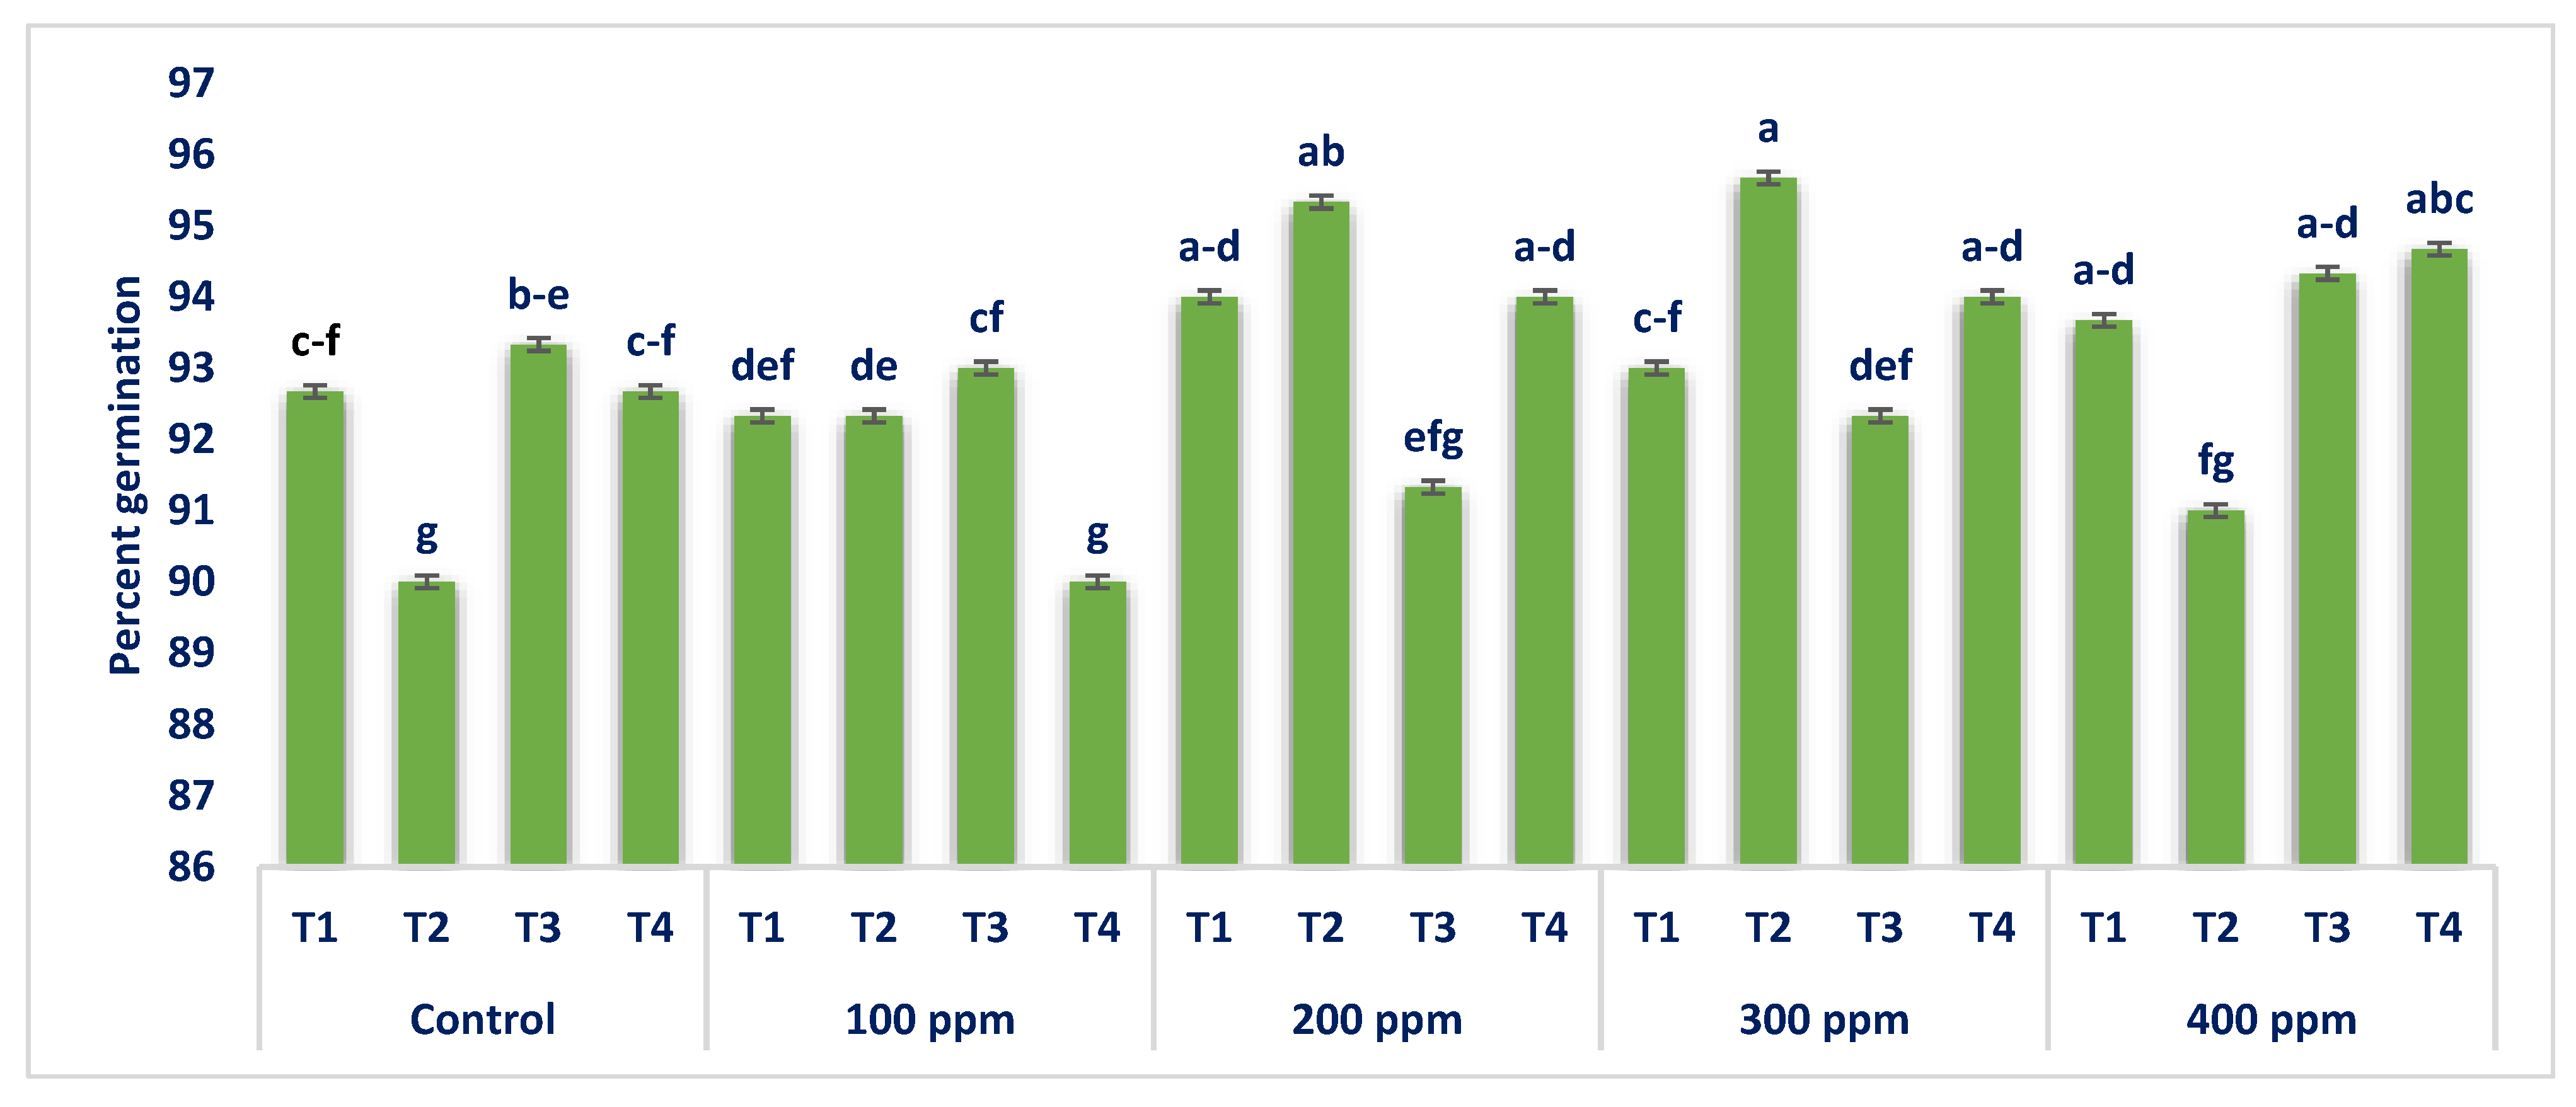
3.18. Seed Germination Test

Analysis of variance revealed significant variation across the percentage of germination of the produced seeds of cauliflower using different concentrations of gibberellic acid during cultivation. The highest percentage of germination (93.75%) was observed in the seeds of cauliflower grown using 300 ppm GA3 during cultivation which was statistically similar to 400 ppm GA3 (93.42%) and 200 ppm GA3 (93.67%). In contrast, the lowest germination was obtained from the seeds of cauliflower grown using 100 ppm GA3 (91.92) during cultivation and which was statistically similar to the control conditions (Figure 1).
The percentage of germination of produced cauliflower seeds was not significantly influenced by the GA3 application at different times during cultivation. (Figure 2).
The interaction effect between GA3 and time of application during cultivation significantly influenced the percentage of germination of produced cauliflower seeds. The highest germination percentage (95.67%) of cauliflower seeds was obtained from the G3T2 treatment during cultivation, and the lowest germination percentage (90.00%) was obtained from the G1T4 treatment during cultivation which was statistically similar to G0T2 treatment during cultivation. The percent germination of cauliflower seeds ranged from 90.00% to 95.67%. Application of gibberellic acid had minor influences on the seed germination albeit it was statistically significant (Figure 3). Singh et al. (1976) found 83% germination of cauliflower seed with the application of Ethrel @ 150 ppm.

3.19. Economic Analysis

The highest cost of production (Tk. 151718/ha) was found in 400 ppm GA3, and the lowest cost of production (Tk. 129498/ha) was found in the control treatment. The treatment of 200 ppm GA3 gave the highest gross return (Tk. 610250/ha) and net return (Tk. 469641/ha). On the other hand, the lowest gross return (Tk. 438250/ha) and net return (Tk. 308752/ha) were recorded from the control treatment. The benefit-cost ratio (BCR) was found to be the highest (4.34) in 200 ppm GA3, while the lowest benefit-cost ratio (3.38) was recorded from the control treatment (Table 7). Among all the treatments, the variation was due to the cost of different concentrations of gibberellic acid. Zia [78] calculated the highest gross return, net return, and benefit-cost ratio in cauliflower seed production with the application of 350 ppm GA3. On the other hand, the lowest gross return, net return, and benefit-cost ratio were recorded from the control treatment.
Bangladesh is situated in a subtropical region; therefore, the climatic conditions of Bangladesh are not favorable for the seed production of cauliflower. As a result, every year, almost all the required cauliflower seeds are directly imported from abroad at the expense of large sums of foreign currency; however, BU cauliflower-1 released from the Department of Horticulture of our university was able to produce seeds in ambient field conditions in Bangladesh (without any greenhouse facility), which opens the opportunity to produce cauliflower seeds in Bangladesh, albeit the average seed yield is quite low compared to the average seed yield in cooler countries. Nevertheless, our experiment has shown that foliar application of 200 ppm GA3 three weeks after transplanting enhanced the cauliflower seed production with the highest return and benefit-cost ratio in the study area. Thus, we can use this production technology for cauliflower seed production in Bangladesh. It ultimately increases cauliflower production in Bangladesh due to the availability of seeds and saves on expenditure by reducing the import of seeds.
We performed the study in a particular area (our university campus). As cultivar potential is the result of genotype (G), environment (E), and interaction of genotype-environment (G × E), we recommend multilocation trials in the different agro-ecological regions of Bangladesh for final confirmation of the results.

4. Conclusions

Among different concentrations of gibberellic acid, plants treated with 200 ppm GA3 showed the highest number of primary and secondary flowering branches, pods, seeded pods, pod length, seed yield per plant, seed yield per plot with the earliest curd and flower initiation, and the highest return and benefit-cost ratio (BCR). GA3 application at 3 weeks after transplanting had the highest numbers of primary and secondary flowering branches, pods, seeded pods, and seed yield per plant. The treatment combinations of 200 ppm GA3 three weeks after transplanting gave the earliest curd initiation, the highest number of primary and secondary flowering branches, and seed yield per hectare, whereas 200 ppm GA3 application four weeks after transplanting gave the earliest flower initiation with the highest pod length, number of the pods, seeded pods, and seeds per pod. Increasing seed yield was our ultimate goal; hence, 200 ppm GA3 at three weeks after transplanting could be used as the best combination for cauliflower seed production with the highest return and benefit-cost ratio.

Supplementary Materials

The following are available online at https://www.mdpi.com/article/10.3390/agronomy12061394/s1, Table S1: Air temperature, relative humidity and rainfall during October, 2017 to February, 2018, Table S2: Chemical composition of cow dung (composted).

Author Contributions

Conceptualization, M.A.H. and U.S.; Writing—original draft preparation, U.S.; M.M.P.; S.E., A.A., R.U., M.H.A. and H.R.H.M.; Data curation, M.A.H. and M.M.P.; Validation, U.S., M.A.H., M.M.P., M.S.B., S.E., A.A., R.U., M.H.A., H.R.H.M. and A.N.; Visualization, U.S., M.A.H. and M.M.P.; Writing—review and editing, M.M.P., U.S.; M.A.H., M.S.B., S.E., A.A., R.U., H.R.H.M. and A.N.; Investigation, M.A.H., U.S., M.S.B. and M.M.P.; Methodology, U.S. and M.M.P.; Supervision, U.S. and M.A.H.; Resource, M.A.H.; Software, U.S.; M.A.H. and S.E.; Formal analysis U.S., M.A.H., M.M.P. and S.E. All authors have read and agreed to the published version of the manuscript.

Funding

This project was supported by the Researchers Supporting Project (RSP-2021/191), King Saud University, Riyadh, Saudi Arabia.

Institutional Review Board Statement

Not applicable.

Informed Consent Statement

Not applicable.

Data Availability Statement

Data recorded in the current study are available in all Tables and Figures of the manuscript.

Acknowledgments

The authors would like to extend their sincere appreciation to the Researchers Supporting Project (RSP-2021/191), King Saud University, Riyadh, Saudi Arabia.

Conflicts of Interest

All the authors have no conflict of interest.

References

  1. Nimkar, S.A.; Korla, B.N. Studies on Comparison of Biparental and F4 Progenies in Late Cauliflower (Brassica oleracea L. var. botrytis). Int. J. Farm Sci. 2014, 4, 27–34. [Google Scholar]
  2. Bangladesh Bureau of Statistics (BBS). Yearbook of Agricultural Statistics-2020; Statistics and Informatics Division (SID) Ministry of Planning Government of the People’s Republic of Bangladesh: Dhaka, Bangladesh, 2021; pp. 332–333. [Google Scholar]
  3. Akter, S.; Islam, M.S.; Rahman, M.S. An Economic Analysis of Winter Vegetables Production in Some Selected Areas of Narsingdi District. J. Bangladesh Agric. Univ. 2011, 9, 241–246. [Google Scholar] [CrossRef] [Green Version]
  4. Bhandari, S.R.; Kwak, J. Chemical Composition and Antioxidant Activity in Different Tissue of Brassica Vegetables. Molecules 2015, 20, 1228–1243. [Google Scholar] [CrossRef] [Green Version]
  5. Podsedek, A. Natural Antioxidants and Antioxidant Capacity of Brassica Vegetables: A Review. LWT-Food Sci. Technol. 2007, 40, 1–11. [Google Scholar] [CrossRef]
  6. Kaur, P.; Mal, D. Effect of Foliar Spray of NAA and GA3 on The Growth, Curd Formation and Yield of Cauliflower (Brassica oleracea L. var. botrytis). J. Pharma. Phytochem. 2018, 7, 2805–2807. [Google Scholar]
  7. Ayub, A.; Mian, I.H.; Ahmed, H.U.; Alam, M.Z. Effect of Date of Planting on Altemaria Blight of Cauliflower Seed Crop. Bangladesh J. Plant Pathol. 2005, 21, 67–69. [Google Scholar]
  8. Emongor, V. Gibberellic Acid (GA3) Influence on Vegetative Growth, Nodulation, and Yield of Cowpea (Vigna unguiculata (L.) Walp. J. Agron. 2007, 6, 509–517. [Google Scholar]
  9. Ali, M.A.; Hossain, M.M.; Zakaria, M.; Islam, M.M. Effect of GA3 on quality seed production of onion in Bangladesh. Ecofriendly Agric. J. 2015, 8, 47–50. [Google Scholar]
  10. Richards, D.E.; Ait-Ali, K.E.T.; Harberd, N.P. How Gibberellin Regulates Growth and Development: A Molecular Genetic Analysis of Gibberellin Signaling. Annu. Rev. Plant Physiol. Plant Mol. Biol. 2001, 52, 67–88. [Google Scholar] [CrossRef] [Green Version]
  11. Mohanta, H.C.; Hossain, M.M.; Islam, M.S.; Salam, M.A.; Saha, S.R. Effect of Plant Growth Regulators on Seed Yield of Carrot. Ann. Bangladesh Agric. 2015, 19, 23–31. [Google Scholar]
  12. Tiwari, D.K.; Pandey, P.; Giri, S.P.; Dwivedi, J.L. Effect of GA3 and Other Plant Growth Regulators on Hybrid Rice Seed Production. Asian J. Plant Sci. 2011, 10, 133–139. [Google Scholar] [CrossRef] [Green Version]
  13. Attallah, S.; Abbas, H.S. Effect of Gibberellic Acid on The Earliness of Cauliflower Curd Initiation Under Asuit Conditions. Assiut. J. Agric. Sci. 2016, 43, 48–56. [Google Scholar]
  14. Sarker, U.; Islam, M.T.; Rabbani, M.G.; Oba, S. Genotypic Variability for Nutrient, Antioxidant, Yield and Yield Contributing Traits in Vegetable Amaranth. J. Food Agric. Environ. 2014, 12, 168–174. Available online: https://www.wflpublisher.com/Abstract/5378 (accessed on 9 May 2022).
  15. Sarker, U.; Islam, M.T.; Rabbani, M.G.; Oba, S. Variability, heritability and genetic association in vegetable amaranth. Spanish J. Agric. Res. 2015, 13, 17. [Google Scholar] [CrossRef] [Green Version]
  16. Sarker, U.; Islam, M.T.; Oba, S. Salinity Stress Accelerates Nutrients, Dietary Fiber, Minerals, Phytochemicals and Antioxidant Activity in Amaranthus tricolor Leaves. PLoS ONE 2018, 13, e0206388. [Google Scholar] [CrossRef] [Green Version]
  17. Sarker, U.; Islam, M.T.; Rabbani, M.G.; Oba, S. Variability in Total Antioxidant Capacity, Antioxidant Leaf Pigments and Foliage Yield of Vegetable Amaranth. J. Integr. Agric. 2018, 17, 1145–1153. [Google Scholar] [CrossRef] [Green Version]
  18. Sarker, U.; Islam, M.T.; Rabbani, M.G.; Oba, S. Phenotypic Divergence in Amaranth for Total Antioxidant Capacity, Antioxidant Profile, Dietary Fiber, Nutritional and Agronomic Traits. Acta Agric. Scand. Sect. B-Soil Plant Sci. 2018, 68, 67–76. [Google Scholar] [CrossRef]
  19. Sarker, U.; Oba, S. Catalase, Superoxide Dismutase and Ascorbate-Glutathione Cycle Enzymes Confer Drought Tolerance of A. tricolor. Sci. Rep. 2018, 8, 16496. [Google Scholar] [CrossRef] [Green Version]
  20. Sarker, U.; Oba, S. Drought Stress Enhances Nutritional and Bioactive Compounds, Phenolic Acids and Antioxidant Capacity of Amaranthus Leafy Vegetable. BMC Plant Biol. 2018, 18, 258. [Google Scholar] [CrossRef] [Green Version]
  21. Sarker, U.; Oba, S. Drought Stress Effects on Growth, ROS Markers, Compatible Solutes, Phenolics, Flavonoids, and Antioxidant Activity in Amaranthus tricolor. Appl. Biochem. Biotechnol. 2018, 186, 999–1016. [Google Scholar] [CrossRef]
  22. Sarker, U.; Oba, S. Response of Nutrients, Minerals, Antioxidant Leaf Pigments, Vitamins, Polyphenol, Flavonoid and Antioxidant Activity in Selected Amaranth under Four Soil Water Content. Food Chem. 2018, 252, 72–83. [Google Scholar] [CrossRef] [PubMed]
  23. Sarker, U.; Oba, S. Augmentation of Leaf Color Parameters, Pigments, Vitamins, Phenolic Acids, Flavonoids and Antioxidant Activity in Selected Amaranthus tricolor under Salinity Stress. Sci. Rep. 2018, 8, 12349. [Google Scholar] [CrossRef] [PubMed] [Green Version]
  24. Azad, A.K.; Goshwami, B.K.; Rahman, M.L.; Malakar, P.K.; Hasan, S.; Rahman, H.H. (Eds.) Krishi Projukti Hatboi (In Bengali), 7th ed.; Bangladesh Agricultural Research Institute: Gazipur, Bangladesh, 2017; pp. 169–170. [Google Scholar]
  25. Sarker, U.; Oba, S.; Ercisli, S.; Assouguem, A.; Alotaibi, A.; Ullah, R. Bioactive Phytochemicals and Quenching Activity of Radicals in Selected Drought-Resistant Amaranthus tricolor Vegetable Amaranth. Antioxidants 2022, 11, 578. [Google Scholar] [CrossRef] [PubMed]
  26. Alam, M.A.; Juraimi, A.S.; Rafii, M.Y.; Hamid, A.A.; Aslani, F.; Alam, M.Z. Effects of Salinity and Salinity-Induced Augmented Bioactive Compounds in Purslane (Portulaca oleracea L.) for Possible Economical Use. Food Chem. 2015, 169, 439–447. [Google Scholar] [CrossRef]
  27. Sarker, U.; Islam, M.T.; Rabbani, M.G.; Oba, S. Variability in Composition of Vitamins and Mineral Antioxidants in Vegetable Amaranth. Genetika 2015, 47, 85–96. [Google Scholar] [CrossRef]
  28. Sarker, U.; Islam, M.T.; Rabbani, M.G.; Oba, S. Genetic Variation and Interrelationships among Antioxidant, Quality, and Agronomic Traits in Vegetable Amaranth. Turk. J. Agric. For. 2016, 40, 526–535. [Google Scholar] [CrossRef]
  29. Sarker, U.; Islam, M.T.; Rabbani, M.G.; Oba, S. Antioxidant Leaf Pigments and Variability in Vegetable Amaranth. Genetika 2018, 50, 209–220. [Google Scholar] [CrossRef] [Green Version]
  30. Chakrabarty, T.; Sarker, U.; Hasan, M.; Rahman, M.M. Variability in Mineral Compositions, Yield and Yield Contributing Traits of Stem Amaranth (Amaranthus lividus). Genetika 2018, 50, 995–1010. [Google Scholar] [CrossRef] [Green Version]
  31. Sarker, U.; Oba, S. Salinity Stress Enhances Color Parameters, Bioactive Leaf Pigments, Vitamins, Polyphenols, Flavonoids and Antioxidant Activity in Selected Amaranthus Leafy Vegetables. J. Sci. Food Agric. 2019, 99, 2275–2284. [Google Scholar] [CrossRef]
  32. Sarker, U.; Oba, S. Protein, Dietary Fiber, Minerals, Antioxidant Pigments and Phytochemicals, and Antioxidant Activity in Selected Red Morph Amaranthus Leafy Vegetable. PLoS ONE 2019, 14, e0222517. [Google Scholar] [CrossRef] [Green Version]
  33. Sarker, U.; Oba, S. Nutraceuticals, Antioxidant Pigments, and Phytochemicals in the Leaves of Amaranthus spinosus and Amaranthus viridis Weedy Species. Sci Rep. 2019, 9, 20413. [Google Scholar] [CrossRef] [PubMed] [Green Version]
  34. Sarker, U.; Oba, S. Antioxidant Constituents of Three Selected Red and Green Color Amaranthus Leafy Vegetable. Sci. Rep. 2019, 9, 18233. [Google Scholar] [CrossRef] [PubMed] [Green Version]
  35. Rashad, M.M.I.; Sarker, U. Genetic Variations in Yield and Yield Contributing Traits of Green Amaranth. Genetika 2020, 52, 393–407. [Google Scholar] [CrossRef]
  36. Hasan-Ud-Daula, M.; Sarker, U. Variability, Heritability, Character Association, and Path Coefficient Analysis in Advanced Breeding Lines of Rice (Oryza sativa L.). Genetika 2020, 52, 711–726. [Google Scholar] [CrossRef]
  37. Azad, A.K.; Sarker, U.; Ercisli, S.; Assouguem, A.; Ullah, R.; Almeer, R.; Sayed, A.A.; Peluso, I. Evaluation of Combining Ability and Heterosis of Popular Restorer and Male Sterile Lines for the Development of Superior Rice Hybrids. Agronomy 2022, 12, 965. [Google Scholar] [CrossRef]
  38. Hasan, M.J.; Kulsum, M.U.; Majumder, R.R.; Sarker, U. Genotypic Variability for Grain Quality Attributes in Restorer Lines of Hybrid Rice. Genetika 2020, 52, 973–989. [Google Scholar] [CrossRef]
  39. Hossain, M.N.; Sarker, U.; Raihan, M.S.; Al-Huqail, A.A.; Siddiqui, M.H.; Oba, S. Influence of Salinity Stress on Color Parameters, Leaf Pigmentation, Polyphenol and Flavonoid Contents, and Antioxidant Activity of Amaranthus lividus Leafy Vegetables. Molecules 2022, 27, 1821. [Google Scholar] [CrossRef]
  40. Sarker, U.; Rabbani, M.G.; Oba, S.; Eldehna, W.M.; Al-Rashood, S.T.; Mostafa, N.M.; Eldahshan, O.A. Phytonutrients, Colorant Pigments, Phytochemicals, and Antioxidant Potential of Orphan Leafy Amaranthus Species. Molecules 2022, 27, 2899. [Google Scholar] [CrossRef]
  41. Sarker, U.; Azam, M.G.; Talukder, M.Z.A. Genetic Variation in Mineral Profiles, Yield Contributing Agronomic Traits, and Foliage Yield of Stem Amaranth. Genetika 2022, 54, 91–108. [Google Scholar] [CrossRef]
  42. Sarker, U.; Oba, S.; Alsanie, W.F.; Gaber, A. Characterization of Phytochemicals, Nutrients, and Antiradical Potential in Slim Amaranth. Antioxidants 2022, 11, 1089. [Google Scholar] [CrossRef]
  43. Sarker, U.; Oba, S. The Response of Salinity Stress-Induced A. tricolor to Growth, Anatomy, Physiology, Non-Enzymatic and Enzymatic Antioxidants. Front. Plant Sci. 2020, 11, 559876. [Google Scholar] [CrossRef] [PubMed]
  44. Sarker, U.; Oba, S. Nutritional and Bioactive Constituents and Scavenging Capacity of Radicals in Amaranthus hypochondriacus. Sci. Rep. 2020, 10, 19962. [Google Scholar] [CrossRef] [PubMed]
  45. Sarker, U.; Oba, S. Nutrients, Minerals, Pigments, Phytochemical, and Radical Scavenging Activity in Amaranthus blitum Leafy Vegetable. Sci. Rep. 2020, 10, 3868. [Google Scholar] [CrossRef] [PubMed] [Green Version]
  46. Sarker, U.; Oba, S. Leaf Pigmentation, Its Profiles and Radical Scavenging Activity in Selected Amaranthus tricolor Leafy Vegetables. Sci. Rep. 2020, 10, 18617. [Google Scholar] [CrossRef]
  47. Sarker, U.; Oba, S. Polyphenol and Flavonoid Profiles and Radical Scavenging Activity in Selected Leafy Vegetable Amaranthus gangeticus. BMC Plant Biol. 2020, 20, 499. [Google Scholar] [CrossRef] [PubMed]
  48. Sarker, U.; Oba, S. Phenolic Profiles and Antioxidant Activities in Selected Drought-Tolerant Leafy Vegetable Amaranth. Sci. Rep. 2020, 10, 18287. [Google Scholar] [CrossRef]
  49. Sarker, U.; Hossain, M.N.; Iqbal, M.A.; Oba, S. Bioactive Components and Radical Scavenging Activity in Selected Advance Lines of Salt-Tolerant Vegetable Amaranth. Front. Nutr. 2020, 7, 587257. [Google Scholar] [CrossRef]
  50. Sarker, U.; Oba, S. Nutraceuticals, Phytochemicals, and Radical Quenching Ability of Selected Drought-Tolerant Advance Lines of Vegetable Amaranth. BMC Plant Biol. 2020, 20, 564. [Google Scholar] [CrossRef]
  51. Sarker, U.; Hossain, M.M.; Oba, S. Nutritional and Antioxidant Components and Antioxidant Capacity in Green Morph Amaranthus Leafy Vegetable. Sci. Rep. 2020, 10, 1336. [Google Scholar] [CrossRef]
  52. Sarker, U.; Oba, S.; Daramy, M.A. Nutrients, Minerals, Antioxidant Pigments and Phytochemicals, and Antioxidant Capacity of the Leaves of Stem Amaranth. Sci. Rep. 2020, 10, 3892. [Google Scholar] [CrossRef] [Green Version]
  53. Sarker, U.; Islam, M.T.; Rabbani, M.G.; Oba, S. Genotypic Diversity in Amaranth for Antioxidant, Nutrient and Agronomic Traits. Indian J. Genet. Pl. Breed. 2017, 77, 173–176. [Google Scholar] [CrossRef]
  54. Sarker, U.; Oba, S. Color Attributes, Betacyanin, and Carotenoid Profiles, Bioactive Components, and Radical Quenching Capacity in Selected Amaranthus gangeticus Leafy Vegetables. Sci. Rep. 2021, 11, 11559. [Google Scholar] [CrossRef] [PubMed]
  55. Sarker, U.; Lin, Y.P.; Oba, S.; Yoshioka, Y.; Ken, H. Prospects and potentials of underutilized leafy Amaranths as vegetable use for health-promotion. Plant Physiol. Biochem. 2022, 182, 104–123. [Google Scholar] [CrossRef] [PubMed]
  56. Ali, M.A.; Sarker, U.; MAK, M.; Islam, M.A.; Fatema-Tuj-Johora. Estimation of Genetic Divergence in Boro Rice (Oryza sativa L.). Int. J. Biol. Sci. 2014, 16, 28–36. [Google Scholar]
  57. Rai, P.K.; Sarker, U.K.; Roy, P.C.; Islam, A. Character Association in F4 Generation of Rice (Oryza sativa L.). Bangladesh J. Plant Breed. Genet. 2013, 26, 39–44. [Google Scholar] [CrossRef] [Green Version]
  58. Nath, J.K.; Sarker, U.; Mian, M.A.K.; Hossain, T. Genetic Divergence in T. Aman Rice. Ann. Bangladesh Agric. 2008, 12, 51–60. [Google Scholar]
  59. Siddique, M.N.A.; Sarker, U.; Mian, M.A.K. Genetic diversity in restorer line of rice. In Proceedings of the International Conference on Plant Breeding and Seed for Food Security; Bhuiyan, M.S.R., Rahman, L., Eds.; Plant Breeding and Genetics Society of Bangladesh: Dhaka, Bangladesh, 2009; pp. 137–142. [Google Scholar]
  60. Hasan, M.R.; Sarker, U.; Hossain, M.A.; Huda, K.M.K.; Mian, M.A.K.; Hossain, T.; Zahan, M.S.; Mahmud, M.N.H. Genetic Diversity in Micronutrient Dense Rice and Its Implication in Breeding Program. Ecofriendly Agric. J. 2012, 5, 168–174. [Google Scholar]
  61. Ganapati, R.K.; Rasul, M.G.; Mian, M.A.K.; Sarker, U. Genetic Variability and Character Association of T-Aman Rice (Oryza sativa L). Intl. J. Plant Biol. Res. 2014, 2, 1–4. [Google Scholar]
  62. Karim, D.; Sarker, U.; Siddique, M.N.A.; Miah, M.A.K.; Hasnat, M.Z. Variability and Genetic Parameter Analysis in Aromatic Rice. Int. J. Sustain. Crop Prod. 2007, 2, 15–18. [Google Scholar]
  63. Karim, D.; Siddique, M.N.A.; Sarker, U.; Hasnat, Z.; Sultana, J. Phenotypic and Genotypic Correlation Co-Efficient of Quantitative Characters and Character Association of Aromatic Rice. J. Biosci. Agric. Res. 2014, 1, 34–46. [Google Scholar] [CrossRef] [Green Version]
  64. Biswas, P.S.; Sarker, U.; Bhuiyan, M.A.R.; Khatun, S. Genetic Divergence in Cold Tolerant Irrigated Rice (Oryza sativa L.). Agric. 2006, 4, 15–20. [Google Scholar]
  65. Hasan, M.R.; Sarker, U.; Mian, M.A.K.; Hossain, T.; Mahmud, M.N.H. Genetic Variation in Micronutrient Dense Rice and Its Implication in Breeding for Higher Yield. Eco-friendly Agric. J. 2012, 5, 175–182. [Google Scholar]
  66. Rahman, M.H.; Sarker, U.; Main, M.A.K. Assessment of Variability of Floral and Yield Traits; I Restorer Lines of Rice. Ann. Bangladesh Agric. 2007, 11, 87–94. [Google Scholar]
  67. Rahman, M.H.; Sarker, U.; Main, M.A.K. Assessment of Variability of Floral and Yield Traits; II Maintainer Lines of Rice. Ann. Bangladesh Agric. 2007, 11, 95–102. [Google Scholar]
  68. Sarker, U.; Biswas, P.S.; Prasad, B.; Mian, M.A.K. Correlated Response, Relative Selection Efficiency and Path Analysis in Cold Tolerant Rice. Bangladesh J. Pl. Breed. Genet. 2001, 14, 33–36. [Google Scholar]
  69. Sarker, U.; Mian, M.A.K. Genetic Variability, Character Association and Path Analysis for Yield and Its Components in Rice. J. Asiat. Soc. Bangladesh Sci. 2003, 29, 47–54. [Google Scholar]
  70. Sarker, U.; Mian, M.A.K. Genetic Variations and Correlations between Floral Traits in Rice. Bangladesh J. Agric. Res 2004, 29, 553–558. [Google Scholar]
  71. Biswas, A.; Sarker, U.; Banik, B.R.; Rohman, M.M.; Mian, M.A.K. Genetic Divergence Study in Salinity Stress Tolerant Maize (Zea mays L.). Bangladesh J. Agric. Res. 2014, 39, 621–630. [Google Scholar] [CrossRef] [Green Version]
  72. Azam, M.G.A.; Sarker, U.; Mian, M.A.K.; Banik, B.R.; Talukder, M.Z.A. Genetic Divergence on Quantitative Characters of Exotic Maize Inbreds (Zea mays L.). Bangladesh J. Plant Breed. Genet. 2013, 26, 9–14. [Google Scholar] [CrossRef] [Green Version]
  73. Azam, M.G.; Sarker, U.; Maniruzzam; Banik, B.R. Genetic Variability of Yield and Its Contributing Characters on CIMMYT Maize Inbreds under Drought Stress. Bangladesh J. Agric. Res. 2014, 39, 419–426. [Google Scholar] [CrossRef] [Green Version]
  74. Talukder, M.Z.A.; Sarker, U.; Khan, A.B.M.M.M.; Moniruzzaman, M.; Zaman, M.M. Genetic Variability and Correlation Coefficient of Coconut (Cocos nucifera L.) in Barisal Region. Int. J. Biol. Sci. 2011, 11, 15–21. [Google Scholar]
  75. Talukder, M.Z.A.; Sarker, U.; Harun-Or-Rashid, M.; Zakaria, M. Genetic Diversity of Coconut (Cocos nucifera L.) in Barisal Region. Ann. Bangladesh Agric. 2015, 19, 13–21. [Google Scholar]
  76. Ashraf, A.T.M.; Rahman, M.M.; Hossain, M.M.; Sarker, U. Study of Correlation and Path Analysis in the Selected Okra Genotypes. Asian Res. J. Agric. 2020, 12, 1–11. [Google Scholar] [CrossRef]
  77. Ashraf, A.T.M.; Rahman, M.M.; Hossain, M.M.; Sarker, U. Study of the Genetic Analysis of Some Selected Okra Genotypes. Int. J. Adv. Res. 2020, 8, 549–556. [Google Scholar] [CrossRef] [Green Version]
  78. Ashraf, A.T.M.; Rahman, M.M.; Hossain, M.M.; Sarker, U. Performance Evaluation of Some Selected Okra Genotypes. Int. J. Plant Soil Sci. 2020, 32, 13–20. [Google Scholar] [CrossRef] [Green Version]
  79. Kayesh, E.; Sharker, M.S.; Roni, M.S.; Sarker, U. Integrated Nutrient Management for Growth, Yield and Profitability of Broccoli. Bangladesh J. Agric. Res. 2019, 44, 13–26. [Google Scholar] [CrossRef]
  80. Islam, M.T. The Effect of Some Growth Regulators on Yield and Biomass Production in Cabbage. Punjab Veg. Grower 1985, 20, 11–16. [Google Scholar]
  81. Patil, A.A.; Maniur, S.M.; Nalwadi, U.G. Effect of GA and NAA on Growth and Yield of Cabbage. South Indian Hortic. 1987, 35, 393–394. [Google Scholar]
  82. Akter, M.N. Effect of IAA and GA3 on Growth Curd Formation and Yield of Cauliflower. Master’s Thesis, Department of Horticulture and Postharvest Technology, Sher-e-Bangla Agricultural University, Dhaka, Bangladesh, 2007. [Google Scholar]
  83. Rahman, M.A.; Imran, M.; Ikrum, M.; Rahman, M.H.; Rabbani, M.G. Effects of Planting Date and Growth Hormone on Growth and Yield of Cauliflower. J. Environ. Sci. 2016, 9, 143–150. [Google Scholar] [CrossRef]
  84. Booij, R.; Struik, P.C. Effects of Temperature on Leaf and Curd Initiation in Relation to Juvenility of Cauliflower. Scientia Hortic. 1990, 44, 201–214. [Google Scholar] [CrossRef]
  85. Wurr, D.C.E.; Fellows, J.R. Temperature Influences on The Plant Development of Different Maturity Types of Cauliflower. Acta Hortic. 2000, 539, 69–74. [Google Scholar] [CrossRef]
  86. Hand, D.J.; Atherton, J.G. Curd initiation in the cauliflower. I. Juvenility. J. Exp. Bot. 1987, 38, 2050–2058. [Google Scholar] [CrossRef]
  87. Williams, C.A.; Atherton, J.G. A Role for Young Leaves in Vernalization of Cauliflower: I. Analysis of Leaf Development During Curd Induction. Physiol. Plant. 1990, 78, 61–66. [Google Scholar] [CrossRef]
  88. Haque, M.R. Effect of Fertilizer and Manure on Curd and Seed Yield of Cauliflower. Master’s Thesis, Department of Horticulture, Bangabandhu Sheikh Mujibur Rahman Agricultural University, Gazipur City, Bangladesh, 1999. [Google Scholar]
  89. Duclos, D.V.; Bjorkman, T. Gibberellin Control of Reproductive Transitions in Brassica oleracea Curd Development. J. Am. Soc. Hortic. Sci. 2015, 140, 57–67. [Google Scholar] [CrossRef] [Green Version]
  90. Lin, C.-Y.; Chen, K.-S.; Chen, H.-P.; Lee, H.-I. Curd Initiation and Transformation in Tropical Cauliflower Cultivars under Different Temperature Treatments. HortScience 2019, 54, 1351–1356. [Google Scholar] [CrossRef] [Green Version]
  91. Roy, R.; Nasiruddin, K.M. Effect of Different Levels of GA3 on Growth and Yield of Cabbage. J. Environ. Sci. Nat. Resour. 2011, 4, 79–82. [Google Scholar]
  92. Bhattacharya, A. Effect of High-Temperature Stress on the Metabolism of Plant Growth Regulators. In Effect of High Temperature on Crop Productivity and Metabolism of Macro Molecules; Bhattacharya, A., Ed.; Academic Press: Cambridge, MA, USA, 2019; pp. 485–591. [Google Scholar]
  93. Guan, Y.; Xue, J.; Xue, Y.; Yang, R.; Wang, S.; Zhang, X. Effect of Exogenous GA3 on Flowering Quality, Endogenous Hormones, and Hormone- and Flowering-Associated Gene Expression in Forcing-Cultured Tree Peony (Paeonia suffruticosa). J. Integr. Agric. 2019, 18, 1295–1311. [Google Scholar] [CrossRef]
  94. Othman, Y.A.; Al-Ajlouni, M.G.; Asaf, T.S.; Sawalha, H.A.; Hani, M.B. Influence of gibberellic acid on the physiology and flower quality of gerbera and lily cut flowers. Int. J. Agric. Nat. Resour. 2021, 48, 21–33. [Google Scholar] [CrossRef]
  95. Sharifuzzaman, S.M.; Ara, K.A.; Rahman, M.H.; Kabir, K.; Talukdar, M.B. Effect of GA3, CCC and MH on Vegetative Growth, Flower Yield and Quality of Chrysanthemum. Int. J. Exp. Agric. 2011, 2, 17–20. [Google Scholar]
  96. Sitapara, H.H.; Vihol, N.J.; Patel, M.J.; Patel, J.S. Effect of Growth Regulators and Micronutrients on Growth and Yield of Cauliflower cv. ‘SNOWBALL-16’. Asian J. Hortic. 2011, 6, 348–351. [Google Scholar]
  97. Marth, P.C.; Audia, W.V.; Mitchell, J.W. Effects of Gibberellic Acid on Growth and Development of Plants of Various Genera and Species. Bot. Gaz. 1956, 118, 106–111. Available online: http://www.jstor.org/stable/2472972 (accessed on 12 January 2022). [CrossRef]
  98. Rastogi, A.; Siddiqui, A.; Mishra, B.K.; Srivastava, M.; Pandey, R. Effect of Auxin and Gibberellic Acid on Growth and Yield Components of Linseed (Linum usitatissimum L.). Crop Breed. Appl. Biotechnol. 2013, 13, 136–143. [Google Scholar] [CrossRef]
  99. Singh, R.D.; Kuksal, R.P.; Sem, J.N. Effect of Ethrel and CCC on Growth and Seed Production of Cauliflower Var. snowball-16. Indian J. Agric. Res. 1976, 10, 122–124. [Google Scholar]
  100. Ayyub, C.M.; Manan, A.; Pervez, M.A.; Ashraf, M.I.; Afzal, M.; Ahmed, S.; Jahangir, M.M.; Anwar, N.; Shaheen, M.R. Foliar Feeding with Gibberellic Acid (GA3): A Strategy for Enhanced Growth and Yield of Okra (Abelmoschus esculentus L. Moench.). Afr. J. Agric. Res. 2013, 8, 3299–3302. [Google Scholar]
  101. Hoque, M.M.; Haque, M.S. Effects of GA3 and its Mode of Application on Morphology and Yield Parameters of Mungbean Vigna radiata L.). Pakistan J. Biol. Sci. 2002, 5, 281–283. [Google Scholar] [CrossRef] [Green Version]
  102. Zia, M.I.K. Effect of Plant Growth Regulators on Growth Curd Yield and Seed Production of Cauliflower. Master’s Thesis, Department of Horticulture, Sher-e-Bangla Agricultural University, Dhaka, Bangladesh, 2006. [Google Scholar]
  103. Mohammadi, G.; Khah, E.M.; Petropoulos, S.A.; Chachalis, B.D.; Akbari, F.; Yarsi, G. Effect of Gibberellic Acid and Harvesting Time on the Seed Quality of Four Okra Cultivars. J. Agric. Sci. 2014, 6, 200–211. [Google Scholar] [CrossRef] [Green Version]
  104. Mangal, J.L.; Pandita, M.; Pandey, U.C. Role of Growth Regulators in Vegetable Seed Production—A Review. Haryana J. Hortic. Sci. 1980, 9, 77–81. [Google Scholar]
Figure 1. Effect of GA3 concentration during cultivation on the percent of germination of produced cauliflower seeds. Means followed by same letter(s) within a column do not differ significantly at 5% level of probability by DMRT.
Agronomy 12 01394 g001
Figure 2. Effect of time of application of GA3 during cultivation on the percent of germination of produced cauliflower seeds. ns = not significant, T1 = GA3 application at 3 weeks after transplanting, T2 = GA3 application at 4 weeks after, T3 =GA3 application at 5 weeks after transplanting, and T4 = GA3 application at 6 weeks after transplanting.
Agronomy 12 01394 g002
Figure 3. Interaction effect of GA3 concentration and time of application during cultivation on the germination of produced cauliflower seeds. Means followed by same letter(s) within a column do not differ significantly at 5% level of probability by DMRT. T1 = GA3 application at 3 weeks after transplanting, T2 = GA3 application at 4 weeks after, T3 =GA3 application at 5 weeks after transplanting, and T4 = GA3 application at 6 weeks after transplanting.
Agronomy 12 01394 g003
Table 1. The main effect of GA3 concentration on morphological traits in BU cauliflower-1.
GA3 ConcentrationPlant Height (cm) at 80 DAT Length of the
Biggest (cm) Leaf at 80 DAT
Breadth of the
Biggest Leaf at 80 DAT (cm)
Number of Leaves at Curd InitiationDays to Curd
Initiation
Days to Flower InitiationLength of Seed Stalk (cm) at HarvestNumber of Primary Flowering BranchesNumber of
Secondary
Flowering Branches
Length of Pod
G0 = Control42.72 ab37.95 NS 17.45 b21.12 NS54.87 a87.70 a70.78 c10.18 ab26.90 b4.65 b
G1 = 100 ppm43.88 a38.47 NS 18.05 a21.07 NS53.31 ab85.12 ab77.05 ab10.82 a31.42 a4.63 b
G2 = 200 ppm44.05 a37.95 NS 17.75 ab20.72 NS51.02 b84.17 b79. 53 a10.88 a31.33 a4.98 a
G3 = 300 ppm43.83 a38.03 NS 16.92 b20.95 NS52.97 ab86.24 ab78. 82 a10.23 ab31.20 a4.57 b
G4 = 400 ppm41.30 b39.01 NS 17.73 ab20.69 NS53.47 ab86.57 ab75.25 b9.90 b28.53 ab4.71 b
Mean43.15738.2817.5820.9153.1385.9676.2910.4029.884.71
CV%6.005.236.653.775.704.206.69%8.6313.135.83
NS = non-significant, DAT= days after transplanting, Means followed by same letter(s) within a column do not differ significantly at 5% level of probability by DMRT.
Table 2. The main effect of time of application on phenological traits in BU cauliflower-1.
Time of ApplicationPlant Height (cm) 80 DATLength of the Biggest (cm) Leaf at 80 DATBreadth of the Biggest Leaf (cm) at 80 DAT Number of Leaves at Curd
Initiation
Days to Curd
Initiation
Days to Flower
Initiation
Length of Seed Stalk (cm) at HarvestNumber of Primary Flowering BranchesNumber of Secondary Flowering BranchesLength of Pod
T143.06 NS38.10 NS17.71 NS20.87 NS52.45 NS85.84 NS76.27 NS11.00 a31.96 a4.72 NS
T243.41 NS38.61 NS17.53 NS20.95 NS53.21 NS85.86 NS77.45 NS10.40 ab30.42 ab4.72 NS
T343.55 NS38.09 NS17.5 NS21.11 NS53.53 NS86.59 NS76.54 NS10.18 b28.99 b4.69 NS
T442.61 NS38.32 NS17.5 NS20.11 NS53.68 NS85.55 NS75.09 NS10.03 b28.13 b4.71 NS
Mean43.15738.2817.5820.9153.1385.9676.2910.4029.884.71
CV%6.005.236.653.775.704.206.688.6313.135.83
T1 = GA3 application at 3 weeks after transplanting, T2 = GA3 application at 4 weeks after, T3 = GA3 application at 5 weeks after transplanting, T4 = GA3 application at 6 weeks after transplanting, NS = non-significant, DAT= days after transplanting, Means followed by same letter(s) within a column do not differ significantly at 5% level of probability by DMRT.
Table 3. Interaction effect of GA3 and time of application on morpho-phenological traits in BU cauliflower-1.
Treatment
Combination
Plant Height (cm) at 80 DATLength of the Biggest Leaf (cm) at 80 DATBreadth of the Biggest Leaf at 80 DAT (cm)Number of Leaves at Curd
Initiation
Days to Curd
Initiation
Days to Flower
Initiation
Length of Seed Stalk (cm) at HarvestNumber of Primary Flowering BranchesNumber of Secondary Flowering BranchesLength of Pod
G0T142.53 bc38.40 ab17.33 ab21.47 ab54.93 abc87.27 abc67.8 0f10.67 a–d30.87 a–d4.76 a–e
G0T242.13 abc37.80 b17.07 ab20.73 ab52.80 a–d86.67 a–d72.40 def10.53 a–d27.80 cde4.76 a–e
G0T344.73 ab38.33 ab18.07 ab21.67 a56.20 a88.13 ab71.60 ef9.73 de25.87 de4.73 b–e
G0T441.47 abc37.27 ab17.33 ab20.6 0ab55.53 abc88.73 a71.33 ef9.80 cde23.07 e4.59 cde
G1T144.67 ab37.93 ab17.67 ab20.80 ab52.18 a–d83.17 bcd79.40 bc12.00 a32.47 abc4.69 b–e
G1T245.27 a39.07 ab18.33 ab21.40 ab53.47 a–d86.13 a–d76.33 b–e9.60 de30.67 a–d4.72 b–e
G1T342.93 abc37.60 ab18.07 ab21.33 ab53.20 a–d85.23 a–d78.27 bcd10.93 a–d32.40 abc4.49 de
G1T442.67 abc39.27 a18.13 ab20.73 ab54.40 a–d85.93 a-d74.20 b–f10.73 a–d30.13 a–d4.63 b–e
G2T139.97 c38.00 ab18.73 a20.27 b49.60 d84.00 a–d78.90 bcd11.27 abc34.87 a4.99 abc
G2T239.63 c37.53 ab18.00 ab20.73 ab50.53 cd81.77 d80.57 ab11.60 ab30.97 a–d5.21 a
G2T342.67 abc38.40ab17.53 ab20.73 ab51.73 a–d84.83 a–d79.93 ab10.63 a–d29.33 a–d4.64 b–e
G2T442.93 abc37.87 ab16.53ab21.13ab52.20a–d86.07a–d78.73bcd10.00cde30.13a-d5.06ab
G3T143.67 abc38.33 ab16.87 ab21.00 ab51.67 a–d86.23 a–d77.33 b–e9.80 cde31.07 a–d4.47 de
G3T244.67 ab39.20 a16.67 b21.07 ab53.53 a–d88.73 a72.87 c–f10.47 bcd34.33 ab4.43 e
G3T341.73 abc36.20 b17.00 ab20.87 ab51.53 a–d85.73 a–d79.03 bc9.80 cde28.73 a–e4.67 b–e
G3T445.27 a38.40 ab17.13 ab20.87 ab55.13 abc84.27 a–d86.07 a10.87 a–d30.67 a–d4.70 b–e
G4T144.47 ab37.83 ab17.93 ab20.83 ab53.87 a–d88.52 a77.93 b-e11.27 abc30.53 a–d4.67 b–e
G4T245.33 a39.47 a17.60 ab20.80 ab55.73 ab86.02 a–d73.27 c–f9.80 cde28.33 b–e4.71 b–e
G4T345.67 a39.93 a17.20 ab20.93 ab53.13 a–d89.00 a72.87 c–f9.80 cde28.60 a–e4.89 a–d
G4T440.73 bc38.80 ab18.20 ab20.20 b51.13 bcd82.73 cd76.93 b–e8.73 e26.67 cde4.55 cd
Mean43.1638.2817.5820.9153.1385.9676.2910.4029.88
CV%6.005.236.653.775.704.206.698.6313.134.71
G0 = control, G1 = 100 ppm, G2 = 200 ppm, G3 = 300 ppm and G4 = 400 ppm. T1 = GA3 application at 3 weeks after transplanting, T2 = GA3 application at 4 weeks after, T3 = GA3 application at 5 weeks after transplanting, T4 = GA3 application at 6 weeks after transplanting, DAT= days after transplanting, Means followed by the same letter(s) within a column do not differ significantly at 5% level of probability by DMRT.
Table 4. The main effect of GA3 concentration on seed yield and yield contributing traits in BU cauliflower-1.
GA3 ConcentrationNumber of Pods per PlantNumber of Seeded Pods per PlantNumber of Empty Pods per PlantDays to Seed MaturityNumber of Seeds per PodWeight of Seeds per Plant (g)Weight of 1000 Seeds (g)Seed Yield (t/ha)
G0 = Control538.40 NS373.10 b165.40 ab149.60 NS8.86 b12.38 b4.75 ab0.18 b
G1 = 100 ppm560.20 NS414.50 ab145.70 bc146.40 NS9.32 b14.27 ab4.76 ab0.21 ab
G2 = 200 ppm600.90 NS465.00 a135.90 c147.20 NS10.87 a16.16 a4.83 a0.24 a
G3 = 300 ppm596.20 NS423.50 ab172.70 a148.10 NS8.75 b15.40 ab4.72 b0.22 ab
G4 = 400 ppm554.70 NS393.50 ab161.20 abc146.20 NS8.81 b14.38 ab4.72 b0.21 ab
Mean570.09413.92156.18147.519.3214.524.760.21
CV%13.7612.4810.294.3810.9211.326.0713.37
NS = non-significant, Means followed by same letter(s) within a column do not differ significantly at 5% level of probability by DMRT.
Table 5. The main effect of time of application on seed yield and related agronomic traits in BU cauliflower-1.
Time of
Application
Number of Pods per PlantNumber of Seeded Pods per PlantNumber of Empty Pods per PlantDays to Seed MaturityNumber of Seeds per PodWeight of Seeds per Plant (g)Weight of 1000 Seeds (g)Seed Yield (t/ha)
T1615.20 a460.10 a155.10 NS147.40 NS9.71 NS16.68 a4.80 a0.22 NS
T2565.50 ab407.40 ab158.10 NS148.60 NS9.14 NS13.56 ab4.79 a0.21 NS
T3569.10 ab416.90 ab152.30 NS147.10 NS9.16 NS14.72 ab4.84 a0.21 NS
T4530.50 b371.30 b159.20 NS146.90 NS9.23 NS13.11 b4.61 b0.20 NS
Mean570.09413.92156.18147.519.3214.524.760.21
CV%13.7612.4810.294.3810.9211.326.0713.37
T1 = GA3 application at 3 weeks after transplanting, T2 = GA3 application at 4 weeks after, T3 = GA3 application at 5 weeks after transplanting, T4 = GA3 application at 6 weeks after transplanting, NS = non-significant, Means followed by same letter(s) within a column do not differ significantly at 5% level of probability by DMRT.
Table 6. Interaction effect of GA3 and time of application on seed yield and its contributing traits in BU cauliflower-1.
Treatment
Combination
Number of Pods per PlantNumber of Seeded Pods per PlantNumber of Empty Pods per PlantDays to
Seed
Maturity
Number of Seeds per PodWeight of Seeds per Plant (g)Weight of 1000 Seeds (g)Seed Yield (t/ha)
G0T1559.80 abc394.00 b–e165.80 a–d149.90 ab9.62 abc13.23 bc4.95 b–e0.19 abc
G0T2546.10 abc356.70 cde189.50 ab148.30 abc7.47c12.17 bc4.55 j–m0.15 c
G0T3516.40 bc360.30 cde156.10 a–d150.10 ab8.87 abc11.54 c4.37 m0.17 c
G0T4531.30 abc381.30 b-e150.00 a–d149.90 ab9.50 abc12.60 bc5.14 ab0.19 abc
G1T1634.40 ab462.00 a-e172.40 abc150.00 ab10.60 ab13.99 bc4.55 j–m0.22 abc
G1T2435.00 c316.50 de118.50 d150.40 a8.05 bc12.67 bc4.77 e–h0.21 abc
G1T3569.10 abc418.80 a–e150.30a–d138.70 c9.72 abc19.66 ab5.32 a0.24 abc
G1T4602.40 abc460.80 a-e141.60 bcd146.70 abc8.83 abc10.76c4.39 lm0.17 c
G2T1524.90 abc404.80 a–e120.10 d147.80 abc11.20 a22.75 a5.12 b0.27 a
G2T2707.00 a570.00 a137.00 cd147.00 abc11.30 a16.78 abc4.75 f–i0.27 ab
G2T3619.60 abc478.50 a-d141.10 bcd147.80 abc10.40 abc13.05 bc4.98 bcd0.23 abc
G2T4552.30 abc406.60 a-e145.70 a–d146.40 abc10.40 abc12.05 c4.45 k–m0.21 abc
G3T1705.50 a540.50 ab165.10 a–d149.70 ab8.93 abc16.87 abc4.68 g–j0.24 abc
G3T2595.10 abc415.80 a–e179.30 abc148.00 abc9.10 abc11.47 c5.06 bc0.17 bc
G3T3583.70 abc434.00 a-e149.70 a–d148.30 abc8.10 bc16.59 abc4.56 i–l0.24 abc
G3T4500.30 bc303.70 e196.60 a146.40 abc8.87 abc16.68 abc4.59 h–k0.23 abc
G4T1651.40 ab499.30 a–e152.10 a–d139.50 bc8.31 abc16.56 abc4.68 g–j0.19 abc
G4T2544.20 abc377.90 b–e166.30 a–d149.50 ab9.77 abc14.68 bc4.80 d–g0.23 abc
G4T3556.80 abc392.80 b–e164.10 a–d150.70 a8.63 abc12.78 bc4.91 c–f0.23 abc
G4T4466.30 bc304.00 e162.30 a–d145.10 abc8.53 abc13.49 bc4.47 k–m0.22 abc
Mean570.09413.92156.17147.519.3214.524.760.21
CV%13.7612.4810.294.3810.9211.326.0713.37
G0 = control, G1 = 100 ppm, G2 = 200 ppm, G3 = 300 ppm and G4 = 400 ppm. T1 = GA3 application at 3 weeks after transplanting, T2 = GA3 application at 4 weeks after, T3 = GA3 application at 5 weeks after transplanting, and T4 = GA3 application at 6 weeks after transplanting, Means followed by same letter(s) within a column do not differ significantly at 5% level of probability by DMRT.
Table 7. Economic analysis of BU cauliflower-1 seed production as influenced by different times of application and GA3 concentration.
TreatmentTotal Cost of
Production (Tk/ha)
Yield (kg/ha)Gross Return
(Tk/ha)
Net Return
(Tk/ha)
Benefit-Cost Ratio
G0129,498175.3 kg438,250308,7523.38
G1135,053210.5 kg526,250391,1973.90
G2140,609244.1 kg610,250469,6414.34
G3146,399221.3 kg553,250406,8513.78
G4151,718210.3 kg525,750374,0323.47
Considering the market price of cauliflower seed @ Tk. 2500 per kg.
Publisher’s Note: MDPI stays neutral with regard to jurisdictional claims in published maps and institutional affiliations.

