Review

Challenges to Use Machine Learning in Agricultural Big Data: A Systematic Literature Review

1
Department of Computer Science and Informatics, Center for Software Engineering Studies, Universidad de La Frontera, Temuco 4780000, Chile
2
Faculty of Computer Systems Engineering, Universidad Tecnológica de Panamá, Panama City 32401, Panama
*
Author to whom correspondence should be addressed.
Agronomy 2022, 12(3), 748; https://doi.org/10.3390/agronomy12030748
Submission received: 2 February 2022 / Revised: 12 March 2022 / Accepted: 17 March 2022 / Published: 21 March 2022

Abstract

:
Agricultural Big Data is a set of technologies that allows responding to the challenges of the new data era. In conjunction with machine learning, farmers can use data to address problems such as farmers’ decision making, water management, soil management, crop management, and livestock management. Crop management includes yield prediction, disease detection, weed detection, crop quality, and species recognition. On the other hand, livestock management considers animal welfare and livestock production. The purpose of this paper is to synthesize the evidence regarding the challenges involved in implementing machine learning in agricultural Big Data. We conducted a systematic literature review applying the PRISMA protocol. This review includes 30 papers published from 2015 to 2020. We develop a framework that summarizes the main challenges encountered, machine learning techniques, and the leading technologies used. A significant challenge is the design of agricultural Big Data architectures due to the need to modify the set of technologies adapting the machine learning techniques as the volume of data increases.

1. Introduction

In order to meet the global food demand by 2050, increased food production from 25% to 70% is required [1]. Considering this increase, food production per hectare needs to double when the world population stabilizes around 2100 (United Nations 2019). Food security is a fundamental global need, which is threatened by several factors such as population growth, shrinking arable land, climate change, food waste, and consumer preference for animal protein [2]. Increasing agriculture or food production rapidly to meet the growing demand for food supply is not an easy task. Several factors contribute to this problem, such as current agricultural practices, poor storage, markets, and changing scenarios [3].
For offering sustainable agricultural production, it is necessary to use cutting-edge technologies such as blockchain, IoT, Big Data, and machine learning (ML), among others [3,4]. Data-driven agriculture among these technologies is the most promising approach to solve current and future issues. If it were possible to generate a large amount of data from farms and use it to drive some agricultural decisions, most global food problems could be solved [3]. For example, if farmers could build data sets or maps for diverse environmental factors around the farm, they could implement techniques such as smart farming, precision farming, vertical farming, and others. It has been proven that data-driven agriculture improves crop yields, reduces costs, and guarantees sustainability [5].
Li et al. explained that agricultural Big Data is a part of cutting-edge technology. It comprises concepts, technology, specific measures, and an entire gamut of agricultural activities such as farming and planting. The same authors stated that by incorporating informatization, intelligence, and precision, the problems of traditional agriculture could be solved. However, the research on agricultural Big Data is in its initial stage, therefore, more studies need to be conducted [6].
The implementation of agricultural Big Data involves a set of challenges to consider. From the technical point of view, White et al. mentioned challenges such as inaccessibility, unusability, incompatibility, inconvenience, lack of data interoperability, lack of rural bandwidth, lack of data calibration, and lack of representation of crop growth models and weather forecasts [2]. Moreover, Lassoued et al. analyzed the potential and impact of Big Data in agriculture. The authors identified several challenges such as data sources, lack of standard, security, cybercrime, and intellectual property protection [7]. Similarly, Bhat and Huang et al. pointed out challenges in information quality, safety, and security [3].
From a societal perspective, Lassoued et al. determined that the lack of trained staff to manage large volumes of data was another Big Data challenge [7]. Moreover, Li et al. identified other problems considering the relatively backward rural areas’ viewpoint. For instance, there is little understanding from the farmers due to their low education levels; there is a decline in online sales, lack of talent for Big Data in these areas, limited Internet and data processing, and inadequate facilities for Big Data development. People must start relying on agricultural Big Data, so it becomes a key technology for agricultural development, which can significantly improve agricultural efficiency, reduce production costs, and increase sales [6].
According to Gopal et al., many other challenges arise because of the multimodal nature of data. For example, there is room to improve data collection methods and statistical and data analysis techniques to understand agricultural activities better. The mechanism used in smart farming to improve these aspects is ML, the scientific field that allows a machine to learn without much programming. With Big Data technologies and high-performance computing, ML creates new opportunities to facilitate, quantify, and understand the intensive data processes in agricultural operating environments [4].
Advancements indicate that agriculture can benefit from ML at every management level, including species, field, crop, and livestock management [4]. ML is implemented in various agricultural applications such as yield prediction algorithms, image recognition algorithms, and robotics to harvest different types of specialty crops [8].
Agricultural Big Data is playing an essential role in the integration of ML. Farmers use the data to calculate crop yields, fertilizer demand, cost savings, and even identify optimization strategies for future crops [4]. ML is being employed for crops to predict yields, spot diseases, detect weed, ensure crop quality, and recognize species. For livestock, ML is being used for animal welfare and livestock production [9].
There are many challenges when implementing agricultural Big Data on farms due to agricultural data sets’ volume, variety, and complexity [10]. The main opportunities and challenges lie in establishing a reference point in the agricultural sector because the factors that affect agriculture will vary with climate, geographic zone, soil type, crop, and traditions [11].
This research aims to discuss the different challenges of implementing ML in agricultural Big Data. We want to highlight the technologies and ML techniques used, the kinds of problems that need to be solved, and the challenges imposed by the volume, variety, velocity, veracity, and analysis itself. We provide a framework that summarizes the data to allow researchers to decide which ML paradigm or solution to use depending on the specific agricultural Big Data scenario. Additionally, this paper allows the identification of research gaps and opportunities in this area. Consequently, it serves as a comprehensive foundation and facilitator for future research. To this end, we conducted a systematic literature review (SLR), applying the PRISMA protocol [12]. We selected a set of 30 articles that explain the use of Big Data and ML in agriculture.
This paper is structured as follows. Section 1 is the introduction. Section 2 contains the theoretical background on Big Data, agricultural Big Data, ML, and the main challenges reported in the literature. Section 3 describes the methodology used to collect the relevant papers for the study. Section 4 contains the results derived from the analysis of the selected papers. Section 5 discusses the main challenges of applying ML in agricultural Big Data. Finally, Section 6 presents the conclusions.
Because of the large number of abbreviations used in the relative scientific works, Table 1 and Table 2 list the abbreviations that appear in this work, categorized into ML techniques and learning algorithms, and general abbreviations, respectively.

2. Background

In this section, we explain the basic concepts of ML and Big Data. On the one hand, we explain the use of ML in agriculture, and on the other hand, the use of Big Data and its development in agriculture. Finally, we mention the main challenges in agricultural Big Data, described in the literature.

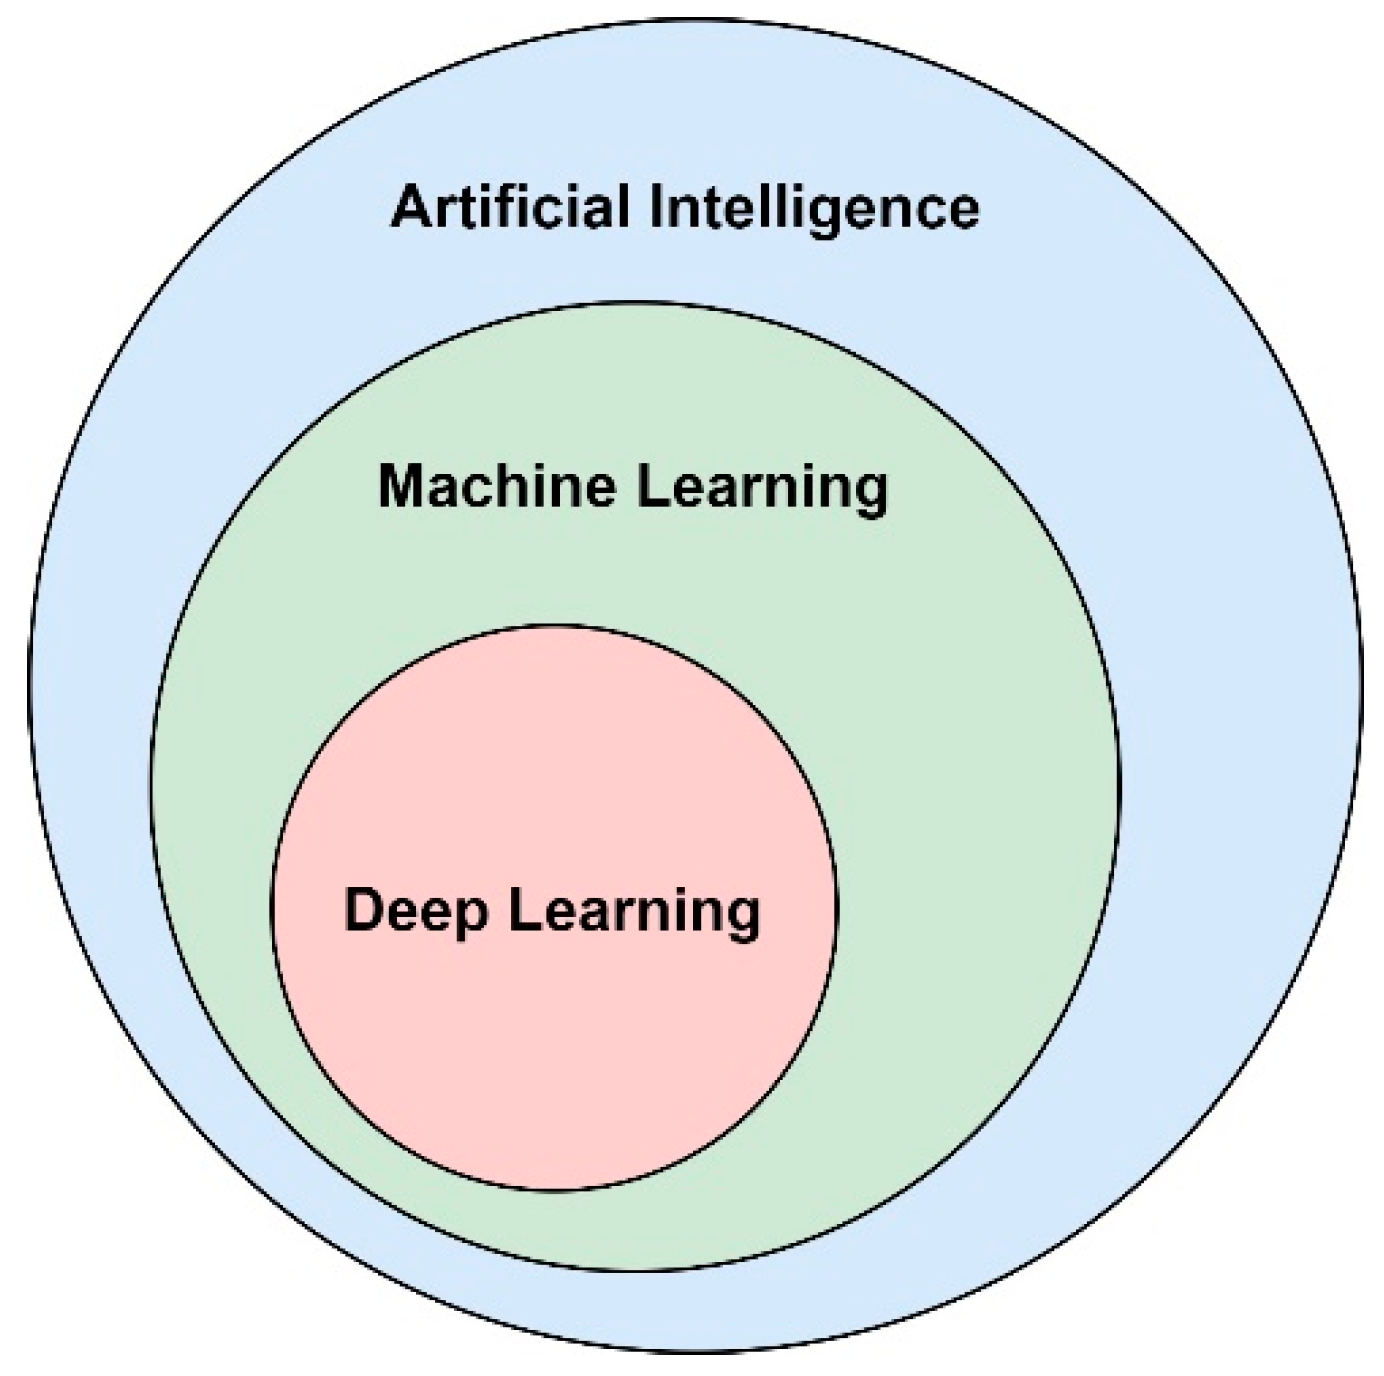
2.1. Machine Learning

ML is a research field that formally focuses on learning systems and algorithm theory, performance, and properties. It is a highly interdisciplinary field based on different areas such as artificial intelligence, optimization theory, information theory, statistics, cognitive science, optimum control, and many other scientific, engineering, and mathematical disciplines [13]. Because of its many applications, ML has covered almost every scientific domain, making it significantly impact science and society [14]. It is applied to recommendation drivers, recognition systems, informatics and data mining, and autonomous control systems [15].
Depending on the nature of the feedback available for a learning system, ML can be classified into three main types: supervised learning, unsupervised learning, and reinforced learning. Table 3 compares ML techniques from different perspectives in data processing. The row “Data processing tasks” indicates the problems that need to be solved, and the row labeled “Learning algorithms” describes the methods that can be used to solve these problems. A processing effort is required to convert raw data into valuable data. This effort usually includes: (a) data cleaning to remove inconsistent or missing elements and noise, (b) data integration to put together data from many sources, and (c) data transformation to normalize and discretize data [16].
Briefly, supervised learning and unsupervised learning mainly focus on data analysis, while reinforced learning is preferred for decision-making problems.
In general, the goal of ML algorithms is to optimize the performance of a task by exploiting examples or past experiences. By exploiting examples or past experiences, ML can generate efficient relationships for data inputs and reconstruct a knowledge schema to analyze large data volumes [16].
On the contrary, deep learning (DL) is a branch of ML that tries to model abstractions with a series of algorithms by using a deep layer with multiple processing layers. DL, which is of great interest in the artificial intelligence field, has come to the fore in natural language processing and image classification [17]. Figure 1 shows the relationship between AI, ML, and DL.
DL has algorithms such as convolutional neural networks (CNN), recurrent neural networks (RNN), restricted Boltzmann machine (RBM), and deep belief network (DBN). Furthermore, DL has the advantages of processing unstructured data at maximum capacity, producing high-quality results, and avoiding unnecessary costs.
ML has been used to solve different agricultural problems in crop management, including yield prediction, disease detection, weed detection, crop quality, and species recognition; in livestock management, including animal welfare and livestock production; in water management; and in soil management [9,16,17]. Figure 2 shows a summary of agricultural problems solved using ML. The figure was modified from the reference [16].
An example of this is that many producers say that weeds are the most severe threat to crop production. Accurate weed detection is essential for sustainable agriculture because weeds are difficult to detect and distinguish from crops. ML algorithms, along with sensors, now allow accurate detection and identification of weeds without causing environmental problems or secondary effects. ML for weed detection has led to developing tools and robots to destroy weeds, minimizing the need for herbicides [9]. Therefore, accurate detection and classification of the characteristics of crop quality have increased product values and reduced waste.
Figure 3 presents a graph showing the different ML techniques used to improve agriculture. Liakos et al. explained that eight ML models had been implemented; five of these models were implemented for crop management, and the most popular models were artificial neural networks (ANN). Four ML models were implemented for livestock management, with the most popular models being support vector machines (SVM). For water management, particularly evapotranspiration estimation, two ML models were implemented, and the most frequently implemented were ANN. Finally, four ML models were implemented in the soil management category, with the most popular one being the ANN model. In summary, ML models have been applied in multiple applications for crop management (61%), mostly yield prediction (20%), and disease detection (22%) [9].
On the other hand, Liakos et al. point out that when data recordings are involved, occasionally at the level of Big Data, the implementations of ML are less in number, mainly because of the increased efforts required for the data analysis task, not for the ML models per se. This fact partially explains the almost equal distribution of ML applications in livestock management (19%), water management (10%), and soil management (10%) [9].
Benos et al. updated the information presented in Figure 3 through a systematic study of ML use in agriculture during the years 2018 to 2020 [16]. Figure 4 presents the results obtained.
It is observed that the ML ANN algorithm is still the preferred algorithm for data analysis. On the other hand, Ensemble learning has been gaining ground and outperforms other algorithms such as SVM and decision trees (DS). According to Benos et al., the most commonly used data come from meteorology, soil, water and crop quality, remote sensing, satellite imagery, UAVs and UAVs, and in situ and laboratory measurements [16]. The most frequent ML model providing the best output was, by far, ANN, which appeared in almost half of the reviewed studies (51.8%). RNN followed, representing approximately 10% of ANNs, with long short-term memory standing out, as it can optimize it. The second most accurate ML model was ensemble learning (EL), contributing to the ML models used in agricultural systems with approximately 22.2%, and regression models came next with an equal percentage, namely 4.7%. Both of these ML models were presented in all generic categories.
Benos et al. conclude that the increasing interest in ML analyses in agricultural applications is captured. When comparing the number of relevant studies, between 2018 and 2019, there was an increase of 26%. For 2020, the corresponding increase jumped to 109% against 2019 findings; thus, resulting in an overall 164% rise compared with 2018. The accelerating rate of the research interest in ML in agriculture is a consequence of various factors, following the considerable advancements of ICT systems in agriculture [16].
The increased interest in ML research in agriculture is a consequence of several factors: the considerable advances in ICT systems in agriculture; the vital need to increase the efficiency of agricultural practices while reducing the environmental burden; and the need for reliable measurements with the handling of large volumes of data [16,17].

2.2. Big Data

Big Data is defined in four dimensions (four Vs) [18]. First, it refers to the enormous volume of generated, stored, and processed data. Second, it also refers to the high velocity of data transmission in interactions, and the rates at which data are generated, collected, and exchanged. Thirdly, it refers to the variety of data formats and structures (structured, semi-structured, and unstructured) resulting from the heterogeneity of data sources [19]. The fourth dimension is veracity, which refers to the ability to validate the quality of the data used in the analyses.
Apart from the “4 Vs”, another dimension of Big Data must also be considered: its value. The value is obtained by analyzing data to extract hidden patterns, trends, and knowledge models through algorithms and smart data analysis techniques. Data science methods increase the value of data by better understanding their phenomena and behaviors, optimizing processes, and improving the discoveries of machines, businesses, and scientists [20]. Therefore, we cannot consider the science of Big Data without including data analysis and ML as critical steps for numbering value among Big Data science strategies [21].
In practice, Big Data analysis tools enable data scientists to discover correlations and patterns by analyzing massive quantities of data from different sources. In recent years, the science of Big Data has become an essential modern discipline for data analysis [21]. It is considered an amalgam of classic disciplines such as statistics, artificial intelligence, mathematics, and informatics with its sub-disciplines, including database systems, ML, and distributed systems [22].
The Big Data ecosystem handles the evolution of data, models, and support infrastructure throughout its life cycle; it is a whole set of components, or architecture, storing, processing, and visualizing data and delivering results to guide applications [23,24]. The framework architecture of Big Data in Figure 5 includes data storage, information management, data processing, data analysis, and interface and visualization components.
As shown in Figure 5, the Big Data process starts with the identification of the sources from which useful data are extracted [18]. Next, the data are stored in one of the designed data models depending on whether the data are structured or not. In the following step, the data are classified and filtered according to the type of analysis required. Then, it is defined whether the processing will be by batch, stream, or memory storage [25]. The classified data are analyzed using appropriate tools such as DL [26], ad hoc analysis [25], and data science in general [27]. The data obtained must be presented through some kind of visualization tool. Finally, the data are analyzed by the decision makers [24].
Big Data in agriculture refers to all the modern technology available combined with data analysis as a foundation for making decisions only based on data [28]. Figure 6 shows the agricultural Big Data evolution. The figure was modified from the reference [28].
Big Data has been used to improve various aspects of agriculture, such as knowledge about weather and climate change, land, animal research, crops, soil, weeds, food availability and security, biodiversity, farmers’ decision making, farmers’ insurance and finance, and remote sensing [29]. It is also used to create platforms that allow the supply chain actors to have access to high-quality products and processes, tools to improve yields and predict demand, and advice and guidance to farmers based on the response capacity of their crops to fertilizers leading to better fertilizer use. Furthermore, Big Data has led to the introduction of plant-scanning equipment used to follow up on deliveries and allow retailers to monitor consumer purchases by improving product traceability throughout the supply chain [30].
Big Data does not function in isolation. It has been used with other technologies such as ML, cloud-based platforms, image processing, modeling and simulation, statistical analysis, NDVI vegetation indices, and geographic information systems (GIS) [29]. ML tools have been used in prediction, grouping, and classification problems, while image processing has been used when the data are extracted from images (i.e., cameras and remote sensing) [29].

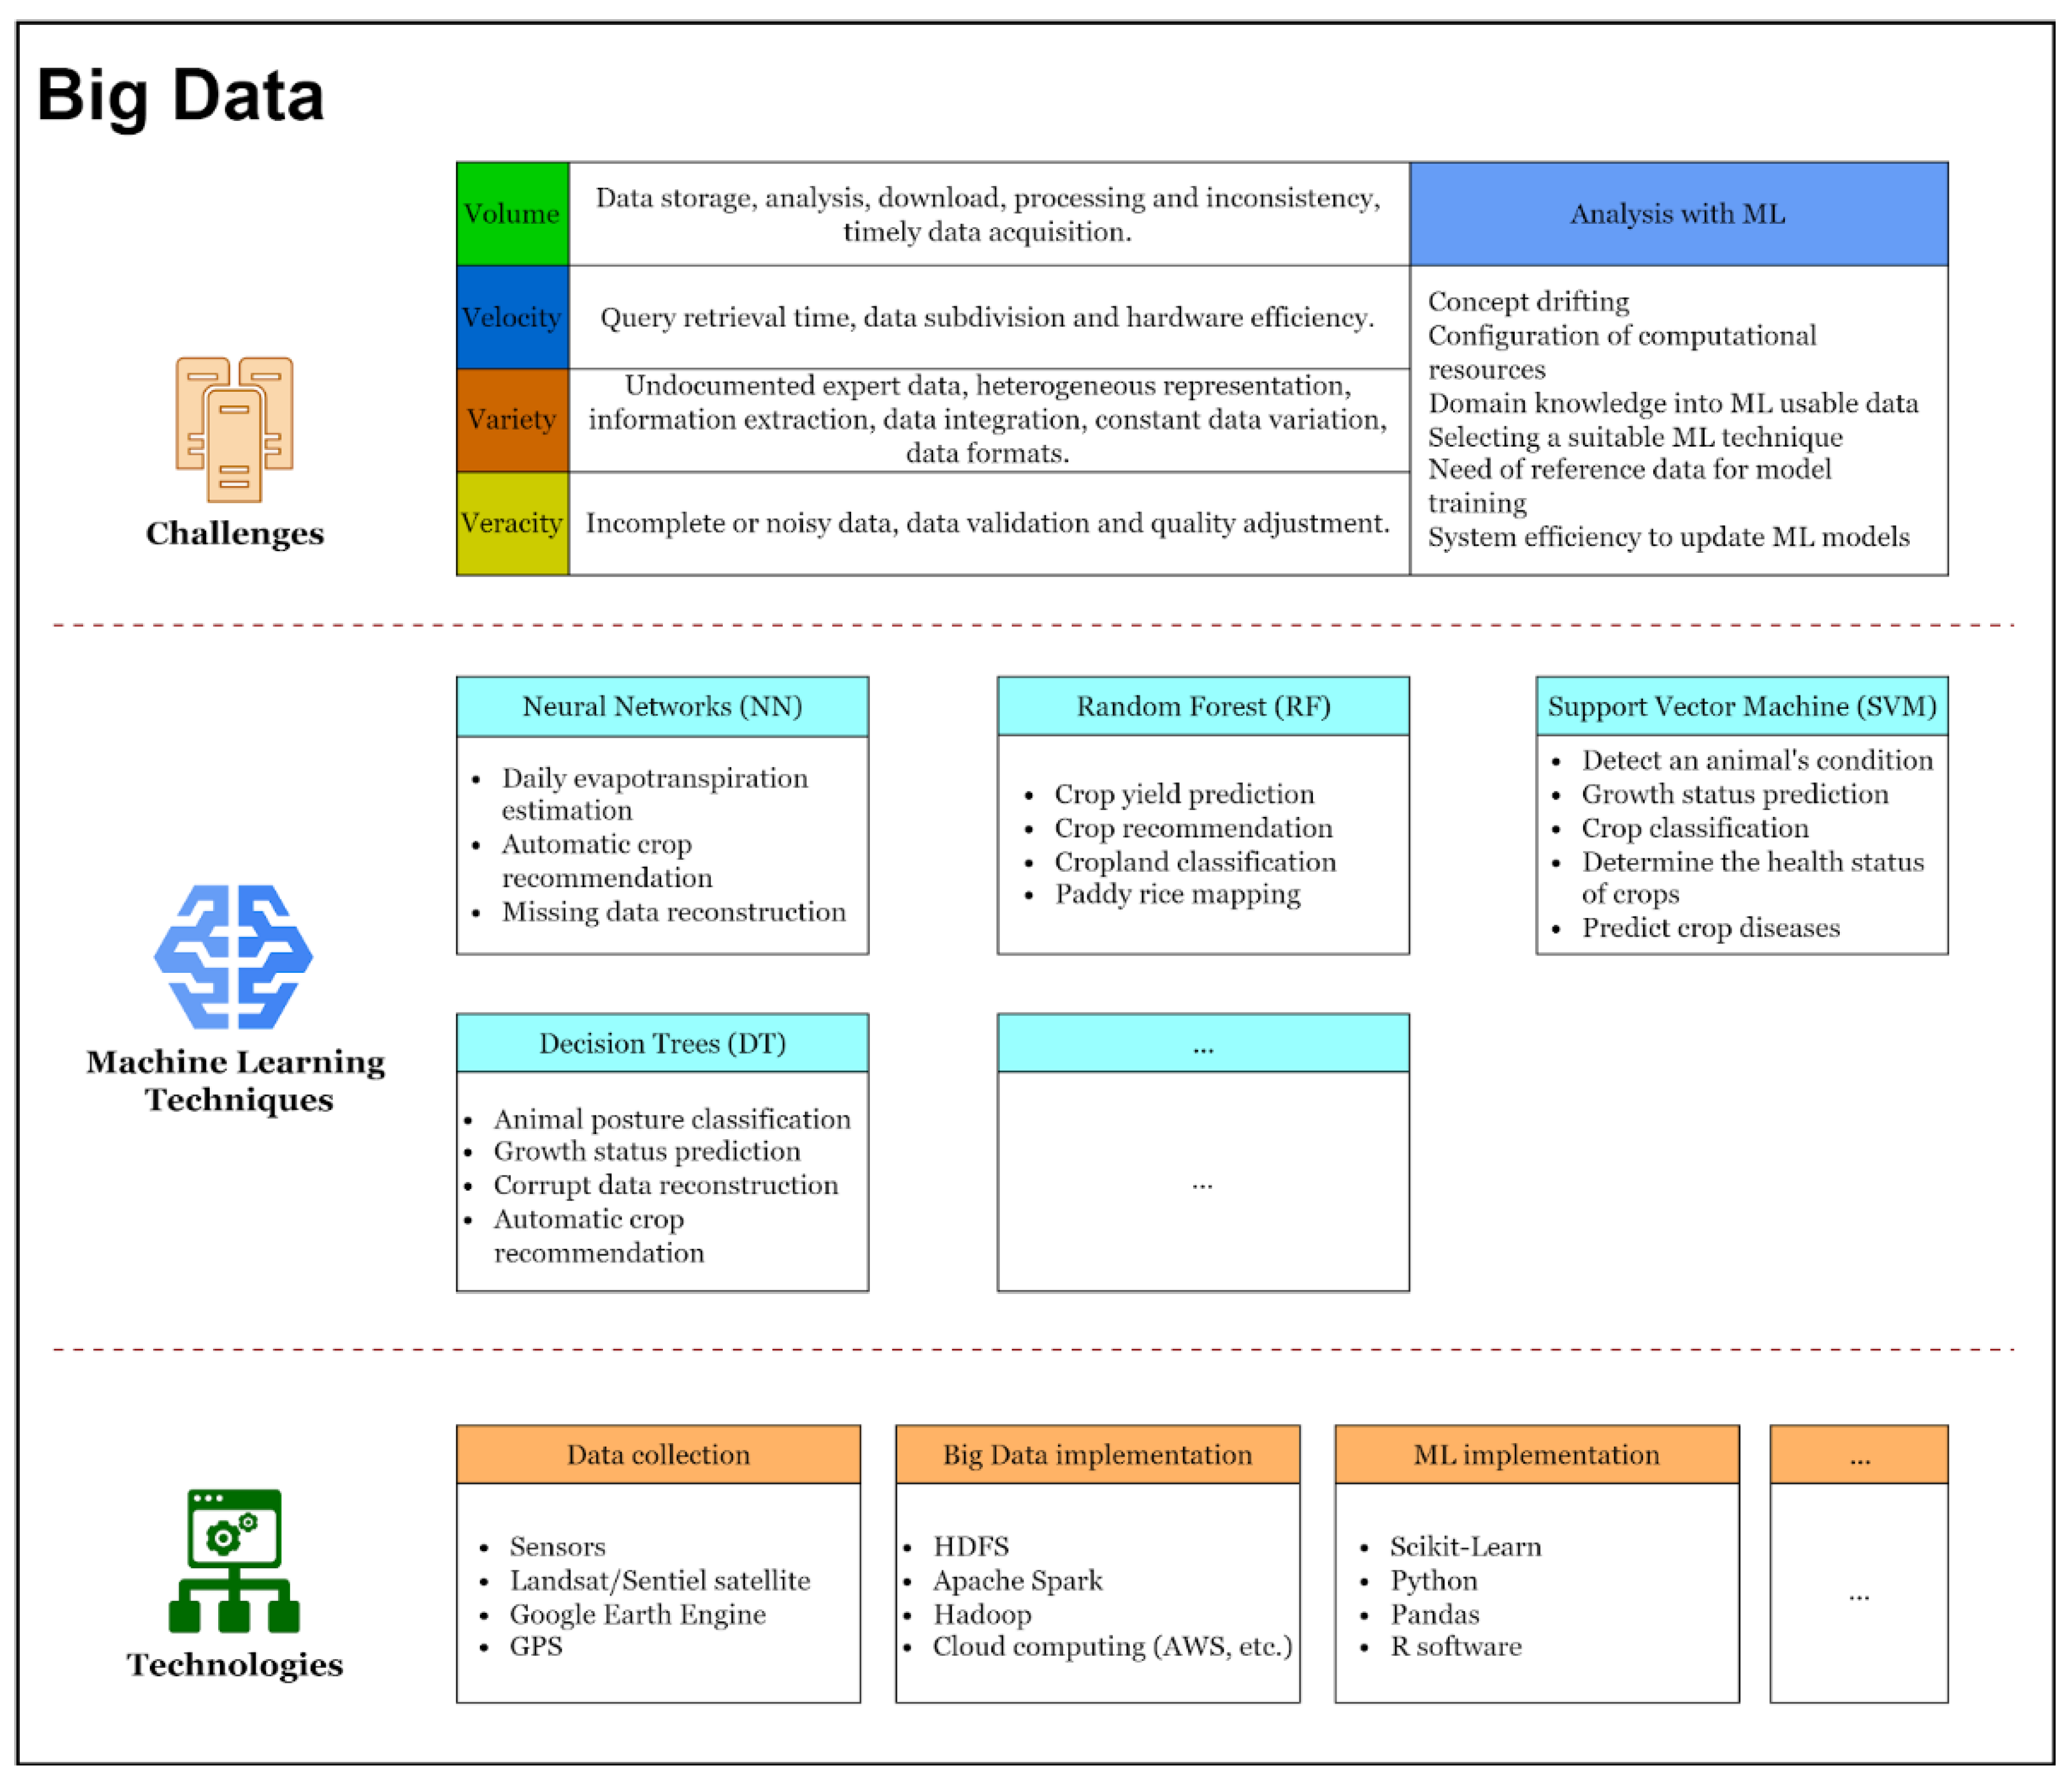
2.3. Challenges in Agricultural Big Data and ML
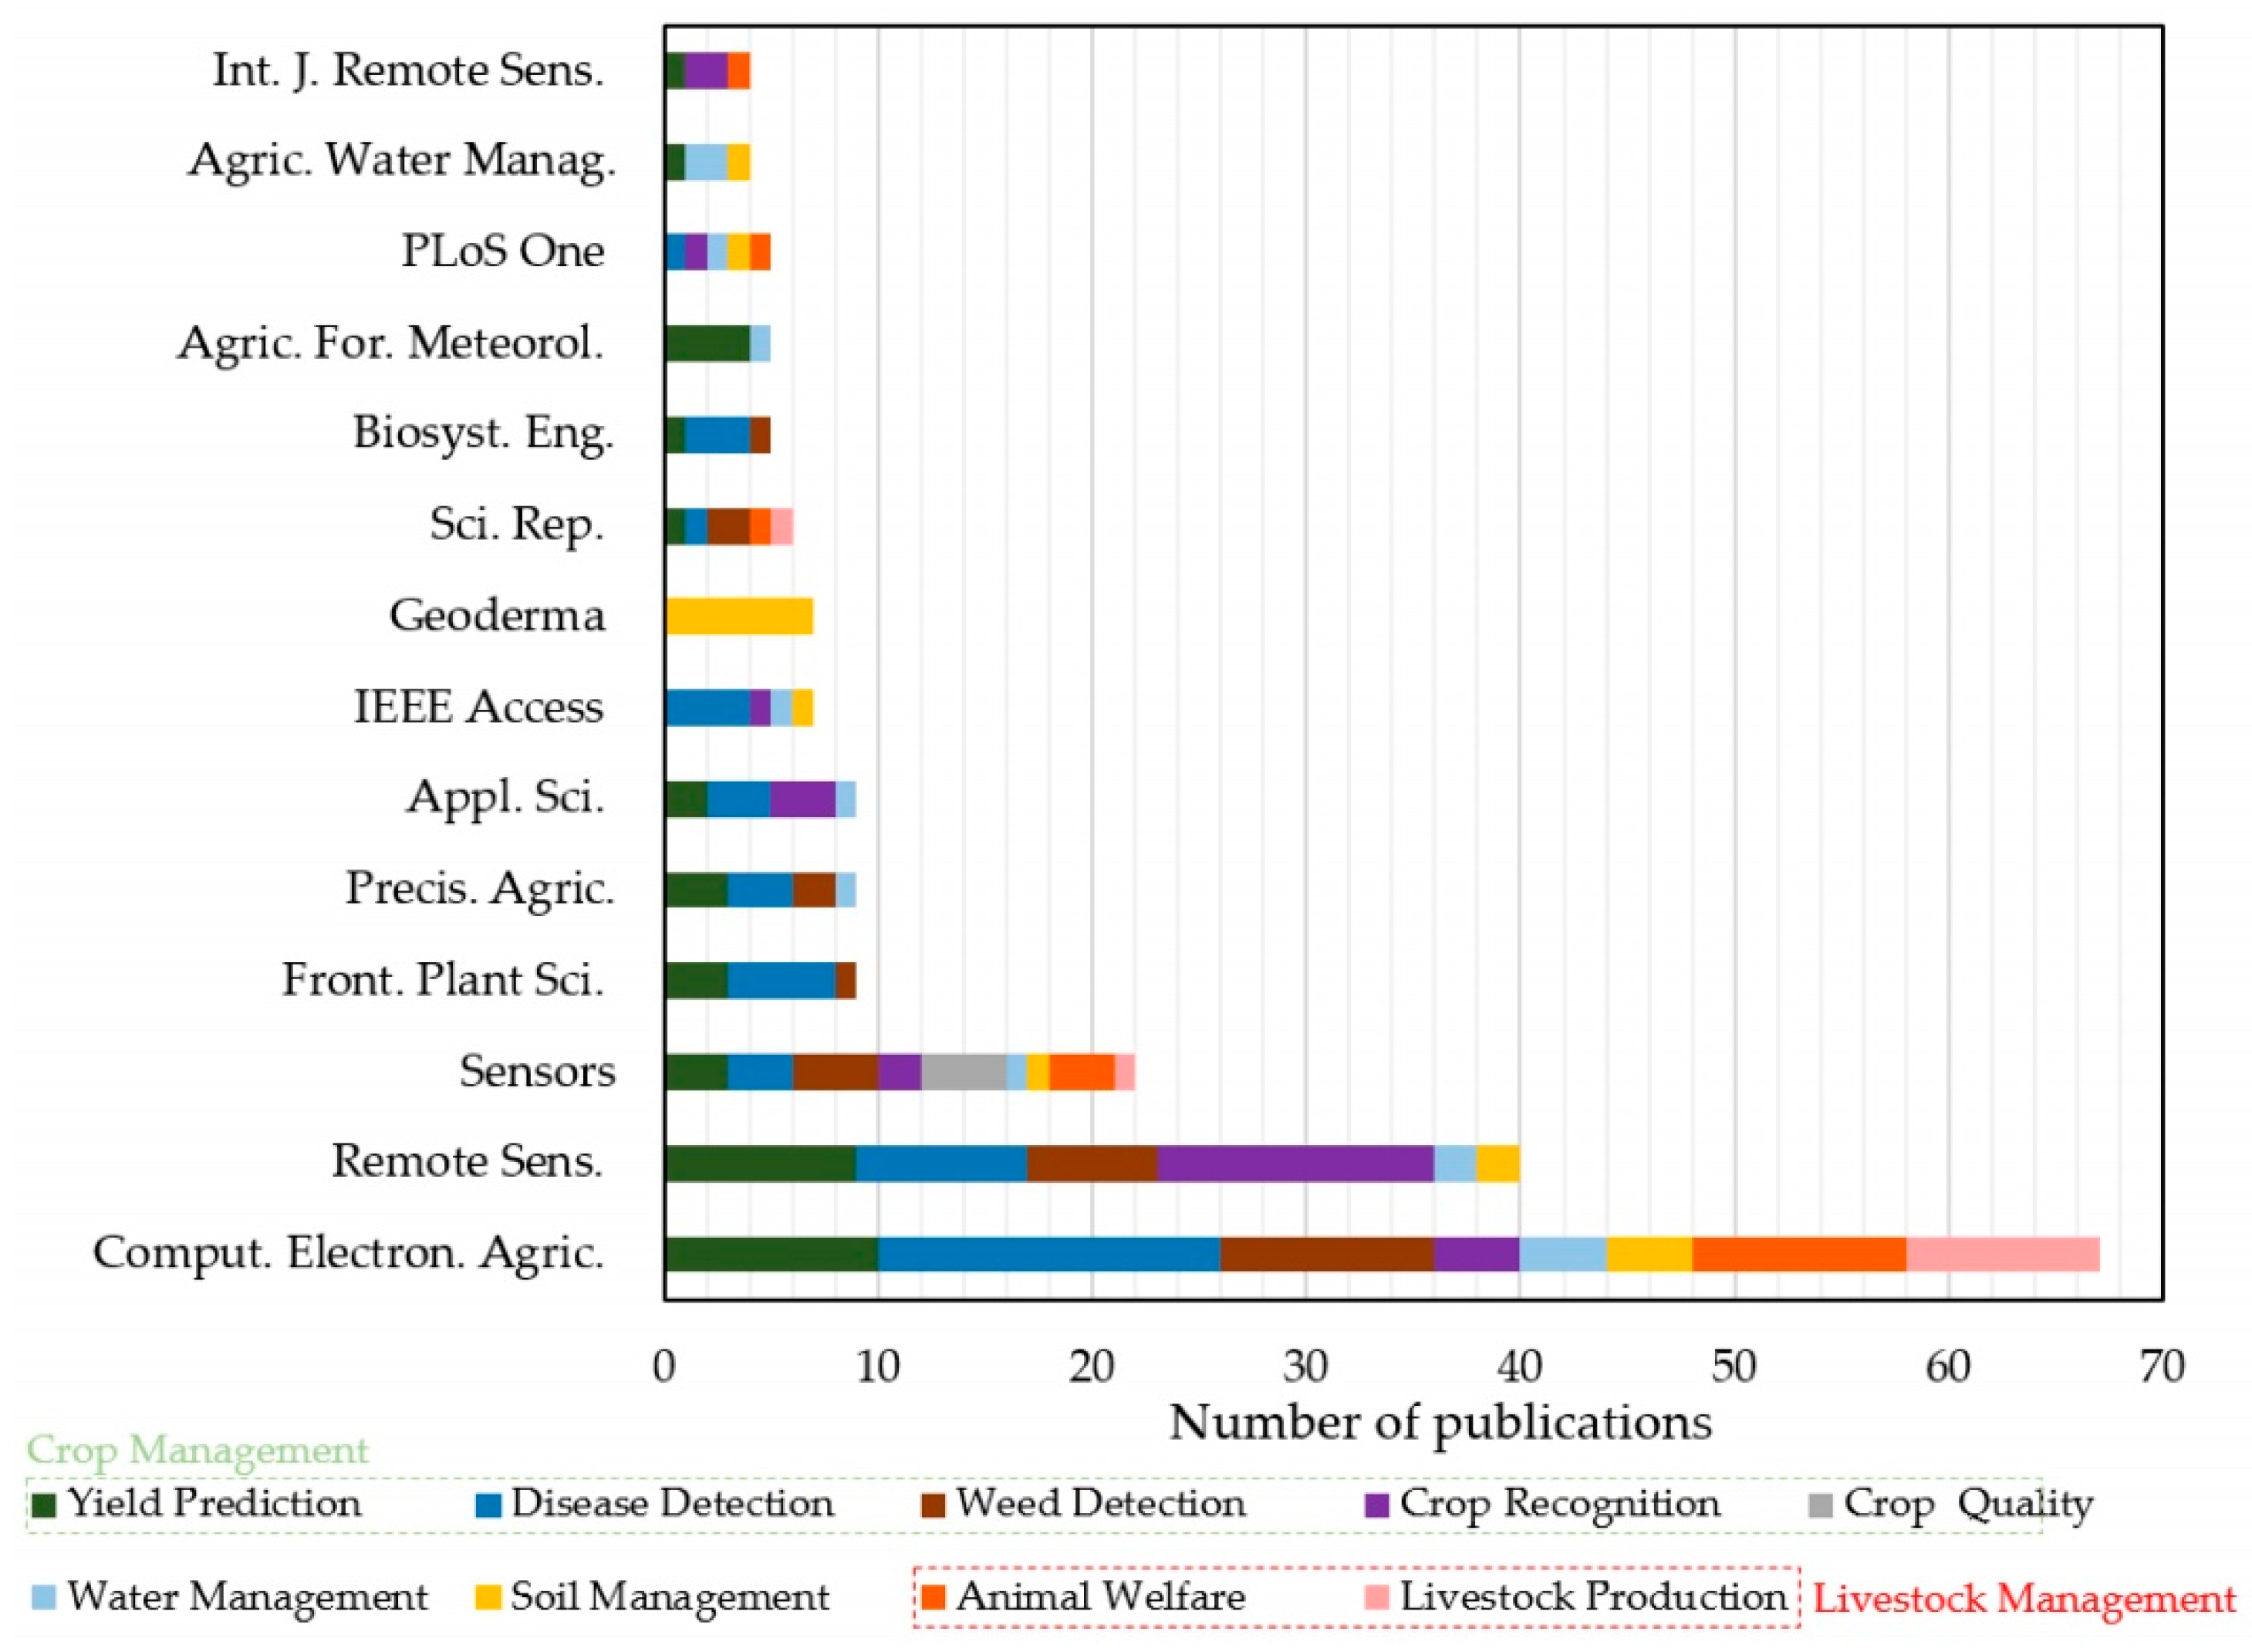
Several authors have explained a number challenges when using Big Data or ML in data analysis for agricultural development.
White et al. conducted a survey with researchers participating in a conference on precision farming to identify different scenarios and challenges where agricultural Big Data is used: (1) mid-season yield prediction for real-time decision making, (2) sow lameness, (3) irrigation in cotton management, (4) in-season decision making, (5) policymaker perspective, (6) cropping selection system, (7) business analytics for agriculture, (8) grower perspective, (9) consumer perspective, and (10) benchmarking scenario—comparing individual grower yields with modeled outputs based on other people’s data [2]. The challenges indicated for these scenarios using the data are errors, inaccessibility, unusability, incompatibility, and inconvenience. An example of this is the lack of data interoperability that prevents integration and unified analysis of data collected by multiple sensors and platforms. The lack of rural bandwidth often makes data transmission, particularly of large data sets that include images, impossible. In addition, sensor data require calibration. Finally, the authors indicated that better representations of crop growth models are required and more specific weather forecasts for individual farms and fields [2].
Lassoued et al. analyzed the impact and potential of Big Data in agriculture. They identified several challenges related to data sources because not all the segments in the value chain capture data the same way. They pointed out that there is no standard by which the data are captured, making it difficult to harmonize and compile the data from various sources [7]. Additionally, by doing a survey, they learned that the implementation of Big Data in an organization depends on a clear strategy and a need for trained personnel to administer large volumes of data. Training and talent, more than capital, are fundamental for optimal production in the future [7]. Another major obstacle identified is data governance. Although most of the experts surveyed were willing to share their data under certain conditions, many expressed concerns about data privacy, security, cybercrime, and intellectual property protection.
Bhat and Huang conducted a study on the application of artificial intelligence and Big Data in agriculture. They indicated several challenges when applying Big Data in real life. One of these challenges is the compilation and analysis of large volumes of data produced through IoT and wireless sensor networks. These two include digital images and data from UAV, satellites, and data integration and pose difficulties for the effective execution of smart farming. The authors explained that most Big Data systems are adequate for large industrial farms because they have the infrastructure to access data, resources, and, most importantly, funding. However, they found only a few examples of small farming operations in the developing world. Big Data has the potential to support non-industrial farms; however, the moral and ethical questions concerning availability, cost, and financing must be addressed to achieve these advantages [3].
On the other hand, Bhat and Huang examined data collection and analysis challenges. The combination of data from various sources causes concern about the quality of the information and its merging. Moreover, the volume of information compiled causes concern about security and protection. The compiled data sets are enormous and complex, making it challenging to manage the standard procedures of smart analysis. These methods do not usually work well when applied to agricultural data. The authors expect scalable and versatile methods to adapt to large amounts of information [3].
Since the agricultural data set contains various information about soil, climate, seeds, cultivation practices, irrigation facilities, fertilizers, pesticides, weeds, harvesting, post-harvest techniques, and others, challenges arise at different stages of agricultural Big Data such as at data collection, storage, and analysis [4]. Moreover, the data are generated and maintained by governments, universities, research organizations, farming companies, and agricultural input companies for agricultural production, insurance, marketing, supply chain, packaging, distribution, etc. [4]. Due to this multimodal nature of the data, there are several challenges, such as the need to improve data collection methods, statistical techniques, and more effective and efficient data analytics to understand and support the functions of several agricultural verticals. On the other hand, Weersink et al. explained that the data must be collected consistently and fulfill the protocols that can group them into centralized servers. These servers must be protected from cyberattacks while masking the identity of the operation managers [31].
Coble et al. analyze the challenges and opportunities of Big Data in agriculture and conclude that these technologies will lead to relevant analytics at every stage of the agricultural value chain. The authors believe that there are relevant policy, farm management, supply chain, consumer demand, and sustainability issues. A significant challenge mentioned by the authors is the management of data repositories due to the volume and variety [32]. According to Coble et al., data service providers struggle to attract a critical mass of farmers to submit farm data to repositories. This concern is partly because the value of an agricultural data community ultimately depends on the number of farms and acres in the system, i.e., the size of the network. Concerning data variability, different levels of data quality are available, e.g., some farmers are known for not correctly labeling on-farm production data or for not considering all sowing data. These aspects are of utmost importance for the system to deliver a proper analysis and the farmer to make a correct decision. The authors point out that progress must be made in creating public data repositories, engaging both large and small farmers in real collaboration.
On the other hand, Misra et al. present an overview of Big Data, AI, and IoT and their disruptive role in shaping the future of agri-food systems [33]. The authors discuss these technologies in greenhouse monitoring, smart farm machines, drone-based crop imaging, supply chain modernization, social media (for open innovation and sentiment analysis) in the food industry, food quality assessment (using spectral methods and sensor fusion), and food safety. They indicate an economic impact from the point of view of productivity, lower cost of production, and improved quality. Therefore, adopting technological innovations and taking advantage of them is essential for modern agriculture and the food industry.
Our paper analyzes the main challenges in agricultural Big Data when incorporating ML for data analysis. The challenges are classified based on the intrinsic characteristics of Big Data, the four Vs, and the ML data analysis itself. From the data found, we propose a framework that summarizes the challenges, the ML techniques, and the leading technologies used to provide information for future research.

3. Methodology

The research method used for this paper was SLR. For the selection of articles, the PRISMA (Preferred Reporting Items for Systematic Reviews and Meta-Analysis) method was applied, which contains four stages: identification, screening, eligibility, and inclusion [12]. To define the objectives and research questions (RQ), we used the methodology proposed by Kitchenham and Charters [34]. The analysis stems from a series of RQ such as (1) what kind of problems are solved using agricultural Big Data and ML, (2) what is the agricultural line of business in which the problems are attempted to be solved, (3) what are the main ML techniques used to analyze the data, (4) what technological tools are used to implement agricultural Big Data, and (5) what are the challenges to implement ML in agricultural Big Data.
The search string was constructed as follows: (a) from the RQs we obtained keywords; (b) we applied the population–intervention–comparison–results–context criterion to frame the RQs (PICOC [35]) criterion. According to Kitchenham and Charters [34], the population corresponds to an application area, namely, agricultural Big Data. On the other hand, the intervention deals with the challenges in applying ML. In our case, it is not appropriate to apply the comparison. The results obtained are the identified problems, the corresponding solutions, and challenges when applying various ML techniques.
Moreover, we accessed Scopus, Springer, ACM, IEEE, MDPI, and Web of Science. The search strings used in all data sources were “Big Data”, “machine learning” and “agriculture or farm”. We looked for these strings in the articles’ titles, keywords, and abstracts. In addition, we considered only scientific articles and conferences in English published from 2015 to 2020.
In descending order, we identified 580 potential articles in the Scopus database, 567 in the Web of Science database, 486 in Springer, 356 in IEEE, 309 in ACM, and 270 in MDPI. We excluded books, book chapters, working papers, and press articles. This final selection resulted in 30 relevant articles.
In the identification phase, 2568 articles were examined. This examination was followed by a screening where the duplication criterion was applied. This screening resulted in 1489 identified articles. The abstracts of these articles were then reviewed, and we checked whether or not they contained the nexus between agriculture, Big Data, and ML. After eliminating the non-relevant articles, 54 articles remained for detailed analysis. This analysis consisted in reviewing the entire article to ensure that it included a description of the Big Data process and the ML techniques. Most of the excluded articles had purely theoretical, technological, or experimental issues. Some excluded articles poorly discussed the nexus between agriculture, Big Data, and ML. Finally, the SLR was based on 30 relevant articles. Figure 7 summarizes the steps for relevant article selection.
The composition of the selected articles is very varied. Of the 30 articles, 12 were published in conferences and 18 in scientific journals. The journals that include more than three publications are the International Journal of Emerging Trends in Engineering Research and Computers and Electronics in Agriculture. Figure 8 shows the yearly distribution of the included papers.
We proceeded with their reading for each of the 30 selected papers to extract relevant data to answer the RQs. The extracted data for each paper and the assessment strategy were as follows: (i) title, authors, year; (ii) reason why the paper was initially included; (iii) ML techniques used; (iv) challenges and solutions when applying ML; and (v) architectures, technologies, and tools used.
Then, we classified the data according to the intrinsic characteristics of Big Data, such as volume, variety, velocity, and veracity. We included a different data processing and analysis category to identify problems applying ML.

4. Results

This section details the main results from the analysis of the selected papers. First, the leading solutions described in agricultural Big Data are explained. Then, the use of ML techniques mentioned in the papers is described. The leading technologies implemented are also described. Finally, the main challenges described in the selected papers are mentioned.

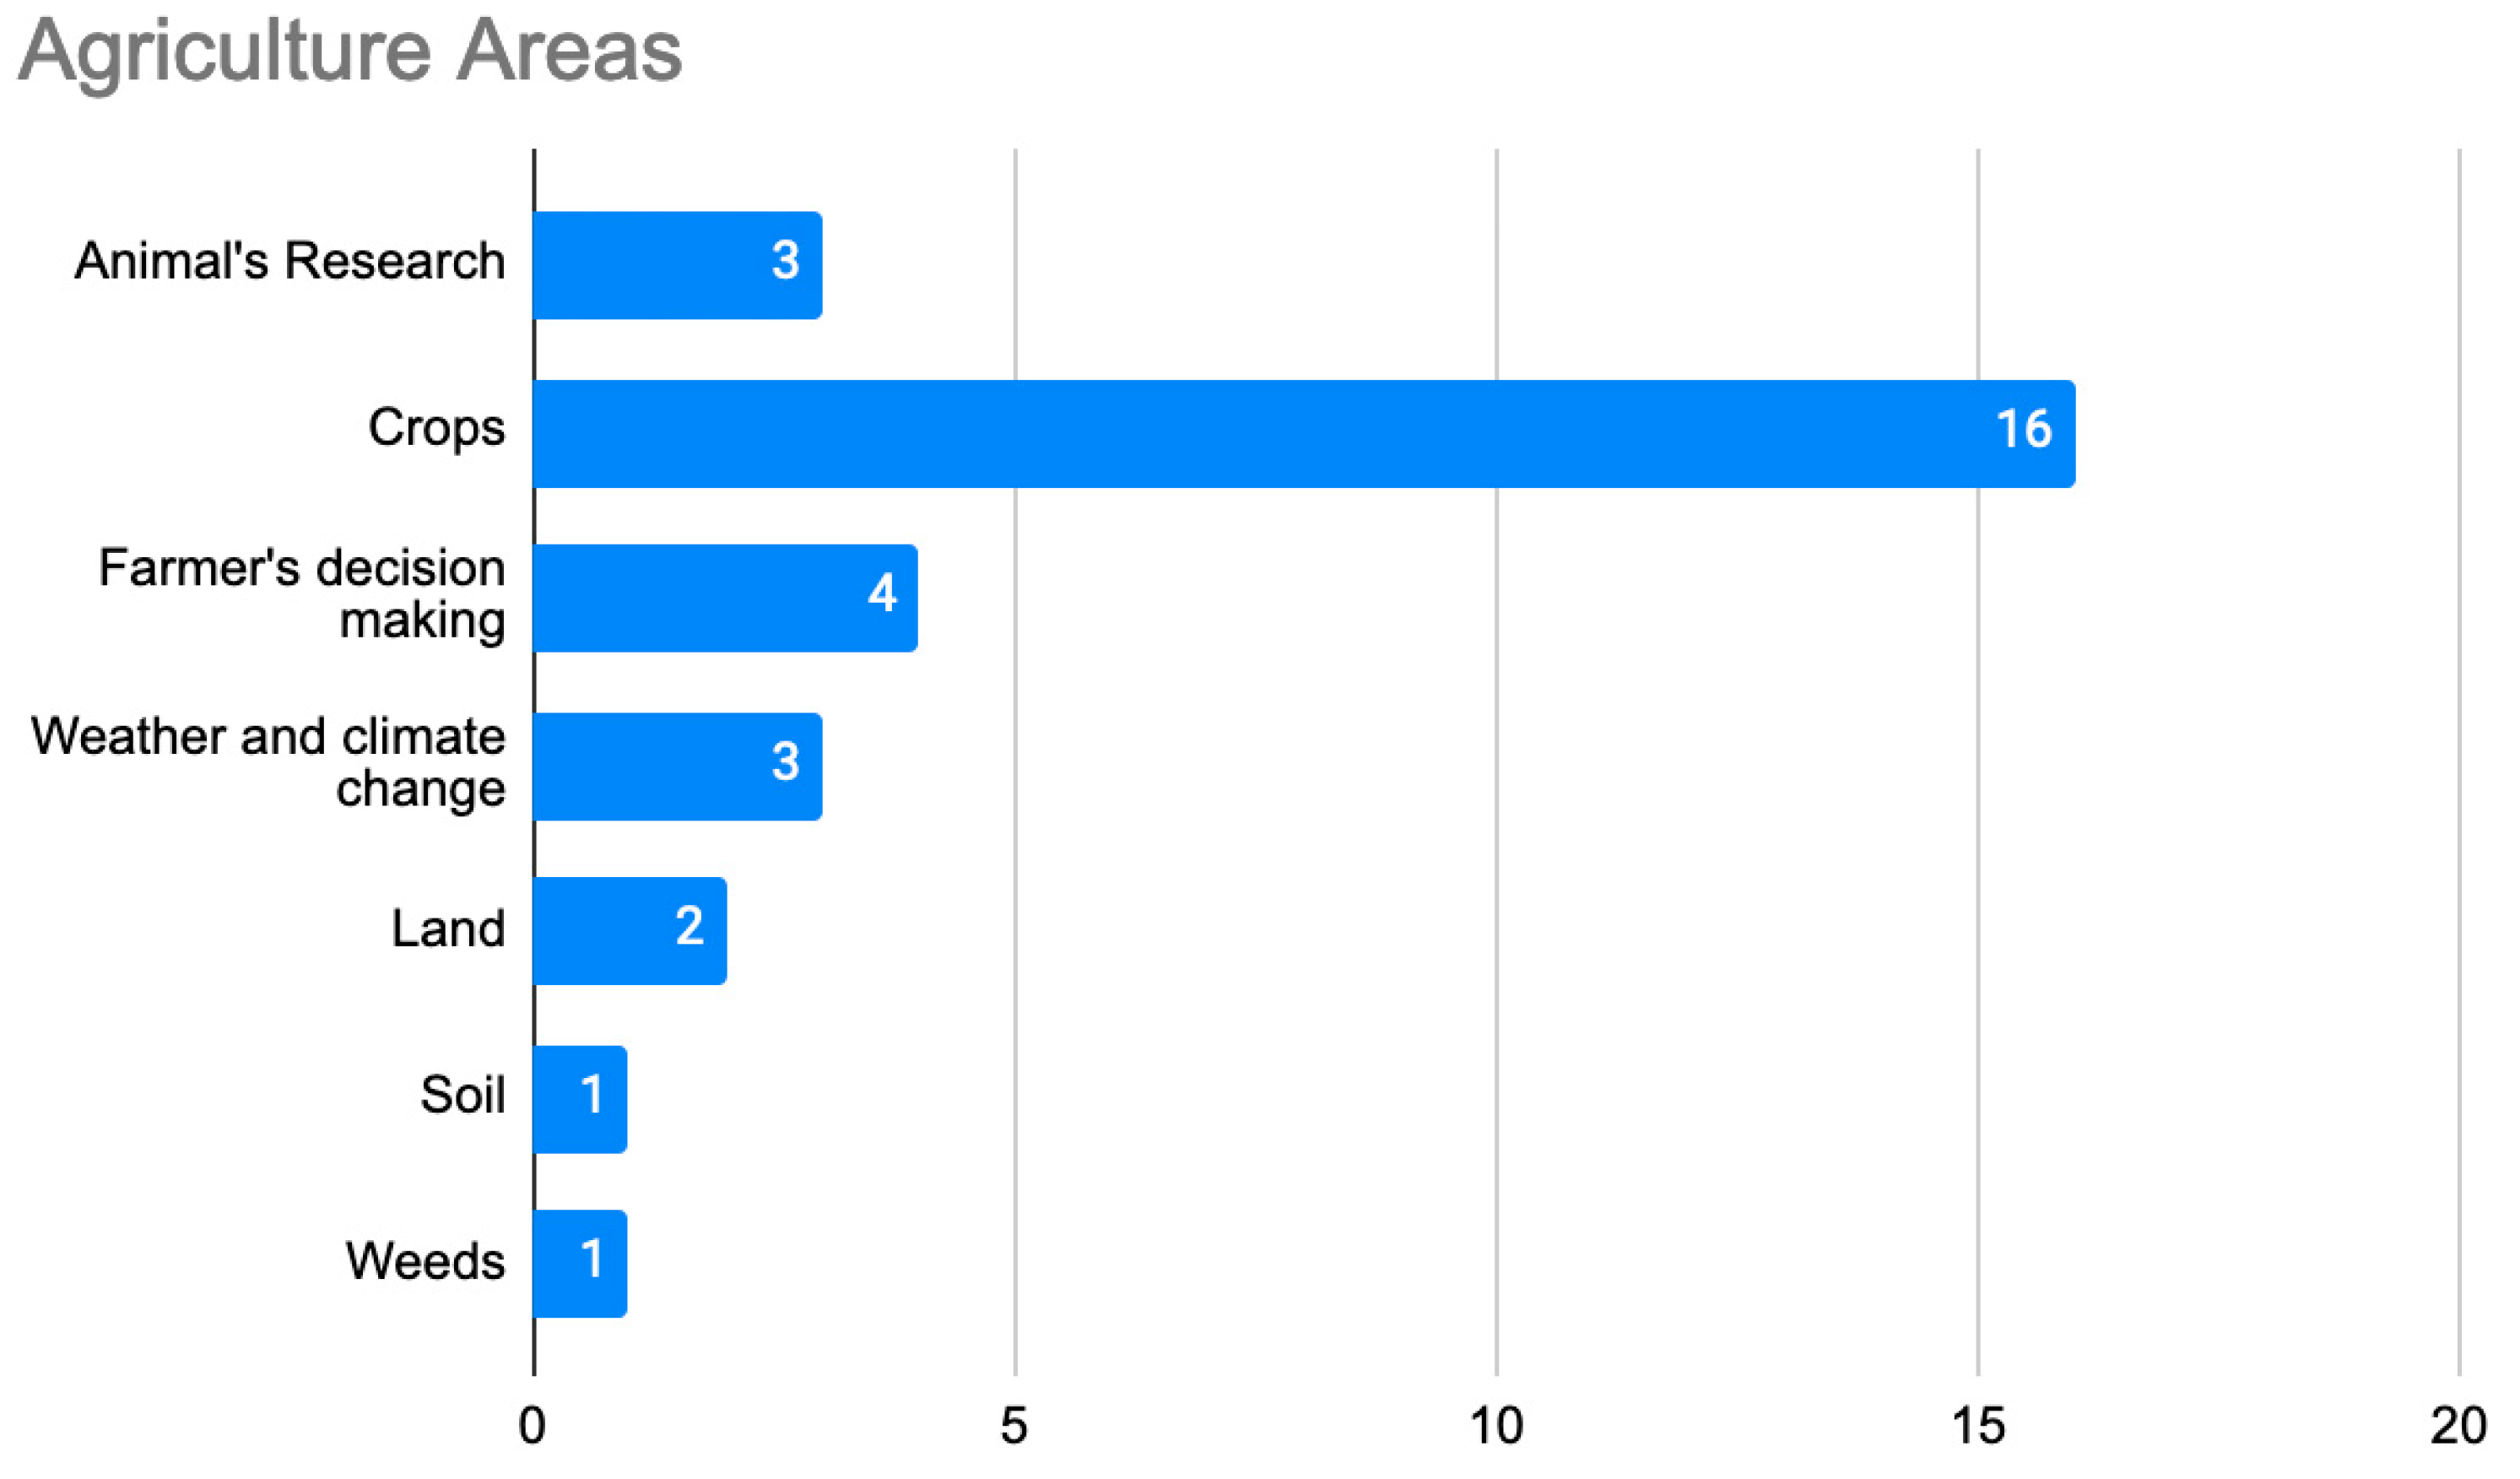
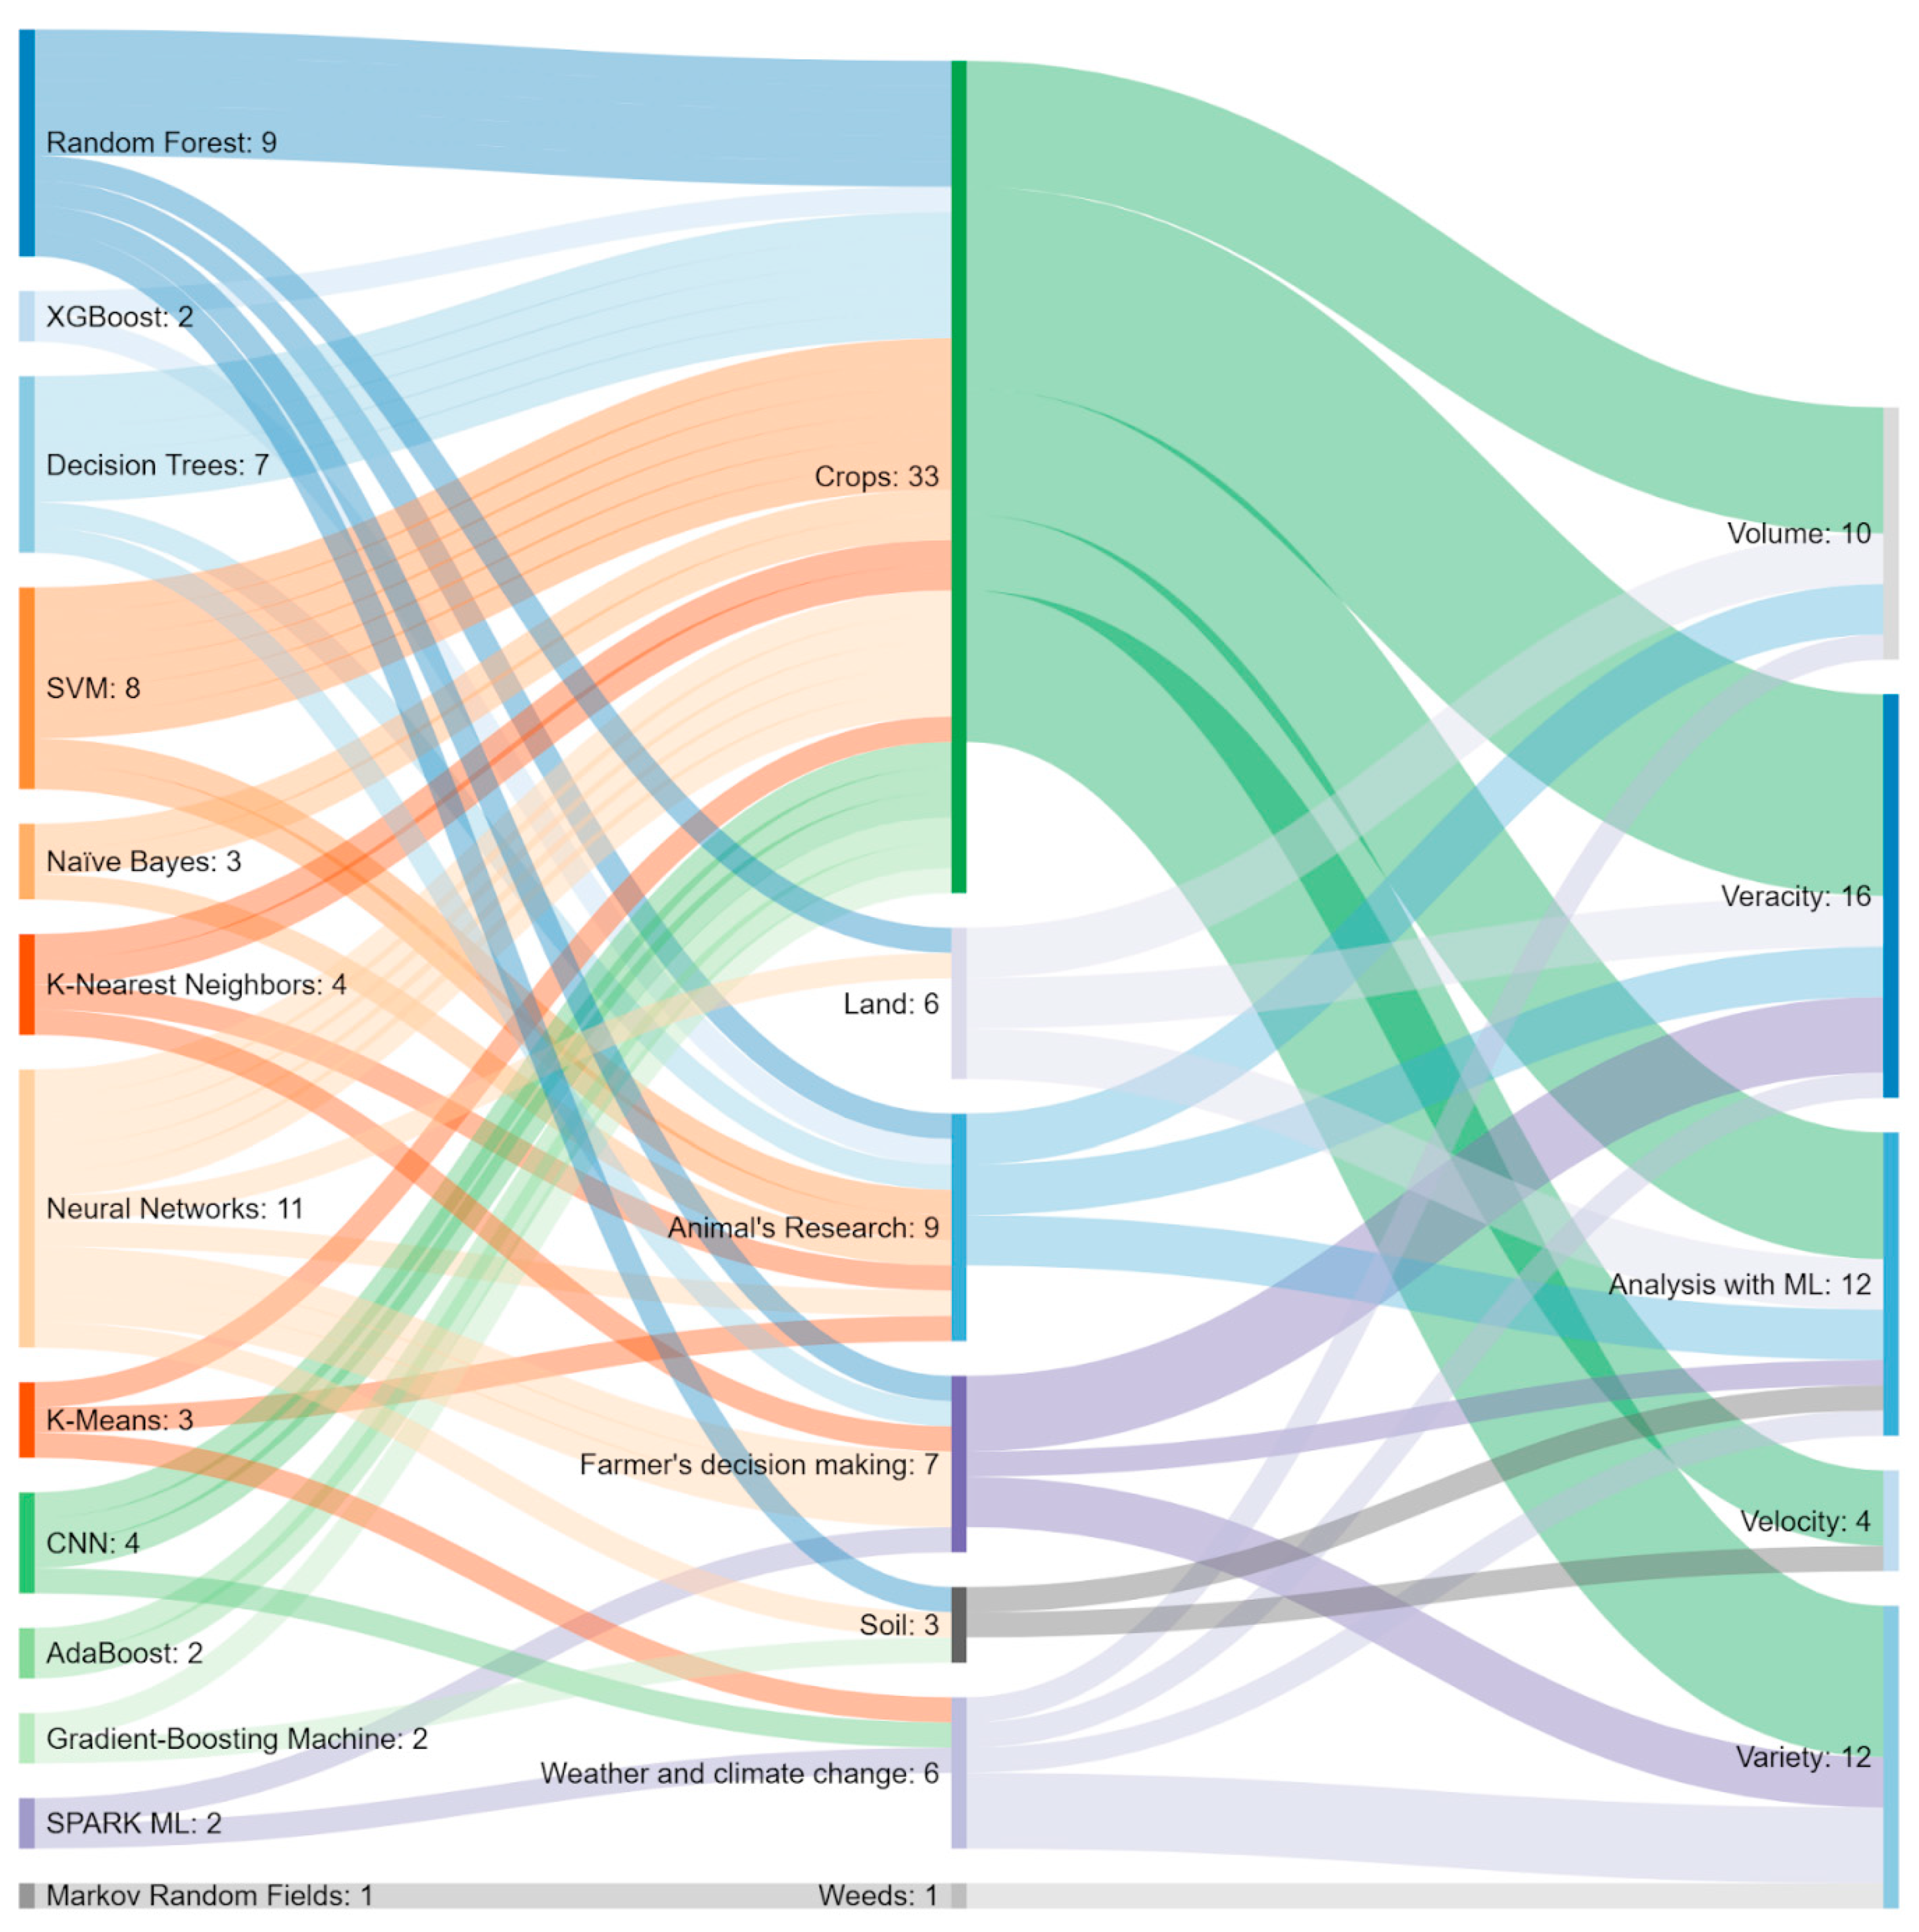
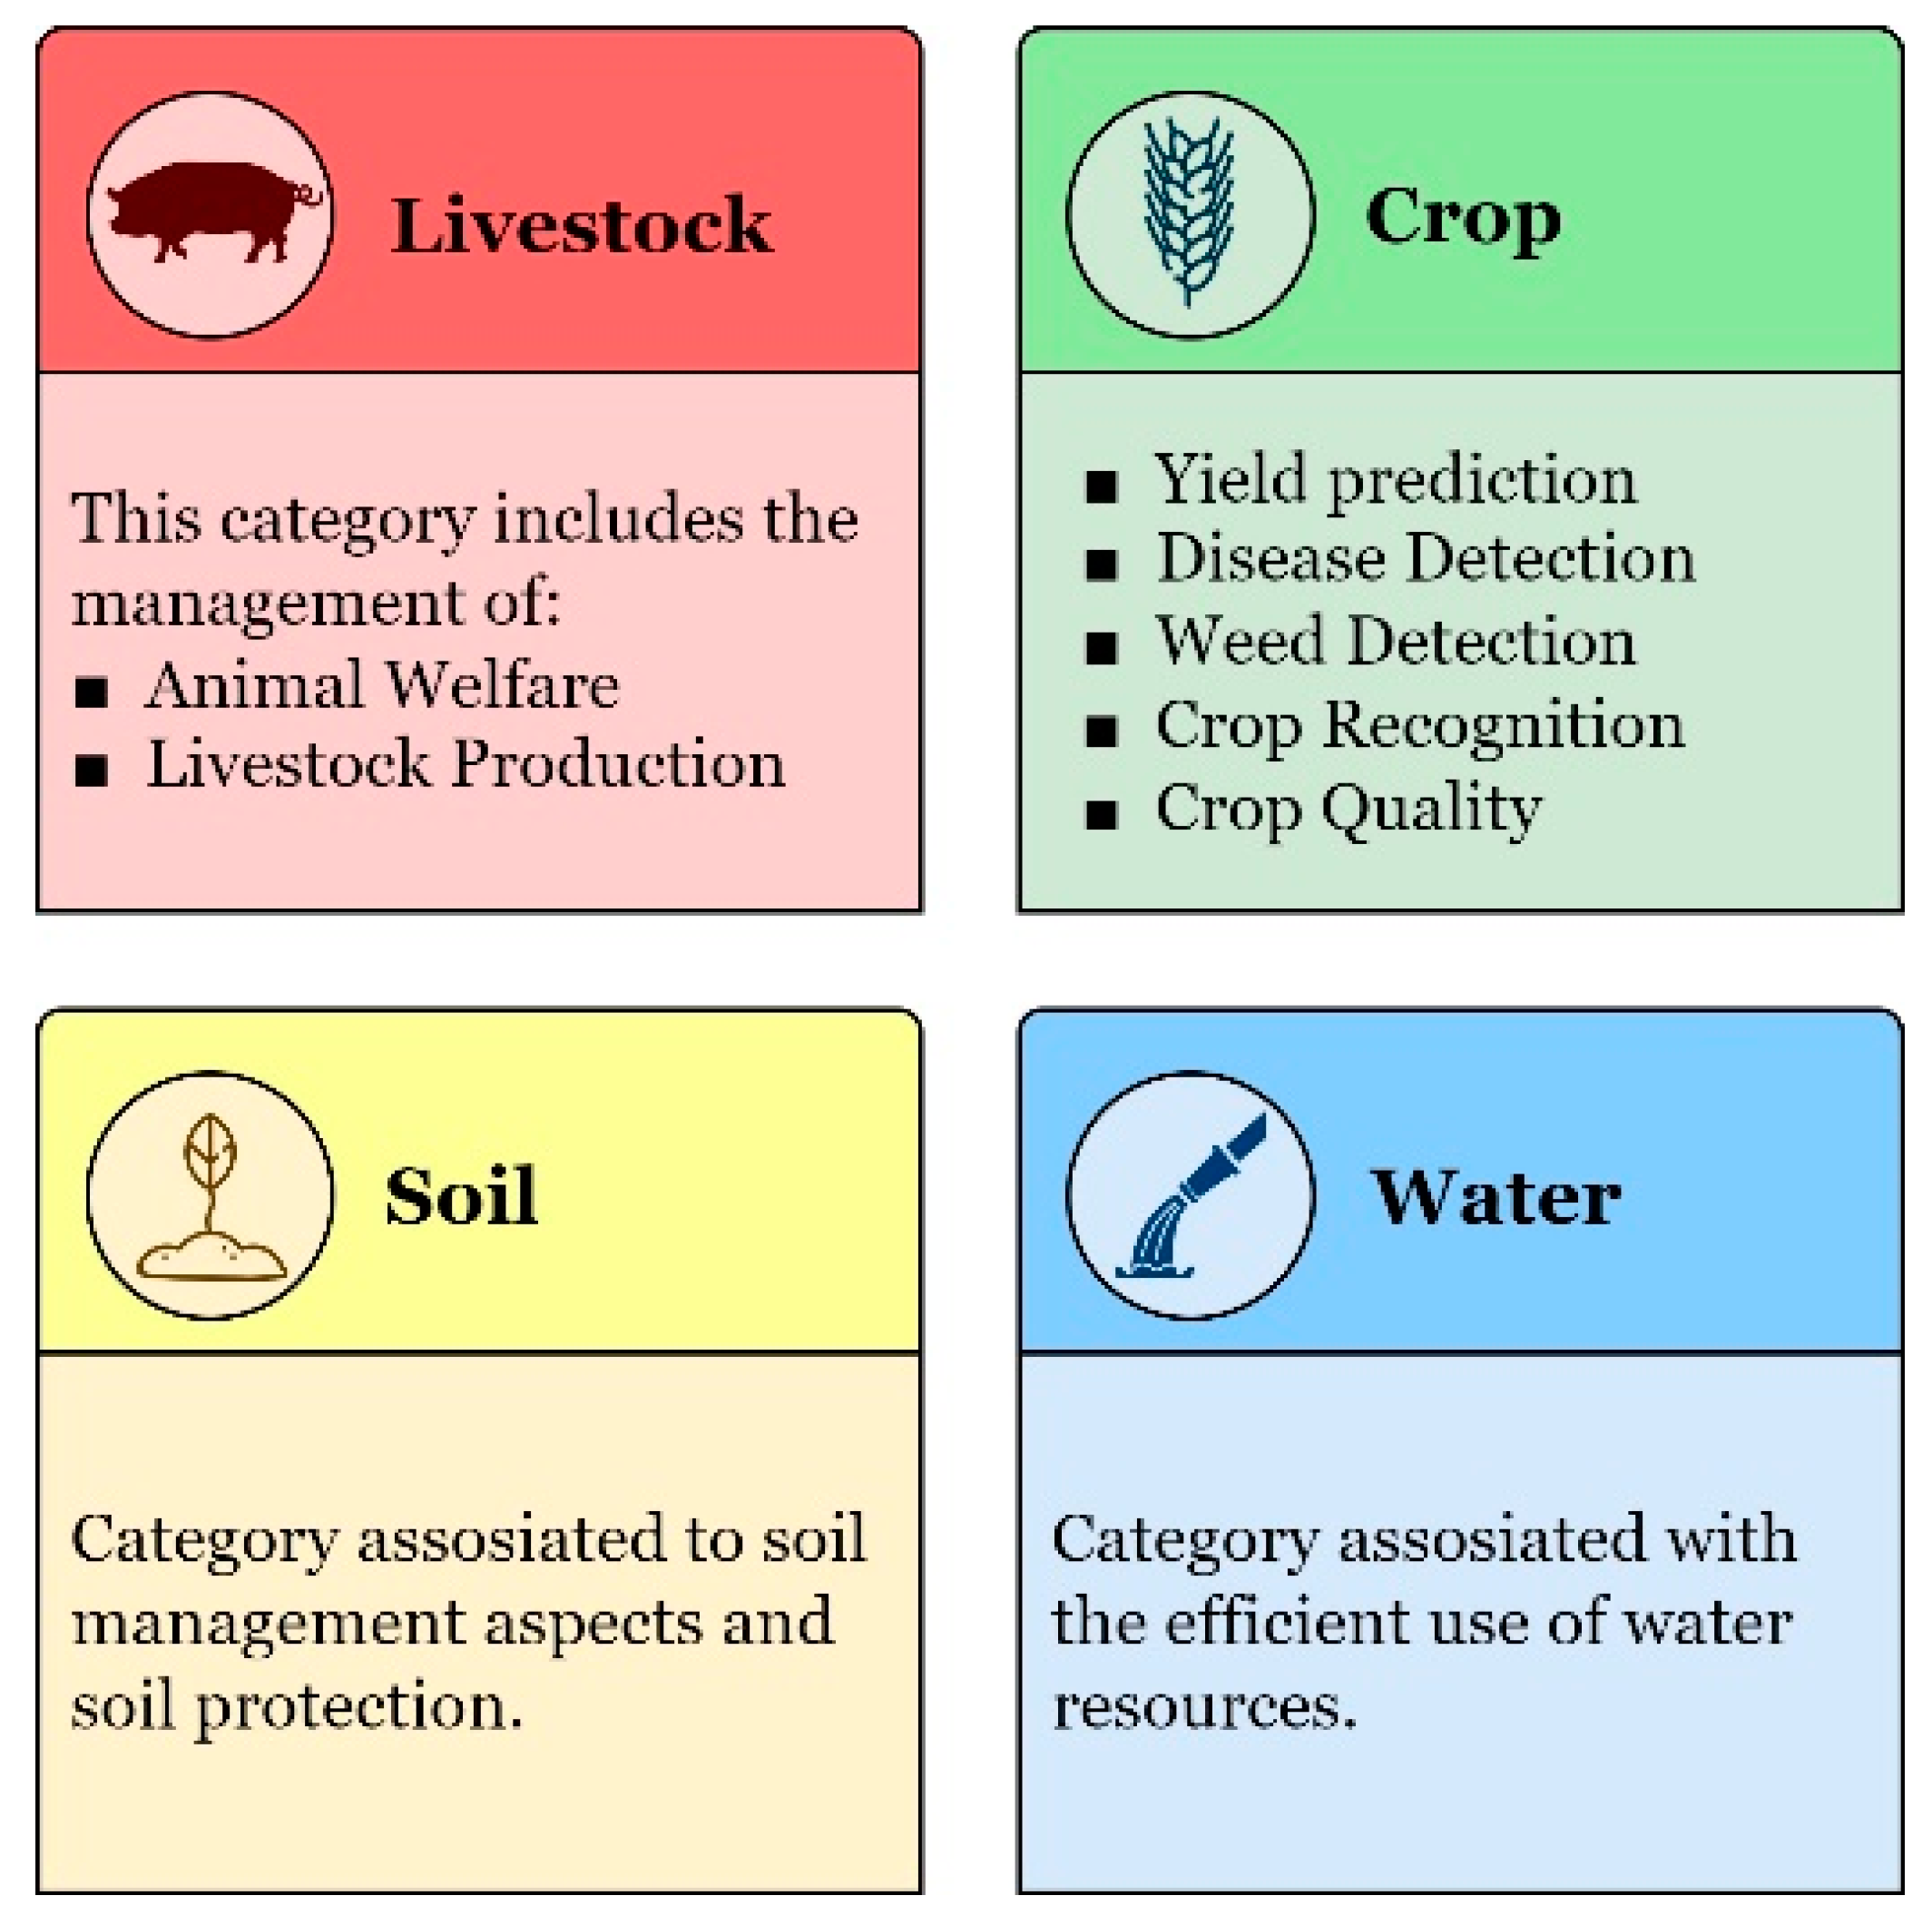
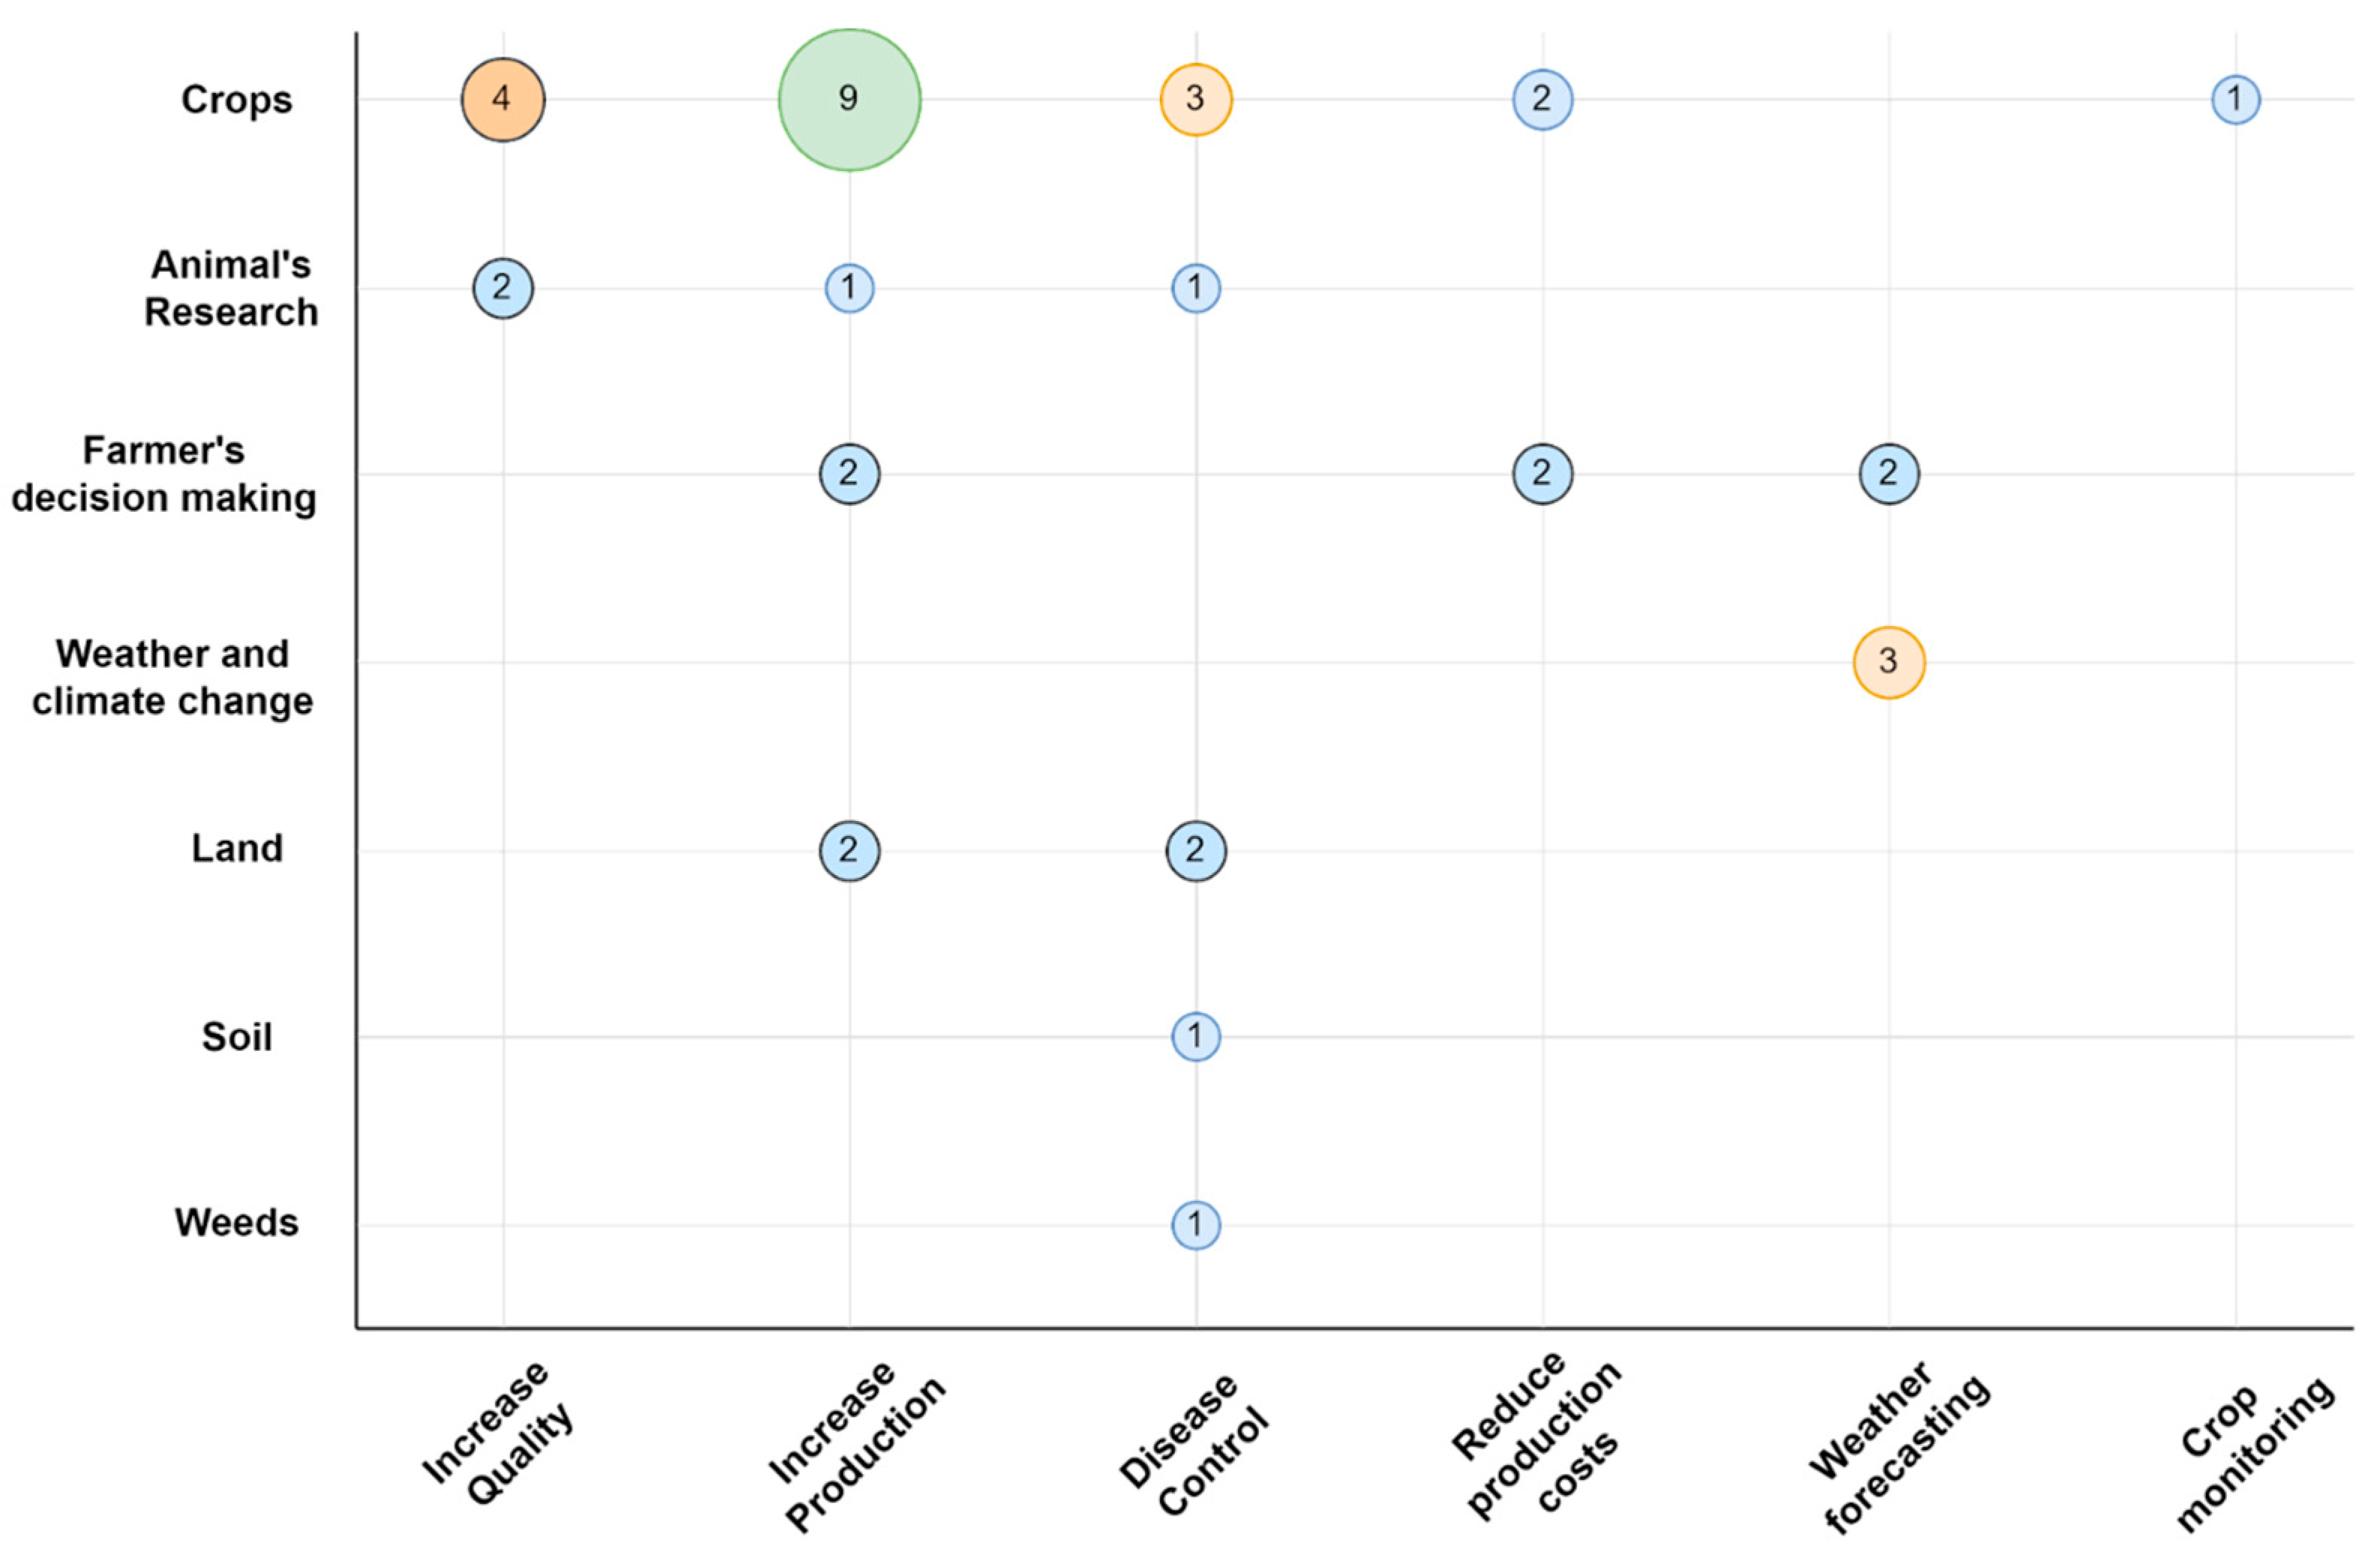
4.1. Solutions in Agricultural Big Data

The 30 selected articles explained Big Data and ML solutions to problems faced in different areas of agriculture. The solutions were related to farmers’ decision making, crops, animal research, land, food availability and security, weather and climate change, and weeds. Figure 9 shows the number of papers found by category.

4.1.1. Farmers’ Decision Making

In the case of farmers’ decision making, three problems have been noted and solved by applying ML in Big Data systems. The first one involves taking actions to lower production costs. Dutta et al. managed to capture data from domain knowledge on farming processes, understanding of the soil, harvest optimization based on climate conditions, and data from the farmers’ undocumented experiences. They analyzed the data to develop low-cost planting [36]. They used a Big Data architecture to process the available metadata separately from the data analysis. The processing was performed using data mining and text mining techniques, and ML techniques applied to sensor data. The uniqueness of the architecture in this context lay in the selection of the ML technique based on the real-time application and the farmers’ expert domain knowledge. In this way, it was possible to target the ML processes to extract the desired feature space, increasing the efficiency and accuracy of the system.
Doshi et al. developed a Big Data system they call AgroConsultant, which is designed to help Indian farmers make an informed decision about which crop to grow considering the planting season, the geographic location of their operation, the characteristics of the soil, and environmental factors such as temperature and precipitation [37]. For this purpose, the authors use a Big Data architecture with two subsystems. The first one predicts crop suitability through recommendations. They use a training dataset to ensure the ML techniques’ correct analysis. This dataset includes historical records of soil and weather parameters for 20 crop types accumulated over thirty years. The second subsystem is concerned with processing the heterogeneous data and class labels for subsequent ML analysis.
The second problem has to do with climate prediction. Rehman et al. used real-time applications on sensors to capture climate changes in the soil and the atmosphere to establish planting dates [38]. They used a Big Data architecture with IoT to collect data in a real time and seamless way. The system makes recommendations by analyzing a set of agricultural and climate change rules.
Finally, the third problem refers to increasing production. For this, Tarik and Mohammed use methodological data to predict the cereal production rate in an area characterized by an unstable climate [39]. They use a system that captures water data from a weather station. The information is processed to obtain temperature, dew point, humidity, pressure, visibility, wind direction, wind speed, gust speed, events, rainfall, weather conditions, etc. The system pre-processed the data because it is often incomplete and inconsistent. The data from 60 years of industry history data were processed to carry out the comparative study. The authors were able to analyze the data to improve the understanding of the agricultural ecosystem through a scorecard.

4.1.2. Crops

In the case of crops, the most significant concern is to increase production after reducing production costs, increasing quality, and finally managing diseases. Balducci et al. analyze environmental data such as climate, humidity, and wind along with production and structural data such as soil type and land extension and, from these, propose easy-to-develop tasks based on the use of ML techniques [40]. In the same concern, Kedarmal et al. use an ontology of smart farming that contains agriculture-related concepts and properties to link the stored data with a knowledge graph. This graph allows farmers to take timely action to improve production and predict crop yields [41]. Ramaraj et al. address the issue of crop yield prediction by analyzing the most commonly used rice cultivation methods, yield parameters, and morphological characteristics of the crop, thus improving the process of predicting yield expectations [42]. Priya et al. present a precision farming model to suggest what crops must be planted in terms of field conditions. This suggestion allows farmers to maximize the production and quality of their crops [43,44]. Yoki et al. implement the BMS system (Big Data Application Machine Learning-based Smart Farm System), emphasizing crop productivity and the importance of increasing the farmers’ income. The author concludes that the information and the processable knowledge must be improved at the farm level to increase production and improve the quality of the harvest by getting a reasonable price [45]. For crop identification and classification, Shelestov et al. present a workflow that uses satellite imagery and produces a crop classification map of the analyzed area [46]. Yahata et al. address the same issue, using image detection methods on images obtained from a cyber–physical system to collect data on the stage of crop growth and environmental information [47]. They developed valuable rules for a good crop, adapted through detecting flowers and seedpods. Crop disease detection is addressed by Fenu and Malloci, who conclude that the ML models tested are able to predict a risk index for late blight in potatoes using weather data from meteorological stations in the region [48]. Tombe presents a development that integrates computer vision for smart agriculture. The proposed technique analyzes crop image features and can determine the health status of the crop, identifying diseases or weeds [49].

4.1.3. Animal Research

In animal research, we found only three papers that explain the use of Big Data and ML. Nobrega et al. used an animal behavior monitoring platform based on IoT and cloud computing technologies to monitor sheep in vineyards. The system allows knowing what each sheep consumes to ensure that the vineyards are not damaged and improve quality. On the other hand, the system allows keeping track of sheep diseases [50]. Abbona et al. developed a genetic programming approach that includes white-box techniques that are suitable for selecting essential variables to generate simple models that allow understanding the causes of calf deaths. Ferreira et al. evaluated beef cattle production performance in Brazil, where animal nutrition is measured to improve quality [51].

4.1.4. Land

Under the topic of land, we found only two papers that approached Big Data and ML to solve their problems. Agriculture and Agri-Food Canada (AAFC) is the federal department responsible for agriculture that releases the Annual Crop Inventory in Space maps to improve agricultural production. These maps are valuable operational space-based remote sensing products covering agricultural land use and non-agricultural land found within Canada’s agricultural acreage [52]. Similar work was done by Amani et al. to develop high spatial resolution (30 m) reference maps of the cropland extent of South Asia. The authors explained a need to improve productivity due to the food insecurity experienced in the area [52].

4.1.5. Weather and Climate Change

On the other hand, we found two papers under the weather and climate change heading. Sathiaraj et al. analyzed more than 3000 weather observation sites in the United States, intending to classify weather types in regions across the country [53]. The goal was to understand the climate type of a specific region as it has applications in public health, the environment, actuarial science, insurance, agriculture, and engineering [53]. Moreover, Amaechi and Pham used various ML techniques to analyze climate data and improve prediction [54].
Kaur et al. indicate that an essential issue for agricultural planning is to estimate evapotranspiration accurately, as it plays a crucial role in scheduling irrigation water to use it efficiently [55]. They use ML and Big Data techniques to create an H2O model framework to determine daily ETo. In Ryan et al., they analyze crops using Markov chains, focusing on weed control and management [56].
In general, Big Data and ML are two technologies used to solve several problems in the agriculture field. The problems described include increased production and quality, disease control, cost reduction, climate prediction and control, and crop monitoring. Figure 10 presents a summary of the number of papers found. Some papers reported more than one problem to be solved. For example, increasing yield and also crop quality were mentioned. On the other hand, Figure 11 presents a map summarizing the number of papers selected by category vs. problems to be solved.
From Figure 11, it is possible to observe that the primary concern is the improvement of crops to increase production. This concern is due to the problem of food security in several regions of the world. On the other hand, there is little concern for crop monitoring. An example of this concern is observed in Sitokonstantinou et al., which shows the monitoring of all crops in Korea to avoid overproduction of rice and increase that of other cereals, achieving a nutritional balance [57]. So far, all agricultural Big Data systems work independently, thinking about solving the specific problems of each agricultural area. However, solving the problems shown in Figure 11 is a global phenomenon. In the future, the systems will be interconnected to monitor the entire world production, verifying the state of sowing to make timely decisions.

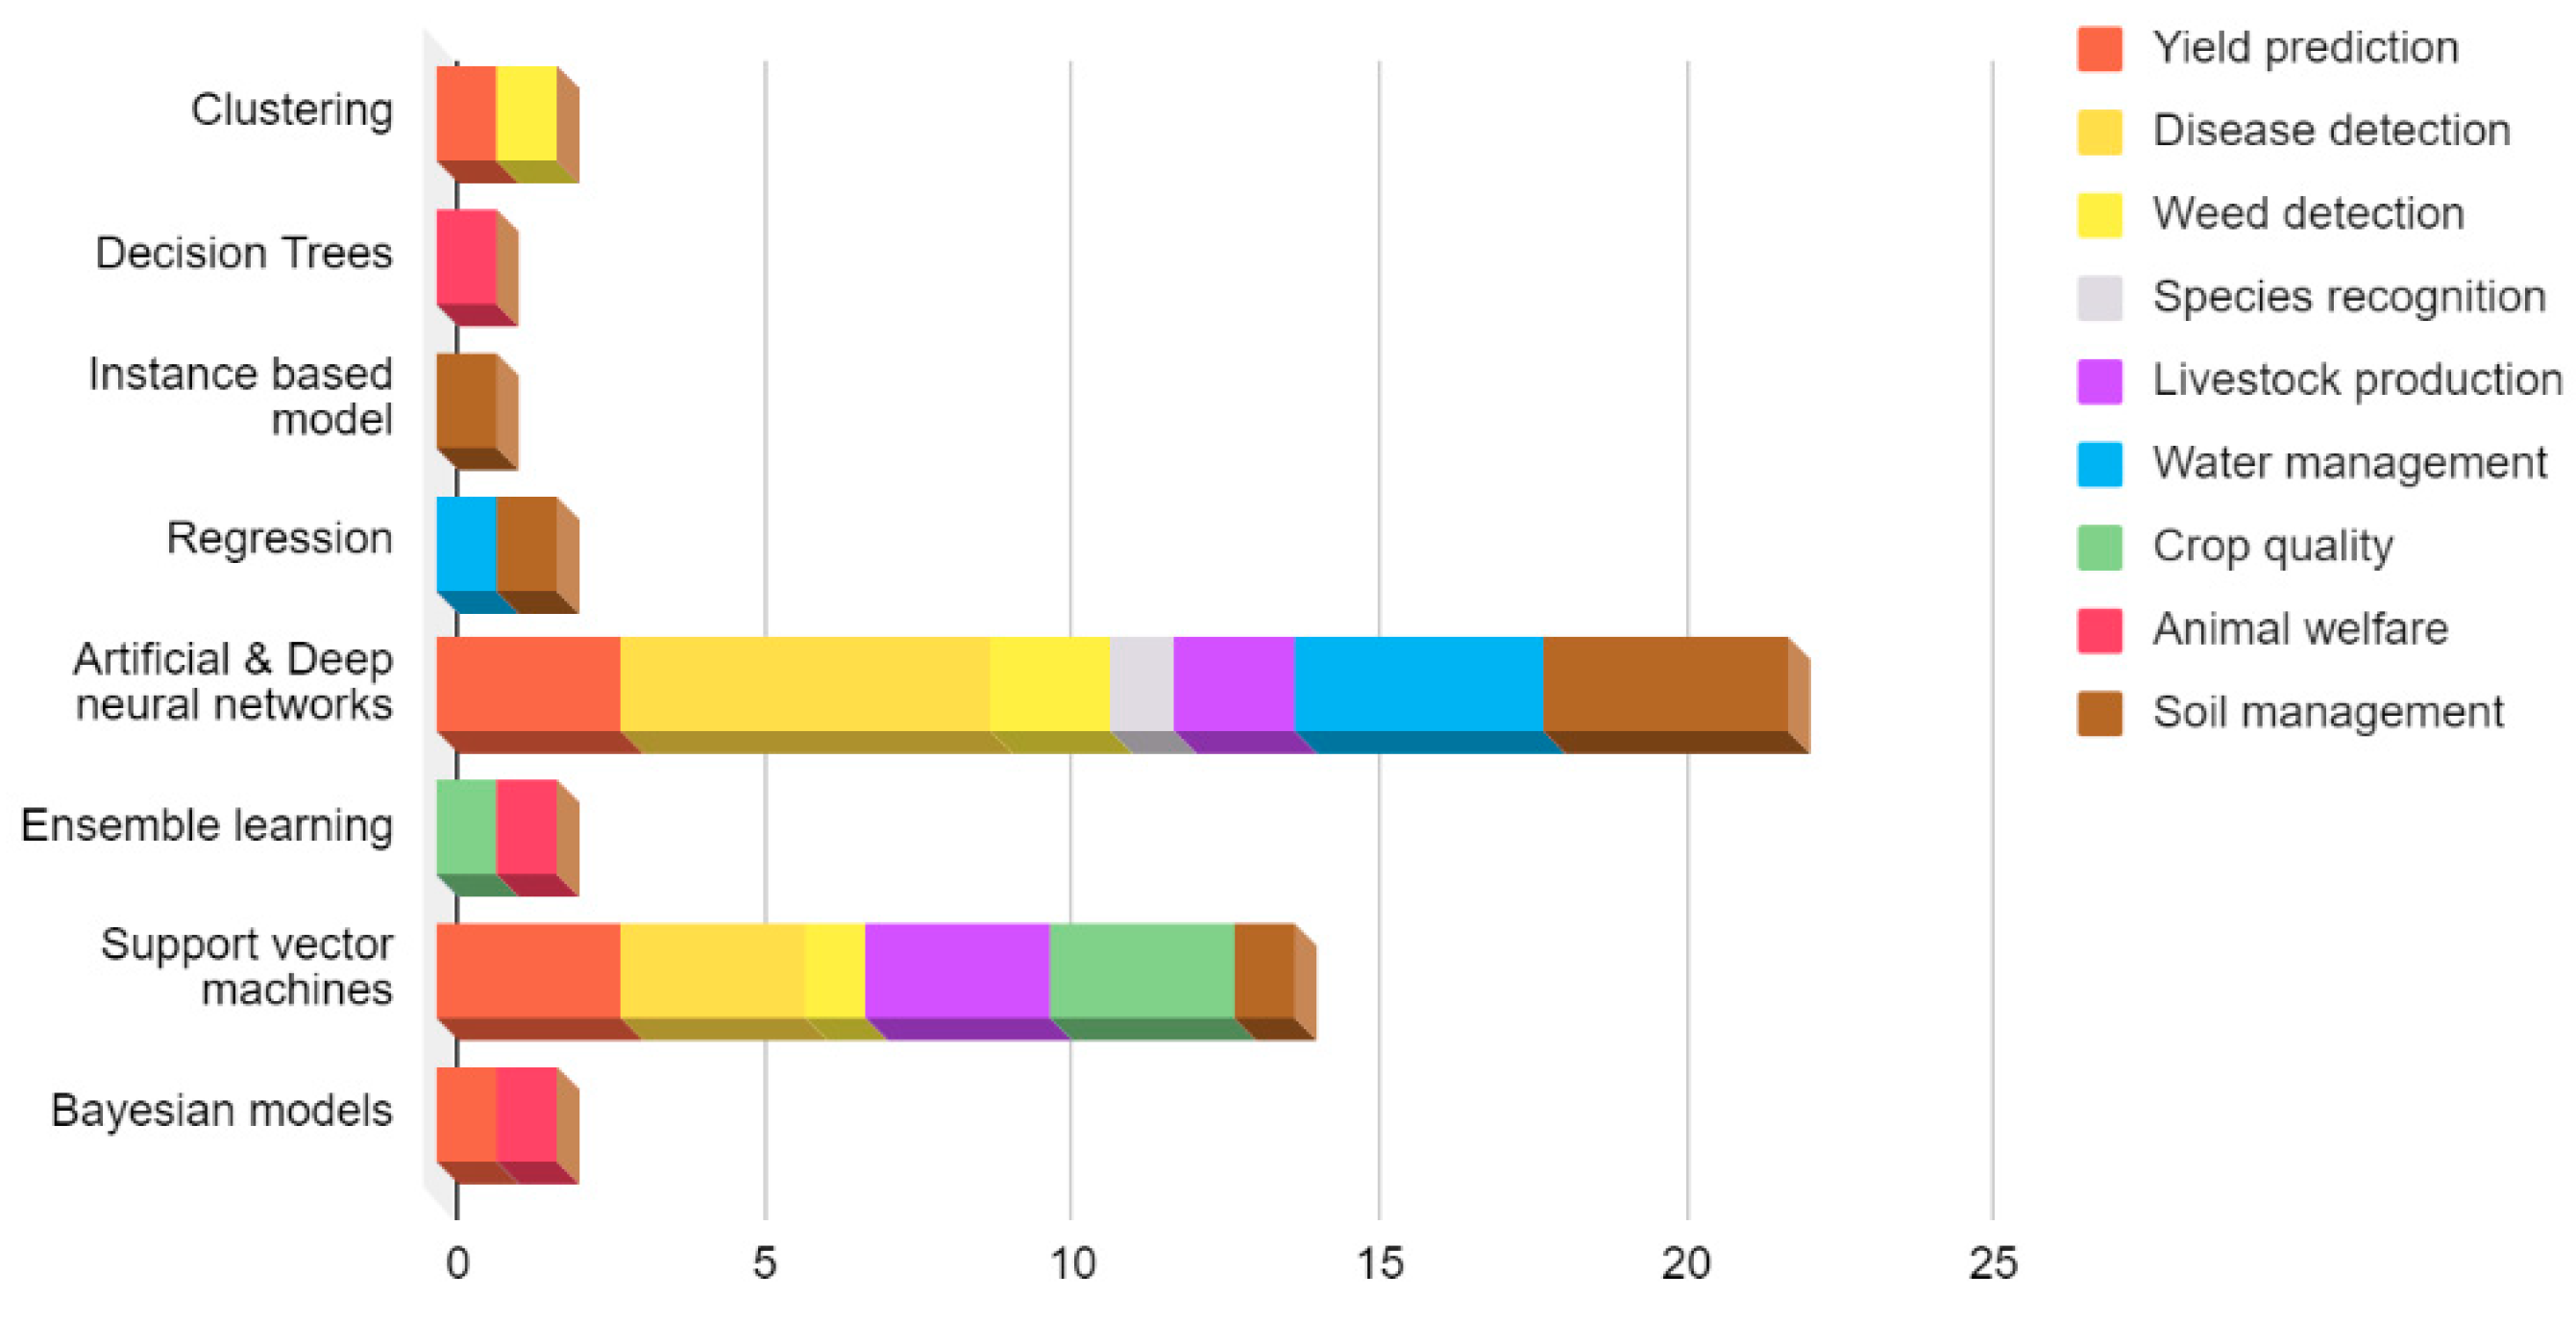
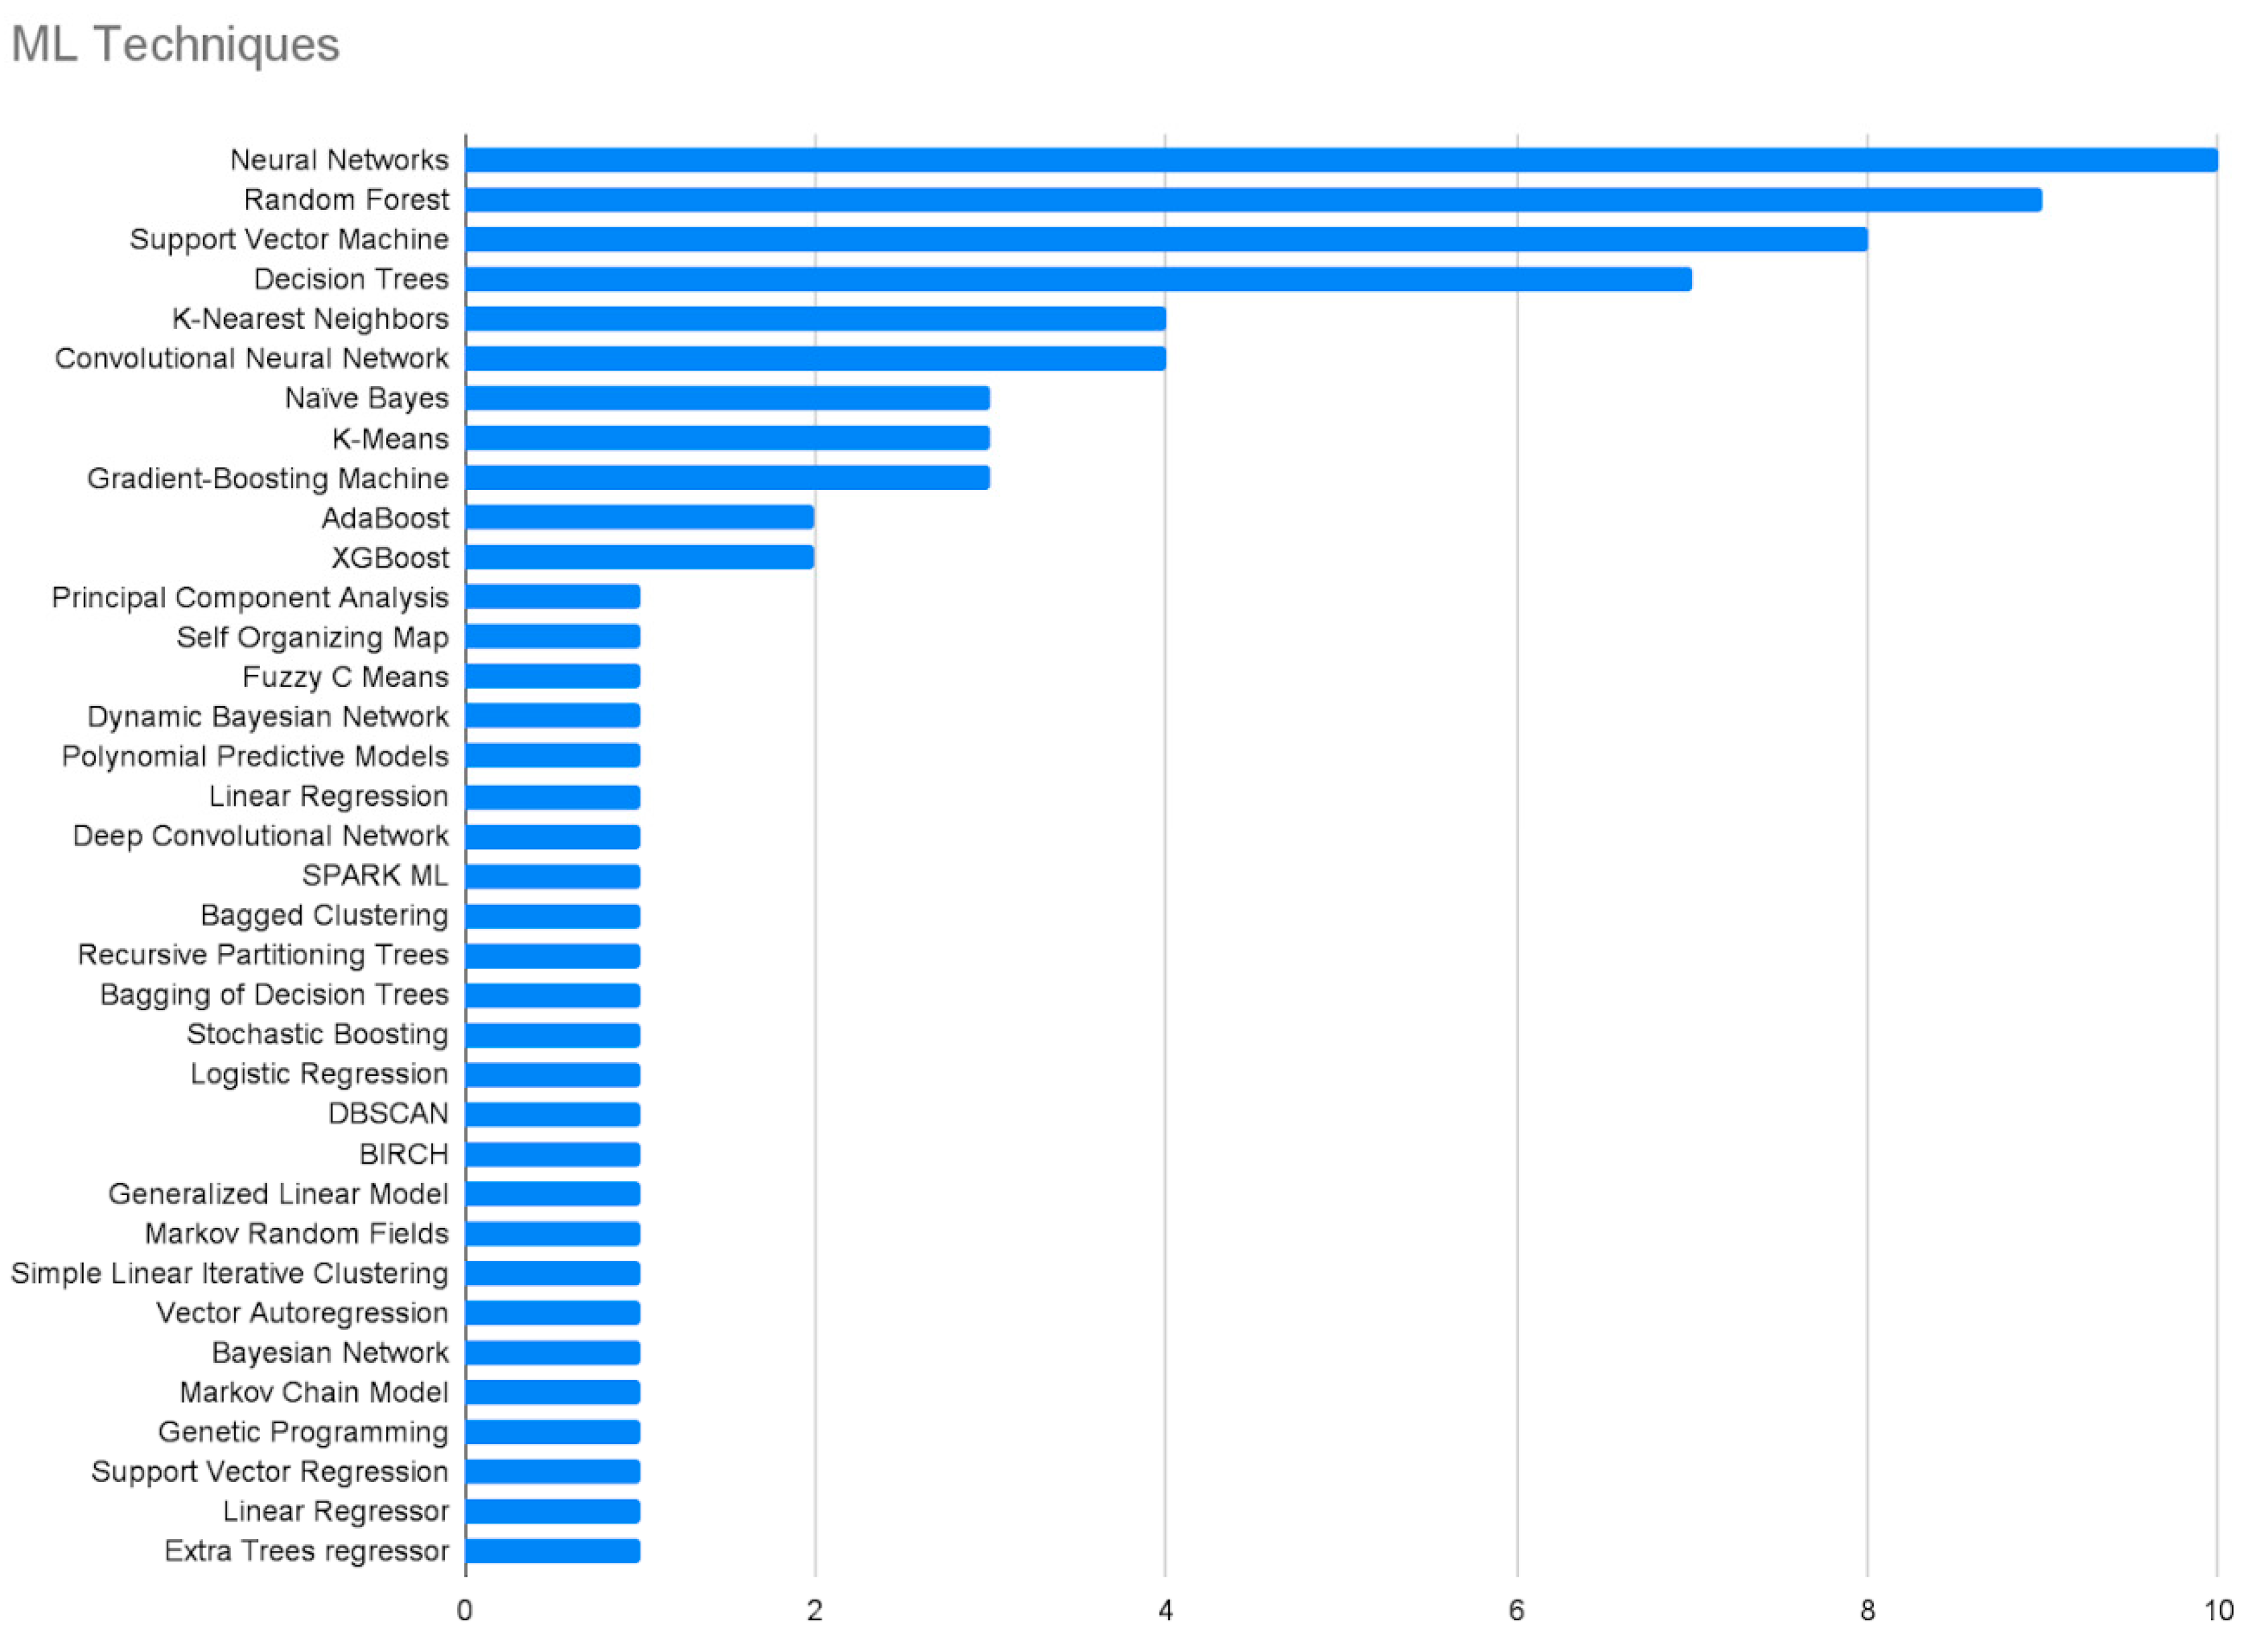
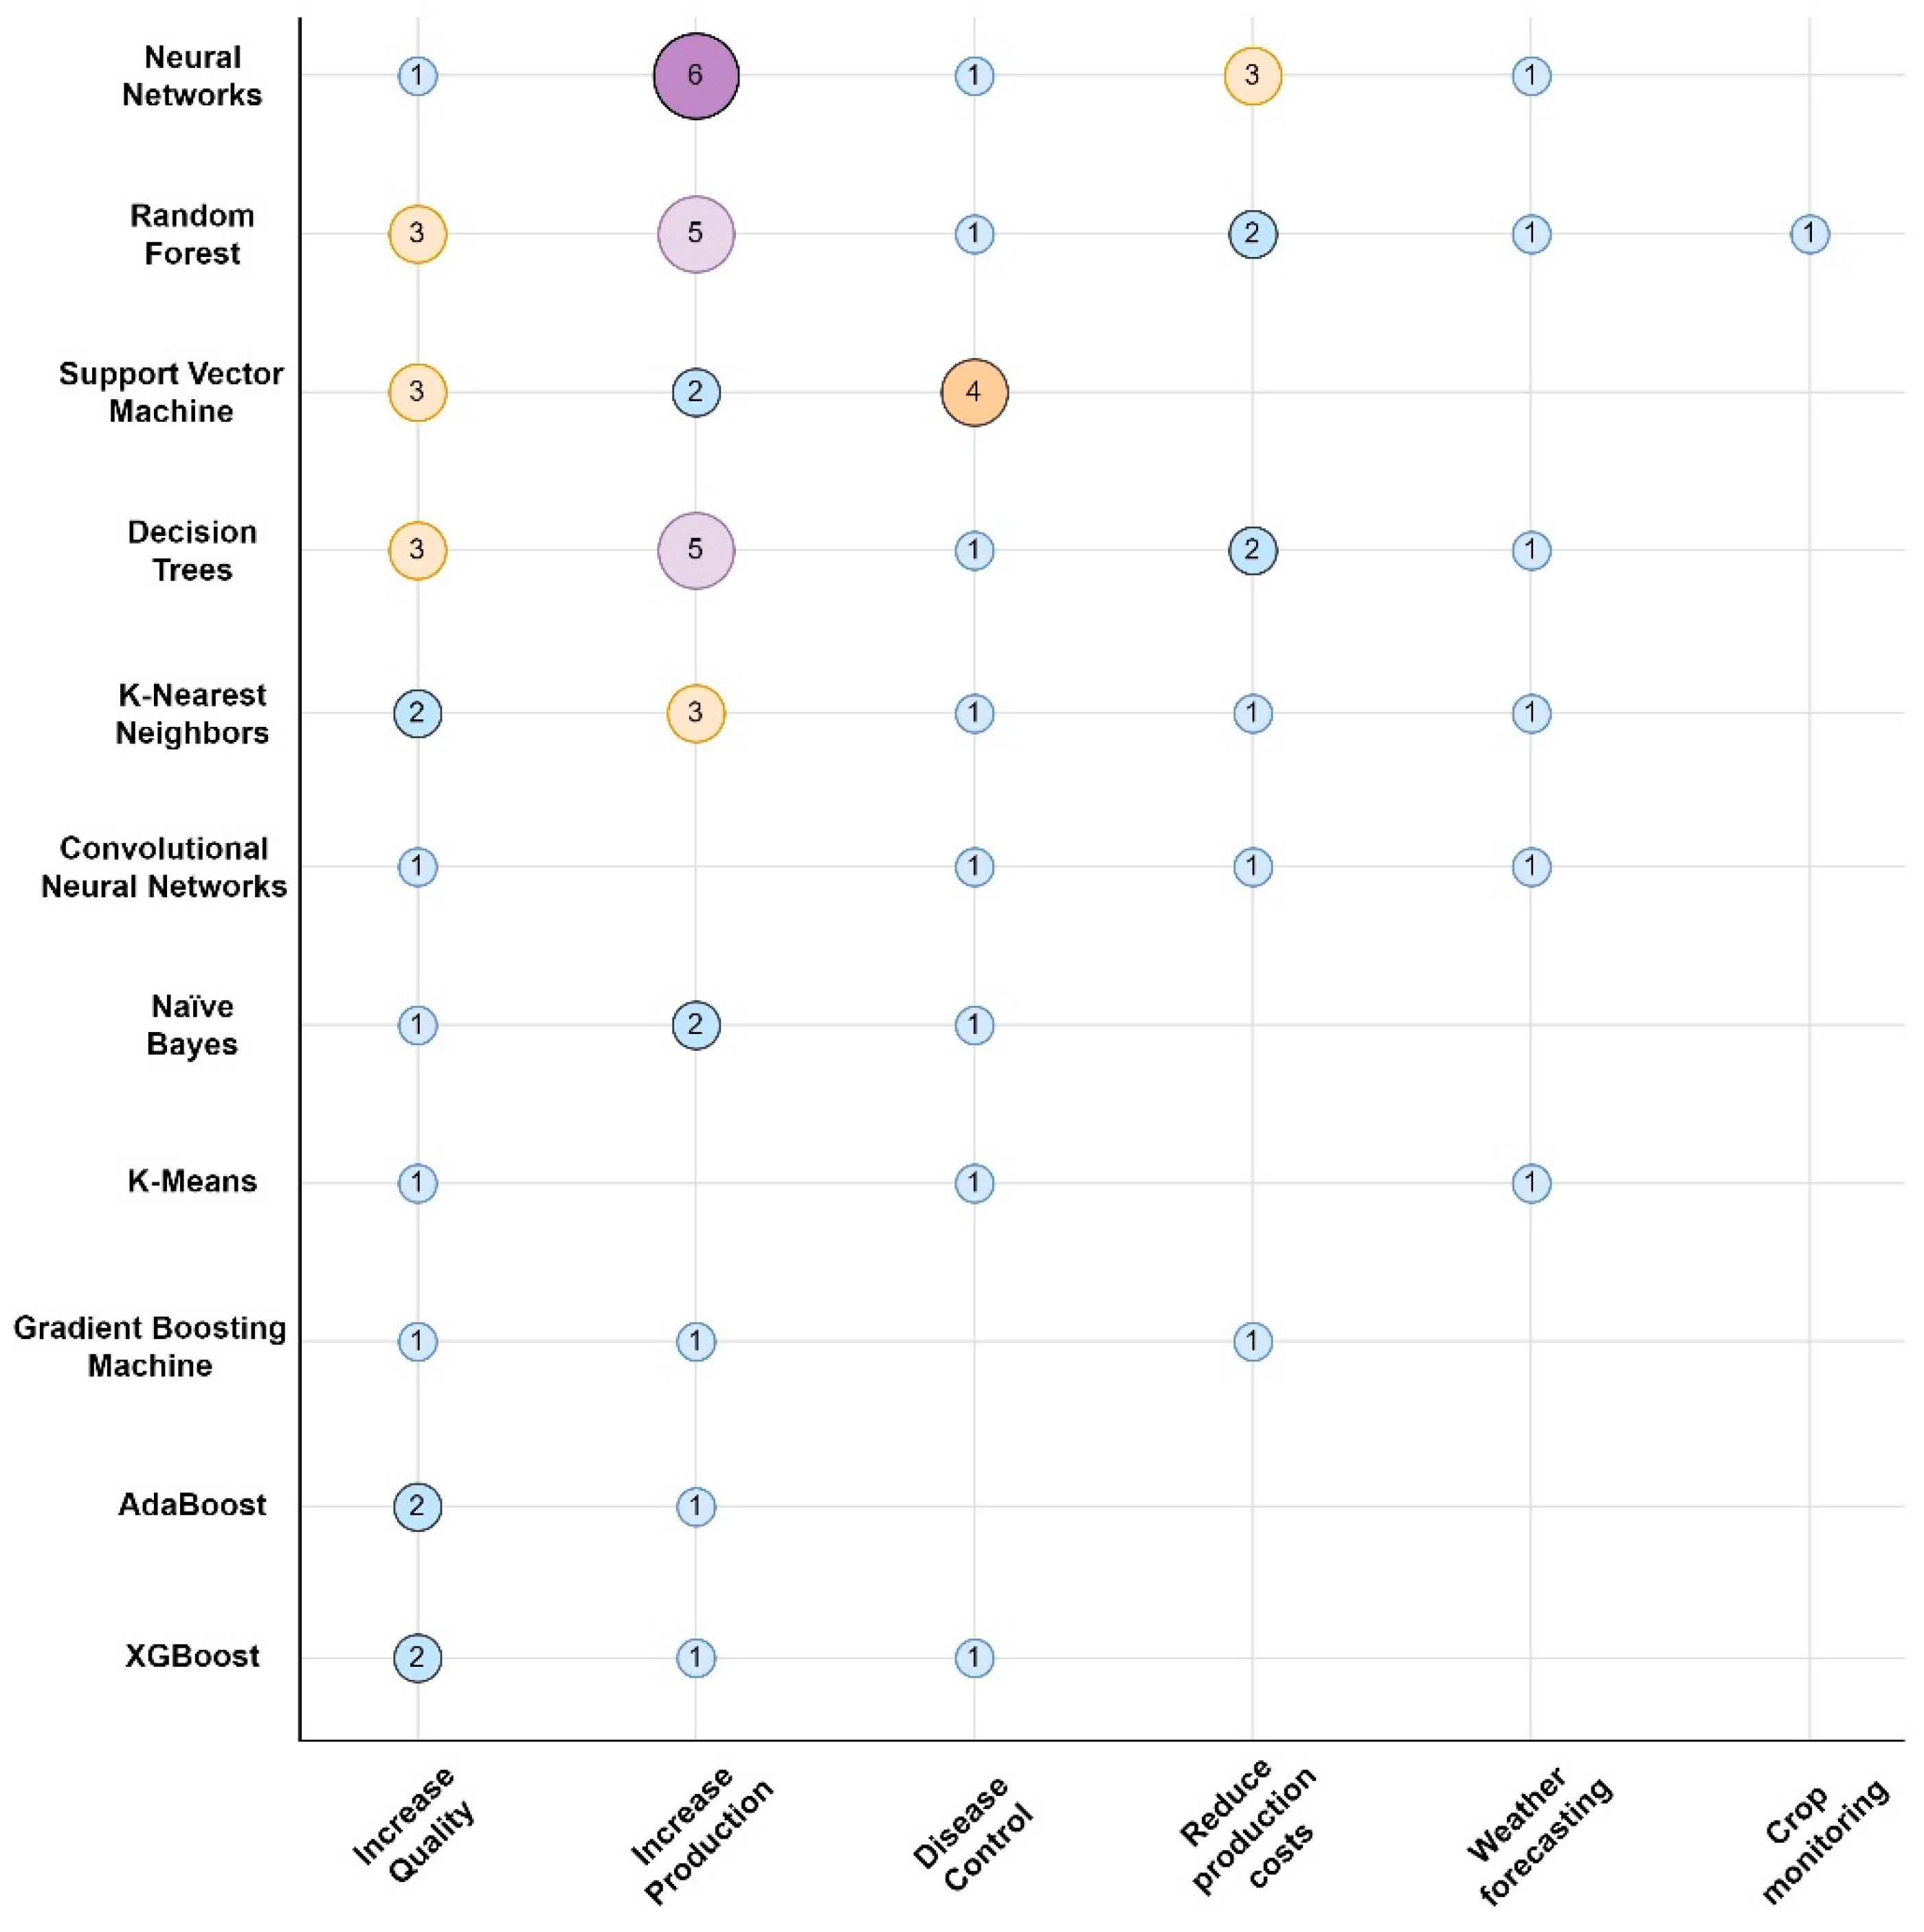
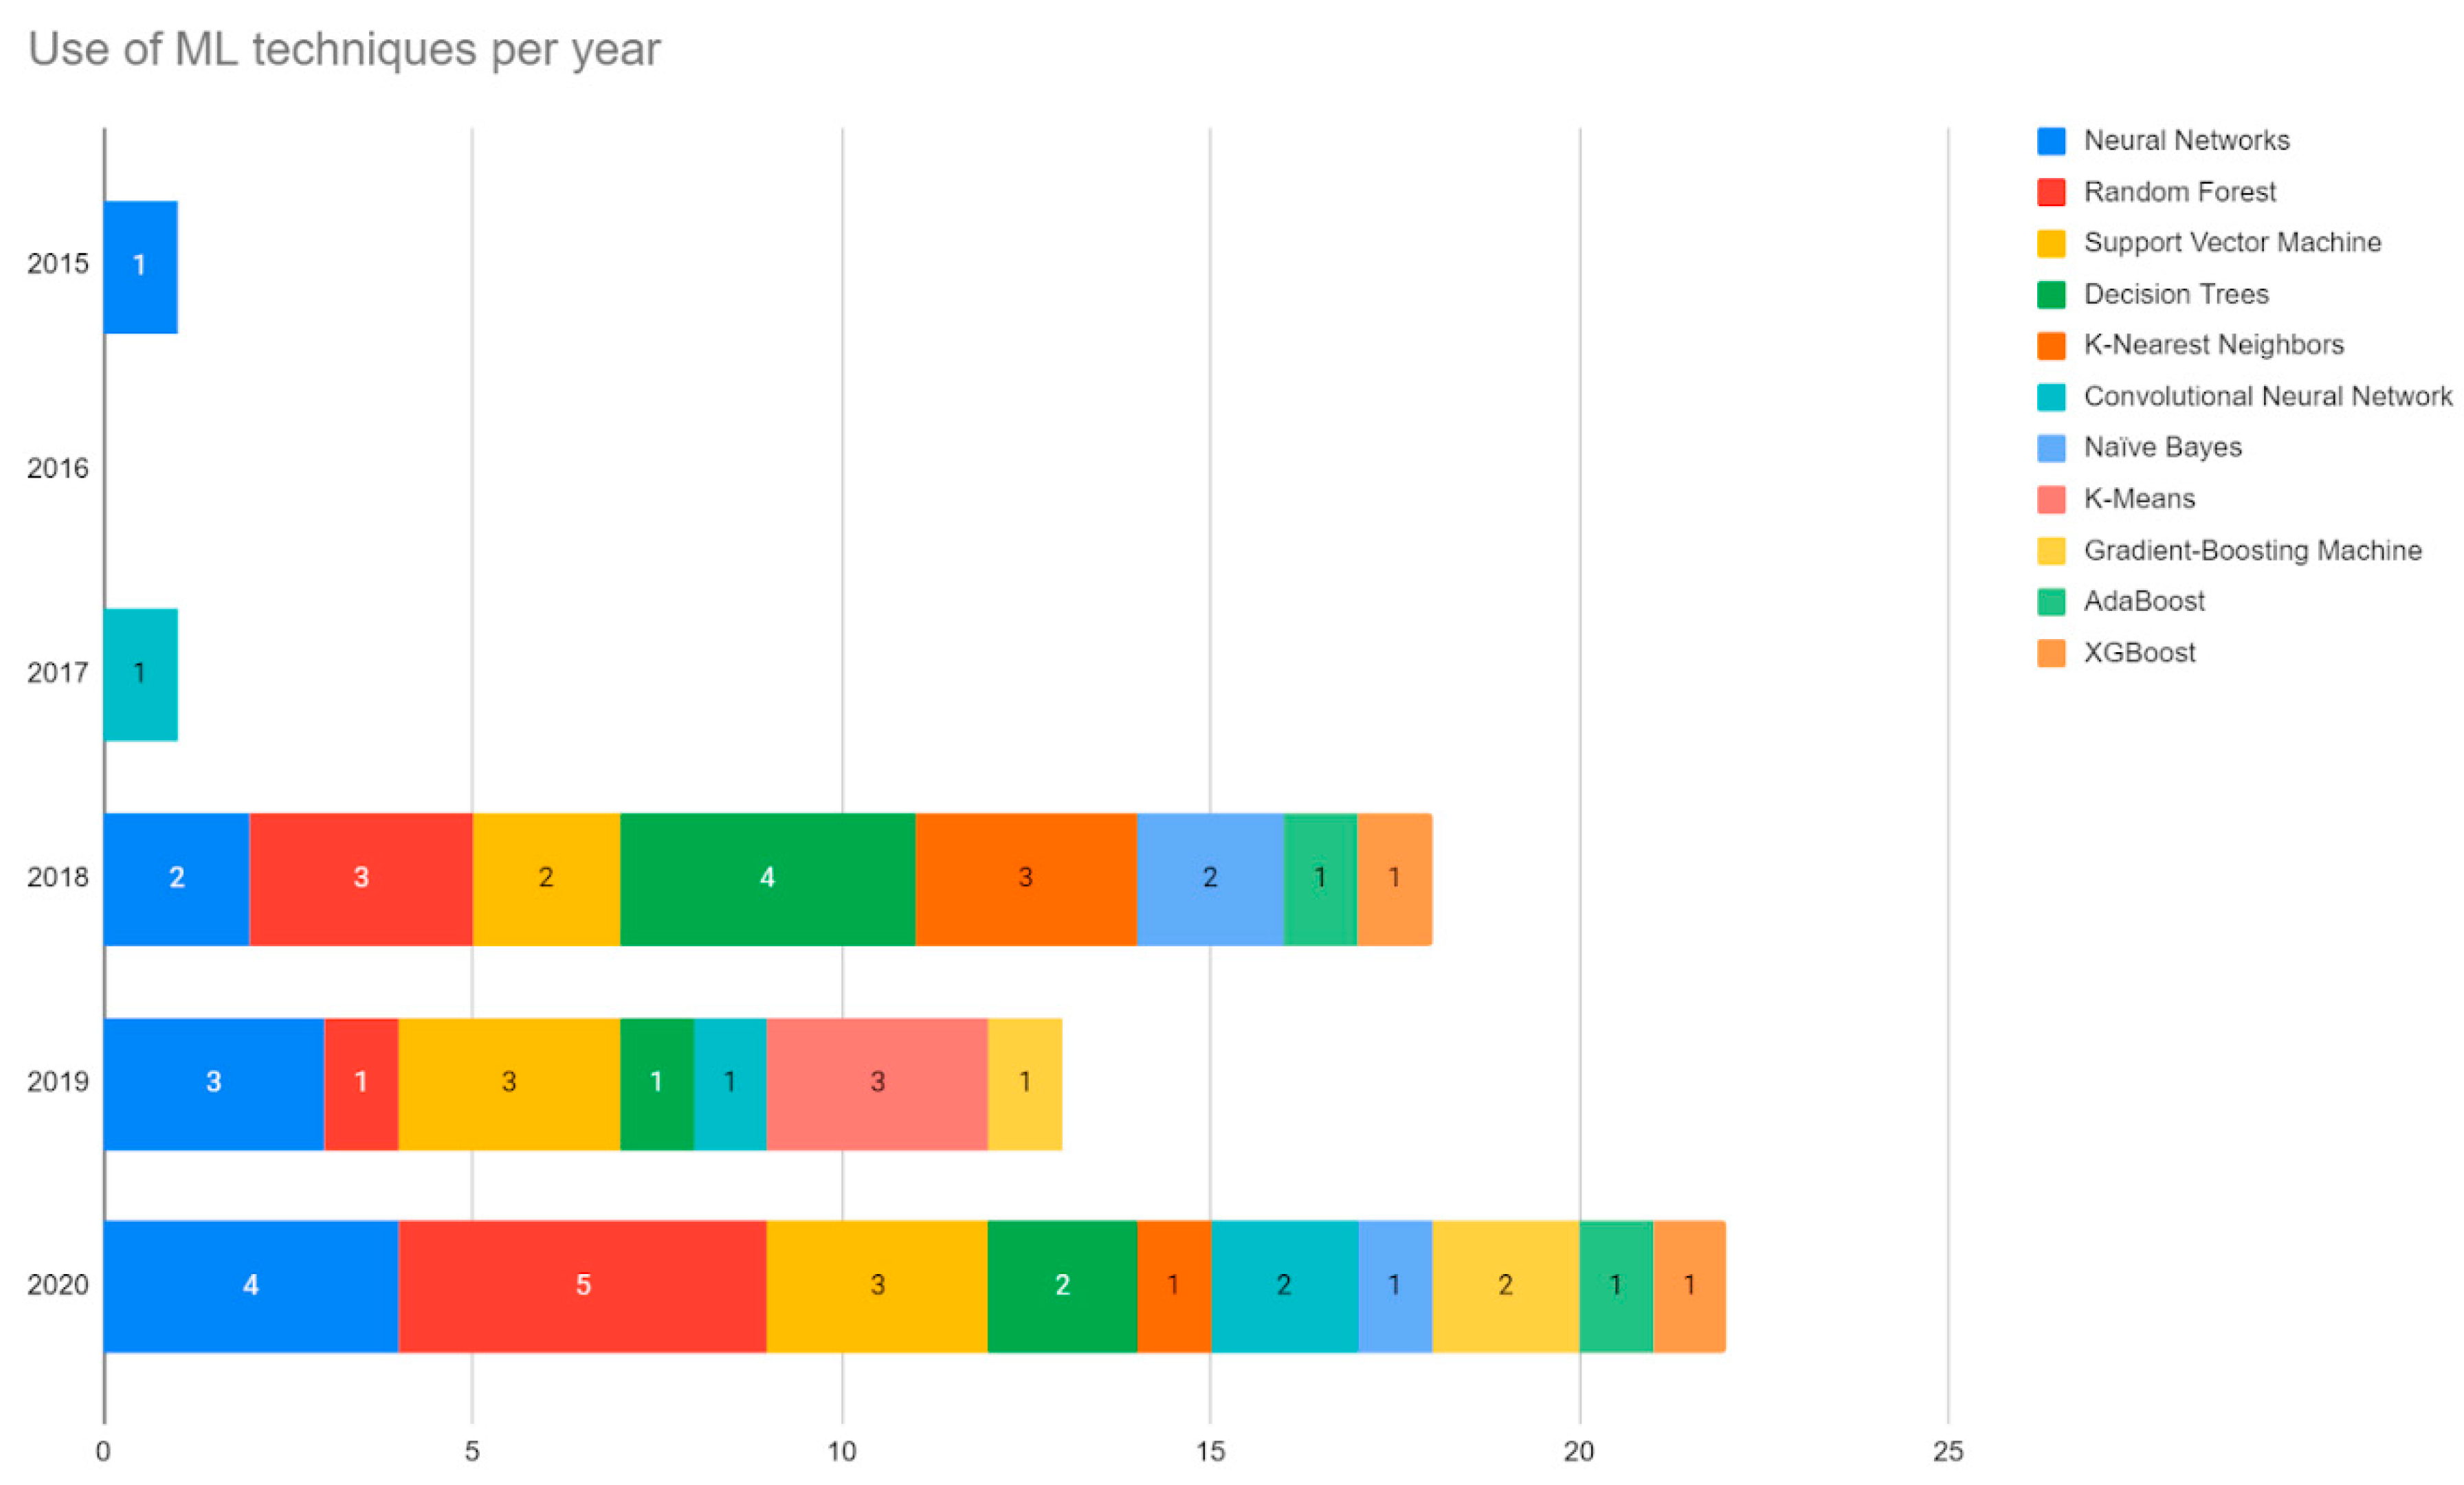
4.2. ML Techniques in Agricultural Big Data

From the analysis of the selected papers, a total of 36 different ML techniques were found to be implemented. The techniques were implemented a total of 80 times as most of the papers used more than one ML technique. The techniques that accumulated the most implementations were NN, RF, SVM, and DT. Figure 12 shows the number of implementations found for each ML technique. The uses and characteristics of the most commonly implemented techniques in agricultural Big Data and ML systems are detailed below.

4.2.1. Neural Networks

Saggi et al. compared NN with the performance of other ML techniques [55]. NN was the technique with the best performance because it overfitted the model and demonstrated tremendous abilities for the estimation of daily crop evapotranspiration.
In Doshi et al., they used NN for the automatic recommendation of crops due to their multilabel classification. The technique performed well in this task with 91% classification accuracy [37]. Shelestov et al. found that the most sensitive parameters for the classification accuracy using NN are the number of hidden neurons and the alpha regression coefficient. The former had a much greater impact on the overall accuracy of the model than the latter [46]. The authors proposed a value of the alpha coefficient with which the best results are obtained and indicated that the number of hidden layers in the model must be selected independently for each particular case.
According to Priya et al., NN are efficient at handling data that have no correlation or linearity among them [44], but they are ineffective for modeling time series which is verified in Balducci et al. where NN was implemented and their performance was assessed in different tasks including the reconstruction of missing data in a time series [40]. In this task, the NN implemented presented a considerable prediction error which as the authors suggested, may be due to the use of few training data for the one-month time series.
In terms of the architecture of NN, they are structures with a single hidden layer [39,58], two hidden layers [40,48,52] and three hidden layers [55]. The activation functions used include sigmoid [48,58], tangent sigmoid [52], and rectified linear unit [55].

4.2.2. Random Forest

According to Priya et al., some RF applications are harvest prediction, crop yield in adverse conditions, identification of climatic variables, and the analysis of agriculture-related issues such as nitrogen emissions or drought prediction [44].
Kaur et al. verified that this technique behaves efficiently in terms of time complexity when analyzing the computational complexity of the algorithm [55]. Doshi et al. (2018) implemented RF in crop recommendation due to the support incorporated for multi-label classification (MLC) and emphasized that this technique is effective when managing missing values, and it is resistant to overfitting of the model [37]. This last feature is one of the reasons RF is implemented in the classification of farmlands in South Asia in Gumma et al. [59].
Shelestov et al. discovered that the maximum depth of each tree and the number of trees in the forest are the most sensitive classifier parameters. Increasing the number of trees improves the accuracy of the prediction; however, it can make the program up to five times slower [46]. Sitokonstantinou et al. used this technique to map rice fields due to the large size of the data set they were working with (satellite images) and due to the ease of the technique to be executed in a distributed manner [57].

4.2.3. Support Vector Machine

In Nóbrega et al., different ML algorithms are compared among which is SVM. SVM detects conditions of an animal related to its position [50]. Of the algorithms analyzed, SVM performed the worst; nevertheless, its results do not differ significantly from the other algorithms, and all had a 95% accuracy. A similar case was observed in Yang et al., where after comparing different ML techniques to predict the growth stage of a plant, SVM was the least accurate technique; however, this was over 90% [60]. In both cases, SVM was not the most suitable technique for the tasks carried out, but it did demonstrate a good level of accuracy.
Shelestov et al. verified that the most sensitive parameters of SVM are gamma, C, and the kernel type used [46]. They took measurements on this last point using the kernel’s radial basis function (RBF) and sigmoid. It was discovered that RBF is the most appropriate for crop classification tasks. Aiken et al. compared different ML techniques for the classification of pairs of farms [58]. Of these, SVM had the best results in accuracy, sensitivity, specificity, and precision. Additionally, it was the technique that required the most runtime, being almost double the others. Nevertheless, the authors concluded that the runtime was not a limiting factor in their study and recommended choosing this algorithm for tasks of the same type.
In Tombe, Fenu and Malloci, and Vasumathi et al., SVM was used to determine the health status of the crops, to predict the severity of late blight in the potato and diseases in fruits, respectively [48,49,61].

4.2.4. Decision Tree

The efficiency of this technique is confirmed in Nóbrega et al. where they compared different ML techniques to classify an animal’s position using an IoT collar [50]. Of the compared techniques, the authors emphasized DT due to the low computer time required to train the model and the ease of its subsequent interpretation. In addition, DT presented one of the best accuracy values and area under the curve (AUC) of the techniques compared.
Another paper that verified the DT’s efficiency was the one by Yang et al. where the prediction of the growth stage of a plant was studied using different ML techniques [60]. In this paper, the authors concluded that the DT was the best algorithm due to the short time consumed and high level of precision.
In Balducci et al., they compared the performance of different ML techniques for the reconstruction of ambiguous or corrupt data captured by IoT sensors with DT resulting in being the technique with the best outcomes in most of the experiments [40]. The authors concluded that the performance of this algorithm drops if few data are used to train the model, and that this is affected differently by the different attributes coming from the sensors.
Doshi et al. compared the DT with other techniques, due to its support incorporated for the MLC, for automatic crop recommendation [37]. According to Priya et al., this technique is not advisable for work with large scattered data sets, since its performance decreases as the data volume increases, and that it does not ideally detect anomalies and manage missing data [44].
Figure 13 presents a map summarizing the number of papers selected by ML techniques vs. problems to be solved. To simplify the figure, we have not considered techniques that were used only once.
Figure 13 shows NN’s most commonly used technique to solve various agricultural problems such as increasing production, reducing costs, increasing quality, and predicting the weather. NNs are an excellent choice when working with Big Data sets because they are easy to adapt. This adaptation reduces errors produced by adjusting the weights and biases of each neuron based on the data used for training [44].
On the other hand, in addition to the problems solved using NN, RF was also used to monitor the crop through satellite images. RF is ideal for working with massive data sets since it needs less time to preprocess the data, is competent in global time complexity, and works well with scattered data sets [44].
SVM was used to solve plant disease control problems to increase yield quality and quantity. SVM is suitable for managing small data sets that do not contain too many outliers, and its performance is increased when the dimensional space of the data is ample, and the attributes are lower [44].
DT has been used to solve the same problems as NN. Several authors emphasize that DT requires little computational time and generates a high level of accuracy [37,40,50]. The DT is efficient in terms of computation and scalability. Moreover, its yield is increased when the same data do not correlate with each other [44].
Although these ML techniques were the most widely used, the trend is for agricultural Big Data to combine several ML techniques. Shelestov et al. compared RF, SVM, and NN techniques [46]. Nobrega et al. used RF, DS, XGBoost, KNN, SVM, and Naïve Bayes techniques [50]. Ferreira et al. used K-means, BC, RPT, bagging of DT, SB, SVM, NN, and LR [58]. Saggi et al. used NN, GLM, RF, and GBM techniques [55]. Priya et al. used a combination of techniques such as DT, RF, BN, ANN, SVM, and Markov [44]. Besides combining these techniques, some of these must be adapted using Big Data systems due to volume, variety, veracity, and velocity characteristics.

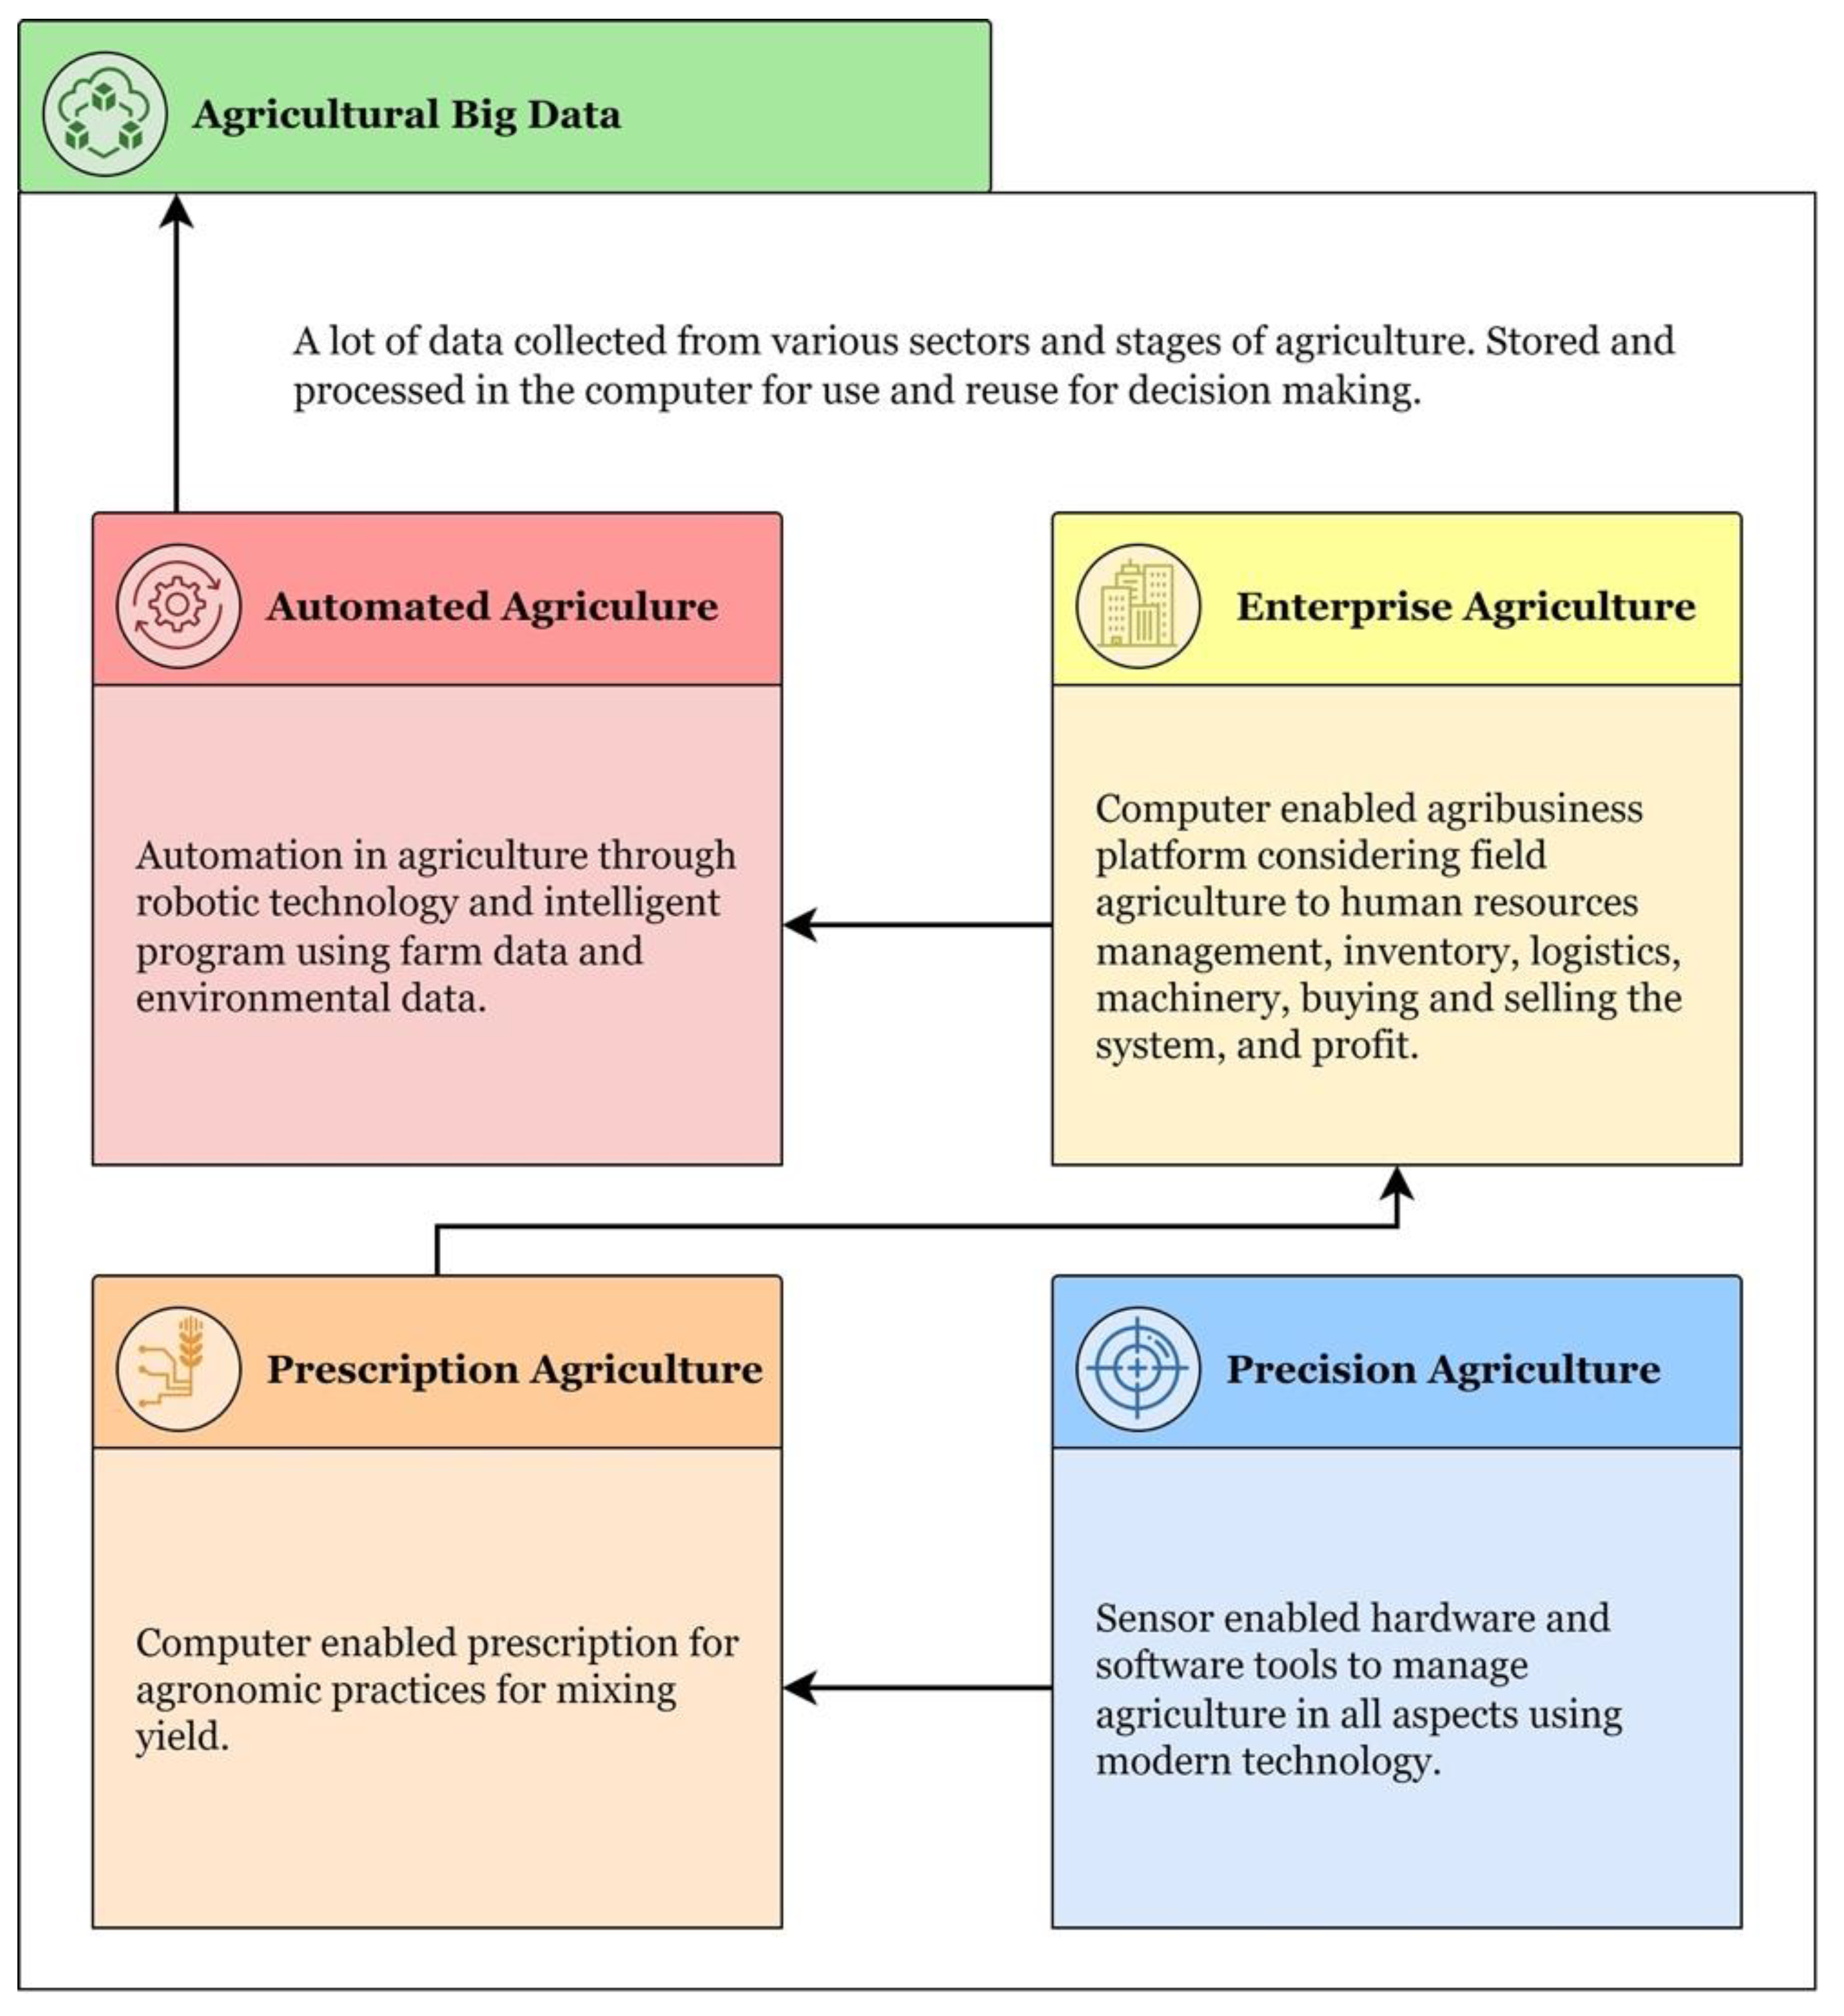
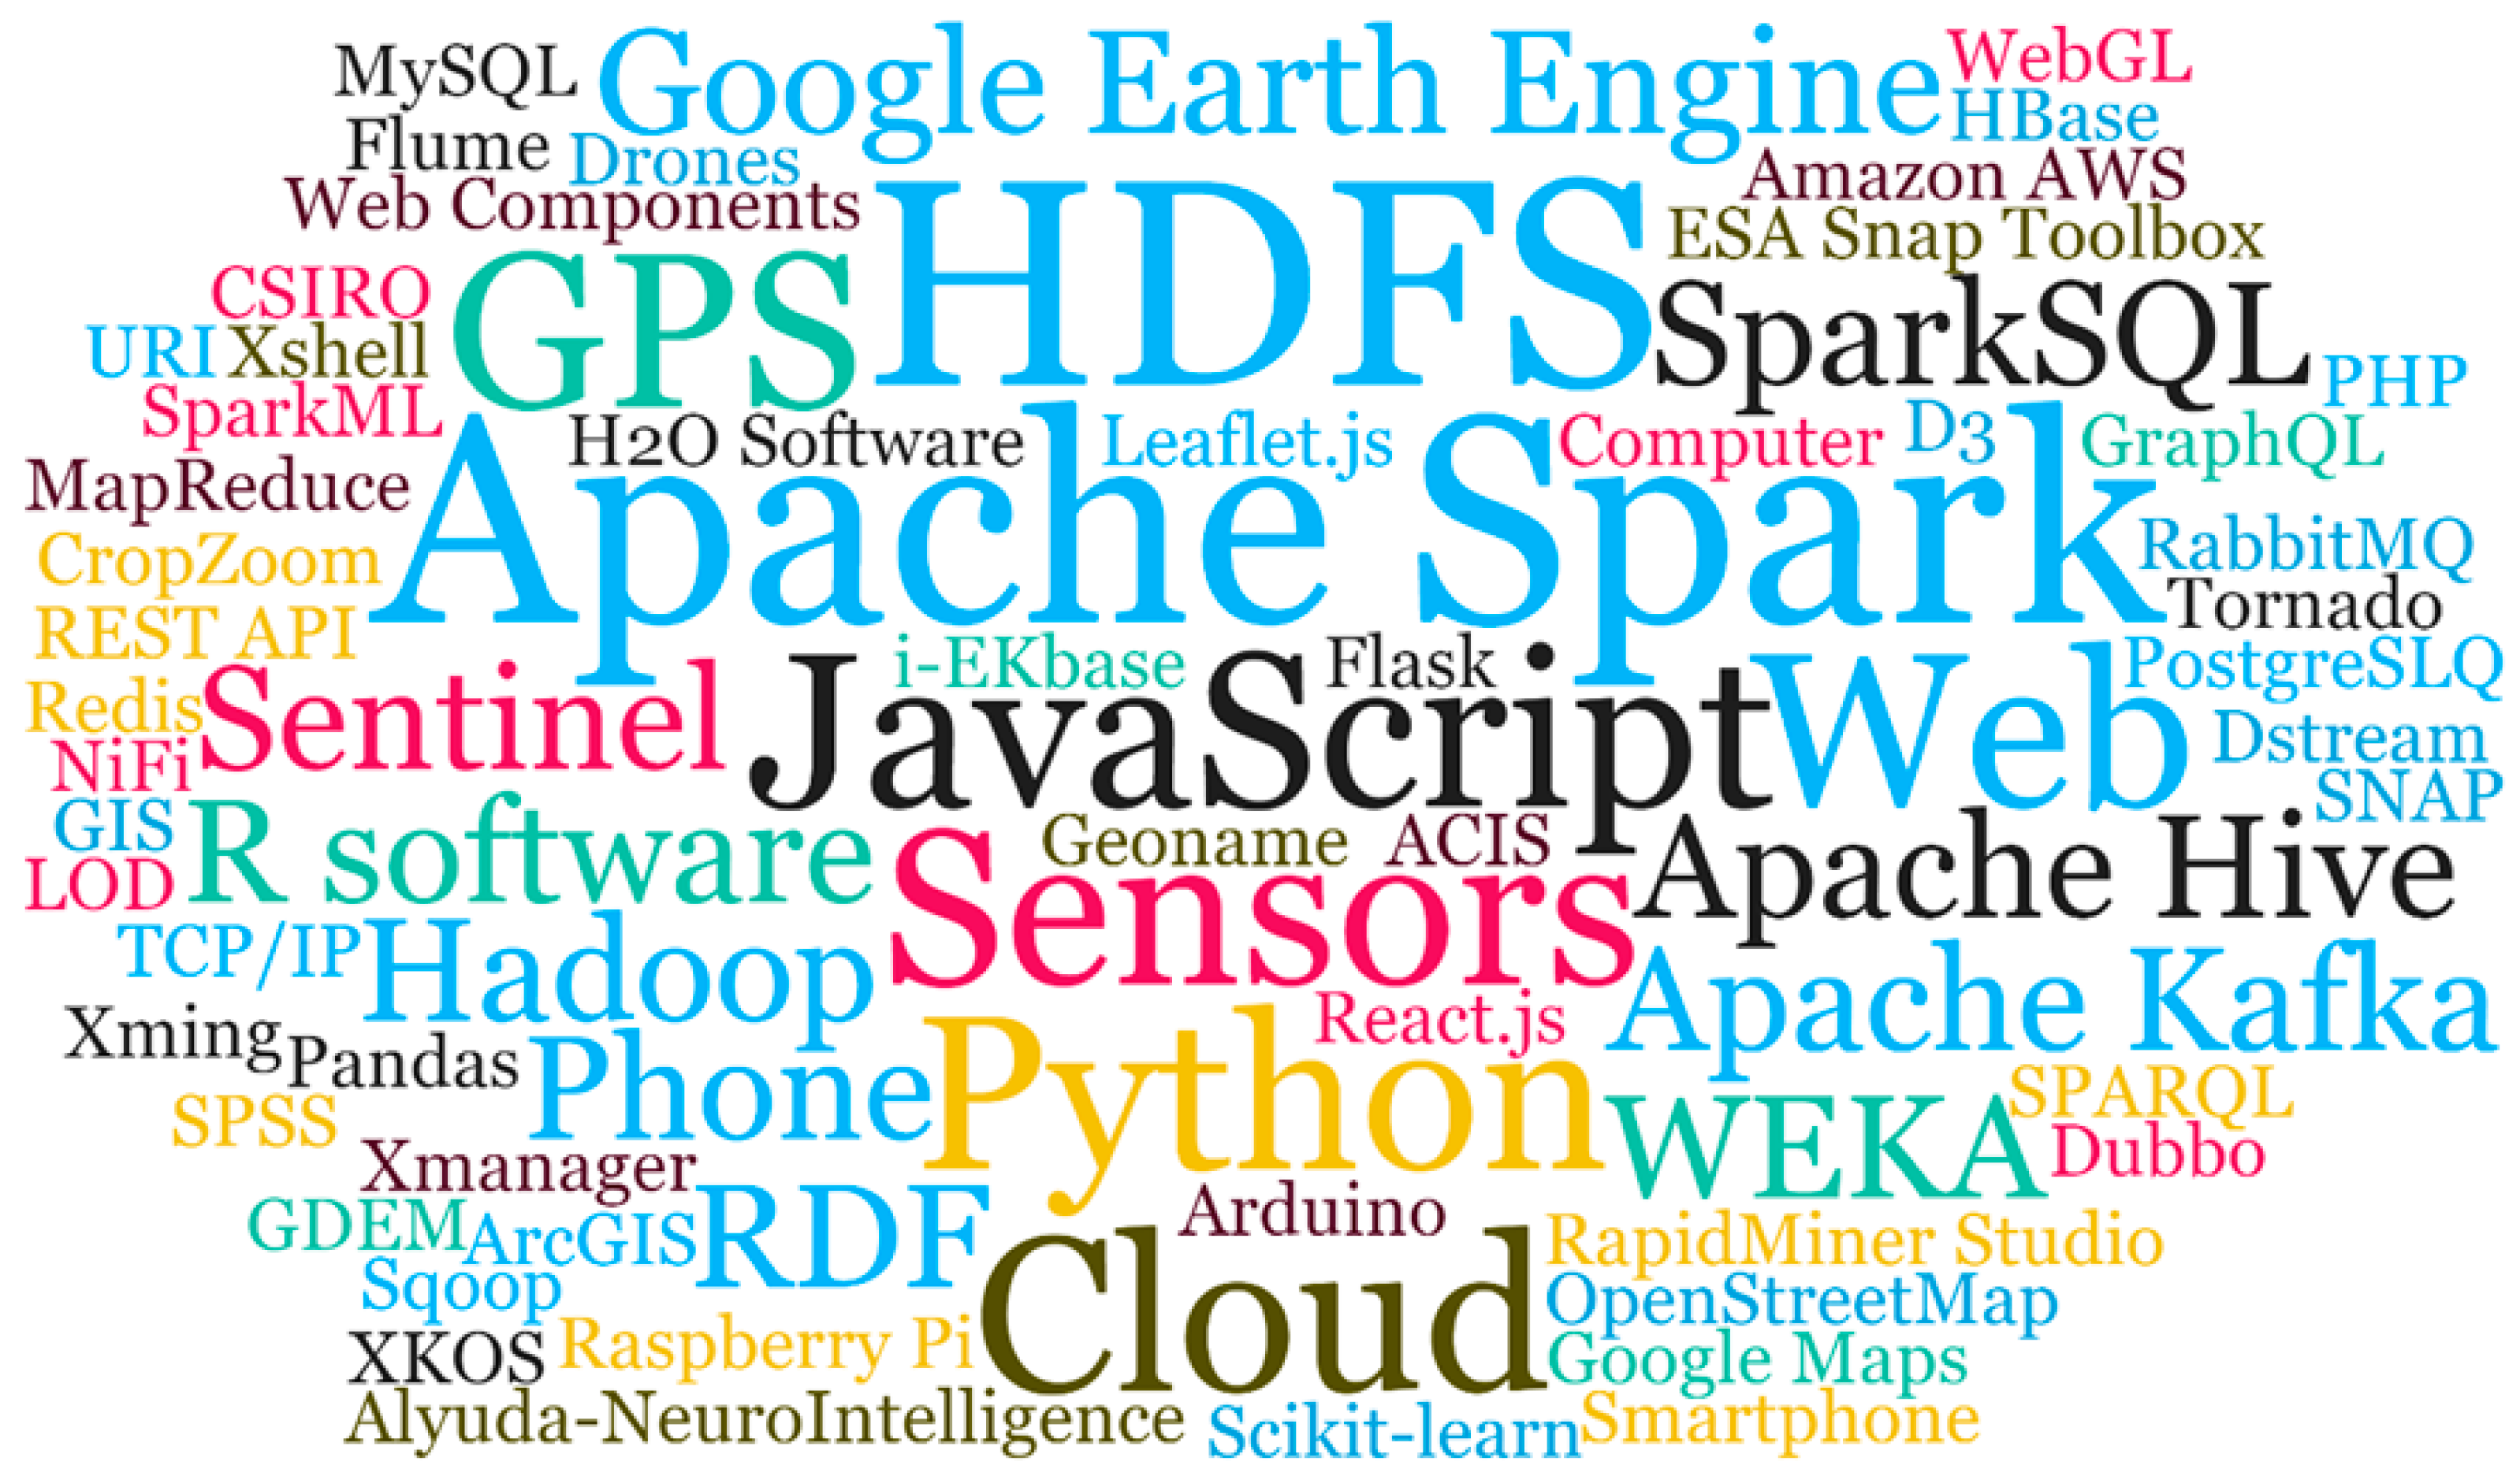
4.3. Agricultural Big Data Technologies

The technologies used to implement Big Data and ML systems in agriculture are presented in Figure 14, a cloud of concepts where the size of each concept is directly related to the number of times it was used in the articles analyzed. Of the 30 articles reviewed, the technology that was identified the most times was Apache Spark, with a total of five times. Seventy-five percent of the technologies identified were used in only one article, and four articles did not detail the use of any technology in the implementation of their systems. The use of the most used technologies is detailed below.
The most common technologies were sensors and satellite imagery for collecting agricultural data. The former was used to take data at the location of interest for crops, animals, weather, or soil properties [44,45,50]. Satellite images were mainly used for monitoring land and crops in large areas [52,57,59]. These were obtained through satellites or services from external providers such as Google Earth Engine (GEE), a global positioning system (GPS), Sentinel satellites, Landsat satellites, or Google Maps.
In implementing Big Data systems, the most used file system was Hadoop Distributed File System (HDFS) because it allows separating data sets, storing them in a distributed way in several nodes of a cluster, and parallelizing operations on them [57]. Most of the implemented clusters were configured with the various programs provided through the Apache Hadoop framework. Among these, the following stood out Apache Hive and Apache Kafka. Apache Hive was used to configure data warehouses that streamline working with large data sets stored in distributed units [62,63]. Apache Kafka was used for the transmission of information or messages to different nodes of the designed Big Data architecture [45,63]. The most widely used technology, Apache Spark framework, was mainly used for processing the collected data [38,41,50,57,62,63].
The technology most often identified in the implementation of ML models is the Python programming language [40,48,59]. Among the articles that use Python to implement the models, most used libraries that facilitate working with the datasets or that implement the models of the ML techniques used in the research. The libraries that were repeated the most are Scikit-Learn [48,53], Pandas [53], and NumPy [40].
Regarding the tools for data visualization, Web technologies such as PHP [64] or Java Scripts stood out. The latter stands out above all together with libraries such as D3 for data visualization [53], Leaflet.js for displaying maps, [37] and React for building interactive user interfaces [53].
In Wang et al., a Big Data system for agriculture is proposed. It is a system with a design based on the collection, storage, analysis, and application of pear tree data [62]. For the collection of tree growth data (air temperature, soil moisture, light intensity, etc.), a high-precision wireless sensor network is used whose collected data are sent via TCP protocol to traditional databases (MySQL, MongoDB, etc.). These databases temporarily store the data and serve as data sources for the overall Big Data system. For this purpose, data synchronization software such as NiFi, Sqoop, or Flume is used, and the data sources are synchronized with the HDFS cluster that is responsible for storing all the data together. SparkSQL is used to read, filter, and store the data from the HDFS cluster to Apache Hive and Apache Hbase. The former is used for data analysis, and the latter is used for data monitoring and visualization of data statistics. Apache Dubbo is used for running farmer management services in a distributed manner. The article did not detail the technologies used to implement ML models.

4.4. Challenges in the Use of ML in Agricultural Big Data

Most of the selected papers explain a series of challenges in the use of ML in the agricultural Big Data system. We describe each challenge according to the intrinsic characteristics of Big Data: volume, variety, velocity, veracity. We also describe the challenges that arise in the analysis process.
Wang et al. explained challenges in the four stages of agricultural Big Data, such as having various data sources, low precision, low performance in real time, long collection cycles, high complexity, diversification, and lack of appropriate data. Three main aspects are discussed here: data cleaning, data consolidation, and persistent storage. These aspects are obtained mainly through Hadoop, Hive, HBase, and Spark [62].
Priya et al. concluded that for the end-users, such as farmers and consumers, to achieve a good result, the data analysis, data summary, and methods of data interoperation must be improved at the same time. Nowadays, a computerized approach to agriculture is required to observe and interpret several dangers and treatments such as crop diseases, floods, and droughts and use the resources available more efficiently [44].

4.4.1. Volume

In Yang et al., a data detection device with sensors and videos is used that communicates with the platform in the cloud with the TCP Socket protocol, loading the data into the cloud in real time [60]. The device transmits data to the platform in the cloud at 3 s intervals. The same authors created a physical division of the table into discrete tables for each day that data are stored to solve the problem of storing a large amount of data in the system. On the other hand, the authors create an analysis service based on Hadoop and a file service implemented using a platform in the cloud. The data kept in the MySQL database are transferred to a specific format to be filed in the HDFS system every day. This should be suitable to execute the data analysis service [60]. In Amani et al. and in Shelestov et al., they use a large amount of satellite data for downloading [46,52]. By implementing the workflow on the platform in the cloud, Shelestov et al. overcome the challenges of downloading and processing Big Data. On the other hand, Gumma et al. also use satellite images in the Big Data system [59]. He notes that due to the classification of large areas, the size of the Landsat data is considerable (reaching petabyte when dealing with a time series), which is why it is challenging to process the data in regular systems [64]. To solve this challenge, they use the computation platform in the GEE cloud for image processing because it has the entire Landsat file and many raster data sets openly available from NASA, the European Space Agency (ESA), and other images that can convey the code to the data. Thus, the complex multi-temporal data on a continental scale can be analyzed using JavaScript or Python and shared and replicated by other researchers, reducing the barriers to using supercomputers to perform geospatial analyses [59].
On the other hand, Sitokonstantinou et al. used satellite images with a resolution of the 10 m time series from which 167 features were extracted [57]. The authors reported that the automated and prompt acquisition of Sentinel images from the available centers becomes a challenge. Sentinel data offers hubs different specifications such as their constant archiving policy, data availability, geographic cover, and acquisition latency. The authors have developed an application to connect to multiple Sentinel hubs and automatically seek pertinent data. This intermediary of Sentinel data recovers the required products from the most efficient center that is chosen in terms of download speed and product availability [57].
In Ferreira et al., a large amount of image data was used to analyze the coincidence of the farms. The authors explained that coincidence is a very challenging task because, generally, the documentation of the attributes of the linked entity (i.e., farm) is highly inconsistent in all the databases because of spelling errors, errors, or missing information, and the infeasibility of manual data mining due to the size of the data set [58]. On the other hand, Ochoa and Guo used input images processed through hierarchical convolution modules to reduce the size and gain many more channels [65]. Three to five convolutional layers were used with each image, followed by a normalization layer in batches. At the end of each module, a grouping layer and an activation layer were obtained. Then, the compressed images were fed into a set of ascending hierarchical sampling modules.
In Abbona et al., a large volume of data was analyzed to predict whether the calves survive 60 days after birth [51]. The authors looked for a possible solution to highlight the young calves’ strengths and find alternatives through variables. The authors indicated that identifying such variables is a complex task, but it has a solution since the amount of data recorded among the cattle is enormous nowadays and manageable through ML techniques.
Amaechi et al. improved climate prediction through a model that uses rules based on the knowledge of experts [54]. The rules have been included in enormous data sets in data pre-processing.

4.4.2. Variety

Dutta et al. created a database of terrain characteristics based on expert knowledge in the domain, which is generally undocumented information [36]. The authors used the knowledge of the domain to offer direction to ML. Domain-guided extraction using ML is called semantic extraction, which is why it produces a base of semantic features. The base of meta-features and the base of semantic features were integrated to form a space of enriched features which was a more significant representation of the heterogeneous data.
Tombe created a crop image characterization scheme that is applied to determine the health status of the crop [49]. Conversely, Rehman et al. used heterogeneous data such as text, web data, and CSV, among others, and from these extracted the information needed to construct a set of agriculture rules to provide recommendations [38]. Sitokonstantinou et al. also used a set of rules based on the farmers’ expert knowledge [57].
Fenu and Malloci implemented a module to load data automatically for each crop, a module to load data manually for each crop (used by the farmers during the monitoring survey), and a module to integrate prognosis models [48]. Ochoa and Guo manually classified data into six classes of land cover: impermeable surfaces, buildings, low vegetation, trees, automobiles, and background [65]. Then, the authors divided the images into square patches of 256 × 256 × 3 with no overlapping, collecting data from 20,102 images. In Vasumathi et al., they collected data to fit the quality of the satellite images to analyze plant growth [61]. They achieved contrast stretching or normalization to perform a noise filtering process then. In this process, the pixels in the image showed different intensity values instead of real values obtained from the image.
Sathiaraj et al. used data from a data set for climatic extreme indices and data from a National Evaluation of the Climate document published in 2014. The collected data are compared daily with a table of climatic thresholds defined to consider the annual frequency of days that exceeded or fell below a certain threshold. This was carried out for each climate measurement site. This threshold-based data set represents the climatic extremes at each site and is a resource of practical application to group sites that experience similar trends and climatic extremes [53].
Ryan et al. used data from the herbicide resistance testing service at Charles Sturt University, New South Wales, Australia, from 2001 to 2015, and data from agricultural surveys applied in several counties registered in the Australian Bureau of Statistics (Australian Bureau of Statistics, 2015) [56]. The first data set consisted of annual samples of ryegrass received for herbicide resistance tests on farms all over southern Australia. The postal codes of the regions determined the locations of the samples.
In Priya et al., the authors indicated data from such factors as climate conditions, soil type and quality, the variety of the crop, and its quality, as well as some of the dangerous conditions of plagues, weeds, and crop diseases [44]. The authors indicate that it is possible to think of agriculture as a significant biological ecosystem, where crops interact with several bodies in the ecosystem. In addition, none of these entities are fixed and vary dynamically; then, for understanding the agricultural ecosystem, it is necessary to understand the various entities [44]. On the other hand, the author noted that the information compiled is accurate and verified by experts; therefore, when the data are used to develop ML algorithms, the algorithm is more reliable and provides transparency for the development. Once again, the hardware for data collection differs from one organization to another, so the collected data can be in different formats, and the results can vary [44]. This is a constant challenge.

4.4.3. Velocity

Of the papers selected, few described challenges due to the speed with which data must be collected or processed and then visualized. MapReduce is a type of technology used in Big Data to gain processing speed with large volumes of data [43]. Vasumathi et al. use the MapReduce algorithm to subdivide the data so that the request is only inspected in the explicit partition, which increases the query’s efficiency and recovery time [61]. In Saggi et al., they used MapReduce in the H2O system to obtain more data fragments than the CPU cores [55].

4.4.4. Veracity

In Tarik and Mohammed, they had to perform a pre-processing of the data because the real data were often incomplete (lost values, simplified data), noisy (errors and exceptions), and inconsistent (names, coding) [39]. These issues caused problems in the implementation of the Big Data system. Conversely, Ferreira et al. reduced the land space as an alternative to reduce the number of comparisons to be assessed among the attributes of pairs of farms. To verify the data, they had to compare several approaches based on the edition, the Levenshtein and Jaro–Winkler metrics, and determinist, stochastic, and ML approaches to classify the pairs of farms as coincident or noncoincident [58]. The authors point out that they store pairs of similar farms, verifying the values of each approach. In Donzia and Kim, the performance of the ML module was improved by using an automatic controller for data stored continuously in HDFS [45].
Ochoa and Guo prepared the training data for the first CNN model, dividing the original aerial images into square patches with a predefined resolution [65]. This division led them to increase the sample of training data. They used techniques to increase data that had to be verified to improve data quality. On the contrary, Vasumathi et al. adjusted the quality of the satellite images to analyze plant growth. The adjustment was due to insufficient quality [61]. They carried out a contrast stretching or normalization process and another process of noise filtering of the pixels with different intensity values to obtain real pixels obtained from the image. In Yahata (2017), they use data from photos of flowering plants to count them and examine their growth [47]. The problem is verifying the data when the flower is very close to another one since the incorrect coincidences must be reduced. The authors use a robot to improve the accuracy of the flower pairing. Sitokonstantinou et al. developed a framework for updating images of the plots to validate the land cover data through ML algorithms. With the validated data, detailed maps of land cover at plot level were created to distinguish between rice crops and other types of crops [57].

4.4.5. Analysis with ML

Dutta et al. investigated how to perform learning, inference, and prediction tasks with linked open data [36]. Experts in the agricultural field and farmers could potentially define the entire space of features needed to optimize the harvest. Often, that could be in a simple format or unstructured knowledge that renders it inaccessible from the system’s point of view. The authors used four rule builders to formulate these relations: fuzzy rule builder, conditional probabilistic rule builder, order logic rule builder, and a threshold-based event rule builder (where the threshold of a few environmental variables was defined directly by the farmers together with an event that led to making an unusual decision). Based on the specific rule of the domain or the relationship structure, an ontology translator was created for automatic reasoning from the dynamic time-series data from the environmental sensors and the networks of sensors. The task of this translator was to convert the knowledge of the domain into a format that could be used in the functional block called “semantic signal translator”. This challenge implies that the system can analyze large volumes of environmental data using ML approaches [36].
Tombe proposed a computer viewing technique for crop image characterization applied to determine the health status of the crop [49]. With these data, a deep convolutional neural network can be used to extract and represent features of the image, and then these features are fed into the support-vector machine for training and subsequent image interpretation. Gumma et al. employed a similar process with crop images to use multiple decision trees to assign classification labels and reduce overfitting; each tree is created from a sub-section of training data [59]. Given that the RF classification is a supervised pixel-based classifier, precise reference data without clouds are needed with high-quality raster input.
Amani et al. used satellite images to analyze the type of crops on the plots. The object-based image analysis could improve crop type classification compared with pixel-based methods. For this, the authors apply the simple non-iterative clustering (SNIC) algorithm to segment the layered mosaic image [52]. SNIC is an improved version of the simple linear iterative clustering (SLIC) segmentation algorithm that benefits from a non-iterative procedure and applies the connectivity rule from the initial stage. From this, it was possible to use algorithms of deep learning ANN for the classifications of crop types.
Shelestov et al. needed to process data and configure computer resources to use state-of-the-art classification approaches. In order to solve these problems, they developed an automated crop classification workflow based on ML techniques [46].
Wang et al. used the decision tree algorithm to analyze pear tree demand. The authors had to predetermine the standard demand for the growth of the pear tree. Each layer of the algorithm is a data comparison process in real time with this standard [62]. The goal is to combine ML with a Big Data platform to quickly extract data features and data values. The results of this layer are presented to the farm administrator via the data application layer.
In Ferreira et al., “farm pairing” was done in a scenario with a large amount of livestock data. They compared the performance of twelve automated pairing methods differently [58]. They used two unsupervised ML approaches, including k-means clustering (KC) and bagged clustering (BC). On the other hand, they used seven supervised ML approaches, including recursive partition trees (RPT), boosted decision trees (BDT), bootstrap classification trees based on BCT, stochastic boosting (SB), support vector machines (SVM), neural networks (NN), and logistic regression (LR). The probabilistic and ML approaches considered the Levenshtein metric and the Jaro–Winkler similarity criteria. The authors concluded that SVM combined with the Levenshtein metric produced the best results of all the approaches, with almost perfect precision, sensitivity, specificity, and very high accuracy.
Saggi et al. implemented a multilayer deep learning model considering multiple hidden layers and a rectified linear active function [55]. The model was trained with stochastic gradient descent using back propagation. On the other hand, Pandya et al. used series prediction methods such as autoregression (AR), autoregressive integrated moving average (ARIMA), and vector autoregression (VAR). These techniques allowed to face the time interval concept in the transmission data, i.e., the transmission properties can change over time [63]. Another challenge was the efficiency of the system to update the ML models based on these algorithms to address the time interval of the concept. The authors proposed a novel framework to address both challenges.
Abbona et al. used a more frequent set of variables that were encapsulated in the models constructed by genetic programming to investigate their zoological meaning in calf production, evaluating the performance of the prediction models [51]. The authors note that the method worked well, implying that the ML horizon must be investigated further and that comparisons with other techniques must be made, even in larger data sets containing more features. Evolutionary algorithms can be applied to zootechnical data, obtaining performance models to learn the available data.
Amaechi and Pham employed a model designed by the authors to improve the convolutional network approach they propose. Compared with the alternative methods tested, the authors achieve a high weather forecast accuracy [54]. Table 4 presents the selected papers and the characteristics of Big Data where they describe challenges. We added a column where they present challenges to carry out the analysis with ML.
Cui and Gao combined agricultural Big Data and DL to accelerate the intelligent transformation of the agricultural production process and promote the transformation of the digital agricultural architecture. The authors developed standard architecture and the sharing of data formats, achieving standardized processing through designing a standard architecture of agricultural Big Data [66].
Despite the adaptations made to solve the challenges due to the data’s volume, variety, velocity, and veracity, there are still no automated technologies for this procedure. In the future, Big Data architectures will be much more flexible, and agricultural data will be available in general repositories containing sufficient metadata for the agricultural Big Data itself to decide which ML technique to use and which adaptation to include. An example of this is the processing of satellite images stored directly in cloud computing repositories, improving the speed and veracity of the data.

5. Discussion

As we have mentioned in this paper, there are several challenges for the proper use of ML in agricultural Big Data. These challenges are due to the intrinsic characteristics of Big Data, which are volume, variety, velocity, and veracity. To provide a visual map of the ML techniques and challenges faced, we propose a framework composed of three main sections considering these aspects in the main components of agricultural Big Data. The first section of the framework presents the main challenges. The second section shows the main ML techniques used and the context or problem to be solved. The last section shows the most used technologies. See details in Figure 15.
In this section, we highlight specific challenges relevant to ML in the context of agricultural Big Data. These challenges are then analyzed from the four Vs dimensions. Then, we provide an overview of how emerging approaches address these challenges. Examples of these challenges are unstructured data formats, data input from multiple sources, “noisy” and poor quality data, data scalability, scalability of algorithms, and unlabeled data, among others.
As shown in Figure 15, the most commonly used ML techniques provide the analyses necessary for predictions, recommendations, situation determination, and automation. These analyses consider techniques such as SVR, NN, RF, DT and Naïve Bayes algorithms. A big challenge is to cope with a large volume of data. The SVM algorithm has an O(n3) training time complexity and space complexity of O(n2), where m is the number of training samples. An increase in the value of m will drastically affect the time and memory required to train this algorithm and may even become computationally infeasible for big-size datasets [67]. Another challenge considers the RF algorithm. This algorithm must be tailored for each specific problem to process the data efficiently [68].
Another challenge is the time needed to perform the computations, as this will increase exponentially with increasing data size and may even make the algorithms unusable for large data sets. Other challenges to consider are class imbalance and bias, which will increase as the volume of data increases, causing problems using these algorithms, and may become unable to generalize adequately to new data. These challenges are very relevant as they are present in the most widely used algorithms. Possible solutions to these challenges are using cross-validation and parameter tuning. Figure 16 presents the number of papers per year that use these algorithms. It is observed that NN, RF, and SVM are the preferred ones for the year 2020. On the other hand, Figure 17 represents the relationship of the challenges between ML, the agriculture industry, and Big Data when it needs to be implemented.
Another challenge to consider is the variety of data sources (images, videos, sensor data, and expert data, among others), as a specific format must be available for the whole data set. This challenge implies that a data, Da, coming from a data source, DSa, must have the same format and representation as other Db data from another data source, DSb. From a technical point of view, it is possible to manage a heterogeneous database with sufficient metadata to understand the origin, type of data, processing, and changes carried out. A recent technology used to manage the heterogeneous database is the data lake [69,70], which allows managing data in different sections: raw data, semi-processed data, and fully processed data. This technology allows data traceability to be maintained at all times, improving data quality. However, none of the selected papers mention the use of this technology.
As far as data processing speed, only two papers mentioned it [55,61]. Both authors explain the use of MapReduce to achieve this goal. This aspect is paramount when Big Data are implemented as a solution to a problem because it is a fact that a large volume of data will be used since the data ingestion process in Big Data is constant [71]. On the other hand, it should be considered that agricultural Big Data is a fully scalable type of system, which makes the data processing complex, potentially slowing down its processing speed. As an example of the above, if we consider a Big Data system that uses data coming only from sensors, we want to add other sources such as images or videos. From the above, new needs, restrictions, and decision making may appear.
MapReduce has been used to increase data processing speed and adapt ML algorithms differently from the traditional one [72]. Besides, it is possible to split the original data set into subsets and then combine the partial solutions. However, data distribution operations can adversely affect unbalanced data sets. Among the effects is the performance when classifying unbalanced data sets, which may even face the problem of a small sample size that can be amplified as the original data are distributed on different machines [68]. According to the same author, another effect is the change in the data set that occurs when the partitions of the training and test set are very different between them. Then, it is necessary to design new techniques that can generate synthetic data that best represent minority class instances when using a MapReduce framework [68].
A common assumption of ML is that algorithms can learn better with more data and, consequently, provide more accurate results. However, massive data sets impose several challenges because traditional algorithms were not designed to meet such requirements. For example, several ML algorithms were designed for smaller data sets assuming that the entire data set can fit in memory [67]. Another assumption is that the whole data set is available for processing at training time. Big Data breaks these assumptions by rendering unusable traditional algorithms or algorithms that primarily affect their performance [67]. The same author mentions the existence of ML adaptations, such as deep and online learning, to overcome the challenges of ML with Big Data [10]. However, we have identified a budding use of such algorithms in the selected papers.
Regarding the technologies used in agricultural Big Data and ML, the most used were Hadoop, HDFS, Apache Spark, and cloud computing. Hadoop is mainly used to batch process the data and, therefore, the data must be stored in a large repository [73]. Cloud computing is a good solution for storage and processing because satellite data are already available [52]. Apache Spark is used when streaming data processing is required, and therefore data reading is constant [63].
In agricultural Big Data, a combination of technologies is required since data from experts, videos, and satellite images will be batch processed. On the other hand, data from social networks and sensors will be processed by streaming. For the case of cloud-based technologies, there are several tools for the use of ML: Microsoft Azure Machine Learning, which is now part of Cortana Intelligence Suite; Google Cloud Machine Learning Platform; Amazon Machine Learning; and IBM Watson Analytics [74]. These services are offered by established providers, offering scalability and integration with other services and platforms.
From our point of view, the most relevant challenge to consider is the design of Big Data architecture since they must be flexible and highly scalable, considering that architecture design is a complex task [25]. Other challenges are understanding the statistical characteristics of the data before applying algorithms and the ability to work with larger data sets [75]. In addition, specific knowledge is required for certain problems in agriculture, such as increased production, quality improvement, and climate change, among others. However, it is essential to note that none of the selected papers includes this last aspect as a problem to be faced. According to L’heureux et al., as data size increases, the performance of algorithms becomes even more dependent on the architecture used [67]. Then, data size increasing makes it necessary to rethink the concept of architecture used to implement and develop algorithms that manage data.

6. Conclusions

This paper presented an SLR using the PRISMA protocol, selecting thirty articles that explain the use of ML in agricultural Big Data. We analyzed these articles from three different points of view. First, we recorded the solutions and challenges to different agricultural problems. Second, we reviewed the main ML techniques used in agricultural Big Data and its main difficulties and challenges. Finally, we recorded the used technologies.
We found 36 ML techniques, considering a total of 80 implementations. Each paper implemented more than one ML technique. NN, RF, SVM, and DT were the most frequently implemented techniques. Despite the positive results described in the papers, the implementation of these algorithms remains a challenge, as there are constant problems due to the increase in data size. These challenges imply adjustments in data classification, the difficult task of calculating the number of training samples, difficulties in the classification of unbalanced datasets, and the efficient application of MapReduce due to the increase in data volume, among other aspects to consider.
The most widely used technologies in agricultural Big Data and ML were Hadoop, HDFS, Apache Spark, and cloud computing. Although these technologies can process a large volume of heterogeneous data with reasonable speed, it is still a challenge to use ML algorithms. According to the nature of the data, some adaptations will be necessary to improve the quality of the analyses. A big challenge is the design of agricultural Big Data architectures since the set of technologies will have to be modified as the volume of data increases.
The future of agricultural Big Data development and the use of ML is promising. This future will increase the development of flexible architectures that consider various alternative ML techniques according to the conditions of the generated data. This increase is possible thanks to the technologies that have been developed and are constantly evolving. On the other hand, cloud computing will increase due to the training of new professionals and the improvement of network speed. Cloud computing and other tools will include more alternative ML techniques, facilitating flexibility.
In terms of ML techniques, the use of DL and other techniques mentioned in Figure 12 that were adapted to specific contexts due to problems with data volume, processing speed, variability, and veracity, will increase. However, these problems can be solved by sorting the data storage through the data lake.

Author Contributions

A.C. contributed to the planning, organization, and direction of the SRL; S.P. contributed to paper writing, formatting and creating figures and tables; S.S. contributed to the methodological support and expert judgement; L.M. contributed to the data analysis and discussion. All authors have read and agreed to the published version of the manuscript.

Funding

This research was funded by Universidad de La Frontera, Vicerrectoría de Investigación y Postgrado and Dr. Samuel Sepúlveda thanks to research project DIUFRO DI20-0060.

Institutional Review Board Statement

Not applicable.

Informed Consent Statement

Not applicable.

Conflicts of Interest

The authors declare no conflict of interest.

References

  1. Hunter, M.C.; Smith, R.G.; Schipanski, M.E.; Atwood, L.W.; Mortensen, D.A. Agriculture in 2050: Recalibrating Targets for Sustainable Intensification. Bioscience 2017, 67, 386–391. [Google Scholar] [CrossRef] [Green Version]
  2. White, E.L.; Thomasson, J.A.; Auvermann, B.; Kitchen, N.R.; Pierson, L.S.; Porter, D.; Baillie, C.; Hamann, H.; Hoogenboom, G.; Janzen, T.; et al. Report from the conference, ‘identifying obstacles to applying Big Data in agriculture’. Precis. Agric. 2021, 22, 306–315. [Google Scholar] [CrossRef]
  3. Bhat, S.A.; Huang, N.F. Big Data and AI Revolution in Precision Agriculture: Survey and Challenges. IEEE Access 2021, 9, 110209–110222. [Google Scholar] [CrossRef]
  4. Maya-Gopal, P.S.; Chintala, B.R. Others Big Data challenges and opportunities in agriculture. Int. J. Agric. Environ. Inf. Syst. 2020, 11, 48–66. [Google Scholar] [CrossRef]
  5. Torky, M.; Hassanein, A.E. Integrating blockchain and the internet of things in precision agriculture: Analysis, opportunities, and challenges. Comput. Electron. Agric. 2020, 178, 105476. [Google Scholar] [CrossRef]
  6. Hongyan, L.; Ziyi, C.; Haitong, W. Research of Agricultural Big Data. E3S Web. Conf. 2020, 214, 1011. [Google Scholar]
  7. Lassoued, R.; Macall, D.M.; Smyth, S.J.; Phillips, P.W.B.; Hesseln, H. Expert Insights on the Impacts of, and Potential for, Agricultural Big Data. Sustainability 2021, 13, 2521. [Google Scholar] [CrossRef]
  8. Tibbetts, J.H. The Frontiers of Artificial Intelligence. Bioscience 2018, 68, 5–10. [Google Scholar] [CrossRef]
  9. Liakos, K.; Busato, P.; Moshou, D.; Pearson, S.; Bochtis, D. Machine Learning in Agriculture: A Review. Sensors 2018, 18, 2674. [Google Scholar] [CrossRef] [Green Version]
  10. Cravero, A.; Sepúlveda, S. Use and Adaptations of Machine Learning in Big Data—Applications in Real Cases in Agriculture. Electronics 2021, 10, 552. [Google Scholar] [CrossRef]
  11. Bilali, H.E.; Allahyari, M.S. Transition towards sustainability in agriculture and food systems: Role of information and communication technologies. Inf. Process. Agric. 2018, 5, 456–464. [Google Scholar] [CrossRef]
  12. Moher, D.; Liberati, A.; Tetzlaff, J.; Altman, D.G.; Group, P. Preferred reporting items for systematic reviews and meta-analyses: The PRISMA statement. PLoS Med. 2009, 6, e1000097. [Google Scholar] [CrossRef] [PubMed] [Green Version]
  13. Cherkassky, V.; Mulier, F. Learning from Data: Concepts, Theory, and Methods; John Wiley & Sons: Hoboken, NJ, USA, 2007. [Google Scholar]
  14. Rudin, C.; Wagstaff, K. Machine learning for science and society. Mach. Learn. 2014, 95, 1–9. [Google Scholar] [CrossRef] [Green Version]
  15. Qiu, J.; Wu, Q.; Ding, G.; Xu, Y.; Feng, S. A survey of machine learning for Big Data processing. EURASIP J. Adv. Signal Process. 2016, 1, 1–16. [Google Scholar]
  16. Benos, L.; Tagarakis, A.C.; Dolias, G.; Berruto, R.; Kateris, D.; Bochtis, D. Machine Learning in Agriculture: A Comprehensive Updated Review. Sensors 2021, 21, 3758. [Google Scholar] [CrossRef]
  17. Fatih, B.A.L.; Kayaalp, F. Review of machine learning and deep learning models in agriculture. Int. Adv. Res. Eng. J. 2021, 5, 309–323. [Google Scholar]
  18. Santos, M.; e Sá, J.; Costa, C.; Galváo, J.; Andrade, C.; Martinho, B.; Lima, F.; Costa, E. A Big Data analytics architecture for industry 4.0. In World Conference on Information Systems and Technologies; Springer: Berlin/Heidelberg, Germany, 2017; pp. 175–184. [Google Scholar]
  19. Sassi, I.; Ouaftouh, S.; Anter, S. Adaptation of Classical Machine Learning Algorithms to Big Data Context: Problems and Challenges. In Proceedings of the 2019 1st International Conference on Smart Systems and Data Science (ICSSD), Rabat, Morocco, 3–4 October 2019; IEEE: Piscataway, NJ, USA, 2019; pp. 1–7. [Google Scholar]
  20. Gupta, D.; Rani, R. A study of Big Data evolution and research challenges. J. Inf. Sci. 2019, 45, 322–340. [Google Scholar] [CrossRef]
  21. Elshawi, R.; Sakr, S.; Talia, D.; Trunfio, P. Big Data Systems Meet Machine Learning Challenges: Towards Big Data Science as a Service. Big Data Res. 2018, 14, 1–11. [Google Scholar] [CrossRef] [Green Version]
  22. Haig, B.D. Big Data Science: A Philosophy of Science Perspective; American Psychological Association: Washington, DC, USA, 2020. [Google Scholar]
  23. De Mauro, A.; Greco, M.; Grimaldi, M. A formal definition of Big Data based on its essential features. Libr. Rev. 2016, 65, 122–135. [Google Scholar] [CrossRef]
  24. Demchenko, Y.; De-Laat, C.; Membrey, P. Defining architecture components of the Big Data Ecosystem. Collab. Technol. Syst. Int. Conf. 2014, 104–112. [Google Scholar]
  25. Salma, C.A.; Tekinerdogan, B.; Athanasiadis, I.N. Chapter 4—Domain-Driven Design of Big Data Systems Based on a Reference Architecture. In Software Architecture for Big Data and the Cloud; Morgan Kaufmann: Burlington, MA, USA, 2017; pp. 49–68. [Google Scholar]
  26. Sowmya, R.; Suneetha, K. Data mining with Big Data. IEEE Trans. Knowl. Data Eng. 2017, 26, 246–250. [Google Scholar]
  27. Song, I.-Y.; Zhu, Y. Big Data and data science: What should we teach? Expert Syst. Wiley Online Libr. 2016, 33, 364–373. [Google Scholar] [CrossRef]
  28. Sarker, M.N.I.; Islam, M.S.; Ali, M.A.; Islam, M.S.; Salam, M.A.; Mahmud, S.H. Promoting digital agriculture through Big Data for sustainable farm management. Int. J. Innov. Appl. Stud. 2019, 25, 1235–1240. [Google Scholar]
  29. Kamilaris, A.; Kartakoullis, A.; Prenafeta-Boldú, F. A review on the practice of Big Data analysis in agriculture. Comput. Electron. Agric. 2017, 143, 23–37. [Google Scholar] [CrossRef]
  30. Wolfert, S.; Ge, L.; Verdouw, C.; Bogaardt, M.-J. Big Data in smart farming—A review. Agric. Syst. 2017, 153, 69–80. [Google Scholar] [CrossRef]
  31. Weersink, A.; Fraser, E.; Pannell, D.; Duncan, E.; Rotz, S. Opportunities and Challenges for Big Data in Agricultural and Environmental Analysis. Annu. Rev. Resour. Econ. 2018, 10, 19–37. [Google Scholar] [CrossRef]
  32. Coble, K.H.; Mishra, A.K.; Ferrell, S.; Griffin, T. Big Data in agriculture: A challenge for the future. Appl. Econ. Perspect. Policy 2018, 40, 79–96. [Google Scholar] [CrossRef] [Green Version]
  33. Misra, N.N.; Dixit, Y.; Al-Mallahi, A.; Bhullar, M.S.; Upadhyay, R.; Martynenko, A. IoT, Big Data and artificial intelligence in agriculture and food industry. IEEE Internet Things J. 2020, 1, 99. [Google Scholar] [CrossRef]
  34. Kitchenham, B.; Charters, S. Guidelines for Performing Systematic Literature Reviews in Software Engineering. Rep. EBSE´07. 2007. Available online: https://www.elsevier.com/__data/promis_misc/525444systematicreviewsguide.pdf (accessed on 1 February 2022).
  35. Petticrew, M.; Roberts, H. Systematic Reviews in the Social Sciences: A Practical Guide; John Wiley & Sons: Hoboken, NJ, USA, 2008. [Google Scholar]
  36. Dutta, R.; Li, C.; Smith, D.; Das, A.; Aryal, J. Big Data Architecture for Environmental Analytics. In International Symposium on Environmental Software Systems; Springer: Berlin/Heidelberg, Germany, 2015; pp. 578–588. [Google Scholar]
  37. Doshi, Z.; Nadkarni, S.; Agrawal, R.; Shah, N. AgroConsultant: Intelligent Crop Recommendation System Using Machine Learning Algorithms. In Proceedings of the 2018 Fourth International Conference on Computing Communication Control and Automation (ICCUBEA), Pune, India, 16–18 August 2018; IEEE: Piscataway, NJ, USA, 2018; pp. 1–6. [Google Scholar]
  38. Rehman, A.; Liu, J.; Keqiu, L.; Mateen, A.; Yasin, M.Q. Machine learning prediction analysis using IoT for smart farming. Int. J. Emerg. Trends Eng. Res. 2020, 8, 6482–6487. [Google Scholar]
  39. Hajji, O.J.T. Mohammed Big Data Analytics and Artificial Intelligence Serving Agriculture. In Advanced Intelligent Systems for Sustainable Development (AI2SD’2019); Ezziyyani, M., Ed.; Springer International Publishing: Berlin/Heidelberg, Germany, 2020; pp. 57–65. [Google Scholar]
  40. Balducci, F.; Impedovo, D.; Pirlo, G. Machine learning applications on agricultural datasets for smart farm enhancement. Machines 2018, 6, 38. [Google Scholar] [CrossRef] [Green Version]
  41. Choudhary, N.K.; Chukkapalli, S.S.L.; Mittal, S.; Gupta, M.; Abdelsalam, M.; Joshi, A. YieldPredict: A Crop Yield Prediction Framework for Smart Farms. In Proceedings of the 2020 IEEE International Conference on Big Data (Big Data), Atlanta, GA, USA, 10–13 December 2020; pp. 2340–2349. [Google Scholar]
  42. Gnanasankaran, N.; Ramaraj, E. The effective yield of paddy crop in Sivaganga district—An initiative for smart farming. Int. J. Sci. Technol. Res. 2020, 9, 6452–6455. [Google Scholar]
  43. Priya, R.; Ramesh, D.; Khosla, E. Crop Prediction on the Region Belts of India: A Naïve Bayes MapReduce Precision Agricultural Model. In Proceedings of the 2018 International Conference on Advances in Computing, Communications and Informatics (ICACCI), Bangalore, India, 19–22 September 2018; IEEE: Piscataway, NJ, USA, 2018; pp. 99–104. [Google Scholar]
  44. Priya, R.; Ramesh, D. ML based sustainable precision agriculture: A future generation perspective. Sustain. Comput. Inform. Syst. 2020, 28, 100439. [Google Scholar] [CrossRef]
  45. Donzia, S.K.Y.; Kim, H. Architecture Design of a Smart Farm System Based on Big Data Appliance Machine Learning. In Proceedings of the 2020 20th International Conference on Computational Science and Its Applications (ICCSA), Cagliari, Italy, 1–4 July 2020; pp. 45–52. [Google Scholar]
  46. Shelestov, A.; Lavreniuk, M.; Vasiliev, V.; Shumilo, L.; Kolotii, A.; Yailymov, B.; Kussul, N.; Yailymova, H. Cloud Approach to Automated Crop Classification Using Sentinel-1 Imagery. IEEE Trans. Big Data 2020, 6, 572–582. [Google Scholar] [CrossRef]
  47. Yahata, S.; Onishi, T.; Yamaguchi, K.; Ozawa, S.; Kitazono, J.; Ohkawa, T.; Yoshida, T.; Murakami, N.; Tsuji, H. A hybrid machine learning approach to automatic plant phenotyping for smart agriculture. In Proceedings of the 2017 International Joint Conference on Neural Networks (IJCNN), Anchorage, AK, USA, 14–19 May 2017; pp. 1787–1793. [Google Scholar]
  48. Fenu, G.; Malloci, F.M. An Application of Machine Learning Technique in Forecasting Crop Disease. In Proceedings of the 2019 the 3rd International Conference on Big Data Research, Paris, France, 20–22 November 2019. [Google Scholar]
  49. Tombe, R. Computer Vision for Smart Farming and Sustainable Agriculture. In Proceedings of the 2020 IST-Africa Conference (IST-Africa), Kampala, Uganda, 18–22 May 2020; IEEE: Piscataway, NJ, USA, 2020. [Google Scholar]
  50. Nóbrega, L.; Tavares, A.; Cardoso, A.; Gonzalves, P. Animal monitoring based on IoT technologies. In Proceedings of the 2018 IoT Vertical and Topical Summit on Agriculture—Tuscany (IOT Tuscany), Tuscany, Italy, 8–9 May 2018; IEEE: Piscataway, NJ, USA, 2018; pp. 1–5. [Google Scholar]
  51. Abbona, F.; Vanneschi, L.; Bona, M.; Giacobini, M. Towards modelling beef cattle management with Genetic Programming. Livest. Sci. 2020, 241, 104205. [Google Scholar] [CrossRef]
  52. Amani, M.; Kakooei, M.; Moghimi, A.; Ghorbanian, A.; Ranjgar, B.; Mahdavi, S.; Davidson, A.; Fisette, T.; Rollin, P.; Brisco, B.; et al. Application of Google Earth Engine Cloud Computing Platform, Sentinel Imagery, and Neural Networks for Crop Mapping in Canada. Remote Sens. 2020, 12, 3561. [Google Scholar] [CrossRef]
  53. Sathiaraj, D.; Huang, X.; Chen, J. Predicting climate types for the Continental United States using unsupervised clustering techniques. Environmetrics 2019, 30, e2524. [Google Scholar] [CrossRef]
  54. Amaechi, E.S.; Pham, H. Van Enhancement of Convolutional Neural Networks Classifier Performance in the Classification of IoT Big Data. In Proceedings of the 4th International Conference on Machine Learning and Soft Computing, Haiphong, Vietnam, 17–19 January 2020; Association for Computing Machinery: Haiphong, Vietnam, 2020; pp. 25–29. [Google Scholar]
  55. Saggi, M.K.; Jain, S. Reference evapotranspiration estimation and modeling of the Punjab Northern India using deep learning. Comput. Electron. Agric. 2019, 156, 387–398. [Google Scholar] [CrossRef]
  56. Ip, R.H.; Ang, L.M.; Seng, K.P.; Broster, J.C.; Pratley, J.E. Big Data and machine learning for crop protection. Comput. Electron. Agric. 2018, 151, 376–383. [Google Scholar] [CrossRef]
  57. Sitokonstantinou, V.; Drivas, T.; Koukos, A.; Papoutsis, I.; Kontoes, C. Scalable Distributed Random Forest Classification for Paddy Rice Mapping. 2020. Available online: https://zenodo.org/record/3662151 (accessed on 1 February 2022).
  58. Aiken, V.C.F.; Dórea, J.R.R.; Acedo, J.S.; de Sousa, F.G.; Dias, F.G.; de Magalhães Rosa, G.J. Record linkage for farm-level data analytics: Comparison of deterministic, stochastic and machine learning methods. Comput. Electron. Agric. 2019, 163, 104857. [Google Scholar] [CrossRef]
  59. Gumma, M.K.; Thenkabail, P.; Teluguntla, P.; Oliphant, A.; Xiong, J.; Giri, C.; Pyla, V.; Dixit, S.; Whitbread, A. Agricultural cropland extent and areas of South Asia derived using Landsat satellite 30-m time-series big-data using random forest machine learning algorithms on the Google Earth Engine cloud. GISci. Remote Sens. 2020, 57, 302–322. [Google Scholar] [CrossRef] [Green Version]
  60. Yang, J.; Liu, M.; Lu, J.; Miao, Y.; Hossain, M.A.; Alhamid, M.F. Botanical internet of things: Toward smart indoor farming by connecting people, plant, data and clouds. Mob. Netw. Appl. 2018, 23, 188–202. [Google Scholar] [CrossRef]
  61. Vasumathi, M.T.; Kamarasan, M. Fruit disease prediction using machine learning over Big Data. Int. J. Recent Technol. Eng. 2019, 7, 556–559. [Google Scholar]
  62. Wang, X.; Yang, K.; Liu, T. The Implementation of a Practical Agricultural Big Data System. In Proceedings of the 2019 IEEE 5th International Conference on Computer and Communications (ICCC), Chengdu, China, 6–9 December 2019; pp. 1955–1959. [Google Scholar]
  63. Pandya, A.; Odunsi, O.; Liu, C.; Cuzzocrea, A.; Wang, J. Adaptive and Efficient Streaming Time Series Forecasting with Lambda Architecture and Spark. In Proceedings of the 2020 IEEE International Conference on Big Data (Big Data), Atlanta, GA, USA, 10–13 December 2020; pp. 5182–5190. [Google Scholar]
  64. Zhou, L.; Pan, S.; Wang, J.; Vasilakos, A. Machine learning on Big Data: Opportunities and challenges. Neurocomputing 2017, 237, 350–361. [Google Scholar] [CrossRef] [Green Version]
  65. Ochoa, K.S.; Guo, Z. A framework for the management of agricultural resources with automated aerial imagery detection. Comput. Electron. Agric. 2019, 162, 53–69. [Google Scholar] [CrossRef]
  66. Cui, X.; Gao, Z. A Standard Architecture of Agricultural Big Data for Deep Learning. In Proceedings of the 2020 IEEE International Conference on Advances in Electrical Engineering and Computer Applications (AEECA), Dalian, China, 25–27 August 2020; pp. 908–911. [Google Scholar]
  67. L’heureux, A.; Grolinger, K.; Elyamany, H.; Capretz, M. Machine learning with Big Data: Challenges and approaches. IEEE Access 2017, 5, 7776–7797. [Google Scholar] [CrossRef]
  68. del Río, S.; López, V.; Benítez, J.M.; Herrera, F. On the use of MapReduce for imbalanced Big Data using Random Forest. Inf. Sci. 2014, 285, 112–137. [Google Scholar] [CrossRef]
  69. Wibowo, M.; Sulaiman, S.; Shamsuddin, S.M. Machine Learning in Data Lake for Combining Data Silos. In Proceedings of the International Conference on Data Mining and Big Data, Fukuoka, Japan, 27 July–1 August 2017; Springer: Berlin/Heidelberg, Germany, 2017; pp. 294–306. [Google Scholar]
  70. LaPlante, A.; Sharma, B. Architecting Data Lakes Data Management Architectures for Advanced Business Use Cases; O’Reilly Media Inc.: Sevastopol, CA, USA, 2016. [Google Scholar]
  71. Khine, P.P.; Wang, Z.S. Data lake: A new ideology in Big Data era. In Proceedings of the InITM Web of Conferences 2018, Wuhan, China, 15–17 December 2017; EDP Science: Ulys, France, 2018; Volume 17, p. 03025. [Google Scholar] [CrossRef]
  72. Grolinger, K.; Hayes, M.; Higashino, W.A.; L’Heureux, A.; Allison, D.; Capretz, M. Challenges for MapReduce in Big Data. In Proceedings of the 2014 IEEE World Congress on Services, Anchorage, AK, USA, 27 June–2 July 2014; pp. 182–189. [Google Scholar]
  73. Loaiza, J.; Carmona, M.; Giuliani, G.; Fiameni, G. Big-Data in Climate Change Models—A Novel Approach with Hadoop MapReduce. In Proceedings of the 2017 International Conference on High Performance Computing & Simulation (HPCS), Genoa, Italy, 17–21 July 2017; IEEE: Piscataway, NJ, USA, 2017; pp. 45–50. [Google Scholar]
  74. Yang, C.; Huang, Q.; Li, Z.; Liu, K.; Hu, F. Big Data and cloud computing: Innovation opportunities and challenges. Int. J. Digit. Earth 2017, 10, 13–53. [Google Scholar] [CrossRef] [Green Version]
  75. Sukumar, S.R. Machine Learning in the Big Data Era: Are We There Yet? In Proceedings of the ACM Knowledge Discovery and Data Mining: Workshop on Data Science for Social Good, New York, NY, USA, 24–17 August 2014. [Google Scholar]
Figure 1. Relationship between AI, ML, and DL.
Agronomy 12 00748 g001
Figure 2. Use of ML in agriculture, modified from the reference [16].
Agronomy 12 00748 g002
Figure 3. ML techniques used in agriculture [9].
Agronomy 12 00748 g003
Figure 4. ML models giving the best output [16].
Agronomy 12 00748 g004
Figure 5. General architecture of Big Data.
Agronomy 12 00748 g005
Figure 6. Agricultural Big Data evolution, modified from the reference [28].
Agronomy 12 00748 g006
Figure 7. Flowchart of the literature selection process.
Agronomy 12 00748 g007
Figure 8. Yearly distribution of the included articles.
Agronomy 12 00748 g008
Figure 9. Number of solutions in agricultural Big Data and ML by industry.
Agronomy 12 00748 g009
Figure 10. Problems to be solved through agricultural Big Data and ML.
Agronomy 12 00748 g010
Figure 11. Main problems to be solved vs. agriculture.
Agronomy 12 00748 g011
Figure 12. ML techniques used in agricultural Big Data.
Agronomy 12 00748 g012
Figure 13. ML Main problems to be solved vs. ML techniques.
Agronomy 12 00748 g013
Figure 14. Main technologies used in agricultural Big Data and ML.
Agronomy 12 00748 g014
Figure 15. Framework—main ML challenges in agricultural Big Data.
Agronomy 12 00748 g015
Figure 16. Main ML techniques used in agricultural Big Data.
Agronomy 12 00748 g016
Figure 17. Relationship of the challenges between ML, the agriculture industry, and Big Data.
Agronomy 12 00748 g017
Table 1. Abbreviations for ML techniques and learning algorithms.
AbbreviationMeaning
DLDeep learning
ANNArtificial neural networks
SVMSupport vector machines
DTDecision trees
NNNeural networks
RFRandom forest
CNNConvolutional neural networks
RNNRecurrent neural networks
RBNRestricted Boltzmann machine
DBNDeep belief network
SNICSimple non-iterative clustering
SLICSimple linear iterative clustering
KCK-means clustering
BCBagged clustering
RPTRecursive partition trees
BDTBooster decision trees
BCTBootstrap classification trees
SBStochastic boosting
LRLogistic regression
ARAutoregression
ARIMAAutoregressive integrated moving average
VARVector autoregression
KNNK-nearest neighbors
GLMGeneralized linear model
GBMGradient-boosting machine
Table 2. General abbreviations.
AbbreviationMeaning
PRISMAPreferred Reporting Items for Systematic Reviews and Meta-Analyses
IoTInternet of things
MLMachine learning
SLRSystematic literature review
DLDeep learning
AIArtificial intelligence
UAVUnmanned aerial vehicle
ICTInformation and communications technology
NDVINormalized difference vegetation index
ACMAssociation for Computing Machinery
IEEEInstitute of Electrical and Electronics Engineers
MDPIMultidisciplinary Digital Publishing Institute
WoSWeb of Science
BDMBig Data application machine learning-based smart farm system
AAFCAgriculture and Agri-Food Canada
ET0Reference evapotranspiration
MLCMulti-label classification
RBFRadial basis function
AUCArea under curve
GEEGoogle Earth Engine
GPSGlobal Positioning System
HDFSHadoop Distributed File System
TCPTransmission Control Protocol
NASANational Aeronautics and Space Administration
ESAEuropean Space Agency
CSVComma-separated values
CPUCentral processing unit
GISGeographic information systems
Table 3. Main ML techniques.
Classification TypeSupervised LearningUnsupervised LearningReinforcement Learning
Data processing tasksEstimation
Classification
Regression
Clustering
Prediction
Decision making
Learning algorithmsSupport vector machine
Bayesian networks
Neural networks
Naïve Bayes
Hidden Markov model
Dirichlet process mixture model
X-means
K-means
Gaussian mixture model
TD-learning
Sarsa learning
Q-learning
R-learning
Table 4. Challenges in agricultural Big Data and ML.
AuthorsVolumeVarietyVelocityVeracityAnalysis with ML
Dutta et al. [36] x x
Balducci et al. [40] x
Tombe [49] x x
Priya et al. [43] x
Doshi et al. [37] x
Shelestov et al. [46]x x
Nóbrega et al. [50] x
Amani et al. [52]x xx
Rehman et al. [38] x x
Gumma et al. [59] xx
Gnanasankaran and Ramaraj [42]
Tarik and Mohammed [39] x
Wang et al. [62]xxxxx
Fenu and Malloci [48] x
Aiken et al. [58]x xx
Ochoa and Guo [65]xx x
Sathiaraj et al. [53] x
Vasumathi et al. [61] xxx
Saggi et al. [55] x x
Ryan et al. [56] x
Yang et al. [60]x
Yahata et al. [47] x
Pandya et al. [63] x
Priya et al. [44] x
Abbona et al. [51]x x
Sitokonstantinou et al. [57] x xx
Donzia and Kim [45] x
Choudhary et al. [41] x
Amaechi and Pham [54]xx x
Cui and Gao [66]xx
Publisher’s Note: MDPI stays neutral with regard to jurisdictional claims in published maps and institutional affiliations.

