
Three-Dimensional Reconstruction of Soybean Canopy Based on Multivision Technology for Calculation of Phenotypic Traits


Abstract
:
1. Introduction
2. Soybean Canopy Image Acquisition
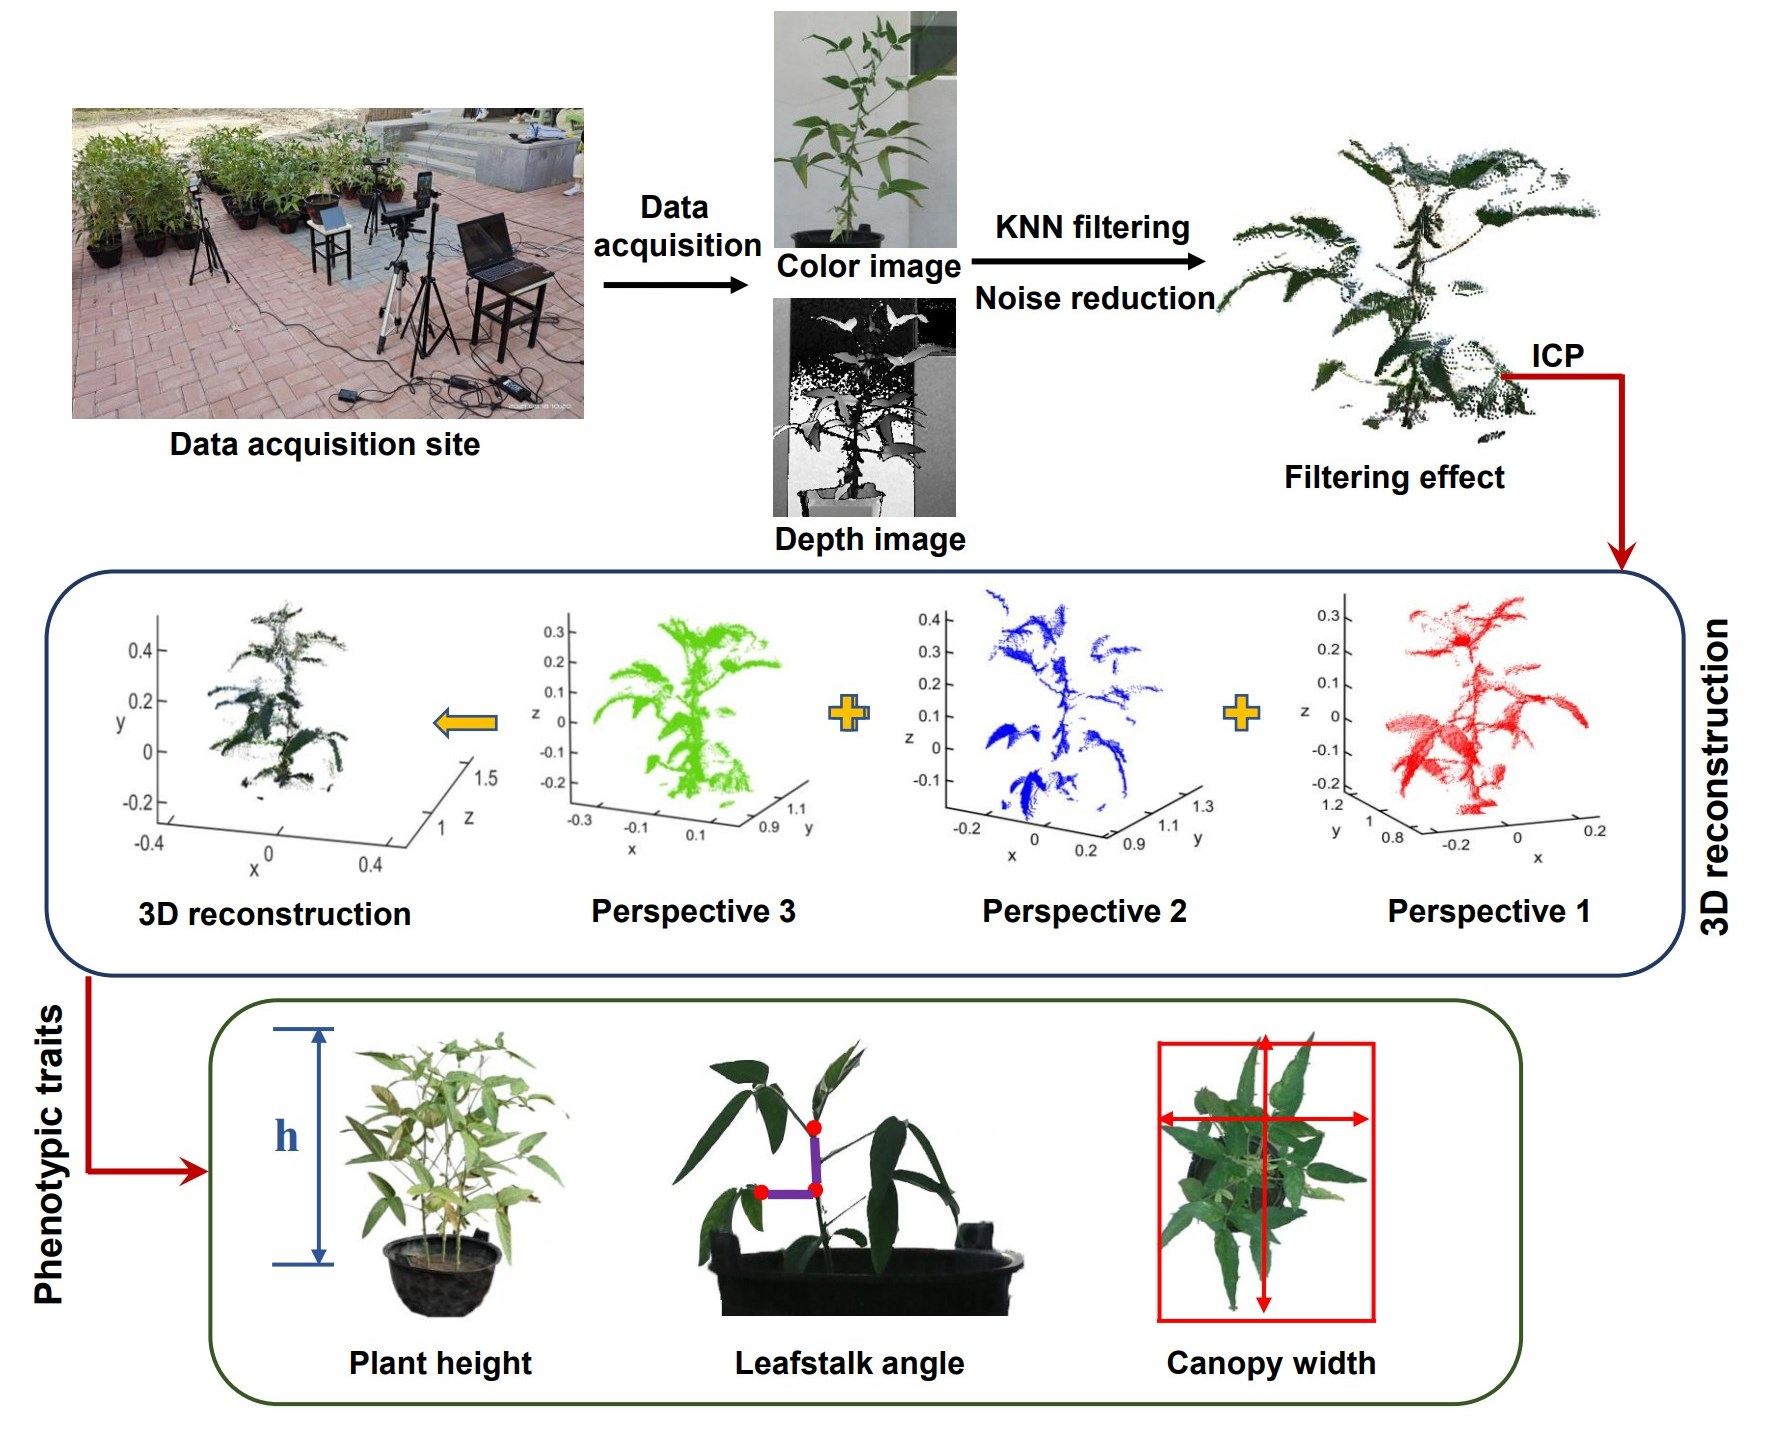
3. Overall Framework for 3D Reconstruction of Soybean Canopy and Calculation of Phenotypic Traits
4. Preprocessing of Point Cloud
4.1. Point Cloud Filtering and Noise Reduction
- Read in the 3D coordinate values of the point cloud, establish a K-dimensional tree, form topological relationships between points, organize and manage point cloud data and then find nearest neighbor points for each point, storing the nearest neighbor distance [24].
- Extract the nearest neighbors of each point on the point cloud on the basis of the K-dimensional tree structure.
- Use Equation (1) to calculate the distance between each point on the point cloud and its nearest neighbors, and then calculate the sum of these distances, as shown in Equation (2):
- Calculate the average, , of the distances, as shown in Equation (3):
- If the distance of the nearest neighbors of a point is greater than a certain threshold , determine it to be an anomaly or a noisy point [25]. In this study, the threshold was chosen to be 0.01, and the value of was taken to be 8. The same treatment was done for the three-sided point cloud of each potted plant at different growth stages.
4.2. Analysis of Filtering Noise Results
5. Point Cloud Registration
5.1. Rough Registration of the Point Cloud
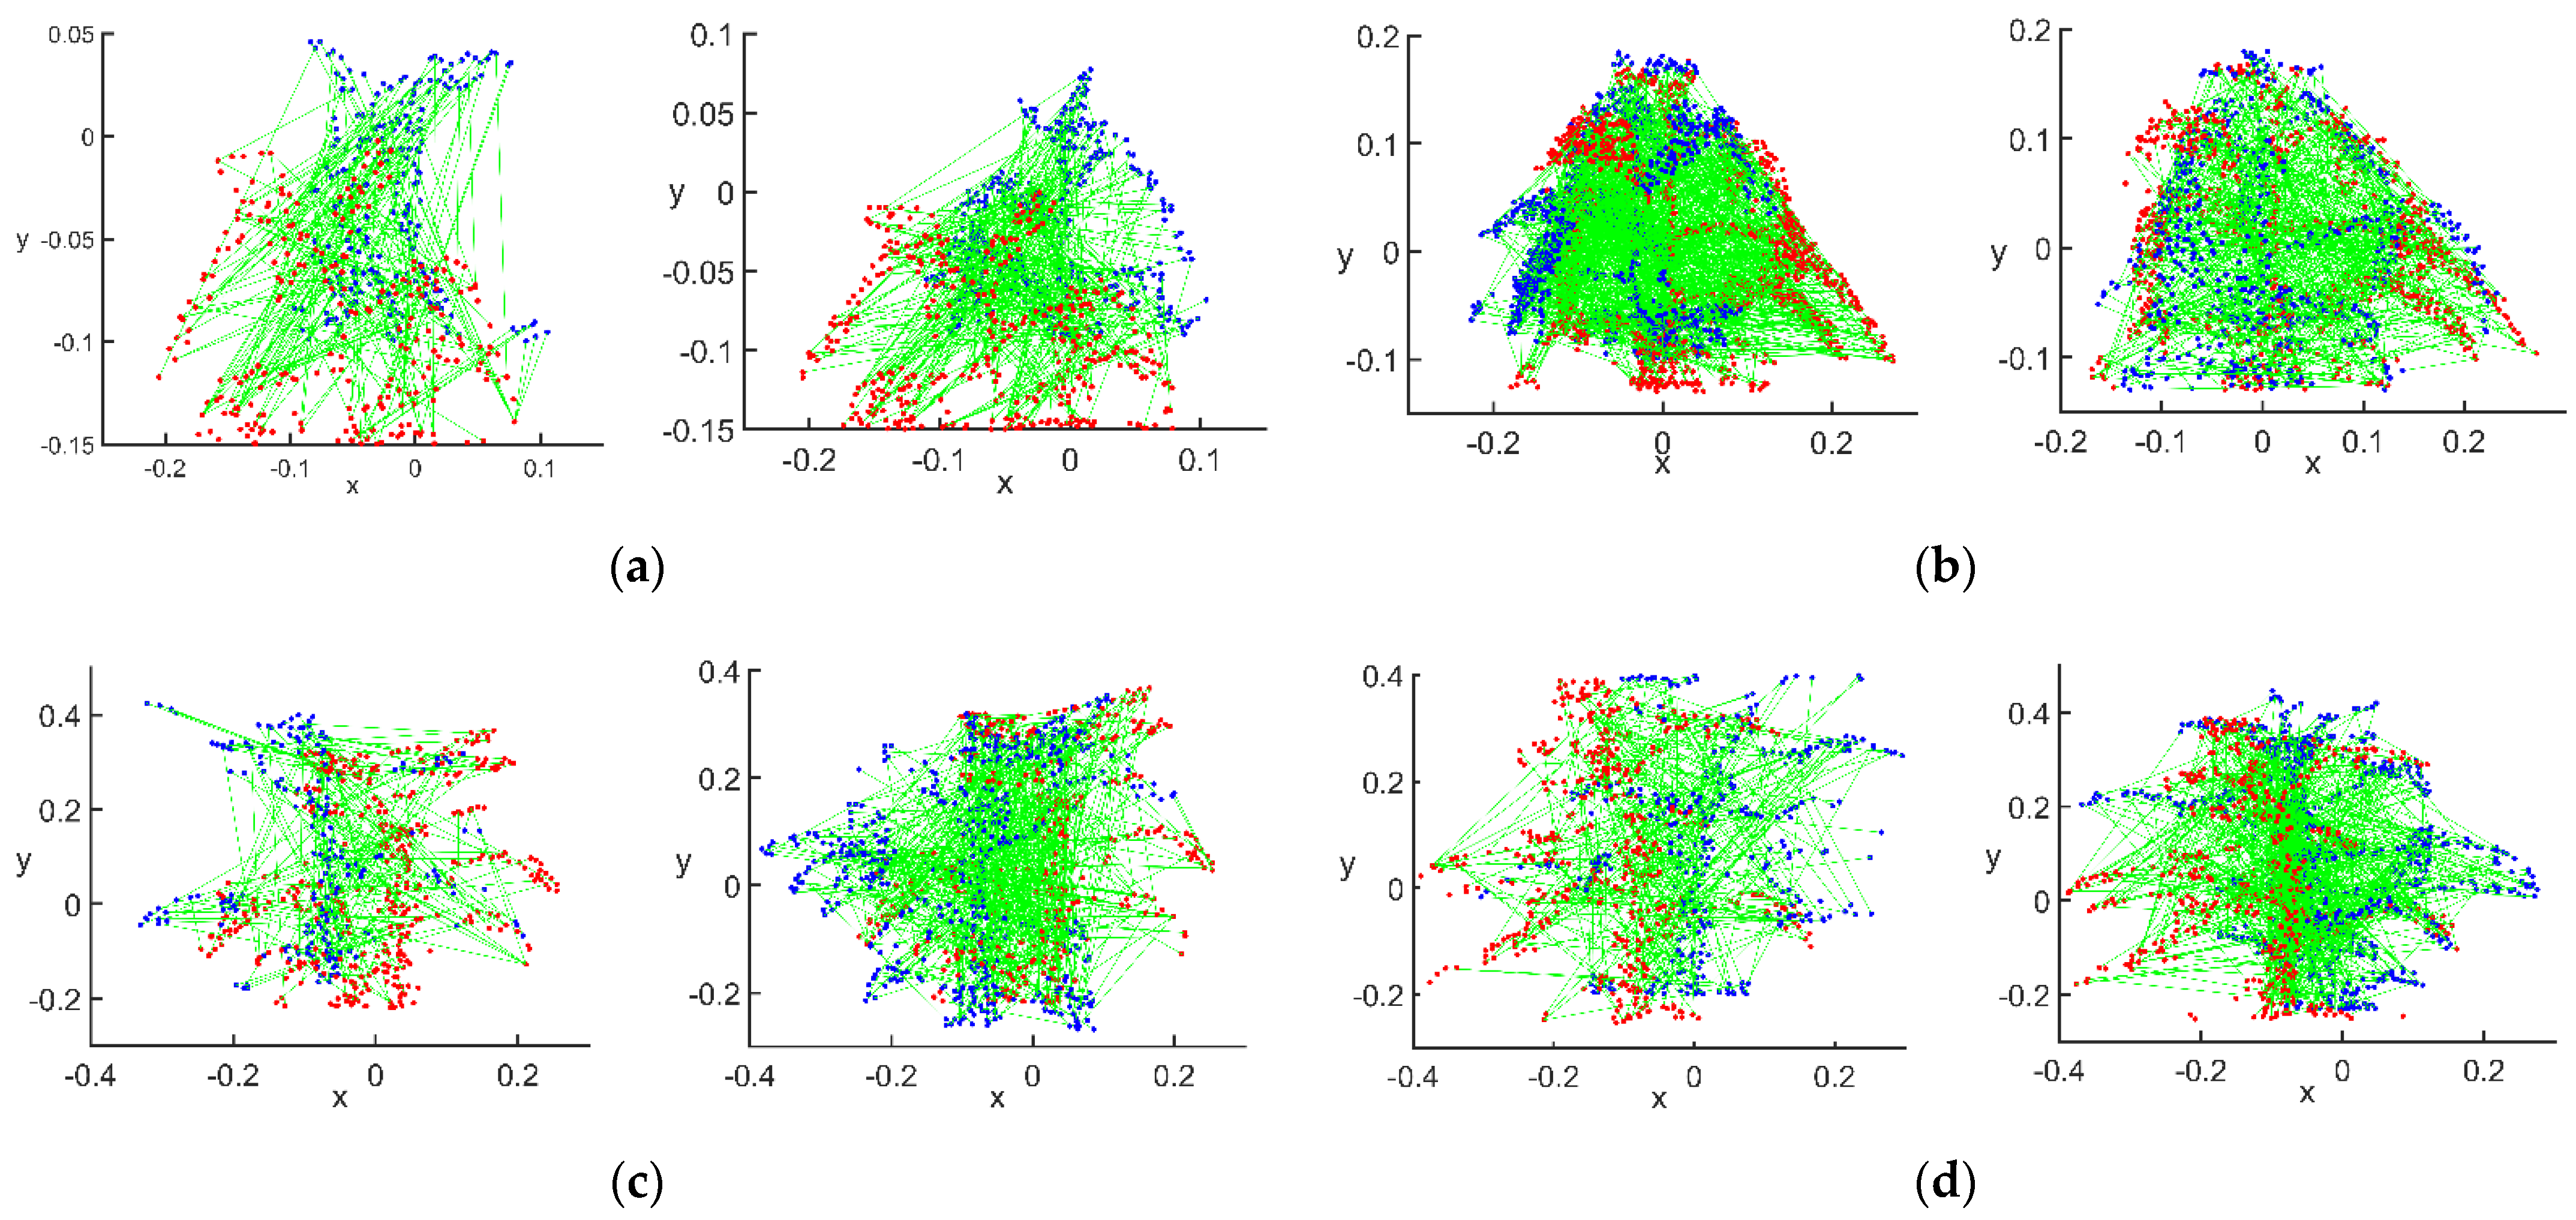
5.2. Analysis of Rough Registration Results
5.3. Accurate Registration of the Point Cloud
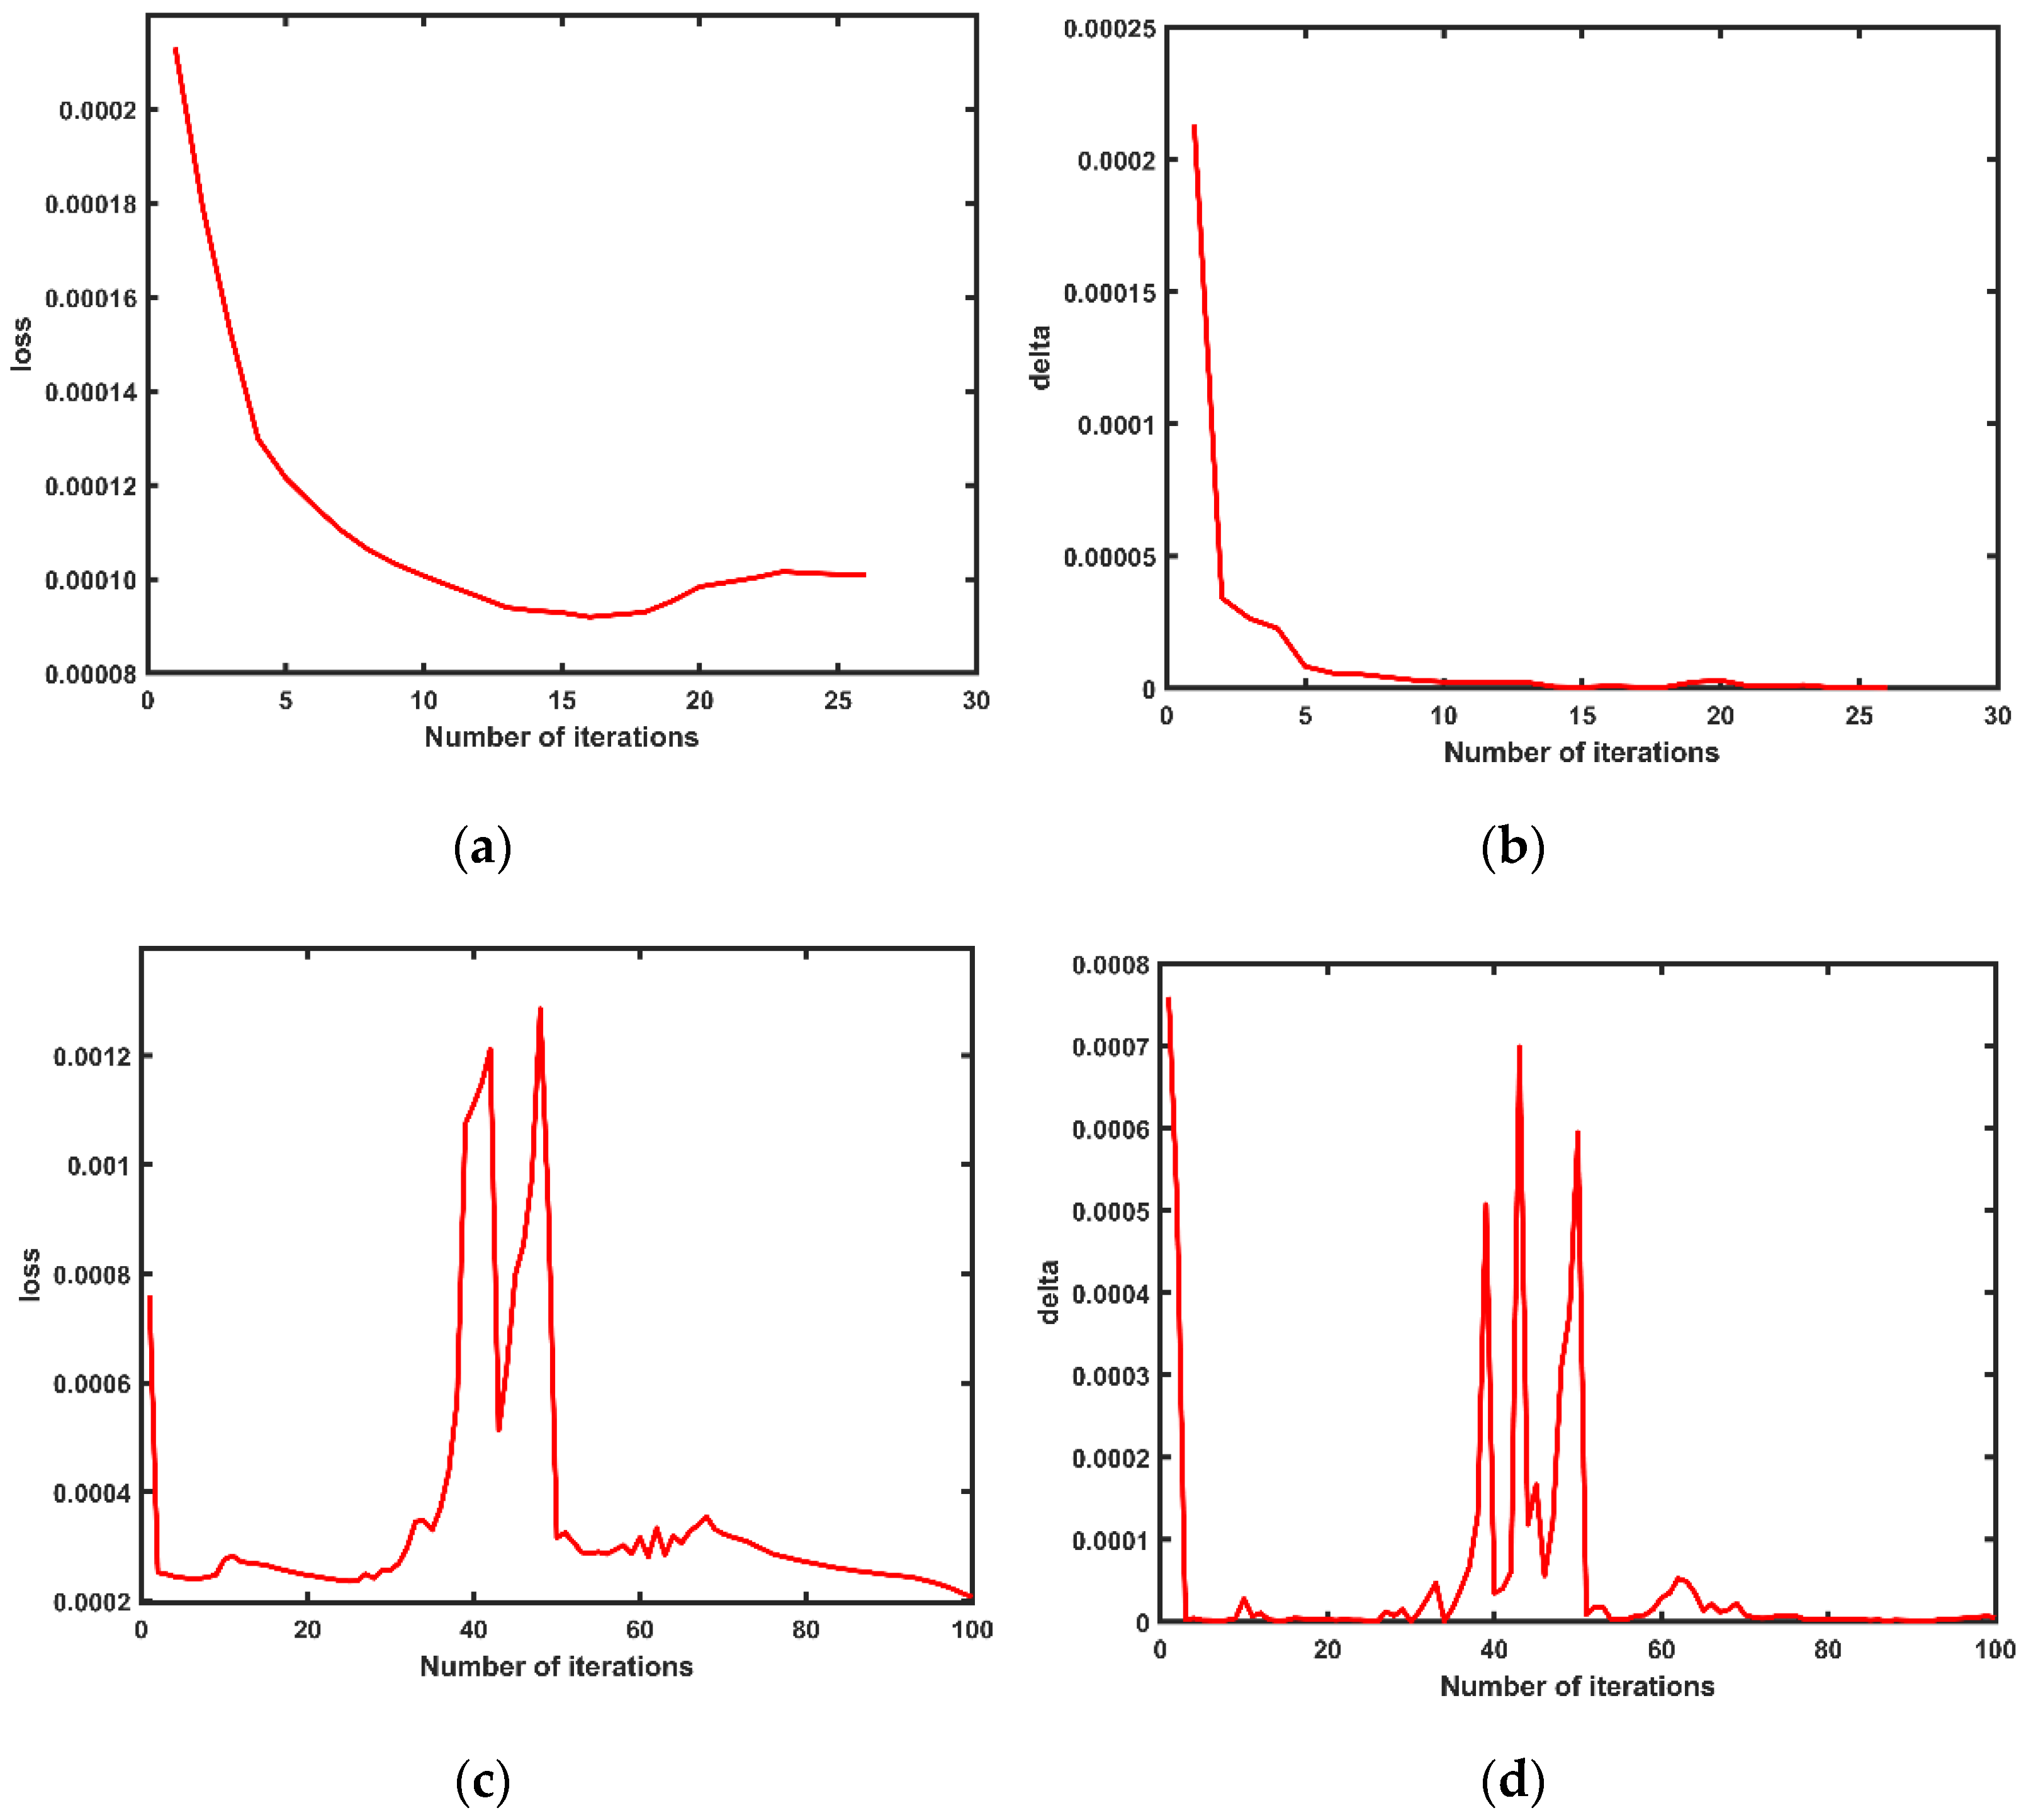
5.4. Analysis of Accurate Registration Results
6. Calculation of Phenotypic Traits
6.1. Calculation of Plant Height
- For any point , the radius of the rolling circle was , and all points within a distance of from the point were searched in the point cloud and recorded as the point set .
- Arbitrary points in were selected, and the coordinates of the center of the circle from the coordinates of these two points and were calculated. The principle is shown in Figure 16.
- After removing points from the set of points, the distances from the remaining points to points or were calculated. If the distance from all points to or was greater than , the point was a boundary point.
- If the distance from the remaining points to or was not all greater than , all points in the set of points were traversed and rotated as points. If there was a point satisfying the conditions 2 and 3, the point was a boundary point, the judgment of the point was terminated and the next point was judged. If no point like existed among all the nearest neighboring points in the point set , this indicated that point was a nonboundary point. The effect of the final edge detection in the four growth stages was shown in Figure 17.
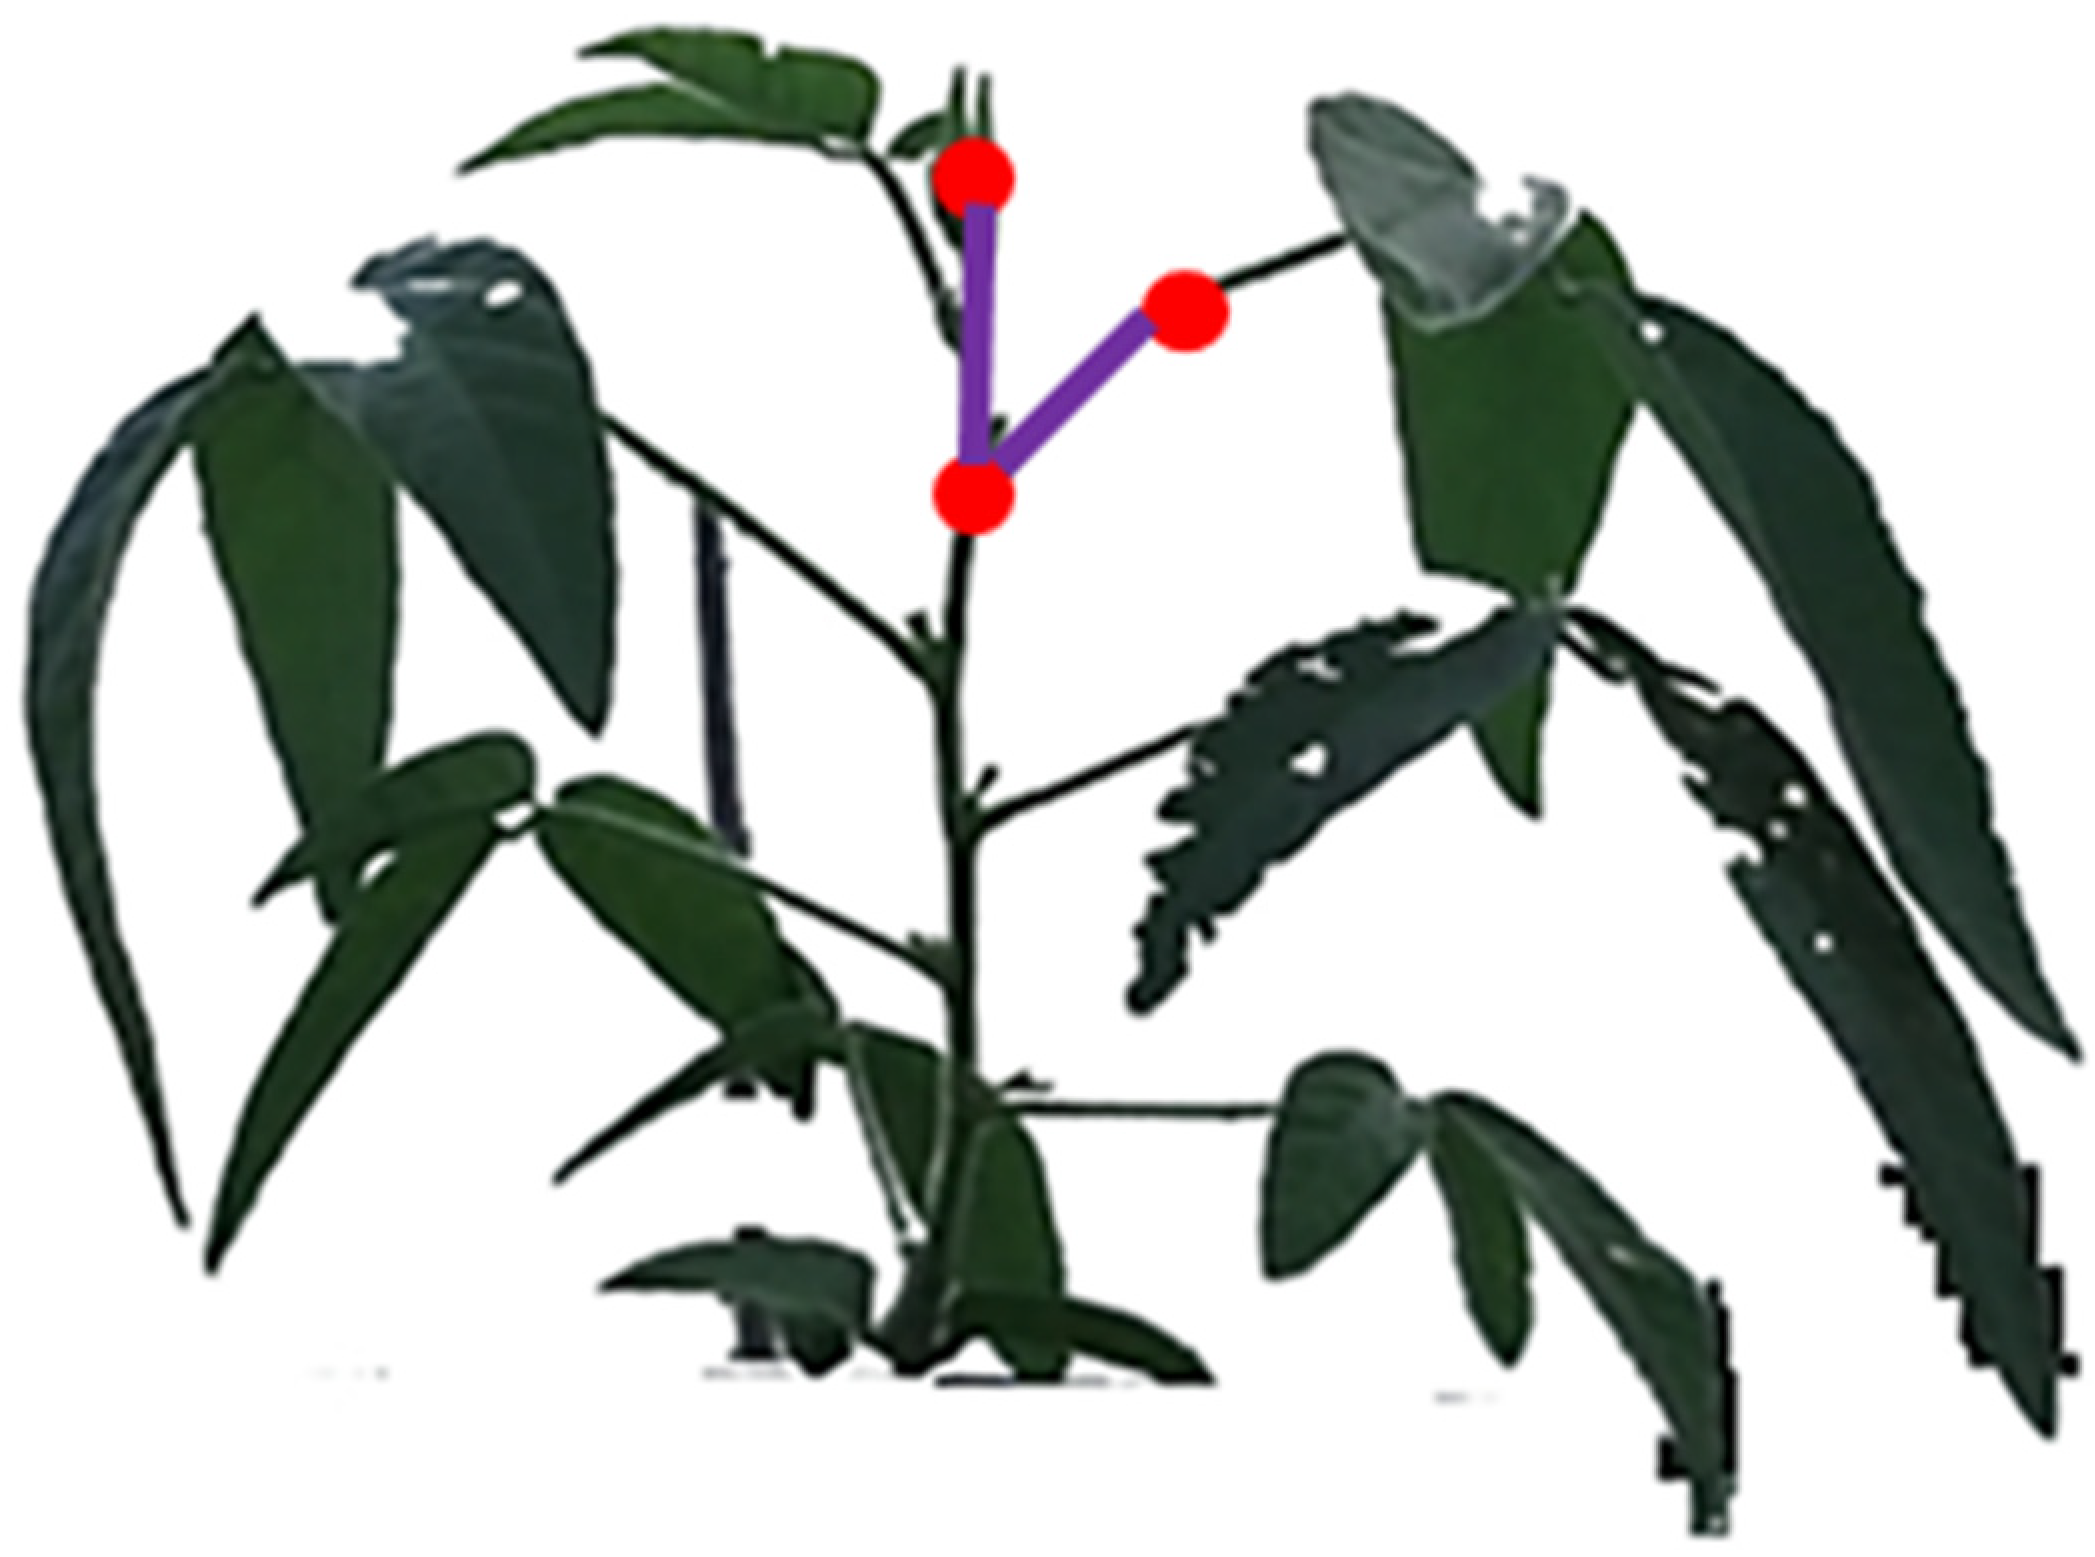
6.2. Calculation of Leafstalk Angle
- The diagram was rotated by the angle around the -axis, rotated by the angle around the -axis, and then projected to the plane (y = 0). The transformation matrix was . The three matrices were multiplied together to obtain the orthometric projection transformation matrix .
- 2.
- The result of multiplying the vertices with was the coordinates of the transformed vertices. These coordinates were then projected to the surface to obtain a reconstructed orthoaxial side view of the 3D soybean canopy point cloud. Since was a matrix and was an matrix, the two matrices could not be multiplied directly. To make the transformation possible, we used chi-square coordinates, i.e., added a coordinate component to each vertex of the stereogram so that became as follows:
- 3.
- The matrix was used to transform to obtain the projected coordinates of each point of the 3D soybean canopy on the specified plane. In this study, the values of and were adaptive, ranging from 0 to 180°. The projection effect is shown in Figure 19.
- A 8-neighborhood template centered on the test point was created and detected point by point according to the projected 3D canopy.
- At each test point, detection was performed point by point according to the detection template as in Figure 20. The feature points detected in this paper were the branch points and vertices of the soybean canopy stalks.
- 3.
- If or , the point was a vertex. If , the point was a branch point.
6.3. Calculation of Canopy Width
6.4. Analysis of the Calculation Results of Phenotypic Traits
7. Discussion
- Preprocessing. Preprocessing operations such as simplification and denoising of point clouds were important factors affecting data processing speed and calculation accuracy [35]. Because the canopy leaves were relatively densely distributed, the point cloud image from a single perspective could not clearly show the 3D structural morphology of the canopy, and there existed a large number of interference factors such as edge noise and background redundancy, which directly affected the feature extraction, registration and semantic processing of point clouds. In order to solve the above problems, this paper adopted conditional filtering and K-neighbor filtering, which effectively preserved the edge and stem detail characteristics in the raw point cloud. This method was suitable for the simplification of soybean canopy point clouds at different growth stages. The appropriate threshold K should be set for the details of the canopy layer to optimize the filtering results and simplify the canopy point cloud slice model of each viewing angle.
- Point cloud registration. Both the RANSAC algorithm and the ICP registration algorithm used in this paper should be improved to obtain the best reconstructed 3D model of the soybean canopy. In this study, the RANSAC algorithm was used to extract the soybean canopy from complex feature points. In addition, the ICP algorithm was used to achieve accurate and efficient registration between 3D point clouds of three perspectives. Robustness was a key indicator of algorithm evaluation. The correlation results showed that the error of the algorithm was between 0.0023 and 0.0230, and the average error was 0.0109. The RANSAC–ICP algorithm in this study satisfied the requirements of 3D reconstruction and phenotypic analysis of soybean plants.
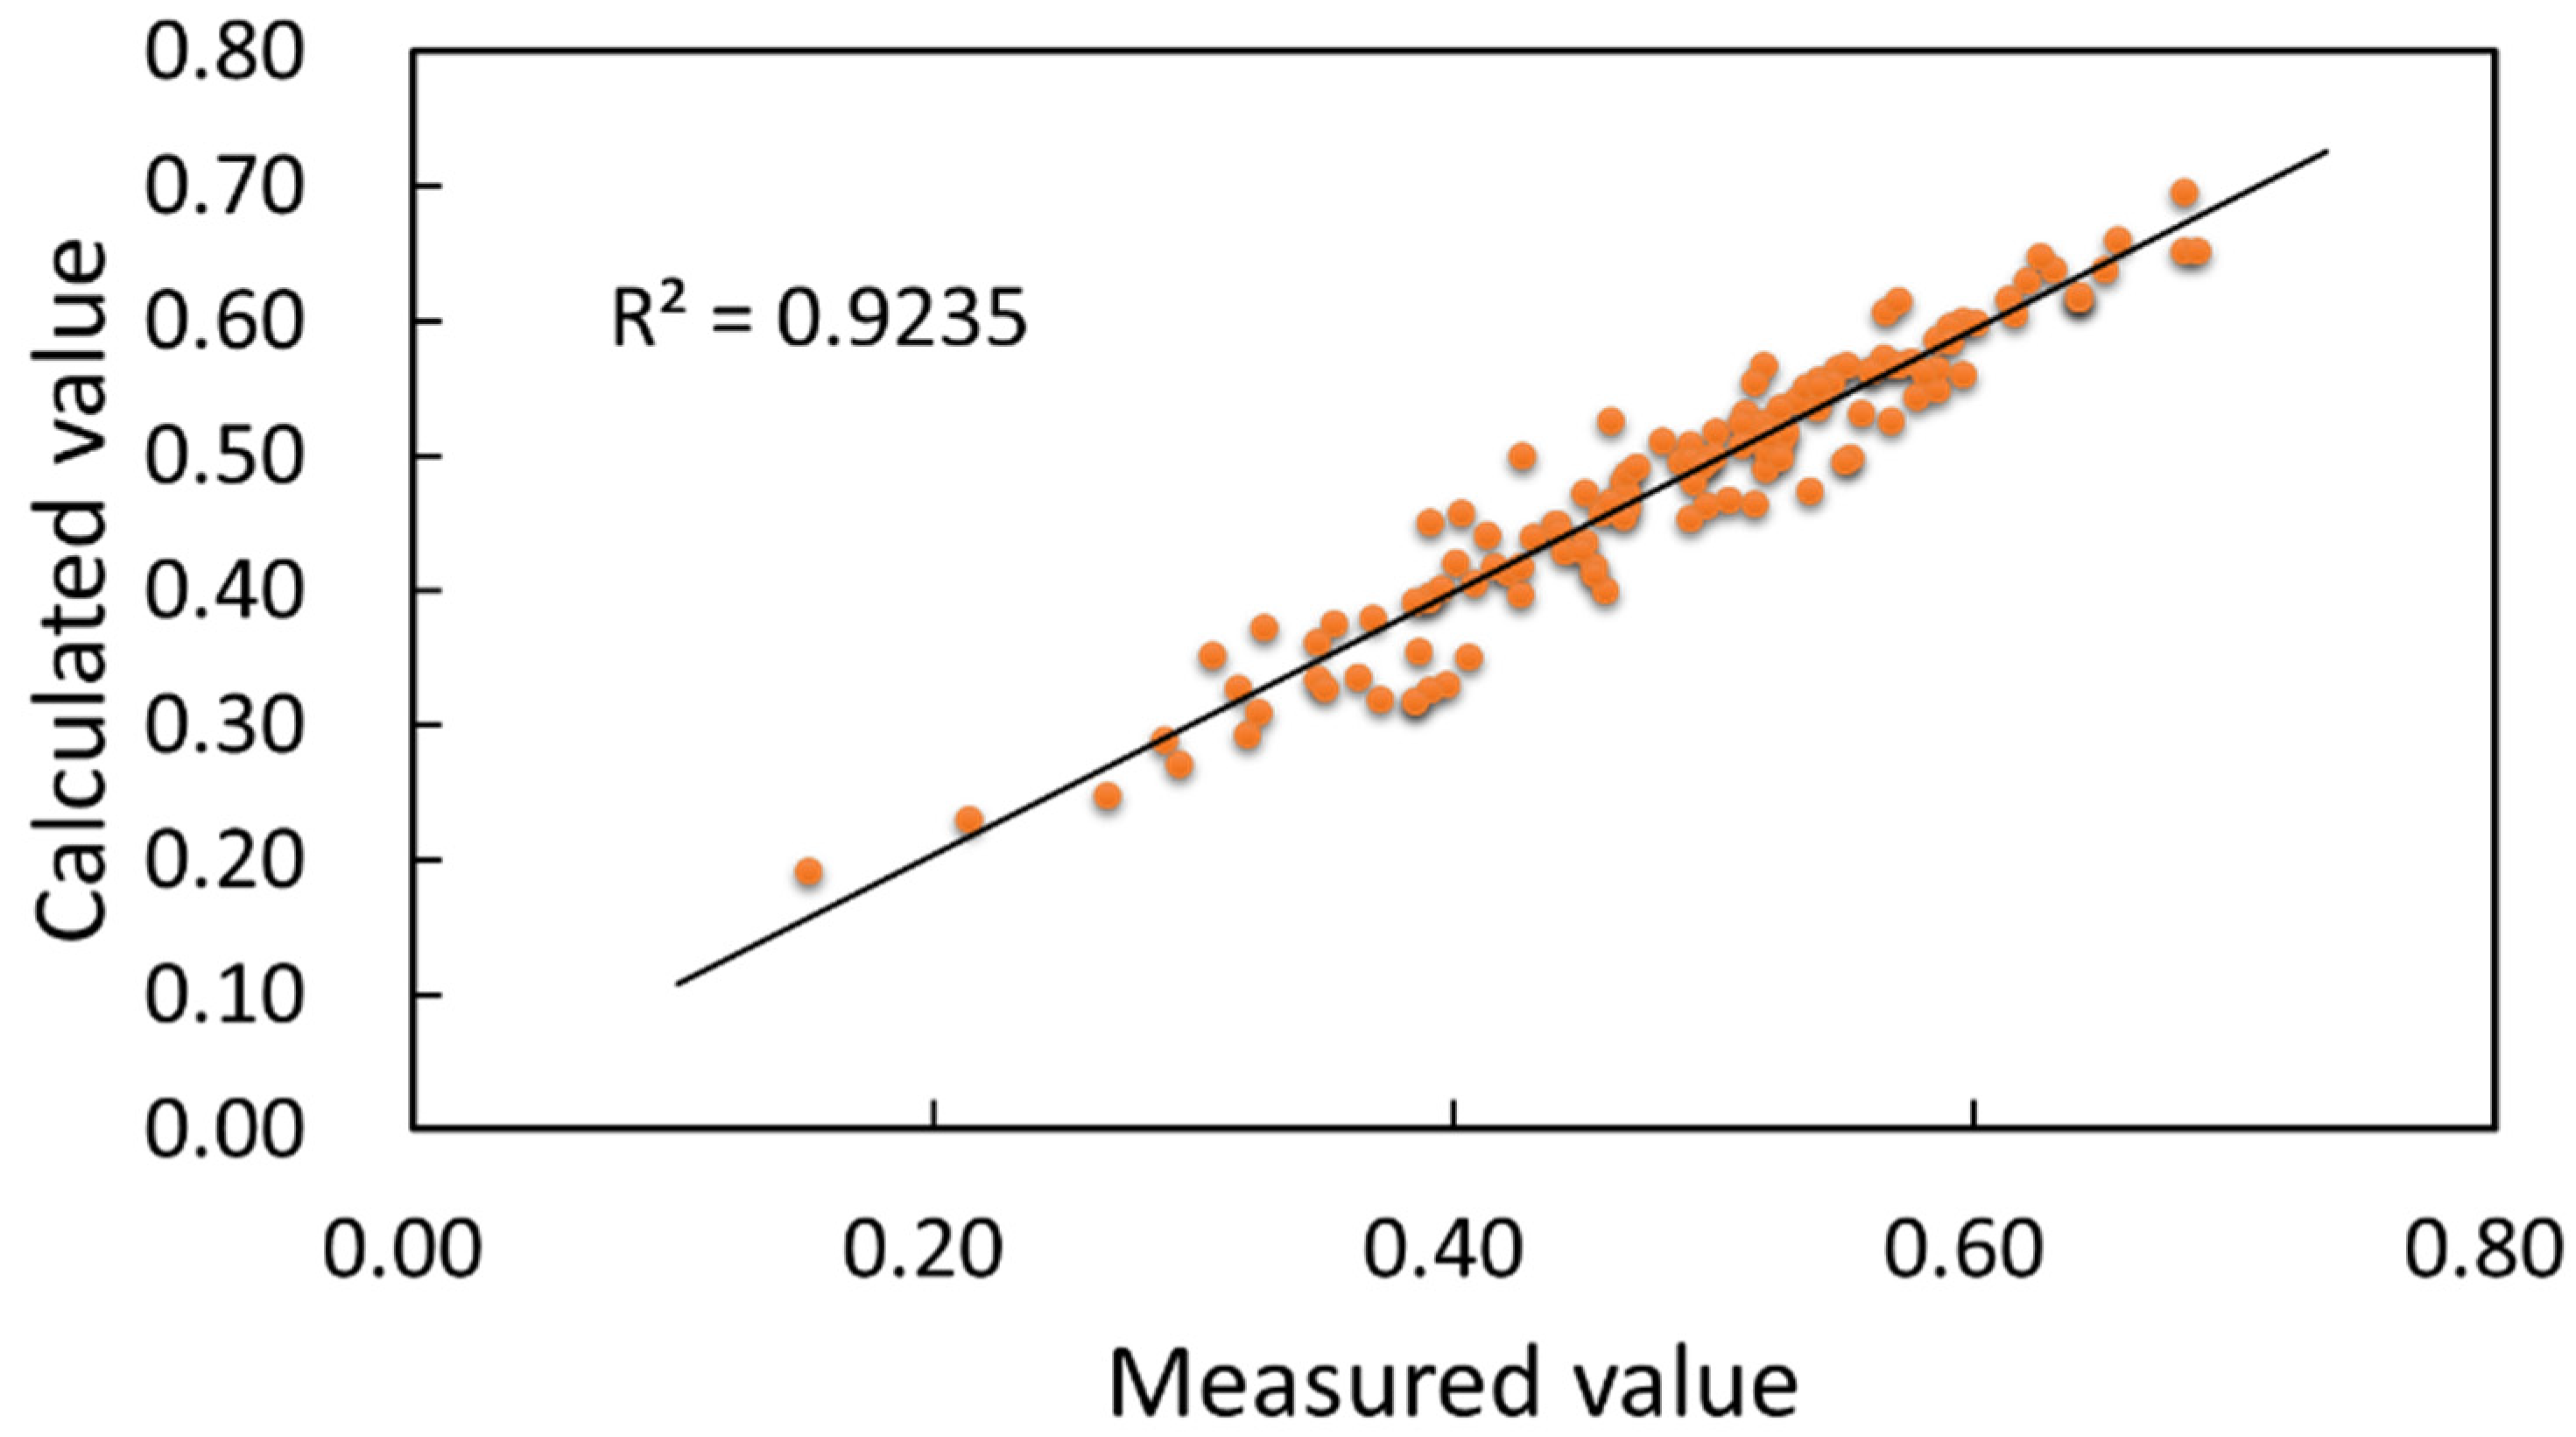
- Calculation of phenotypic traits. In the field of 3D crop reconstruction, a high-precision 3D point cloud, as an important dataset, was the key to successfully extracting crop morphological characteristics. Three-dimensional point clouds can already be obtained by many methods, such as LiDAR, ultrasonic sensors, scanners and digitizers. Compared with these techniques, the proposed 3D reconstruction method is more economical and more efficient and more realistically restores the color and morphological structure of the plant. Therefore, this method can better extract the quantitative characteristic parameters of soybean plants. The correlation results showed that the coefficient of determination between the calculated value of plant height and the measured value was 0.984. The coefficient of determination between the calculated value of leafstalk angle and the measured value was 0.9195. The coefficient of determination between the calculated value of the canopy width and the measured value was 0.9235.
- Experimental environment. Although the experimental results met the requirements for calculating the phenotypic traits of soybean canopy, some aspects still needed considering in order to obtain more accurate horizontal canopy point cloud data under outdoor conditions. The first relates to environmental factors, and in particular weather conditions. Ideal weather conditions include a windless sunny day. Actual environmental conditions, such as windy or rainy days, cannot be controlled but can be avoided. In the second aspect, attention should be paid to ensure that the shooting background during data acquisition avoids complex environments and has reduced environmental redundancy. This would guarantee the reliability of the collected sample data. This study showed that the Kinect sensor, together with the algorithm, could quickly and accurately measure the plant height, leafstalk angle and canopy width of the soybean canopy. From a plant science and breeding perspective, plant height, leafstalk angle and canopy width can be used for soybean genotype screening and optimal breeding.
- Model error analysis. The reasons for the existence of calculation errors were as follows: first, because of the limitation of the accuracy of the shooting equipment, it was impossible to accurately depict the structural form of the crop at a certain distance. Second, the method of manual measurement and data collection was rough, with inevitable accuracy errors and measurement errors, which would affect the accuracy of the final model calculation. To date, most of the research data on crop plant type selection have been obtained by hand [36]. Plant traits extracted based on 3D models can greatly avoid the damage caused by manual measurements. The 3D reconstruction of the model can permanently preserve the plant morphology of specific varieties in a specific environment, which could provide theoretical and data support for the design breeding model combining fraction breeding and phenotypic breeding.
- Application and extension. This paper presents a method for calculating soybean phenotypic traits based on multivisual 3D reconstruction, which was effectively applied in trait detection of potted soybean plants. Its simple operation, fast calculation and accurate results make it extremely easy to be promoted and applied in agricultural breeding, production and management. The method still needs improving in terms of computational efficiency and optimizing of algorithm parameters to accommodate the intricate spatial arrangement and disturbances of different crops under natural field conditions. Furthermore, the method incorporated a streamlined algorithm for point cloud redundancy data to adapt to the data characteristics of field phenotype acquisition devices such as radar sensors, providing technical support for their combination with field locomotives, navigation systems and drones to nondestructively acquire large point cloud data of field crops and accurately reconstruct the 3D structure of single plants and groups. The research could achieve rapid detection of phenotype traits in field crops.
8. Conclusions
- In this paper, a soybean multisource data acquisition system based on multiple Kinect V2 sensors was designed to collect point cloud data of soybeans in four growth stages. Conditional filtering was used to filter the point cloud files, and then K-nearest Neighbor filtering was used to reduce noise. The final retention rate of valid points was 95.97%. In addition, the traditional ICP algorithm was improved by using the RANSAC algorithm, and then the ICP algorithm was used for accurate registration. The average matching deviation of the RANSAC–ICP algorithm was 0.0214, smaller than that of the traditional ICP algorithm, and its average run time was 41.37 s, less than that of the traditional ICP.
- Soybean canopies’ phenotypic traits were calculated based on 3D reconstruction of the soybean canopy. The alpha-shapes method was used to perform edge extraction of reconstructed point cloud data. The coefficients of determination between the measured and calculated values of soybean plant height, leafstalk angle and canopy width were 0.984, 0.9151 and 0.9235, respectively. The calculation results enabled accurate and rapid calculation of soybean canopy plant parameters.
Author Contributions
Funding
Institutional Review Board Statement
Informed Consent Statement
Data Availability Statement
Conflicts of Interest
References
- Lin, D. Soybean planting technology and control of flower and pod falling in North China. Agric. Dev. Equip. 2022, 1, 199–201. [Google Scholar]
- Li, C. Principal component analysis of yield traits of major soybean cultivars in northern Heilongjiang Province. Mod. Agric. 2020, 12, 4–8. [Google Scholar]
- Yang, Q.; Lin, G.; Lv, H.; Wang, C.; Liao, H. Environmental and genetic regulation of plant height in soybean. BMC Plant Biol. 2021, 21, 63. [Google Scholar] [CrossRef] [PubMed]
- Ikhajiagbe, B.; Ogwu, M.; Lato, N. Growth and yield responses of soybean (Glycine max [L.] Merr.) accessions after exposure to cadmium. J. Vegetos. 2021, 34, 107–118. [Google Scholar] [CrossRef]
- Kong, L.; Wen, Y.; Jiao, X.; Liu, X.; Xu, Z. Interactive regulation of light quality and temperature on cherry tomato growth and photosynthesis. Environ. Exp. Bot. 2021, 182, 104326. [Google Scholar] [CrossRef]
- Petros, W.; Tesfahunegn, G.B.; Berihu, M.; Meinderts, J. Effectiveness of water-saving techniques on growth performance of Mango (Mangifera indica L.) Seedlings in Mihitsab-Azmati Watershed, Rama Area, Northern Ethiopia. Agric. Water Manag. 2021, 243, 106476. [Google Scholar] [CrossRef]
- Pandey, A.K.; Jiang, L.; Moshelion, M.; Gosa, S.C.; Xu, P. Functional physiological phenotyping with functional mapping: A general framework to bridge the phenotype-genotype gap in plant physiology. Iscience 2021, 24, 102846. [Google Scholar] [CrossRef] [PubMed]
- Ma, X.; Wu, Y.; Shen, J.; Duan, L.; Liu, Y. ML-LME: A Plant Growth Situation Analysis was Model Using the Hierarchical Effect of Fractal Dimension. Mathematics 2021, 9, 1322. [Google Scholar] [CrossRef]
- Wang, C.H.; Liu, D.; Rui-Neng, X.U.; Yang, Y.Q.; Liao, H. Mapping of QTLs for leafstalk angle in soybean. Acta Agron. Sin. 2020, 46, 9–19. [Google Scholar]
- Xiong, J.; Yu, D.; Liu, S.; Shu, L.; Liu, Z. A Review of Plant Phenotypic Image Recognition Technology Based on Deep Learning. Electronics 2021, 10, 81. [Google Scholar] [CrossRef]
- Zhao, J.; Wang, X.; Tian, H.; Lu, Y.; Liu, H. A fertilizer discharge detection system based on point cloud data and an efficient volume conversion algorithm. J. Comput. Electron. Agric. 2021, 185, 106131. [Google Scholar] [CrossRef]
- Pasinetti, S.; Hassan, M.M.; Eberhardt, J.; Lancini, M.; Docchio, F.; Sansoni, G. Performance Analysis of the PMD Camboard Picoflexx Time-of-Flight Camera for Markerless Motion Capture Applications. IEEE Trans. Instrum. Meas. 2019, 68, 4456–4471. [Google Scholar] [CrossRef] [Green Version]
- Chang, C.; Zhang, Z.; Gao, N.; Meng, Z. Improved infrared phase measuring reflectometry method for the measurement of discontinuous specular objects. Opt. Lasers Eng. 2020, 134, 106194. [Google Scholar] [CrossRef]
- Hu, C.; Kong, L.; Lv, F. Application of 3D laser scanning technology in engineering field. E3S Web Conf. 2021, 233, 4014. [Google Scholar] [CrossRef]
- Jiang, Q.; Shi, Y.E.; Yan, F.; Zheng, H.; He, B.G. Reconstitution method for tunnel spatiotemporal deformation based on 3D laser scanning technology and corresponding instability warning. Eng. Fail. Anal. 2021, 125, 105391. [Google Scholar] [CrossRef]
- Bi, S.; Yuan, C.; Liu, C.; Cheng, J.; Cai, Y. A Survey of Low-Cost 3D Laser Scanning Technology. Appl. Sci. 2021, 11, 3938. [Google Scholar] [CrossRef]
- Jensen, M.N.; Helles, O.G. Measuring the end-face of silicon boules using mid-infrared laser scanning. CrystEngComm 2021, 23, 4648–4657. [Google Scholar] [CrossRef]
- Majeed, Y.; Zhang, J.; Zhang, X.; Fu, L.; Whiting, M.D. Deep learning based segmentation for automated training of apple trees on trell was wires. Comput. Electron. Agric. 2020, 170, 105277. [Google Scholar] [CrossRef]
- Hai, L.; Shu, L.; Ye, Z. Wheat growth process 3D visualization research based on growth model. In Proceedings of the International Conference on Computer and Computing Technologies in Agriculture, Jilin, China, 12–15 August 2017; Springer: Cham, Switzerland, 2017; Volume 545, pp. 217–231. [Google Scholar]
- Wu, D.; Ye, J.L.; Wang, K.; Geng, Z.; Fu, J.; Liu, L.; Yang, W. Research on 3D reconstruction method of potted rice based on contour projection. J. Agric. Sci. Technol. 2020, 22, 87–95. [Google Scholar]
- Zhu, B.; Liu, F.; Zhu, J.; Guo, Y.; Ma, Y. 3D quantification of plant growth dynamics in a field based on machine vision. Trans. Chin. Soc. Agric. Mach. 2018, 49, 256–262. [Google Scholar]
- Ruchay, A.; Kober, V.; Dorofeev, K.; Kolpakov, V.; Miroshnikov, S. Accurate body measurement of live cattle using three depth cameras and non-rigid 3-D shape recovery. Comput. Electron. Agric. 2020, 179, 105821. [Google Scholar] [CrossRef]
- Alaei, M.; Kokkeler, A.; Boer, P. Vector Modulator-Based Analog Beamforming Using the Least Euclidean Distance Criterion. J. IEEE Access 2021, 9, 65411–65417. [Google Scholar] [CrossRef]
- Cai, Y.; Xu, W.; Zhang, F. ikd-Tree: An Incremental K-D Tree for Robotic Applications. arXiv 2021, arXiv:2102.10808. [Google Scholar]
- Lu, J.; Qian, W.; Li, S.; Cui, R. Enhanced K-Nearest Neighbor for Intelligent Fault Diagnosis of Rotating Machinery. Appl. Sci. 2021, 11, 919. [Google Scholar] [CrossRef]
- Guan, G.; Gu, W. Reconstruction of propeller and complex ship hull surface based on reverse engineering. J. Mar. Sci. Technol. 2019, 27, 498–504. [Google Scholar]
- Tao, H.; Da, F. An automatic point cloud alignment method based on normal vectors. Chin. J. Lasers 2013, 40, 184–189. [Google Scholar]
- Wongkhuenkaew, R.; Auephanwiriyakul, S.; Chaiworawitkul, M.; Theera-Umpon, N. 3D Tooth Model Reconstruction Using Statistical Randomization-Based Particle Swarm Optimization. Appl. Sci. 2021, 11, 363. [Google Scholar] [CrossRef]
- Nguyen, H.; Tan, T.; Wang, Y.; Wang, Z. 3D Shape Reconstruction from Single-shot Speckle Image Using Deep Convolutional Neural Networks. Opt. Lasers Eng. 2021, 143, 106639. [Google Scholar] [CrossRef]
- Liao, Z.; Liu, J.; Shi, G.; Meng, J. Grid Partition Variable Step Alpha Shapes Algorithm. Math. Probl. Eng. 2021, 2021, 5073562. [Google Scholar] [CrossRef]
- Tang, D.; Yan, T. Orthogonal side projection of 3D figures and fading of convex polyhedral. Intell. Comput. Appl. 1994, 1, 23–26. [Google Scholar]
- Zhu, K.; Ma, X.; Guan, H.; Feng, J.; Yu, S. A method of calculating the leafstalk angle of the soybean canopy based on 3D point clouds. Int. J. Remote Sens. 2021, 42, 2463–2484. [Google Scholar] [CrossRef]
- Huang, S.; Wang, H.; Wang, X.; Liang, H.; Pan, W. Effect of ionic rare earth mining on oil tea plant configuration. Environ. Dev. 2019, 31, 224–226. [Google Scholar]
- Ying, L.; Wei, W.; Teng, M.; Sheng, W.; Ze, Y.; Xiao, W.; Chun, Z. Automatic organ-level point cloud segmentation of maize shoots by integrating high-throughput data acquisition and deep learning. Comput. Electron. Agric. 2022, 193, 106702. [Google Scholar]
- Li, R.; Yi, L.; Zhao, W.; Chen, F. Measurement Method of Thermal Protection Layer Thickness of Solid Rocket Motor Based on Laser Point Cloud. J. Solid Rocket. Technol. 2021, 44, 112–117. [Google Scholar]
- Rong, Z.; Kai, S.; Zhuang, Y.; Xue, Y.; Jiang, Y.; Jia, S.; Zhen, H.; Hong, J.; Da, X.; Zhan, Z.; et al. Analysing the phenotype development of soybean plants using low-cost 3d reconstruction. Sci. Rep. 2020, 40, 2352–2357. [Google Scholar]


| Number of Point Clouds | ICP | RANSAC + ICP |
|---|---|---|
| n < 10,000 | 98.95 s | 79.42 s |
| 10,000 < n < 15,000 | 147.95 s | 103.33 s |
| 15,000 < n < 20,000 | 223.74 s | 163.78 s |
Publisher’s Note: MDPI stays neutral with regard to jurisdictional claims in published maps and institutional affiliations. |
© 2022 by the authors. Licensee MDPI, Basel, Switzerland. This article is an open access article distributed under the terms and conditions of the Creative Commons Attribution (CC BY) license (https://creativecommons.org/licenses/by/4.0/).
Share and Cite
Wang, F.; Ma, X.; Liu, M.; Wei, B. Three-Dimensional Reconstruction of Soybean Canopy Based on Multivision Technology for Calculation of Phenotypic Traits. Agronomy 2022, 12, 692. https://doi.org/10.3390/agronomy12030692
Wang F, Ma X, Liu M, Wei B. Three-Dimensional Reconstruction of Soybean Canopy Based on Multivision Technology for Calculation of Phenotypic Traits. Agronomy. 2022; 12(3):692. https://doi.org/10.3390/agronomy12030692
Chicago/Turabian StyleWang, Feiyi, Xiaodan Ma, Meng Liu, and Bingxue Wei. 2022. "Three-Dimensional Reconstruction of Soybean Canopy Based on Multivision Technology for Calculation of Phenotypic Traits" Agronomy 12, no. 3: 692. https://doi.org/10.3390/agronomy12030692
APA StyleWang, F., Ma, X., Liu, M., & Wei, B. (2022). Three-Dimensional Reconstruction of Soybean Canopy Based on Multivision Technology for Calculation of Phenotypic Traits. Agronomy, 12(3), 692. https://doi.org/10.3390/agronomy12030692