Abstract
Soil management practices are important parts of sustainable agriculture. Improving tillage practice is important for alleviating soil degradation and promoting sustainable grain production. A four year field experiment was conducted to examine the effects of deep tillage (DT), incorporated into the minimum tillage (MT), on soil physical properties and crop performance. The field experiments included continuous rotary tillage (RT), continuous DT, and intermittent DT every three years, every two years, and every other year, into RT. The results showed that the introduction of DT into continuous RT reduced the soil bulk density of the 20–30 cm soil layer by 5.6% and reduced nutrient stratification rates by 20–30%, which favored more uniformly distributed soil nutrients in the top soil layer. The root growth for treatments with DT in the deep soil layers (1–1.5 m) was significantly improved, which resulted in a higher soil water depletion. Under deficit irrigation scheduling, the improved root growth and soil water uptake in the deep soil layer improved crop growth and grain production. Overall, a 10.5% increase in yield and 18.3% increase in water productivity were observed when intermittent DT was introduced during the four years. The effects of DT could be maintained for two continuous years. Therefore, it was suggested that after two or three years of RT, DT should be applied to improve soil physical properties and ensure high grain production.
1. Introduction
Increasing agricultural productivity and sustainable food production will be crucial in the future as the world’s population increases. The North China Plain (NCP) is an important agricultural region in China, with an area of approximately 3.2 × 10⁴ km2 and 18.0 million ha of agricultural land [1]. An annual double-cropping system with winter wheat (Triticum aestivum L.) and summer maize (Zea mays L.) has been the principal cropping system in this region, accounting for 70% of cultivated land [2]. It provides more than 50% and 33% of the nation’s wheat and maize production, respectively [3,4]. With the increases in the production of the two crops, the crop straw and residue yield has grown dramatically [5]. Crop straw has been directly returned to the field to avoid environmental problems caused by straw burning [6]. This practice of straw management combined with minimum tillage has been implemented for the past 20 years in the NCP, and has greatly increased soil fertility, especially the content of soil organic matter in the top soil layer [7,8].
It is widely known that minimum tillage improves soil quality and offers multiple agro-ecosystem services, such as promoting soil aggregate formation, improving soil water retention capacity [9] and soil stability, porosity, and organic carbon [10,11,12]. However, there have been reports on emerging issues after long-term practices of minimum tillage practices [13]. For cultivated land without any tillage practices, soil bulk density and strength generally increased [14]. Soil physical properties such as soil bulk density, soil penetration resistance and nutrient distribution impacted crop root growth and distribution [15,16,17]. Researchers have reported increases in the thickness of soil plough pans, which would impede soil water infiltration, restrict crop root growth and reduce crop production [10,18,19].
Mechanical modifications of soil profiles, commonly referred to as deep tillage, could alleviate high subsoil strength, facilitating deeper rooting and the availability of subsoil resources to crops [15]. It is recognized that deep tillage is conducive to improving soil fertility, promoting the vigorous growth of roots [20]. A global meta-analysis indicated that occasional deep tillage was essential in conservation agricultural management systems to address soil compaction, weed management, and uneven distribution of soil nutrients caused by long-term no-tillage [21]. Tillage effectively reduces weed pressure during no-tillage and provides higher wheat yields [22]. Studies have shown that deep tillage in saline soil can improve soil fertility and wheat yields [23]. However, consecutive deep tilling was also incongruous in the agricultural system, presumably due to inconsistent yield responses and high execution costs [15,24]. As soil represents the largest carbon pool on earth, and tillage can strongly influence soil CO2 emissions [25], the selection of suitable tillage practices is of great significance for maintaining soil sustainability and adapting to climate change [26].
In the NCP, due to the serious underground water overdraft problem, deficit irrigation is being widely used [4,27]. Under deficit irrigation, root growth and distribution in the soil profile and its ability to fully utilize soil water will play important roles in enhancing crop production [28,29]. It is important to examine how the continuous rotary tillage affected soil properties, crop root growth and soil water use, and whether the introduction of deep tillage benefited crop production in the NCP under deficit irrigation scheduling. Due to the high costs of deep tillage, finding an optimal frequency of incorporating deep tillage into the minimum tillage was also important. Although there have been many articles on the effects of conservation tillage, there have been few comprehensive studies on the effects of different rotation tillage practices and their frequency on the effects of soil and crop performance. Therefore, the hypothesis of this study was that incorporation of deep tillage into the minimum tillage system would modify the soil structure and soil nutrient distribution which would influence crop root growth, soil water depletion and grain production under limited water supply; and the effects would depend on the tillage frequency and soil disturbance. A four-year field experiment was conducted to assess the effects of different frequencies of deep tillage incorporated into conservation tillage practices on soil and crops to provide references in selecting an optimized tillage system for winter wheat and maize to achieve sustainable agricultural production in the NCP.
2. Materials and Methods
2.1. Experimental Site and Farming System
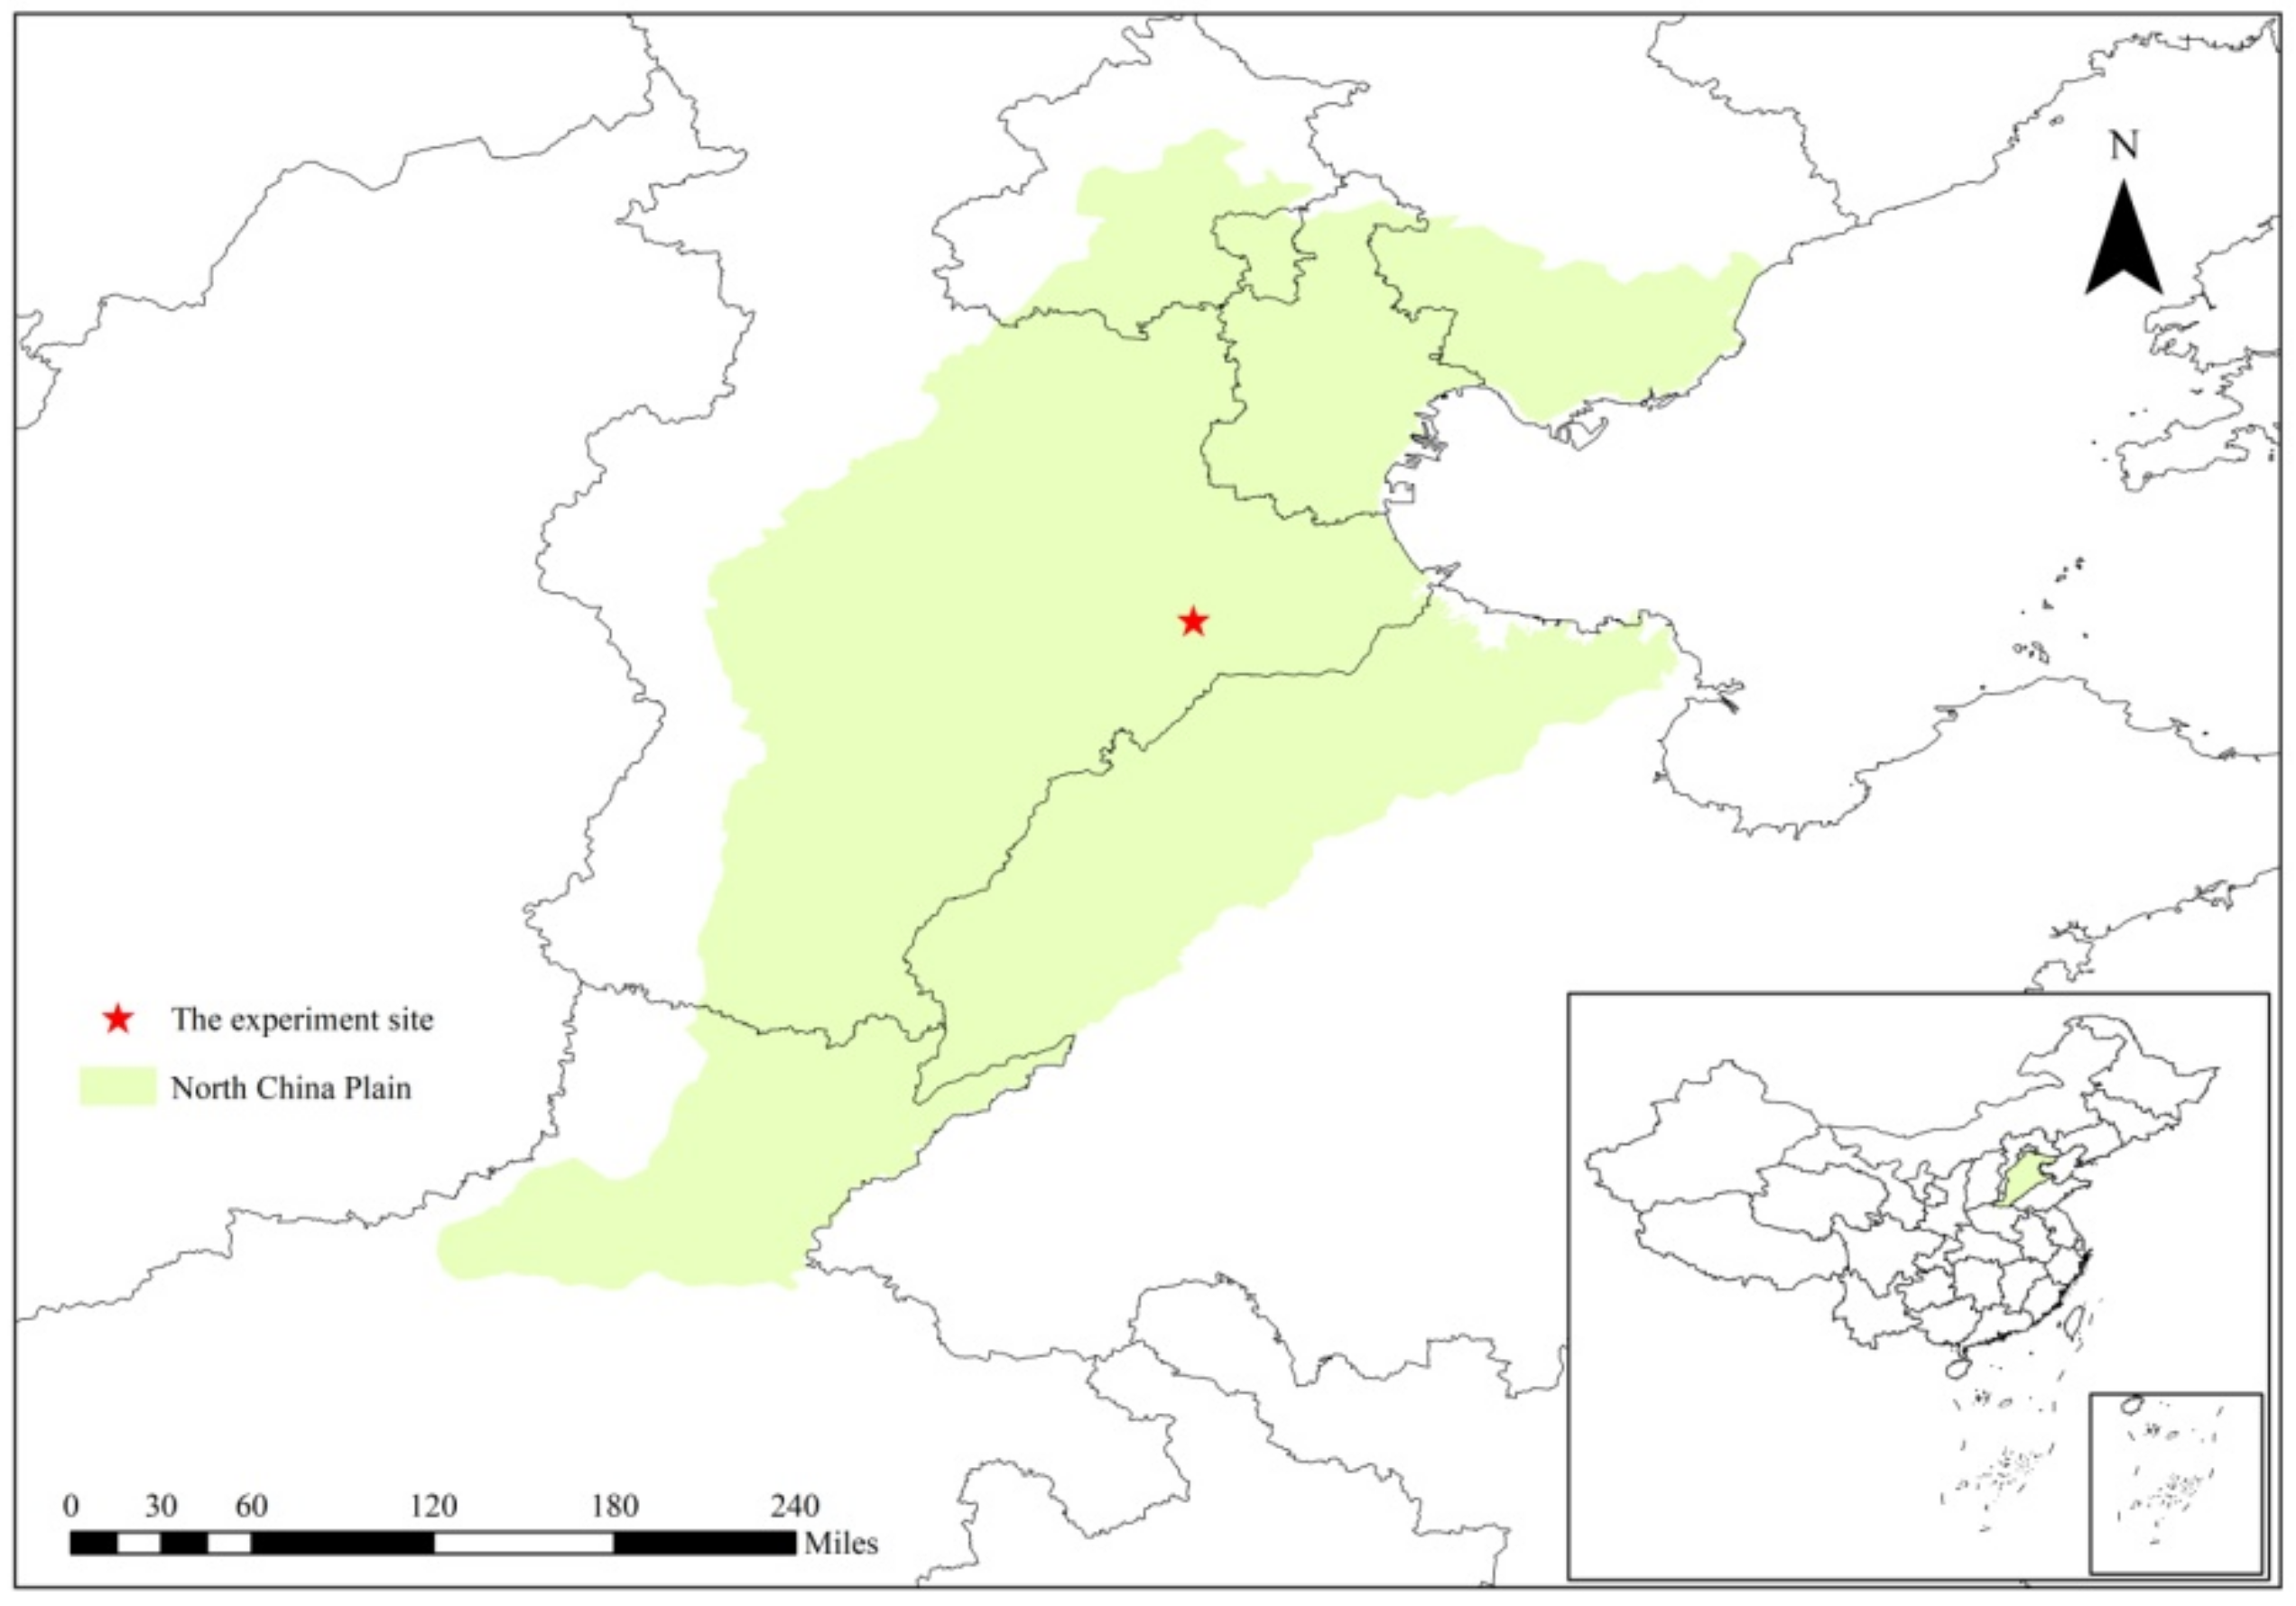
This study was conducted from 2016 to 2020 at the Nanpi Agroecosystem Experimental Station of the Chinese Academy of Science, which is located in the NCP (38°06′ N, 116°40′ E; elevation 20 m) with a temperate continental monsoon climate (Figure 1). The average annual temperature at the study site was 12.3 ℃, the annual sunshine duration was 2940 h, and the average annual precipitation was 524.5 mm, with 70% of the precipitation falling during the summer in July and August [30]. The soil texture is loam, and the average water holding capacity is 34.2% (m3 m−3). The physical soil properties and soil moisture parameters of different soil horizons at the experimental site are as described by Xiyun Jiao (2017) [31]. The saturated hydraulic conductivity of the top soil layer (0–20 cm) is around 28–30 mm/h. The groundwater level below the soil surface ranges from depths of 4 to 6 m annually. The salt content of the shallow groundwater is approximately 3 g L−1, and is therefore classified as saline water. Irrigation is derived from deep groundwater sources (approximately 130 m below the soil surface), which has a total salt content of less than 1 g L−1, classified as fresh water.
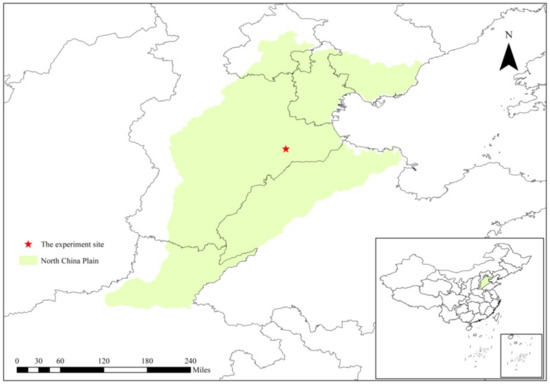
Figure 1.
The location of study site in the North China Plain.
At the experimental site, a continuous double-cropping system of winter wheat and summer maize was conducted. Winter wheat was sown around the 10th of October and harvested on approximately the 10th of June the following year. Maize was sown immediately after the winter wheat harvest, and maize was harvested at the end of September. Before the commencement of the experiment, rotary tillage was practiced at the site for over ten years. The initial soil organic matter contents, total N, available P, and available K at the top soil layer (0–20 cm depth) were 12.6 g kg−1, 0.85 g kg−1, 11.23 mg kg−1, and 97.23 mg kg−1, respectively.
2.2. Experimental Design
From October 2016 to June 2020, five tillage treatments were arranged: continuous rotary tillage (C-RT), incorporation of deep tillage (DT) into RT every three years (D+R+R+R), two years (D+R+R+D), and one year (D+R+D+R), and continuous deep tillage (C-DT) (Table 1). For all treatments, after the winter wheat was harvested with a combine, maize was directly sown without any tillage. All tillage practices were carried out after maize harvesting and before sowing winter wheat. Before any tillage practices, maize straw was chopped into small pieces by a straw crusher. Rotary tillage was conducted using a rotary machine to plough the top soil layer down to 7–10 cm to mix the chopped maize straw into the top surface soil layer. Rotary tillage was generally conducted twice before sowing winter wheat. Deep tillage was carried out by a plough down to 20–25 cm. With the top soil turned over, the crushed maize residues were mixed with the soil in the top 0–25 cm of the soil layer. Each treatment was repeated four times. There were 20 plots, and each plot had an area of 10 m × 20 m. Plots were arranged randomly in the field.

Table 1.
The five tillage treatments conducted before sowing winter wheat, from 2016 to 2020 *.
The variety of winter wheat was “Shinong086”, and the maize variety was “Huanong866”. Cultivars for winter wheat and maize were all popular locally used cultivars. Before tillage and sowing of winter wheat, chemical fertilizers were applied, namely, N at 140 kg ha−1 and P2O5 at 150 kg ha−1. Nitrogen at 140 kg ha−1 was applied at the jointing stage of winter wheat with one irrigation. Maize was sown and fertilized simultaneously with a composite chemical fertilizer at the rate of 900 kg ha−1 (N-P2O5-K2O content of 15%–39%–8%) using a combined sowing and fertilizing machine. The sowing and harvesting times for the two crops during the four years are listed in Table 2. Winter wheat was sown with a seeding rate of 450 kg ha−1 and with a row spacing of 20 cm. Maize was sown with a row spacing of 60 cm, and a seeding rate of 45 kg ha−1.

Table 2.
Sowing and harvesting date, and irrigation timing and amounts for all treatments from 2016–2020.
Irrigation was conducted by pumping deep groundwater from a nearby well, and the water was transported to the field by low-pressure pipes. A water meter was installed on the pipe to record the amount of water applied to each plot. Irrigation was applied to winter wheat at the jointing stage together with a N application. In a dry year (2018–2019), another irrigation was applied at the grain filling stage of winter wheat. Maize was irrigated at sowing to ensure seed germination and seedling establishment. No other irrigation was applied during the growing season of maize. For each irrigation, an irrigation amount of 75 mm was applied. The irrigation and management details are listed in Table 2. The irrigation conducted in this study was deficit irrigation scheduling, which is widely adopted locally due to the high cost of using deep groundwater to irrigate crops. Under this deficit irrigation scheduling, around 80% of the crop water requirement could be fulfilled for winter wheat [4]. Due to high rainfall in summer, the growing season of maize, and with irrigation at sowing, no apparent water deficit occurred during the maize season.
2.3. Measurements
2.3.1. Meteorological Factors
Daily weather data were obtained from a standard weather station approximately 100 m away from the experimental site, which included the daily temperature, rainfall, radiation, humidity, and wind speed.
2.3.2. Soil Chemical and Physical Characteristics
After winter wheat was harvested and before sowing maize each year, the soil bulk density (BD) of the 0–40 cm soil layer was measured by the steel ring sampling method. Samples were taken at each 10 cm increment down to 40 cm and repeated 3 times for each plot. Soil samples were transferred to aluminum boxes, oven-dried at 105 ℃ for 24 h, and weighed to calculate dry soil weight per unit volume. After three years, at the seedling stage of winter wheat, the soil penetration resistance was measured at each 2.5 cm increment to a depth of 45 cm by an SC-900 soil firmness meter (SPECTRUM, Glastonbury, CT USA), and three sites were monitored for each plot.
After winter wheat was harvested in 2019, soil samples were obtained for the 0–10 cm, 10–20 cm, 20–30 cm and 30–40 cm soil layers at three sites in all the plots. Soil samples in the same plot for the same soil depth were mixed as one replicate for measuring soil nutrient contents and soil aggregates. Soil organic matter (SOC), total N, and available P and K was measured following the method used by Chen [6]. Wet sieve separation methods following Kemper and Chepil [32] were used to analyze the components of soil aggregates. Sieves with size of 2.0, 1.0, 0.5, 0.25 and 0.053 mm were used for the separation. The percentage of water stable aggregates (%) was calculated using the following equation [33]:
where >0.25 mm aggregates weight was the sum of the sieve separated soil dry weight with the sieves size of 2.0, 1.0, 0.5 mm, weight of the total soil was the total dry weight of soil before sampling.
Soil stratification proportion was calculated as [33]:
where the soil nutrient contents in the surface soil (0–10 cm) referred to soil organic matter, total N, available P or available K content in 0–10 cm topsoil layer and the soil nutrient contents in 30–40 cm soil layers referred to the same soil nutrient parameter in 30–40 cm deep soil layer.
2.3.3. Crop Root Monitoring
Roots of winter wheat were sampled at maturity in 2016–2020. Soil cores were collected to a depth of 1.5 m with a diameter of 10 cm in increments of 10 cm. Soil samples were taken to the laboratory and washed to obtain clean roots. After separating the roots with other debris, root length was measured based on the line-intersect method. Root length density (RLD; cm cm−3) was defined as the root length per unit soil volume.
2.3.4. Grain Yield
At the maturity of winter wheat and maize, the density of the crops was measured for each plot. Harvesting was carried out manually, and each plot was harvested 2 × 5 m2 for winter wheat and 4.8 × 5 m2 for maize. At harvesting, 80 wheat plants and 4 maize plants were randomly selected in each plot for measurements of total aboveground dry weight and seed weight (seed water content at 13%) to obtain the yield.
2.3.5. Soil Water Content, Seasonal Water Use and Water Productivity
Soil water contents were measured using the soil auger method to observe gravimetric water contents down to a depth of 2 m by increments of 20 cm at sowing and harvesting of the two crops each season. The gravimetric water contents were converted to volumetric water contents by multiplying the bulk density to calculate the soil water depletion (SWD).
Seasonal evapotranspiration (ET) for the two crops was calculated using the following equation [34]:
where ET was the total water use during a growing season (mm), P was precipitation (mm), I was irrigation (mm), SWD was the variation in soil water storage for the 2 m soil layer (mm), W was the capillary rise to the root zone (mm), D was drainage from the root zone, and R was runoff (mm). No surface runoff was observed during the experiments, and R was ignored. The underground water level at the experimental site was 4–6 m below the soil surface, and capillary rising was neglected. The drainage was negligible due to the limited irrigation and high water holding capacity of the 2 m soil profile. Therefore, ET = SWD + P + I was used under the experimental conditions of this study. Water productivity (WP) was defined as the grain yield divided by the seasonal ET [35].
ET = P + I + SWD + W − D − R
2.4. Data Analysis
All data were analyzed using SPSS statistical software (version 21.0, SPSS, IBM, Chicago, IL, USA). One-way analysis of variance (ANOVA) was used to assess the differences between each treatment. The standard deviation for each factor was calculated, and the means of four replications were compared. The significant differences between each treatment were determined by the least significant differences (LSD) at a probability level of p = 0.05. Data mapping was carried out using OriginPro 2018C (OriginLab, Northampton, MA, USA).
3. Results
3.1. Weather and Soil Water Conditions
During the four year duration of the experiment, there were seasonal weather variations. The changes in the seasonal meteorological factors are shown in Table 3. The average precipitation for the four years was 526.0 mm, which was similar to the long-term average rainfall of approximately 527.2 mm over the past 30 years at the same site. The rainfall in 2017–2018 was significantly higher than the other years, and the average daily temperature was the lowest that year, among the four years. The winter wheat season was particularly dry in the 2018–2019 season, with only 58.7 mm of rainfall, which was 55.4% of the four-year average. The average precipitation during the four maize growing seasons was 392.2 mm. The seasonal variation in meteorological factors affected crop water use and grain production.

Table 3.
Seasonal meteorological factors at the experimental site from 2016 to 2020.
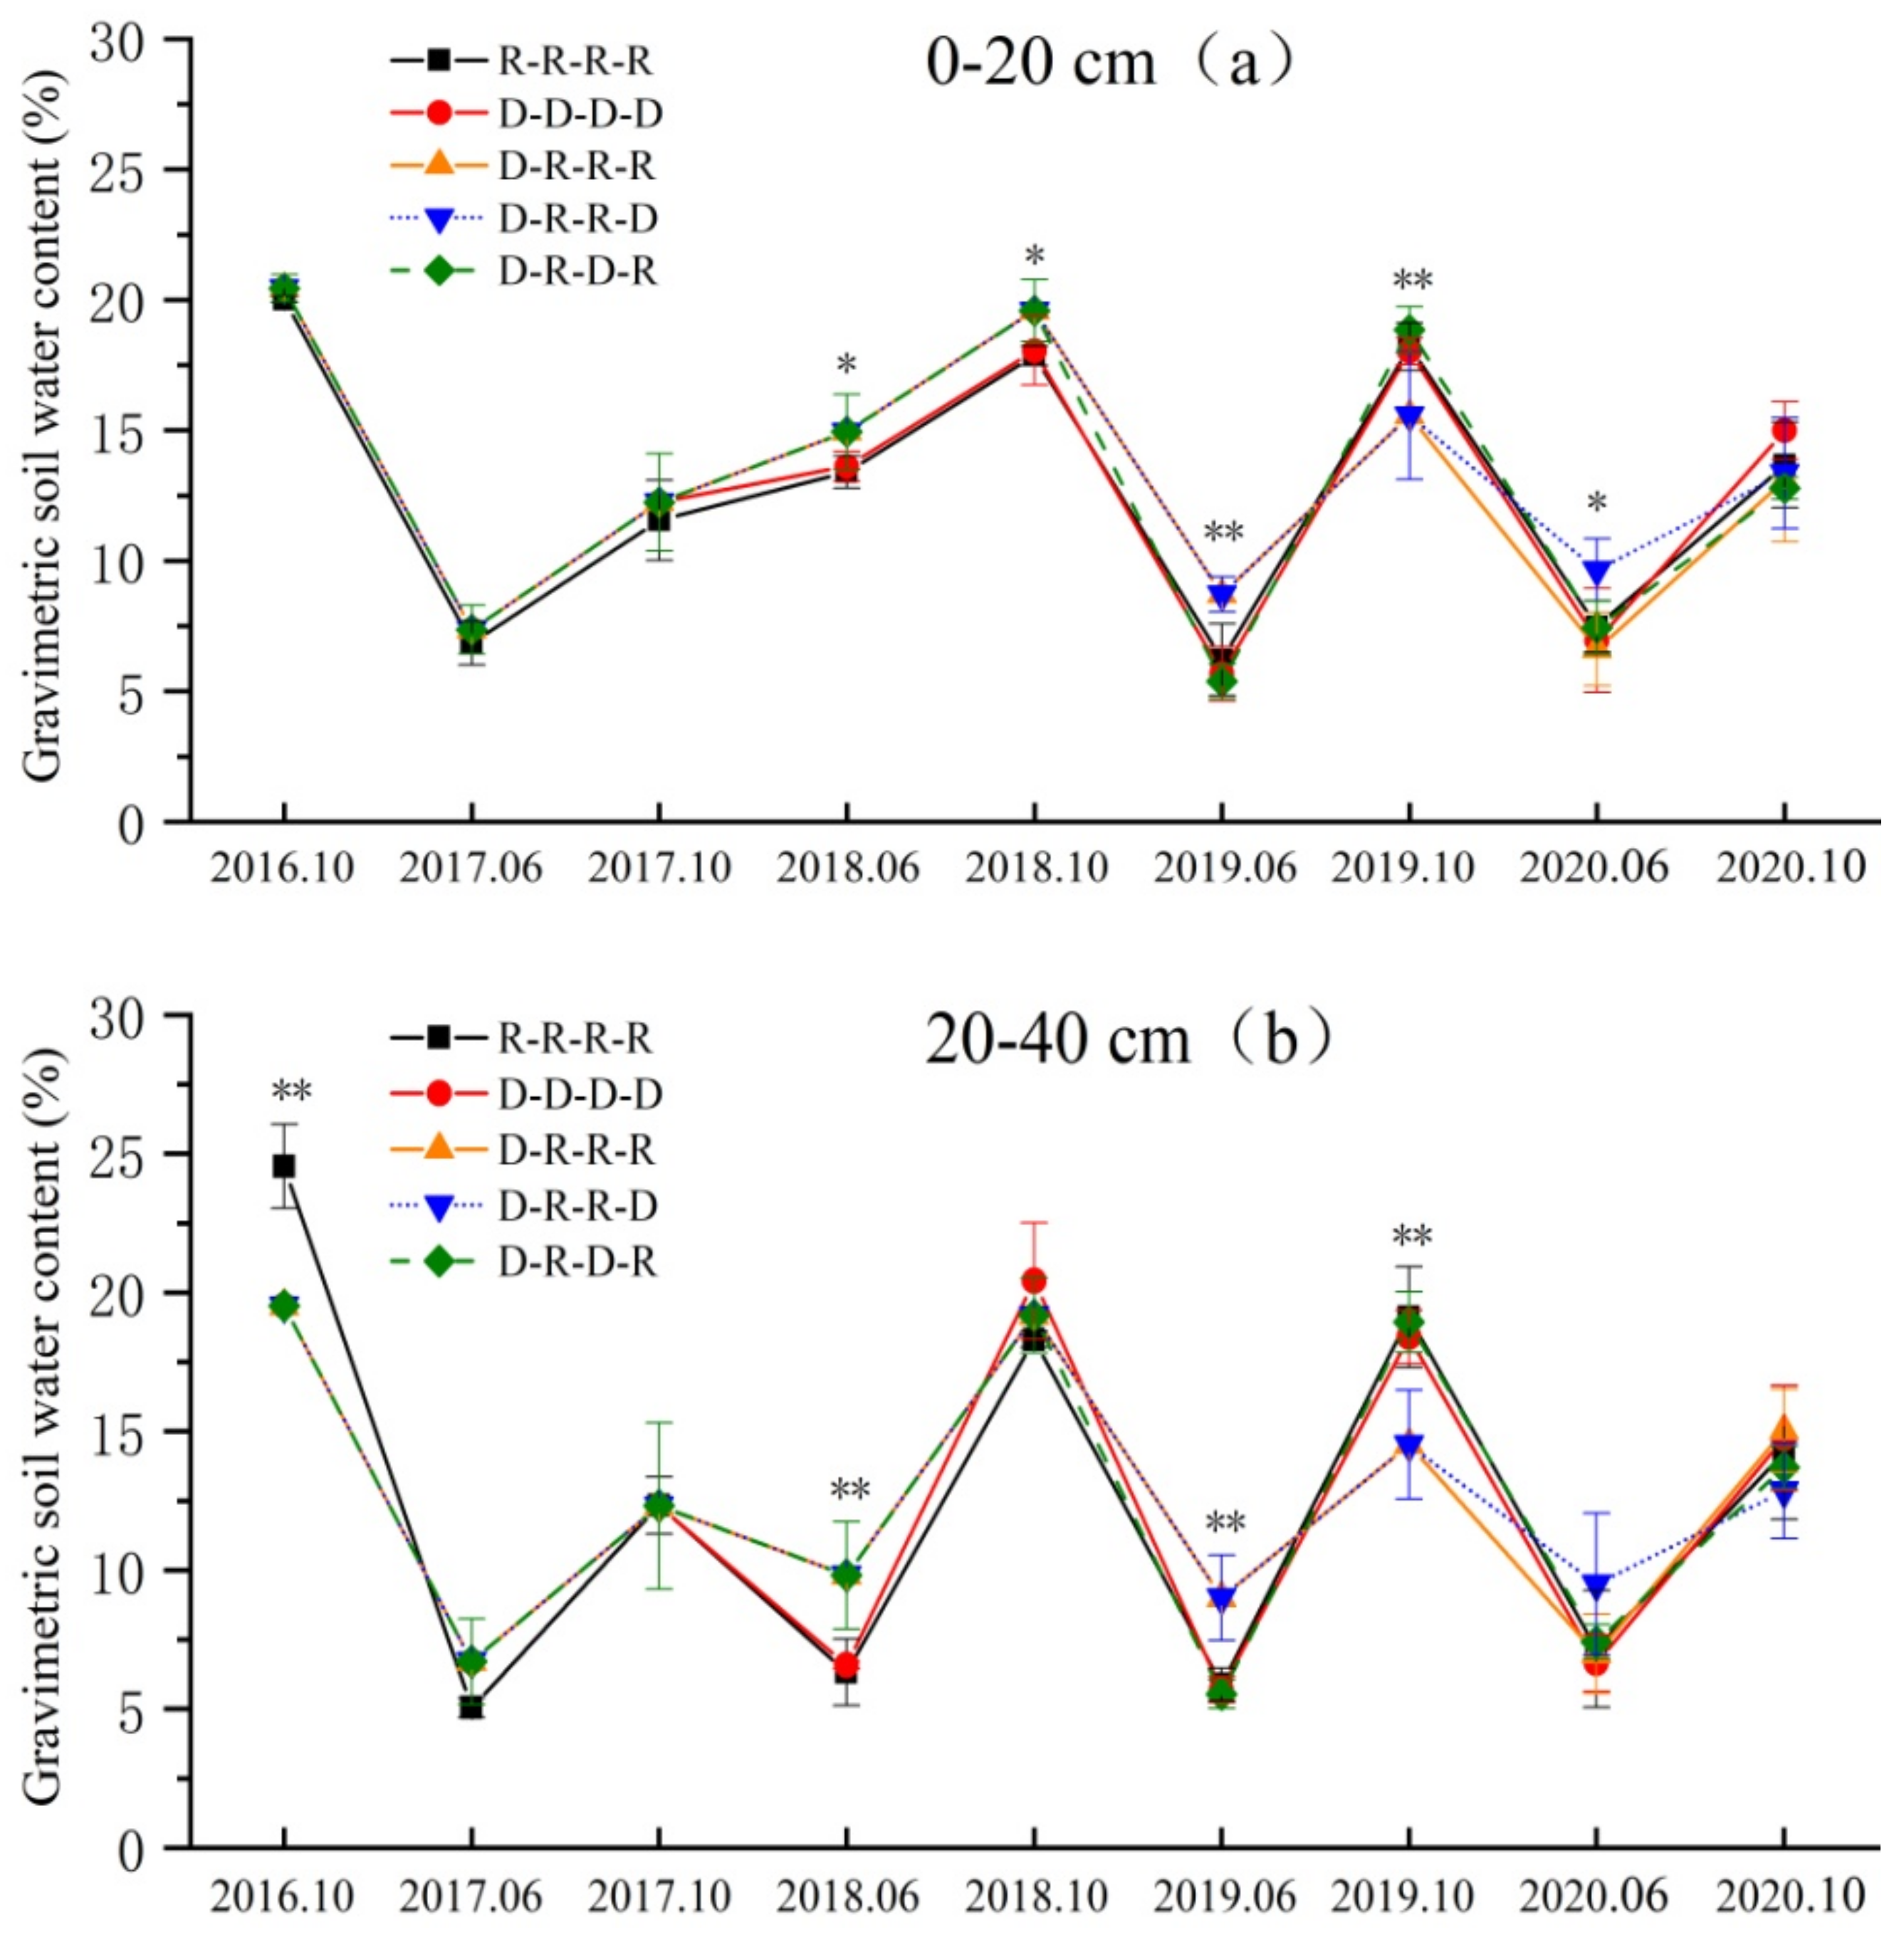
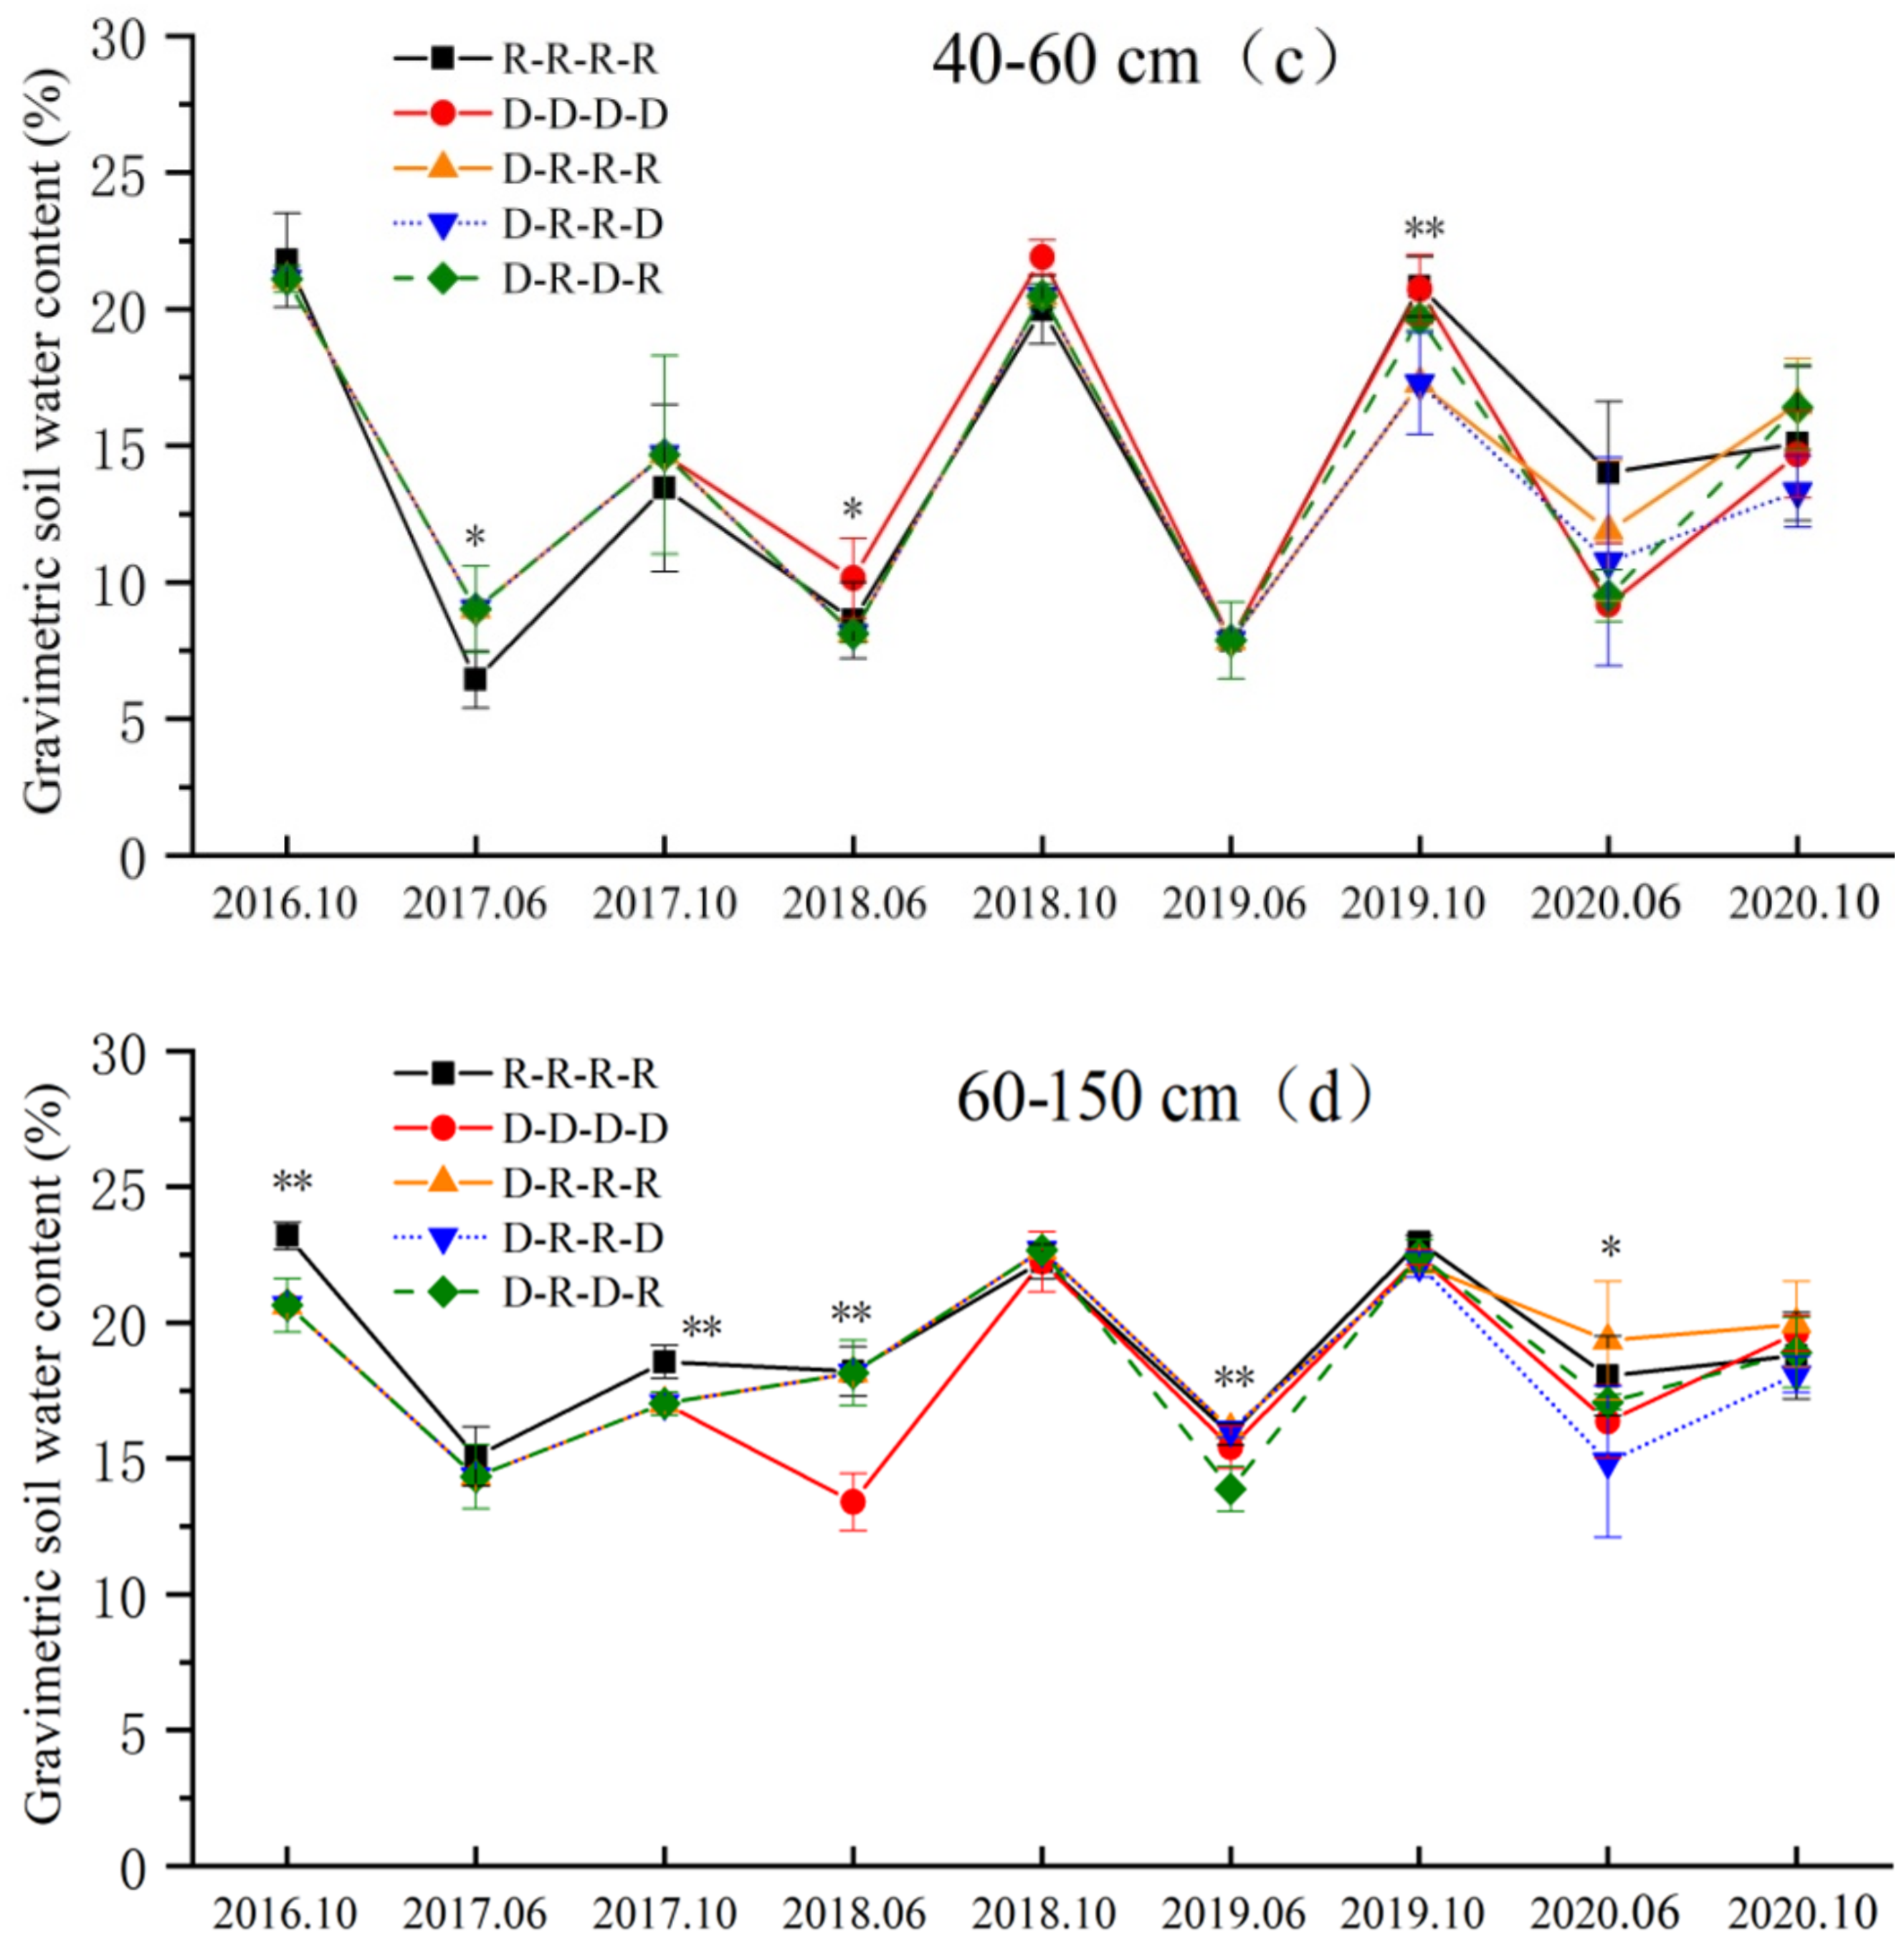
Figure 2 shows the dynamic changes in soil moisture at different soil depths at the harvesting of winter wheat and maize from 2016 to 2020. In the first year of introducing DT, there was no obvious difference in soil moisture between the RT and DT. However, when wheat was harvested in June 2018, the deep soil moisture (60–150 cm) under continuous DT was lower than under the other treatments. Due to less rainfall in 2019, soil moisture during that winter wheat season was the lowest of the four years. In 2020, the difference in soil moisture among different tillage combinations was significant. Continuous RT retained higher soil moisture at depths of 40–60 cm and 60–150 cm. In contrast, DT every two years had the highest soil water content at 0–20 cm and 20-40 cm but lower soil water content in the deep soil than the other treatments. The differences in soil moisture during the maize season were much smaller, due to the high seasonal rainfall.
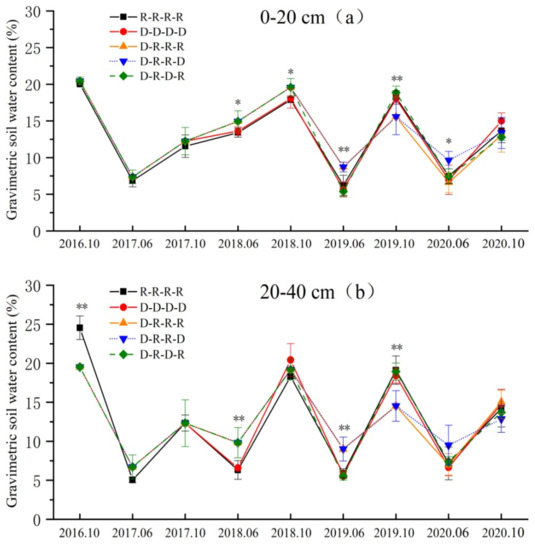
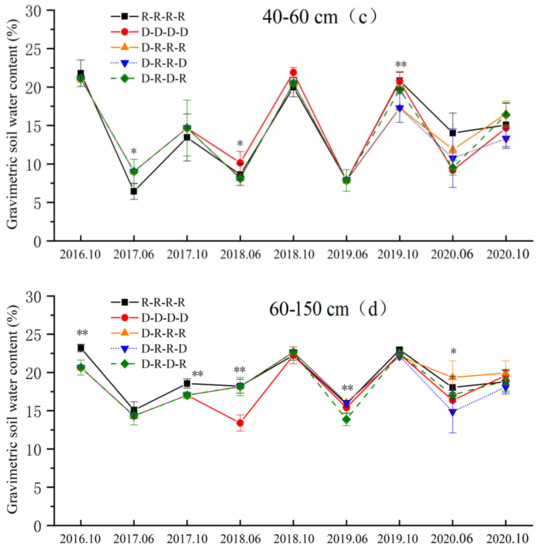
Figure 2.
The average soil water contents at harvesting of winter wheat and summer maize for different treatments at depths of 0–20, (a), 20–40, (b), 40–60, (c) and 60–150 cm, (d) from 2016 to 2020 (R-R-R-R representing rotary tillage in 2016-2020, D-D-D-D representing deep tillage in four years, and D-R-R-R, D-R-R-D and D-R-D-R representing the different combinations of deep tillage (D) and rotary tillage (R) in four years; LSD test: * mean significant differences at 0.05 level, ** mean significant differences at 0.01 level; bars representing the standard deviation of four replicates).
3.2. The Effects of Tillage Practices on Soil Properties
As shown in Table 4, there was no significant difference in soil bulk density (BD) among different treatments in the top 10 cm soil layer. In 2017, DT reduced the BD of the 20–30 cm soil layer as compared with RT. In the second year (2017–2018), continuous DT significantly reduced soil BD at depths of 10–30 cm. The effect of single deep tillage on BD was not significant after two years. In the third year, the BD of rotary tillage was slightly higher than that of the other tillage treatments, but the difference was not significant. In 2019–2020, twice DT within four years had relatively low average soil bulk densities. The results showed that different tillage methods and their combination did not affect the BD for the top 0–10 cm of the soil profile, but slightly affected the BD of the subsoil layers of 10–30 cm.

Table 4.
Soil bulk density (BD g cm−3) for different treatments from 2016 to 2020.
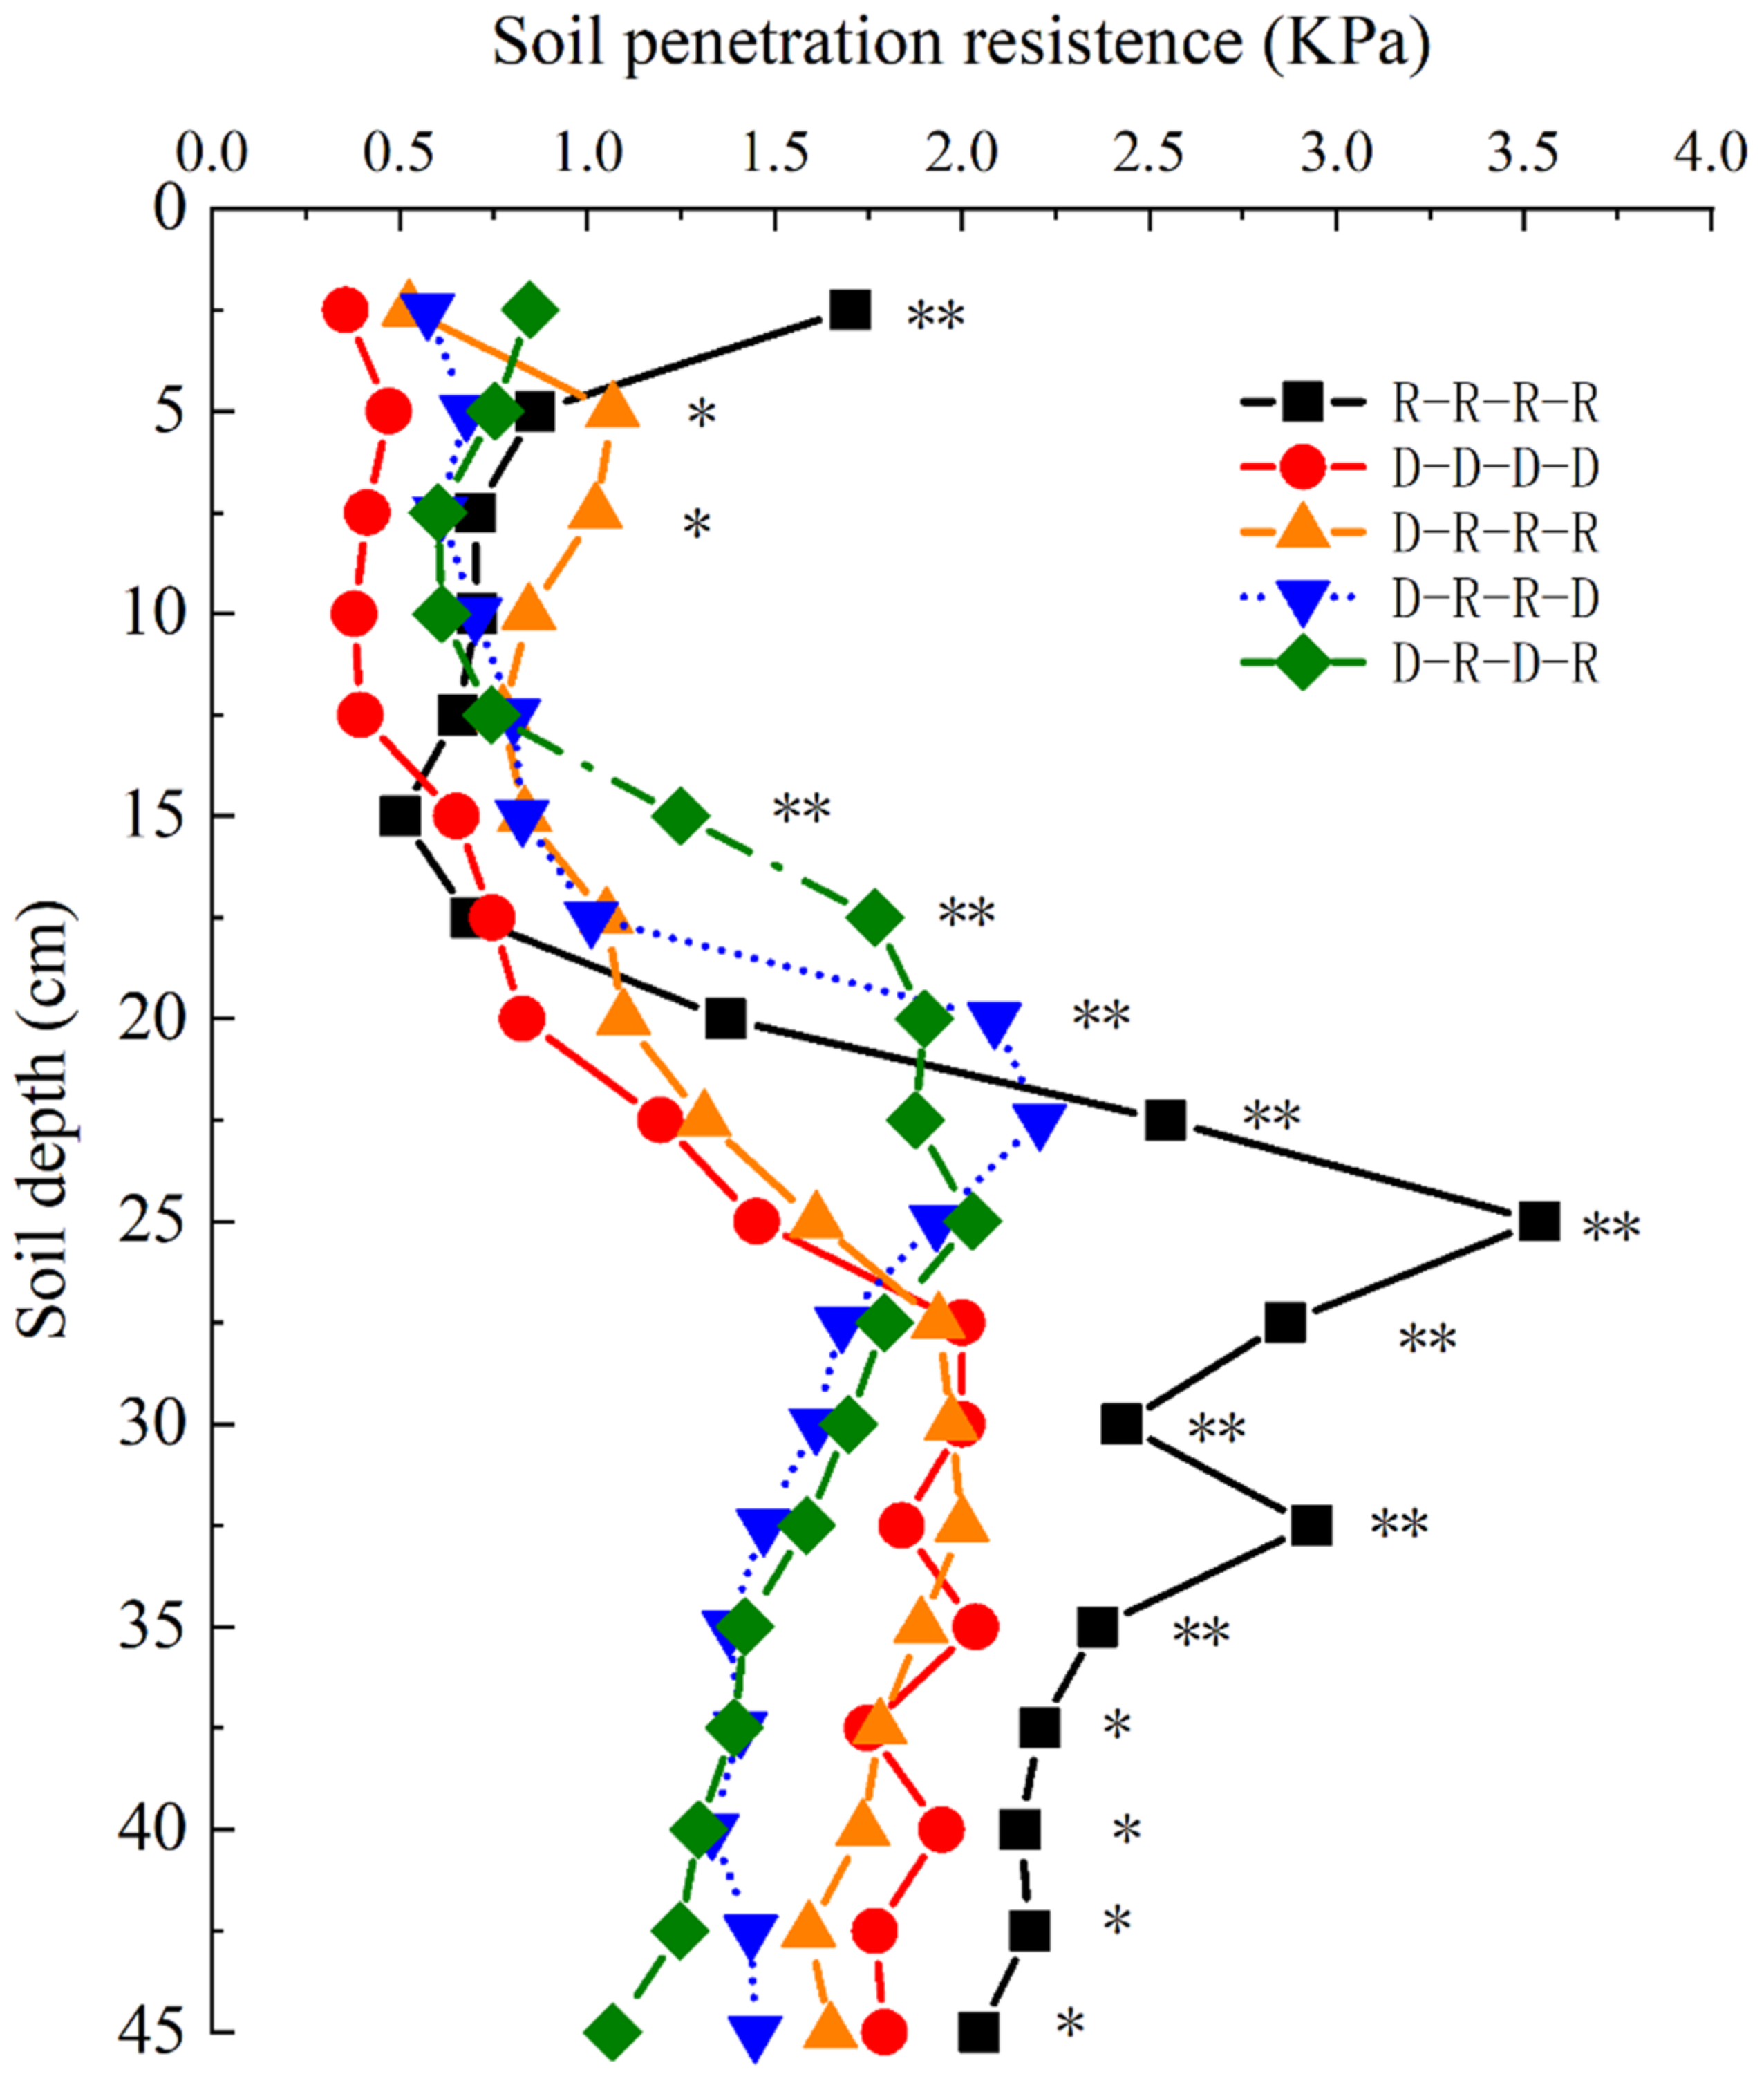
The effects of different tillage practices on soil penetration resistance in the third year are shown in Figure 3. For the continuous RT, soil penetration resistance at depths of 5.0–17.5 cm was quite low, and a sharp increase from 17.5 to 25.0 cm was observed. The continuous RT treatment had the highest penetration resistance as compared with other treatments for soils under 20 cm depth. For the continuous DT, soil penetration resistance slowly increased with the increase in soil depth, and the resistance values were the lowest among the treatments for the top 0–25 cm soil profile. For the 25–45 cm soil layer, soil penetration resistance of the treatments with twice DT was lower than that of the other tillage practices.
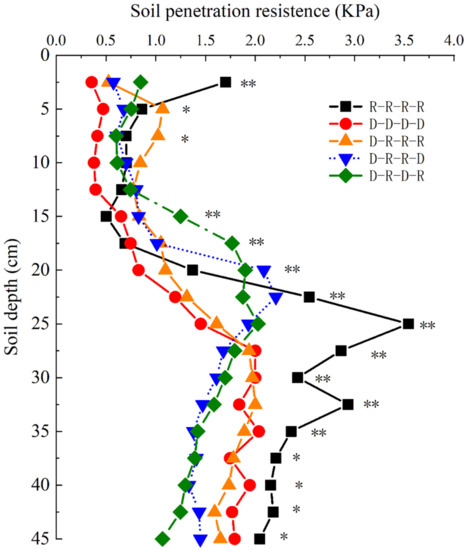
Figure 3.
Soil penetration resistance (kPa) for different treatments along the top 45 cm soil layer measured at the seedling stage of winter wheat in 2019 (R representing rotary tillage, D representing deep tillage, and their arrangements representing the different combinations in each year. LSD test: * mean significant differences at 0.05 level, ** mean significant differences at 0.01 level).
The soil organic matter, total N, available P and K contents after three years’ different combinations of tillage practices, are listed in Table 5. Compared with continuous RT, the inclusion of DT either continuously or intermittently increased the soil nutrients and organic matter contents for the 10–40 cm soil layer. The stratification rate under continuous RT was significantly higher than that of the other treatments. Adoption of deep tillage reduced the stratification of the soil nutrients, and the distribution of the nutrients in the top soil layer became more uniform.

Table 5.
Soil nutrient contents and stratification rates for different treatments sampled after maize harvesting in 2019.
3.3. The Effects of Tillage on Crop Root Growth and Soil Water Use
As shown in Table 6, there was no significant difference in total root length between the RT and DT treatments in the first year. In the second year, at the harvesting of winter wheat, the total root length under continuous DT was greater than that under intermittent DT and continuous RT. There was a sharp decrease in the root length at the 20 cm soil depth under continuous RT, resulting in a lower RLD in deep soil layers. On average, during 2017–2020, the RT treatment had the highest proportion of roots at soil depths of 0–20 cm, but the lowest proportion at soil depths of 60–150 cm. With the introduction of deep tillage, the reduction in soil resistance and bulk density in the 10–30 cm soil layers improved the root growth of winter wheat in the deep soil layers.

Table 6.
Total root length and their proportion at different soil depth at maturity of winter wheat from 2017 to 2020.
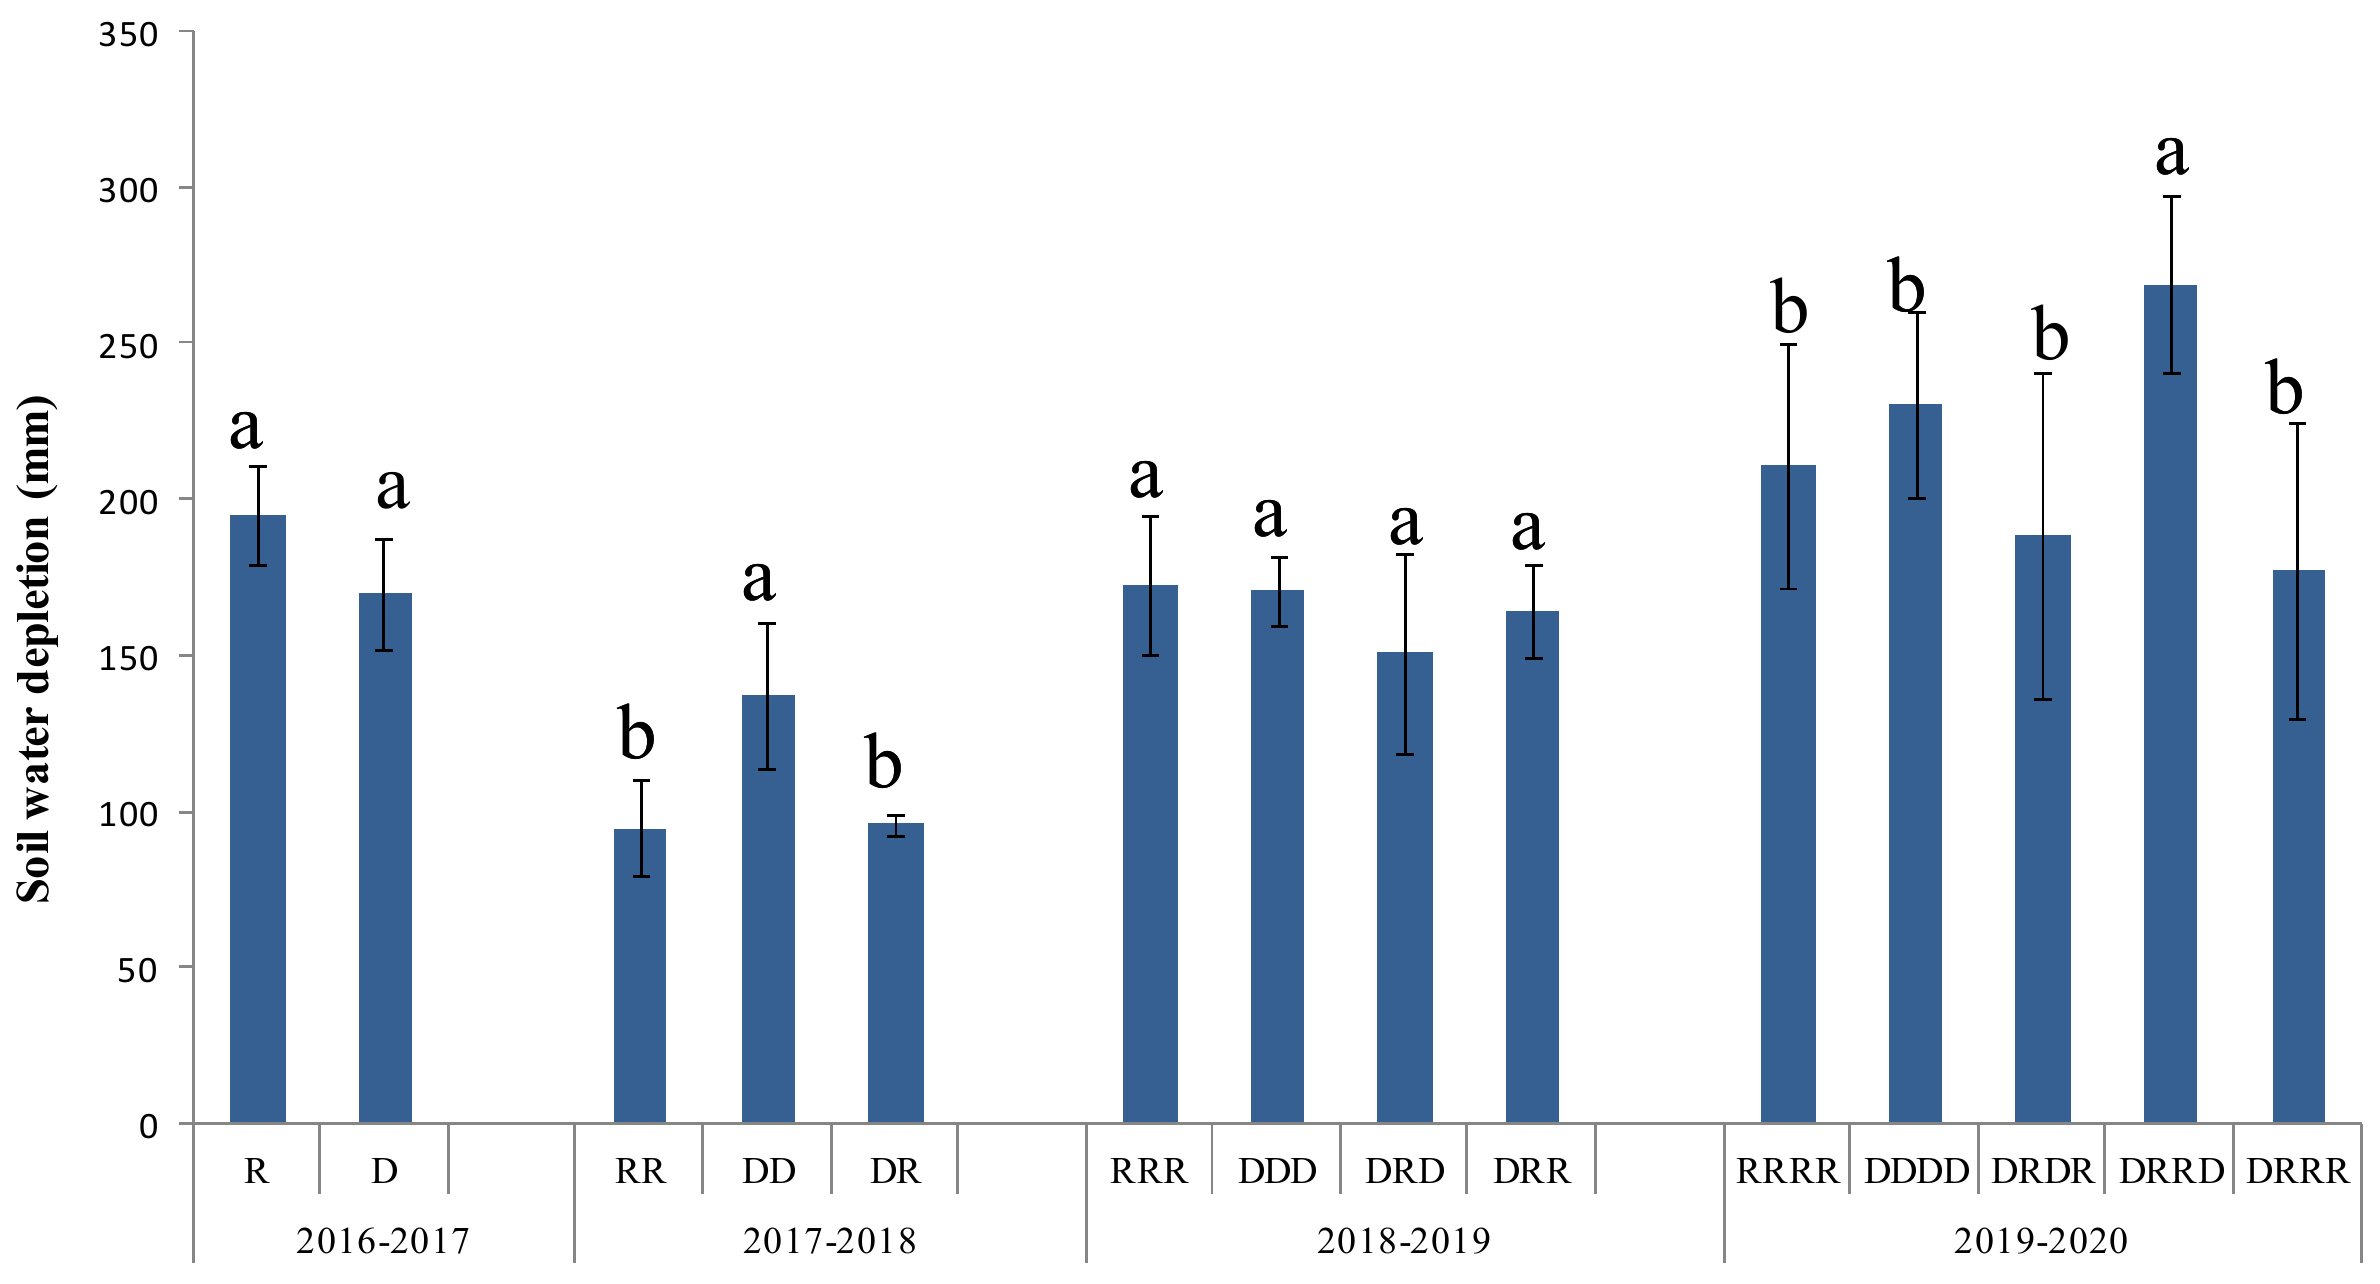
The soil water use during the wheat growing season from 2016 to 2020 is shown in Figure 4. From the second year, the soil water use under the treatments with DT was higher than without DT. In 2019–2020, the variation in soil water storage for the treatment DT every two years was the highest, which was consistent with the root distribution in the deep soil layers for different treatments. The increased growth of the root coupled with the introduction of deep tillage in the deep soil profile favored soil water uptake and resulted in high soil water consumption.
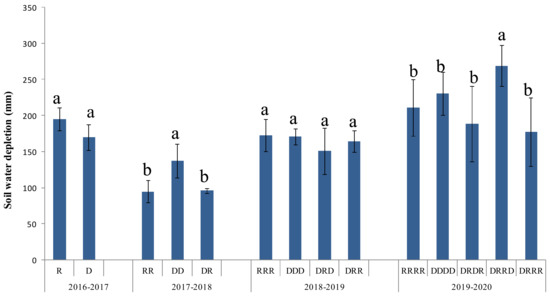
Figure 4.
Soil water depletion for different treatments during the winter wheat season of 2016 to 2020 (R representing rotary tillage, D representing deep tillage, and their arrangements representing the different combinations in each year. Different lowercase letters in the same column mean significant differences among treatments at 0.05 level. LSD test: p < 0.05).
3.4. The Effects of Tillage on Crop Production and Water Productivity
After long-term rotary tillage, the first introduction of deep tillage in 2016 significantly increased the grain production of winter wheat and summer maize (Table 7). Afterwards, no significant effect on maize yield was found among the different treatments [36]. After four years’ different combination of tillage practices, treatment with one DT every two years produced the highest annual yield, which was significantly higher than either the continuous RT or the higher frequency DT. During the four years, the lowest cumulative grain yield was from the continuous RT treatment, and the introduction of the DT with different frequencies all increased the production.

Table 7.
Grain yield and water productivity (WP) for winter wheat and summer maize for different treatments, from 2016 to 2020.
Similar effects as for grain production were observed on water productivity (WP) among different treatments during the four years. WP was significantly improved in the first year of introducing deep tillage, the same as the grain yield (Table 7). Continuous DT afterwards did not affect the WP of winter wheat and maize, and intermittently introducing DT benefited grain production and WP more, for both winter wheat and maize.
4. Discussion
4.1. Changes in Soil Physical Properties with Different Tillage Practices
The results from this study showed that soil bulk density was slightly reduced for the soil depth of 10–30 cm with the introduction of deep tillage into the continuous RT (Table 4). Accompanied by the reduction in bulk density, soil penetration resistance was also reduced (Figure 3). The results of DT on improvements of soil physical characteristics were in agreement with the results from previous studies [37,38]. In NCP, under long-term shallow tillage, such as minimum tillage and rotary tillage, soil compaction tends to develop and the plow bottom thickens [39]. It has been confirmed that once deep tillage can overcome the disadvantages caused by long-term minimum tillage, and improves soil physical properties [40]. The increased frequency of deep tillage did not result in further improvement in soil physical properties in this study (Table 4). Continuous deep tillage, due to its multiple tillage operations, also had a compaction effect on the soil, and the effect of reducing soil bulk density was not as effective as intermittent deep tillage. This is in consistent with the results of other studies [41]. Continuous DT would cause high disturbance to the soils, which destroys the formation of soil aggregates and decreases the soil microbial metabolic quotient, resulting in the rapid recycling of nutrients, crusting, and a reduction in water and air availability to roots.
The benefit of conservation tillage on SOC accumulation was demonstrated, and the increase in SOC generally occurred in the top soil layer [42,43]. The results of this study indicated that the introduction of deep tillage into the C-RT could affect the availability of soil nutrients by changing the distribution of straw in soil, and increasing SOC in deep soil layers (Table 5). DT increased the composition of soil microorganisms and increased the transformation potential of straw–C to SOC [44]. Studies by Gomez-Rey [45] and Peixoto [21] showed the same result, namely, that occasional deep tillage changes soil texture, increases aeration and the uniform distribution of nutrients, thus increasing soil enzyme activity. The increased nutrient contents in the deep soil layer and the improved soil physical structures would benefit crop growth of below- and above-ground parts.
4.2. Crops Response to Different Tillage Practices
Soil physical properties affect crop growth in both below- and above-ground parts. The results of this study indicated that introducing DT into the C-RT practice resulted in the improvement of soil quality which favored root growth (Table 6) and soil water uptake in the deep soil layers (Figure 4). Under deficit irrigation practice, the ability of plants to absorb deep soil water would promote crop production, which is related to root growth and distribution [46]. Deep tillage promoted deep root growth compared with rotary tillage, and the results from this study were similar with other previous research [47,48]. Although the total root weight and root length were similar among the different tillage practices, deep tillage increased the proportion of deep roots over the total roots (Table 6). Smaller root length density in deep soil is usually the limiting factor in utilizing soil water [46]. Therefore, the increased root growth in the deep soil layers with the introduction of deep tillage, improved the soil water utilization. It was reported that an extra 10.5 mm of additional subsoil water use increased the yield of winter wheat by 0.62 t/ha [29]. The improved yield under deep tillage in dry years in this study was related to the increase in root growth and soil water uptake in the deep soil layers (Figure 4). Efficient soil water utilization is quite important for high crop production under deficit irrigation [37].
The deep-tillage-promoted wheat yield in dry years was related not only to the increase in the amount of soil water utilization (Figure 4), but also to the timing of the soil water use. Crop production is related to the total water use in addition to the allocation of the crop water use between vegetative and reproductive stages under deficit irrigation [49]. Deep soil water is generally accessible only when roots reach the deep soil layer, which usually occurs during the late growing period of the crop, i.e., during the reproductive stages. The introduction of deep tillage in this study resulted in higher total biomass production and a higher harvest index (4.35%), which is generally related to a higher proportion of water use during reproductive stages [17,49]. Water productivity is positively related to harvest index, and improved WP was achieved with the increased soil water utilization [17]. The positive effects on grain yield and WP were more significant when DT was first introduced into minimum tillage in this study.
Deep tillage changed the soil nutrient distribution, resulting in more nutrients being distributed into the soil layers below the surface soil layer which might also contribute to the improvement in crop production. A rational combination of water and nutrients increases the water and nutrient use efficiency and creates better interaction of the two factors [50,51,52]. The surface soil layer is usually dry under deficit irrigation and less rainfall, which might interfere with the nutrient uptake by the root system. The re-distribution of nutrients downwards into soil layers with higher soil water contents could promote the nutrient uptake accompanying the soil water uptake [17].
The results of this study showed that the effects of tillage on summer maize were less than on winter wheat, which might be due to the high rainfall during the summer season, and that maize usually grows without water stress. The improvement in winter wheat yield diminished with the continuous implementation of deep tillage, due to the drying of the deep soil layers. Compared with conservation tillage, deep tillage reduced the straw coverage on the soil surface and increased soil porosity in the top soil layer, which would increase soil evaporation consumption [37]. This might be another reason that deep tillage did not always increase crop production under dry conditions. In arid areas, no-till preserves more soil moisture and achieves relatively higher crop yields [53]. Therefore, the selection of a tillage system requires consideration of soil characteristics, climate, and water supply conditions.
4.3. Agricultural Economy and Sustainability with Tillage Practices
Deep tillage usually costs more than conservation tillage [54]. The tillage cost in the regions of this study was 900 CNY/ha (USD 1 = CNY 6.3) for rotary and 1,350 CNY/ha for deep tillage. The average tillage cost of the five treatments during the four years were 900, 1,350, 1,125, 1,125 and 1,013 CNY/ha for C-RT, C-DT, DT every other year, DT every two years, and DT every three years, respectively. The corresponding average annual output for the five treatments were 15,867, 17,213, 16,581, 17,085 and 17,581 CNY/ha, respectively. The highest increase was DT on annual average output was the treatment of DT every three years. Continuous DT had the highest economic cost, yet it neither significantly improved the soil characteristics nor the crop yield in the four years. Therefore, it is not recommended in the experimental area. Compared with continuous DT, DT in two gap years of RT could not only gain a higher yield but also save input costs. Lower tillage frequency can obtain good economic benefits and achieve the purpose of saving energy consumption and increasing efficiency [55,56]. Deep tillage increases greenhouse gas emissions [57]. A sustainable tillage system considers both the inputs and maintenance of crop yields, in addition to environmental protection and increased efficient use of resources. In the future, carbon benefits, greenhouse effects, and energy consumption must be considered in the selection of future farming strategies [58].
5. Conclusions
Long-term continuous rotary tillage caused some negative influences on crop and soil in the NCP. The four year field experiment showed that introduction of deep tillage into the continuous rotary tillage reduced the soil bulk density and soil nutrient stratification rate which favored deep root growth. A higher root length density in deep soil promoted soil water use and improved crop production under limited water supply conditions. Therefore, the introduction of deep tillage into the continuous conservation tillage system in the NCP was necessary, which contributed to offset the disadvantages of long-term rotary tillage on soil compaction and soil nutrient stratification to benefit crop root growth and soil water utilization. Intermittent deep tillage performed better than continuous deep tillage, as the latter induced excessive disturbance to soil, and the soil properties did not continuously improve. The cost of continuous deep tillage was higher than other tillage practices. Intermittent deep tillage every three years produced the highest grain production and net income, which was recommended for the region where this study was carried out. This study provided an alternative tillage system to promote conservation agriculture. The experiments in this study were conducted under deficit irrigation scheduling. Under full irrigation, the optimum tillage method might be different. In addition, future soil management practices should consider both food production, energy efficiency and environmental influences to achieve sustainable development goals.
Author Contributions
Conceptualization, S.C.; methodology, S.C. and X.Z.; investigation, J.G.; formal analysis S.C. and L.L.; writing—original draft preparation, L.L.; writing—review and editing, S.C. and X.Z.; funding acquisition, X.Z. All authors have read and agreed to the published version of the manuscript.
Funding
This research was funded by National Key Research and Development Program of China (2017YFE0130500), and Heibei Key R&D Initiative Project (20326422D).
Data Availability Statement
Not applicable.
Conflicts of Interest
The authors declare no conflict of interest.
Abbreviations
MT, minimum tillage; DT, deep tillage; RT, rotary tillage; NCP, North China Plain; WP, water productivity; RLD, root length density; SWD, soil water depletion; ET, evapotranspiration; SOC, soil organic matter contents; BD, soil bulk density.
References
- Sun, H.; Zhang, X.; Wang, E.; Chen, S.; Shao, L. Quantifying the impact of irrigation on groundwater reserve and crop production–A case study in the North China Plain. Eur. J. Agron. 2015, 70, 48–56. [Google Scholar] [CrossRef]
- Liu, X.; Feike, T.; Shao, L.; Sun, H.; Chen, S.; Zhang, X. Effects of different irrigation regimes on soil compaction in a winter wheat–summer maize cropping system in the North China Plain. Catena 2016, 137, 70–76. [Google Scholar] [CrossRef]
- Liang, B.; Yang, X.; He, X.; Zhou, J. Effects of 17-year fertilization on soil microbial biomass C and N and soluble organic C and N in loessial soil during maize growth. Biol. Fertil. Soils 2010, 47, 121–128. [Google Scholar] [CrossRef]
- Yan, Z.; Zhang, X.; Rashid, M.A.; Li, H.; Jing, H.; Hochman, Z. Assessment of the sustainability of different cropping systems under three irrigation strategies in the North China Plain under climate change. Agric. Syst. 2019, 178, 102745. [Google Scholar] [CrossRef]
- Zhang, F.; Cui, Z.; Fan, M.; Zhang, W.; Chen, X.; Jiang, R. Integrated Soil-Crop System Management: Reducing Environmental Risk while Increasing Crop Productivity and Improving Nutrient Use Efficiency in China. J. Environ. Qual. 2011, 40, 1051–1057. [Google Scholar] [CrossRef]
- Chen, S.; Zhang, X.; Shao, L.; Sun, H.; Niu, J.; Liu, X. Effects of straw and manure management on soil and crop performance in North China Plain. Catena 2019, 187, 104359. [Google Scholar] [CrossRef]
- Liao, Y.; Wu, W.L.; Meng, F.Q.; Smith, P.; Lal, R. Increase in soil organic carbon by agricultural intensification in northern China. Biogeosciences 2015, 12, 1403–1413. [Google Scholar] [CrossRef] [Green Version]
- Rui, W.; Zhang, W. Effect size and duration of recommended management practices on carbon sequestration in paddy field in Yangtze Delta Plain of China: A meta-analysis. Agric. Ecosyst. Environ. 2010, 135, 199–205. [Google Scholar] [CrossRef]
- Bogunovic, I.; Pereira, P.; Kisic, I.; Sajko, K.; Sraka, M. Tillage management impacts on soil compaction, erosion and crop yield in Stagnosols (Croatia). Catena 2018, 160, 376–384. [Google Scholar] [CrossRef]
- Blanco-Canqui, H.; Mikha, M.M.; Presley, D.; Claassen, M.M. Addition of Cover Crops Enhances No-Till Potential for Improving Soil Physical Properties. Soil Sci. Soc. Am. J. 2011, 75, 1471–1482. [Google Scholar] [CrossRef]
- Sun, H.Y.; Wang, C.X.; Wang, X.D.; Rees, R.M. Changes in soil organic carbon and its chemical fractions under different tillage practices on loess soils of the Guanzhong Plain in north-west China. Soil Use Manag. 2013, 29, 344–353. [Google Scholar] [CrossRef]
- Sekaran, U.; Sagar, K.L.; Kumar, S. Soil aggregates, aggregate-associated carbon and nitrogen, and water retention as influenced by short and long-term no-till systems. Soil Tillage Res. 2020, 208, 104885. [Google Scholar] [CrossRef]
- Kan, Z.-R.; Liu, Q.-Y.; He, C.; Jing, Z.-H.; Virk, A.L.; Qi, J.-Y.; Zhao, X.; Zhang, H.-L. Responses of grain yield and water use efficiency of winter wheat to tillage in the North China Plain. Field Crop. Res. 2020, 249, 107760. [Google Scholar] [CrossRef]
- Skaalsveen, K.; Clarke, L. Impact of no-tillage on water purification and retention functions of soil. J. Soil Water Conserv. 2021, 76, 116–129. [Google Scholar] [CrossRef]
- Schneider, F.; Don, A.; Hennings, I.; Schmittmann, O.; Seidel, S.J. The effect of deep tillage on crop yield – What do we really know? Soil Tillage Res. 2017, 174, 193–204. [Google Scholar] [CrossRef]
- Kong, F.; Zhang, H.; Zhai, Y.; Yuan, J.; Chen, F. Effects of tillage methods on crop yield and water use characteristics in winter-wheat/summer-maize rotation system in the North China Plain. Chin. J. Eco-Agric. 2014, 22, 749–756. [Google Scholar]
- Liang, S.; Li, L.; An, P.; Chen, S.; Shao, L.; Zhang, X. Spatial soil water and nutrient distribution affecting the water productivity of winter wheat. Agric. Water Manag. 2021, 256, 107114. [Google Scholar] [CrossRef]
- Bengough, A.G.; McKenzie, B.M.; Hallett, P.D.; Valentine, T.A. Root elongation, water stress, and mechanical impedance: A review of limiting stresses and beneficial root tip traits. J. Exp. Bot. 2011, 62, 59–68. [Google Scholar] [CrossRef] [PubMed] [Green Version]
- Wiesmeier, M.; Hübner, R.; Barthold, F.; Spörlein, P.; Geuß, U.; Hangen, E.; Reischl, A.; Schilling, B.; von Lützow, M.; Kögel-Knabner, I. Amount, distribution and driving factors of soil organic carbon and nitrogen in cropland and grassland soils of southeast Germany (Bavaria). Agric. Ecosyst. Environ. 2013, 176, 39–52. [Google Scholar] [CrossRef]
- Gong, J.; Zheng, Z.; Zheng, B.; Liu, Y.; Hu, R.; Gong, J.; Li, S.; Tian, L.; Tian, X.; Li, J.; et al. Deep tillage reduces the dependence of tobacco (Nicotiana tabacum L.) on arbuscular mycorrhizal fungi and promotes the growth of tobacco in dryland farming. Can. J. Microbiol. 2022, 68, 203–213. [Google Scholar] [CrossRef]
- Peixoto, D.S.; da Silva, L.D.C.M.; De Melo, L.B.B.; Azevedo, R.P.; Araújo, B.C.L.; De Carvalho, T.S.; Moreira, S.G.; Curi, N.; Silva, B.M. Occasional tillage in no-tillage systems: A global meta-analysis. Sci. Total Environ. 2020, 745, 140887. [Google Scholar] [CrossRef] [PubMed]
- Hofmeijer, M.A.; Krauss, M.; Berner, A.; Peigné, J.; Mäder, P.; Armengot, L. Effects of Reduced Tillage on Weed Pressure, Nitrogen Availability and Winter Wheat Yields under Organic Management. Agronomy 2019, 9, 180. [Google Scholar] [CrossRef] [Green Version]
- Ding, Z.; Kheir, A.M.S.; Ali, O.A.M.; Hafez, E.M.; ElShamey, E.A.; Zhou, Z.; Wang, B.; Lin, X.; Ge, Y.; Fahmy, A.E.; et al. A vermicompost and deep tillage system to improve saline-sodic soil quality and wheat productivity. J. Environ. Manag. 2021, 277, 111388. [Google Scholar] [CrossRef]
- Eck, H.V.; Unger, P.W. Soil Profile Modification for Increasing Crop Production. In Advances in Soil Science; Springer: New York, NY, USA, 1985; Volume 1, pp. 65–100. [Google Scholar] [CrossRef]
- Jansson, J.K.; Hofmockel, K.S. Soil microbiomes and climate change. Nat. Rev. Microbiol. 2020, 18, 35–46. [Google Scholar] [CrossRef] [PubMed]
- Hou, D. Sustainable soil management and climate change mitigation. Soil Use Manag. 2021, 37, 220–223. [Google Scholar] [CrossRef]
- Sun, H.; Zhang, X.; Liu, X.; Liu, X.; Shao, L.; Chen, S.; Wang, J.; Dong, X. Impact of different cropping systems and irrigation schedules on evapotranspiration, grain yield and groundwater level in the North China Plain. Agric. Water Manag. 2018, 211, 202–209. [Google Scholar] [CrossRef]
- Gao, W.; Hodgkinson, L.; Jin, K.; Watts, C.; Ashton, R.W.; Shen, J.; Ren, T.; Dodd, I.C.; Binley, A.; Phillips, A.L.; et al. Deep roots and soil structure. Plant Cell Environ. 2015, 39, 1662–1668. [Google Scholar] [CrossRef] [Green Version]
- Kirkegaard, J.A.; Lilley, J.; Howe, G.N.; Graham, J.M. Impact of subsoil water use on wheat yield. Aust. J. Agric. Res. 2007, 58, 303–315. [Google Scholar] [CrossRef]
- Zhang, M.-M.; Dong, B.-D.; Qiao, Y.-Z.; Shi, C.-H.; Yang, H.; Wang, Y.-K.; Liu, M.-Y. Yield and water use responses of winter wheat to irrigation and nitrogen application in the North China Plain. J. Integr. Agric. 2018, 17, 1194–1206. [Google Scholar] [CrossRef] [Green Version]
- Jiao, X.; Maimaitiyiming, A.; Salahou, M.K.; Liu, K.; Guo, W. Impact of Groundwater Level on Nitrate Nitrogen Accumulation in the Vadose Zone Beneath a Cotton Field. Water 2017, 9, 171. [Google Scholar] [CrossRef] [Green Version]
- Kemper, W.D.; Chepil, W.S. Size Distribution of Aggregates. In Methods of Soil Analysis: Physical and Mineralogical Properties, Including Statistics of Measurement and Sampling; Black, C.A., Evans, D.D., White, J.L., Ensmin, E.L.E., Clark, F.E., Eds.; American Society of Agronomy: Madison, WI, USA, 1965; pp. 499–510. [Google Scholar]
- Franzluebbers, A. Soil organic matter stratification ratio as an indicator of soil quality. Soil Tillage Res. 2002, 66, 95–106. [Google Scholar] [CrossRef]
- Zhang, X.; Chen, S.; Sun, H.; Pei, D.; Wang, Y. Dry matter, harvest index, grain yield and water use efficiency as affected by water supply in winter wheat. Irrig. Sci. 2008, 27, 1–10. [Google Scholar] [CrossRef]
- Zhang, X.; Uwimpaye, F.; Yan, Z.; Shao, L.; Chen, S.; Sun, H.; Liu, X. Water productivity improvement in summer maize – A case study in the North China Plain from 1980 to 2019. Agric. Water Manag. 2021, 247, 106728. [Google Scholar] [CrossRef]
- Chen, S.; Yang, P.; Zhang, Y.; Dong, W.; Hu, C.; Oenema, O. Responses of Cereal Yields and Soil Carbon Sequestration to Four Long-Term Tillage Practices in the North China Plain. Agronomy 2022, 12, 176. [Google Scholar] [CrossRef]
- Jin, H.; Qingjie, W.; Hongwen, L.; Lijin, L.; Huanwen, G. Effect of alternative tillage and residue cover on yield and water use efficiency in annual double cropping system in North China Plain. Soil Tillage Res. 2009, 104, 198–205. [Google Scholar] [CrossRef]
- Martínez, I.; Chervet, A.; Weisskopf, P.; Sturny, W.G.; Etana, A.; Stettler, M.; Forkman, J.; Keller, T. Two decades of no-till in the Oberacker long-term field experiment: Part I. Crop yield, soil organic carbon and nutrient distribution in the soil profile. Soil Tillage Res. 2016, 163, 141–151. [Google Scholar] [CrossRef]
- Liu, Q.; Kan, Z.; He, C.; Zhang, H. Effects of Strategic Tillage on Soil Physicochemical Properties and Grain Yield in the North China Plain. Agronomy 2020, 10, 1167. [Google Scholar] [CrossRef]
- Kuhwald, M.; Blaschek, M.; Brunotte, J.; Duttmann, R. Comparing soil physical properties from continuous conventional tillage with long-term reduced tillage affected by one-time inversion. Soil Use Manag. 2017, 33, 611–619. [Google Scholar] [CrossRef]
- Wachendorf, C.; Stuelpnagel, R.; Wachendorf, M. Influence of land use and tillage depth on dynamics of soil microbial properties, soil carbon fractions and crop yield after conversion of short-rotation coppices. Soil Use Manag. 2017, 21, 38–388. [Google Scholar] [CrossRef]
- Bienes, R.; Marques, M.J.; Sastre, B.; García-Díaz, A.; Esparza, I.; Antón, O.; Navarrete, L.; Hernánz, J.L.; Sánchez-Girón, V.; Sánchez del Arco, M.J.; et al. Tracking Changes on Soil Structure and Organic Carbon Sequestration after 30 Years of Different Tillage and Management Practices. Agronomy 2021, 11, 291. [Google Scholar] [CrossRef]
- Li, X.; Han, H.; Ning, T.; Shen, Y.; Lal, R. Variations of SOC and MBC observed in an incubated brown loam soil managed under different tillage systems for 12 years. Soil Use Manag. 2019, 35, 585–594. [Google Scholar] [CrossRef]
- Dai, H.; Zhang, H.; Li, Z.; Liu, K.; Zamanian, K. Tillage Practice Impacts on the Carbon Sequestration Potential of Topsoil Microbial Communities in an Agricultural Field. Agronomy 2020, 11, 60. [Google Scholar] [CrossRef]
- Gómez-Rey, M.X.; García-Marco, S.; Gonzalez-Prieto, S. Soil P and cation availability and crop uptake in a forage rotation under conventional and reduced tillage. Soil Use Manag. 2014, 30, 445–453. [Google Scholar] [CrossRef] [Green Version]
- Zhang, X.; Pei, D.; Chen, S. Root growth and soil water utilization of winter wheat in the North China Plain. Hydrol. Process. 2004, 18, 2275–2287. [Google Scholar] [CrossRef]
- Lv, G.; Han, W.; Wang, H.; Bai, W.; Song, J. Effect of subsoiling on tillers, root density and nitrogen use efficiency of winter wheat in loessal soil. Plant Soil Environ. 2019, 65, 456–462. [Google Scholar] [CrossRef] [Green Version]
- Munkholm, L.J.; Hansen, E.M.; Olesen, J.E. The effect of tillage intensity on soil structure and winter wheat root/shoot growth. Soil Use Manag. 2008, 24, 392–400. [Google Scholar] [CrossRef]
- Zhang, X.; Wang, Y.; Sun, H.; Chen, S.; Shao, L. Optimizing the yield of winter wheat by regulating water consumption during vegetative and reproductive stages under limited water supply. Irrig. Sci. 2012, 31, 1103–1112. [Google Scholar] [CrossRef]
- De la Riva, E.G.; Prieto, I.; Marañón, T.; Pérez-Ramos, I.M.; Olmo, M.; Villar, R. Root economics spectrum and construction costs in Mediterranean woody plants: The role of symbiotic associations and the environment. J. Ecol. 2021, 109, 1873–1885. [Google Scholar] [CrossRef]
- Li, S.-X.; Wang, Z.-H.; Malhi, S.S.; Li, S.-Q.; Gao, Y.-J.; Tian, X.-H. Nutrient and water management effects on crop production, and nutrient and water use efficiency in dryland areas of china. Adv. Agron. 2009, 102, 223–265. [Google Scholar]
- Yan, J.; Bogie, N.A.; Ghezzehei, T.A. Root uptake under mismatched distributions of water and nutrients in the root zone. Biogeosciences 2020, 17, 6377–6392. [Google Scholar] [CrossRef]
- Fatumah, N.; Tilahun, S.A.; Mohammed, S. Water use efficiency, grain yield, and economic benefits of common beans (Phaseolus vulgaris L.) under four soil tillage systems in Mukono District, Uganda. Heliyon 2021, 7, e06308. [Google Scholar] [CrossRef]
- Teklewold, H.; Mekonnen, A. The tilling of land in a changing climate: Empirical evidence from the Nile Basin of Ethiopia. Land Use Policy 2017, 67, 449–459. [Google Scholar] [CrossRef]
- Abdalla, M.; Osborne, B.; Lanigan, G.; Forristal, D.; Williams, M.; Pea, S. Conservation tillage systems a review of its consequences for greenhouse gas emissions. Soil Use Manag. 2013, 29, 199–209. [Google Scholar] [CrossRef]
- Kan, Z.-R.; Virk, A.L.; He, C.; Liu, Q.-Y.; Qi, J.-Y.; Dang, Y.P.; Zhao, X.; Zhang, H.-L. Characteristics of carbon mineralization and accumulation under long-term conservation tillage. Catena 2020, 193, 104636. [Google Scholar] [CrossRef]
- Wang, Y.; Ying, H.; Yin, Y.; Wang, H.; Cui, Z. Benefits and Trade-Offs of Tillage Management in China: A Meta-Analysis. Agronomy 2021, 11, 1495. [Google Scholar] [CrossRef]
- Sandén, T.; Spiegel, H.; Stüger, H.-P.; Schlatter, N.; Haslmayr, H.-P.; Zavattaro, L.; Grignani, C.; Bechini, L.; D′hose, T.; Molendijk, L.; et al. European long-term field experiments: Knowledge gained about alternative management practices. Soil Use Manag. 2018, 34, 167–176. [Google Scholar] [CrossRef]
Publisher’s Note: MDPI stays neutral with regard to jurisdictional claims in published maps and institutional affiliations. |
© 2022 by the authors. Licensee MDPI, Basel, Switzerland. This article is an open access article distributed under the terms and conditions of the Creative Commons Attribution (CC BY) license (https://creativecommons.org/licenses/by/4.0/).

