Article

Phenotypic Correlation Analysis in F2 Segregating Populations of Gossypiumhirsutum and Gossypiumarboreum for Boll-Related Traits

1
State Key Laboratory of Cotton Biology, Institute of Cotton Research, Chinese Academy of Agricultural Sciences, Anyang 455000, China
2
Department of Plant Breeding and Genetics, Faculty of Agricultural Sciences, Ghazi University, Dera Ghazi Khan 32200, Punjab, Pakistan
3
Department of Plant Protection, Faculty of Agricultural Sciences, Ghazi University, Dera Ghazi Khan 32200, Punjab, Pakistan
4
Department of Plant Breeding and Genetics, The University of Haripur, Haripur 22620, Khyber Pakhtunkhwa, Pakistan
5
Department of Botany, Hazara University, Mansehra 21120, Khyber Pakhtunkhwa, Pakistan
6
Department of Applied Entomology and Zoology, Faculty of Agriculture (EL-Shatby), Alexandria University, Alexandria 21545, Egypt
7
Cotton Laboratory, Plant Breeding and Genetics Division, Nuclear Institute for Agriculture and Biology (NIAB), Faisalabad 38000, Punjab, Pakistan
*
Author to whom correspondence should be addressed.
Agronomy 2022, 12(2), 330; https://doi.org/10.3390/agronomy12020330
Submission received: 18 December 2021 / Revised: 19 January 2022 / Accepted: 24 January 2022 / Published: 27 January 2022

Abstract

:
Cotton is an important agro-industrial crop across the globe. Improving the fiber quality and yield potential of cotton are major commercial targets for cotton breeders. The cotton lint yield is computed by multiplying three fundamental yield constituents: average boll weight, boll number per unit ground area, and lint percentage. The cotton species Gossypium arboreum exhibits a wide range of desirable traits, which are absent in the congener Gossypium hirsutum. Four parental lines of G. hirsutum and G. arboreum, with significant differences in boll-related traits, were used to develop the following four F2 populations: Mei Zhongmian × Chimu Heizi (MC), Mei Zhongmian × L-02292-3 (ML), Dixie king × Suyuan 04-44 (DS), and Dixie king × Pamuk (DP), in order to study complex traits, such as boll weight (BW) (g), lint percentage (LP) (%), boll upper width (BUW), boll medium width (BMW), boll lower width (BLU), and boll length (BL) (mm). In segregation populations, extensive phenotypic differences and transgressive segregation were observed. The results show that most of the correlation clusters were negatively associated with boll weight and lint percentage. The positive correlation clusters were observed among boll upper width (BUW), boll medium width (BMW), boll lower width (BLW), and boll length (BL). Seven of the twenty-four extracted principal components had eigenvalues > 1. This accounted for 62.2% of the difference between the four F2 populations. Principal component 1 accounted for 15.1% of the overall variability. The variation in principal component 1 was mainly attributed to boll lower width (BLW), boll medium width (BMW), boll upper width (BUW), boll length (BL), and boll weight (BW) of the ML population. The heritability estimates varied between high, medium, and low for various traits among the studied F2 populations. Interestingly, all traits demonstrated low genetic advance, which indicates that non-additive genes controlled these characters and that direct selection for these traits is not beneficial. The outcome of the present investigation will help to develop cotton cultivars with improved boll weight and lint percentage.

1. Introduction

Cotton is a globally valuable, synthetic cash crop known for its natural fibers [1]. Gossypium is a genus with seven tetraploid (2n = 4x = 52) and forty-five diploid (2n = 2x = 26) species, such as G. herbaceum L. (A1), G. arboreum L. (A2), G. hirsutum L. (AD1), and G. barbadense L. (AD2) [2,3,4]. Upland cotton (Gossypium hirsutum L.) is a commonly cultivated cotton species, accounting for 95% of worldwide cotton production owing to its high yielding capacity [5,6]. The economic and environmental adaptability of G. hirsutum has been influenced by artificial breeding and long-term natural selection, and its production continues to increase globally across a wide range of latitudes [7]. Additionally, Gossypium arboretum L. was introduced from India and later domesticated and cultivated in China for nearly 2000 years. Currently, China is the world’s largest cotton producer and raw cotton consumer, accounting for one-quarter of global cotton production and one-third of global cotton consumption [8]. The species G. arboreum exhibits a wide range of desirable traits for cotton cultivation, which are absent in upland cotton. The global significance of the cotton crop has prompted plant breeders to enhance the genetic infrastructure of the cotton plant [5]. Moreover, G. arboreum holds the ability to display drought resistance, tolerance to diseases, and is effectively adapted to low input and dry land conditions [9]. Therefore, G. arboretum can serve as a precious resource for future hybridization programs. The Cotton Germplasm Center at the Chinese Academy of Agricultural Science has collected and conserved over 300 G. arboreum accessions [10].
Through interspecific hybridization, the cotton crop has been improved in terms of both biotic and abiotic stress tolerance and fiber quality traits. Cotton breeders have performed significant crosses among wild accessions and upland cotton to produce offspring with high fiber content [11,12,13]. Furthermore, to meet the new challenges posed by the textile industry, genetic changes effecting cotton fiber yield and quality traits have been achieved through long-term selective and artificial breeding [14]. Improving cotton fiber production and potential productivity is a key commercial target for cotton breeders. Cotton lint yield is computed via the multiplication of three fundamental yield constituents: average BW, bolls number per unit ground area, and LP [15]. For cotton cultivars, LP is a significant yield-related attribute and a major economic indicator [16,17]. Furthermore, the main contributor for lint yield is boll number per unit land area, followed by seed number per boll and lint mass per seed [18]. Improved lint yield has been achieved with low seed counts, ensuring that a high percentage of lint can be produced when limited by seed number [16]. Cotton bolls can also be used as fiber estimation markers, in order to infer the genetic and physiological processes underlying yield and plant growth, since they are linked to productivity. Thus, the profiling of high-throughput sequencing data for cotton bolls plays an important role in advancing modern cultivars and the efficiency of management strategies. The conventional quantification approaches of cotton bolls are laborious and time-consuming. Therefore, new approaches can enhance the throughput phenotyping potential of cotton bolls [19].
Correlation analysis has shown positive associations between seed cotton yield, boll weight, BL, BCW, BD, and bolls per plant [20]. Moreover, boll number and size have a significant impact on the final cotton yield, whereas the shape of the boll determines its fiber quality. Cotton breeders are interested in using diploid genetic material to enhance the production of cultivated tetraploid cotton resistant to both biotic and abiotic stresses. On a global level, especially in China, breeders are working to develop cultivable diploid cotton with premium characteristics, i.e., BW, LP, and other important fiber quality features. Thus far, numerous cultivated diploid cotton accessions have improved and enhanced the invaluable genetic resources used in cotton biotechnological research. In the present study, we investigated two within-boll yield components, BW and LP, and four boll morphological traits, boll length, and upper, medium, and lower boll width, to examine the diversity among cotton cultivars produced through intraspecific hybridization.

2. Materials and Methods

2.1. Parental Plant Material and Hybridization

Two parental lines from G. hirsutum and G. arboreum were used to develop F2 populations displaying major changes in boll-related traits. Selected accessions were preserved at China National GeneBank, Institute of Cotton Research, Chinese Academy of Agriculture Sciences, Anyang, Henan, China. Four crosses were developed, i.e., two crosses for G. arboretum (ID-MC and ML); two crosses for G. hisutum (DS and DP). For all four crosses, lines with big bolls were used as female parents, and lines with small bolls were used as male parents. The list of crosses is shown in Table 1.

2.2. Planting and Phenotyping

The parental genotypes of G. hirsutum and G. arboretum, and their F2 populations, were sown at the Institute of Cotton Research in Anyang, Henan, China, between mid-April and late October, the normal cotton growing season (near yellow River), during years 2019 and 2020. The longitude and latitude coordinates of the site are 114.07° E and 35.85° N, respectively. In the experimental area, all accessions were cultivated in three replicates using a randomized complete block pattern. Each entry plot was 7 × 3 m in size, with row-to-row and plant-to-plant distances of 76 and 30 cm, respectively. Normal agronomic practices were undertaken and same scoring parameters were utilized in both years for the collection of phenotypic data.

2.3. Sample Preparation for Hybridizations

We investigated six traits, four agronomic boll morphological traits and two economic yield-related traits, of four cotton species, including two parents of G. hirsutum and two parents of G. arboreum, the sexes of which were based on boll weight; other associated traits were used for the evaluation of F2 generations developed through intraspecific hybridization. The female parents were superior in their characteristics, i.e., BW, BW, BL, and LP. The male parents possessed extremely low BW, LP, and morphological traits (Table 1 and Table 2). The phenotypic data for traits under investigation were recorded upon reaching harvest level.

2.4. Measurement of Traits

Six plants were selected for each replication to evaluate the following boll-related traits: BW (g); BUW, BUM, and BLW (mm); top-to-bottom length of cotton boll (BL, mm); LP (%). The weighed bolls were collected from central fruiting branches.

2.5. Statistical Analysis

To compute the correlation of traits under observation, XLSTAT and “R” software (package “corrplot”) were used. Minitab 18 was used to conduct the principal component analysis (PCA). The Dewey and Lu formula was used to calculate correlation coefficients [21]. Adopting the method of Fruchterman and Reingold [22], we generated a force-directed design by following the algorithm for the distance among traits, from which we derived proportional absolute correlation values. Finally, positive correlations were illustrated in pink, while negative correlations were illustrated in blue. Thicker lines show stronger correlations among traits, whereas thinner lines represent weaker correlations among the traits. The correlation network procedure was undertaken using Cytoscape bioinformatics software.

3. Results

3.1. Variation in Phenotypic Traits of Four F2 Populations

We investigated four crosses, i.e., two crosses for G. arboretum (ID-MC and ML) and two for G. hirsutum (DS and DP). For all four crosses, lines with large boll sizes were used as female parents, and lines with small boll sizes were considered as male parents. In G. hirsutum, small boll parents were nearly half the weight of lines with larger bolls; in G. arboreum, the boll weights of small boll parents were nearly one third of the large boll lines. Thus, the F2 populations exhibited more diversity in boll weight.
Numerous divergent phenotypes and transgressive segregants were noticed in the F2 populations (Table 3). Transgressive segregation occurs when certain individuals of the next generation have phenotypic values greater than those of their superior parent [23]. The coefficients of variation (CV) indicated different levels of variability for the six traits, i.e., LP, BW, BUW, BMW, BLW, and BL (Table 3). The CV values for LP were low (G. arboreum: 7.84–11.18%, G. hirsutum: 9.02–9.29%), whereas BW had high (G. arboreum: 17.18–21.16%, G. hirsutum: 15.24–16.54%) CV values. Among the traits BUW, BMW, BLW, and BL, the CV values were lowest for BLW (6.78–7.79%) in G. hirsutum and highest for BUW (10.91–9.14%) in G. arboreum. On comparing the G. arboreum and G. hirsutum populations, it was observed in G. arboreum populations that BW had the highest CV values, 21.67 and 17.17, for both ML and MC crosses, respectively. Similarly, in G. hirsutum, BW had the highest CV values, 16.54 and 15.24, for both DS and DP, respectively. Moreover, it was also recorded that crosses derived from G. arboreum had higher CV values than those from G. hirsutum.

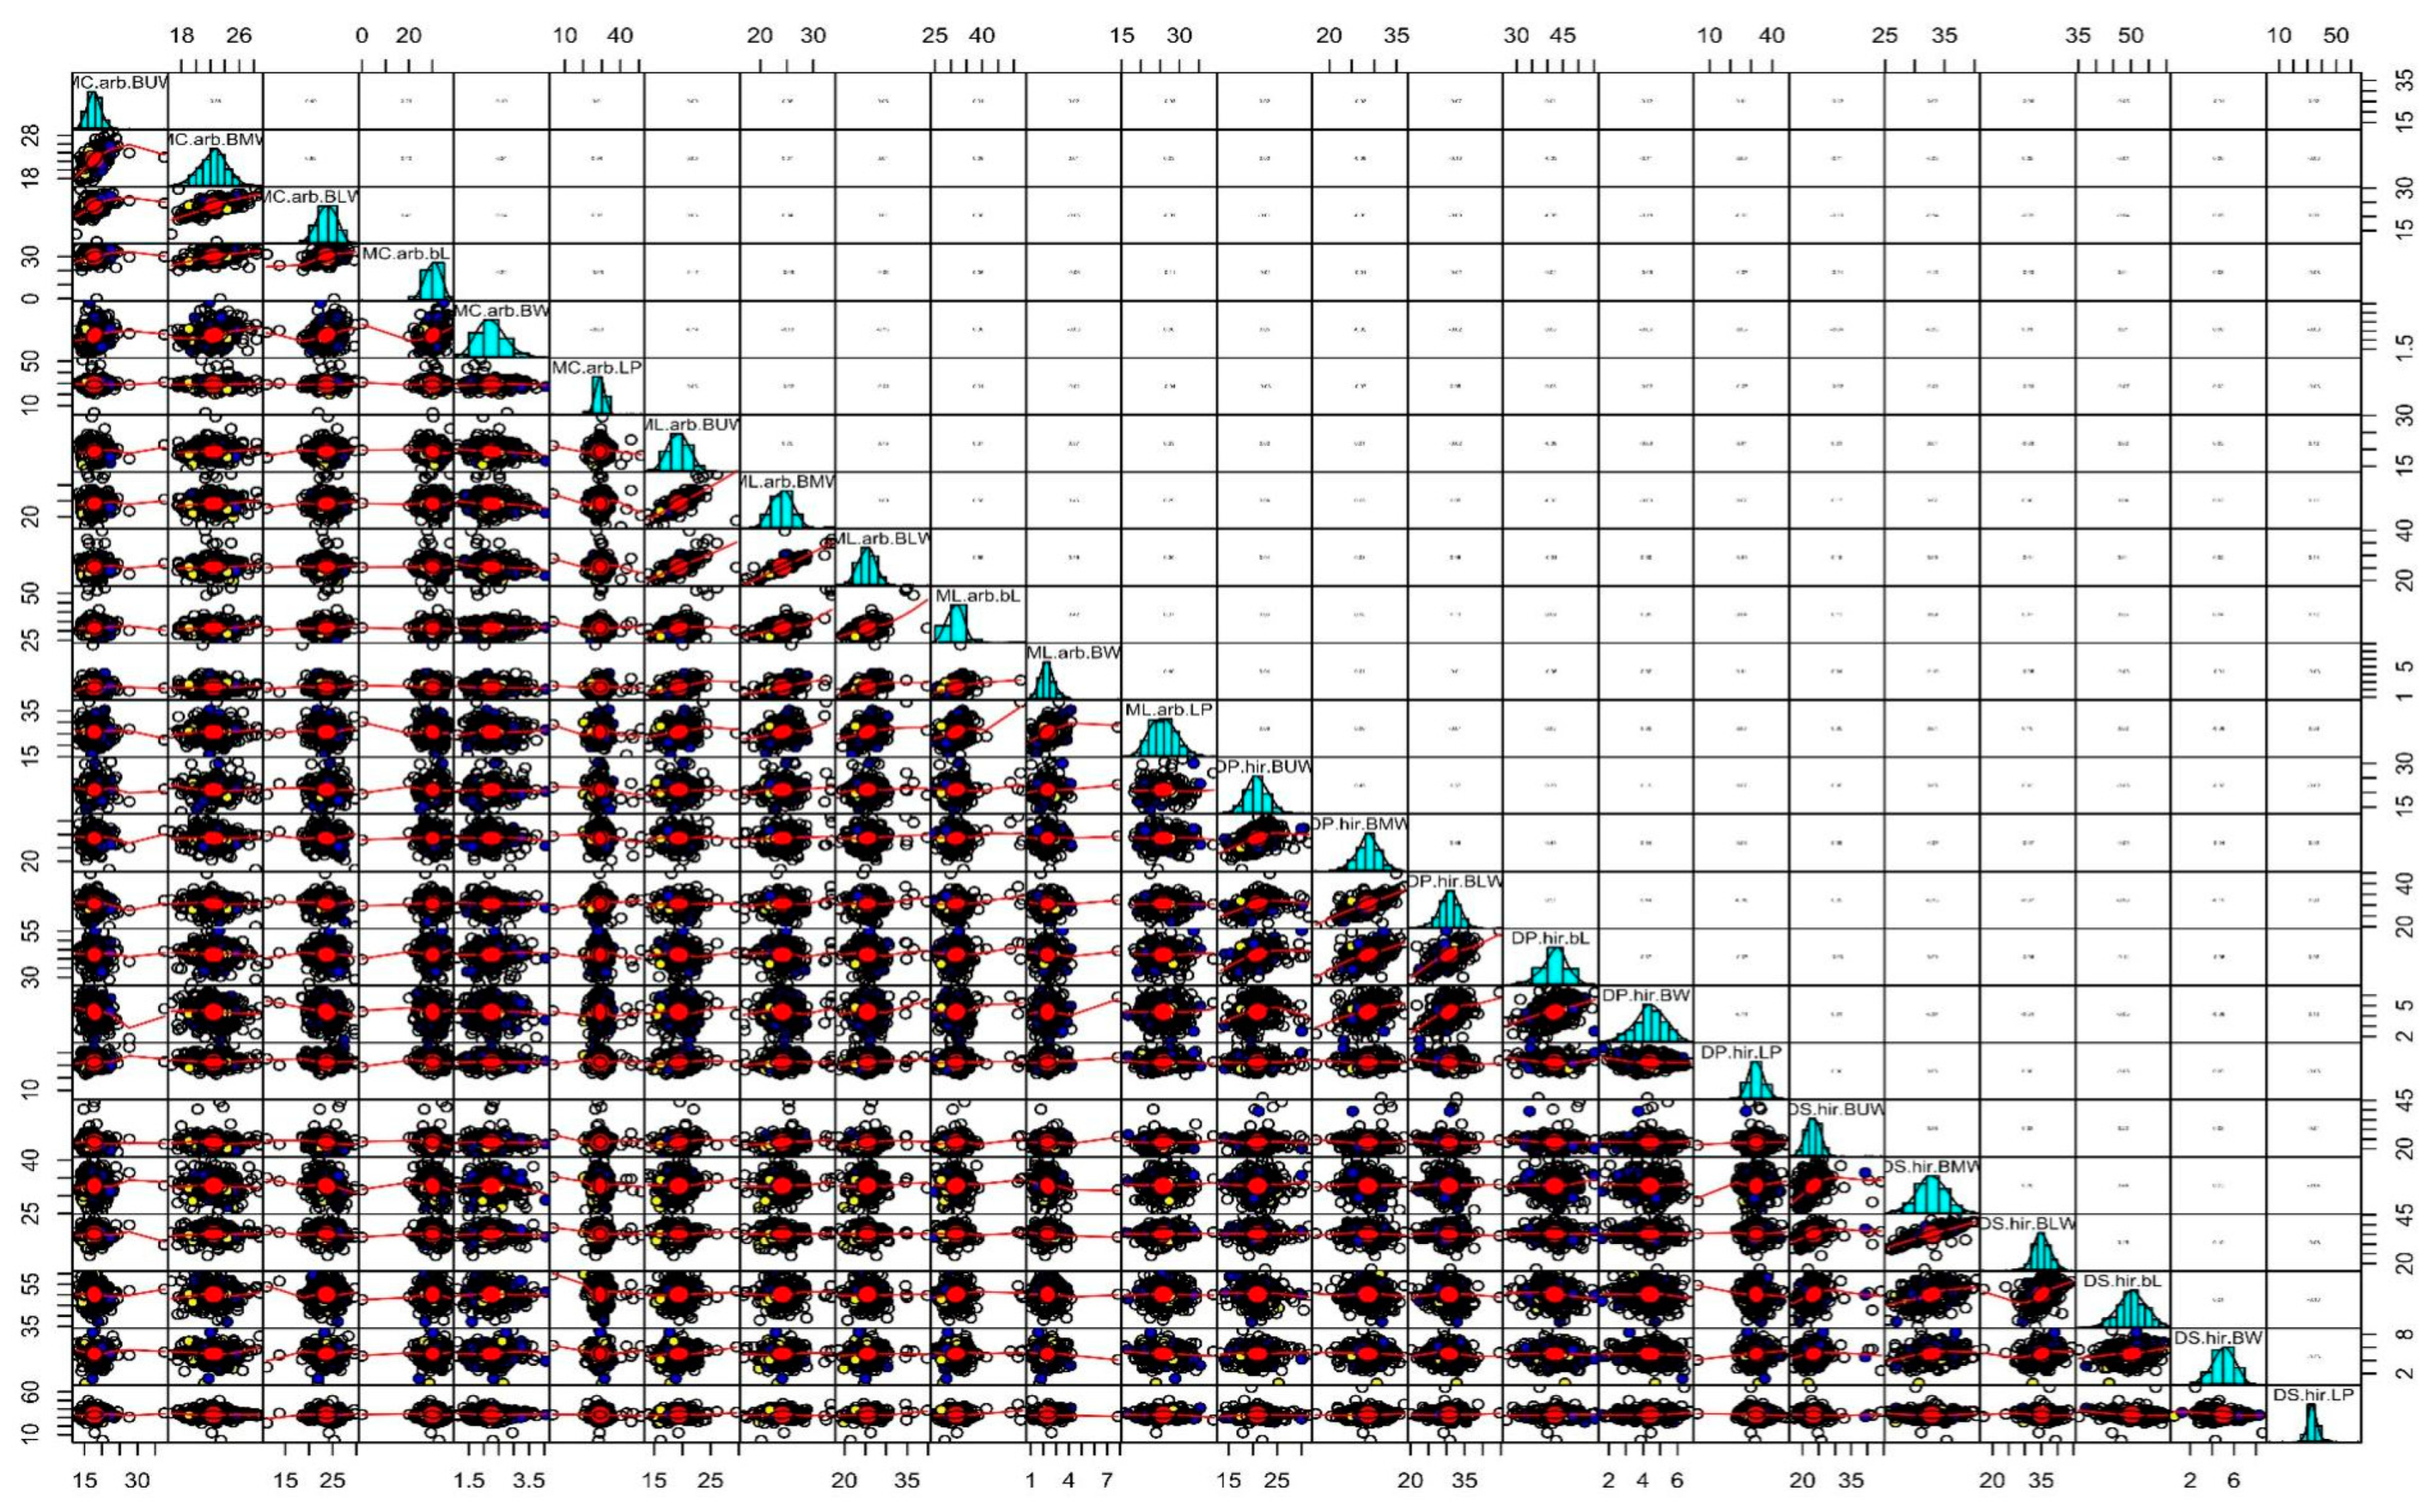
3.2. Correlation Analysis

Correlation analysis revealed a significant association among the six traits across the four F2 populations (Figure 1). In the ML population, BW exhibited increasingly significant positive correlations with the LP, BUW, BMW, BLW, and BL, respectively. Moreover, correlation analysis showed a strong positive association between the LP and BUW of G. hirsutum, and a significant negative correlation of these traits with the BL of the MC population. The BW in the MC population exhibited a significant strong positive correlation with the BUW, BMW, BLW, and BL. The BW of DP population showed a significant positive correlation with BUW, BMW, BLW, and BL, and a significant negative correlation with LP. The BW in the DS population showed a significant positive correlation with the BUW, BMW, BLW, and BL, and a significant negative correlation with the trait LP of same population, and with BUW of the ML population.
The LP of the ML population showed increasingly significant positive correlations with the BUW, BMW, BLW, and BL, respectively. Moreover, it showed a significant positive correlation with the BUW of the DP population. The LP of MC population showed a significant positive correlation with the BUW of the DS population. The LP of the DP population revealed a significant negative correlation with the BL of the MC population. The LP of the DS population revealed a strong negative association with BLW and BL, and had a significant negative correlation with BUW of the MC population. The BUW of the ML population showed increasingly significant positive associations with BMW, BLW, and BL, respectively, whereas, it exhibited increasingly significant positive correlations with BUW of the MC, DP, and DS populations, respectively. It also revealed a significant negative association with BL of the MC population. The BUW of the ML population correlated positively with the BMW, BLW, and BL, with respectively increasing correlation strength. It also showed a significant positive correlation with BUW of the MC, DS, and DP populations, and a significant negative correlation with the BL of the MC population. The BUW of the MC population showed a significant positive correlation with BMW, BLW, BL, and BUW of the DP population. The BUW of the DP population showed a significant positive correlation with BMW, BLW, and BL of the same population, whereas it showed a significant positive correlation with the BMW and BLW of the DS population. The BUW of DS population showed significant positive correlations of increasing strength with the BMW, BLW, and BL, respectively. However, it also showed a significant positive correlation with BMW, BLW, and BL of ML population.
The BMW of the ML population correlated positively with BLW and BL. The BMW of the MC population showed increasingly positive correlations with BLW and BL, respectively. Furthermore, it also revealed a significant positive correlation with BL of the ML population. The BMW of the DP population correlated positively with BLW and BL. The BMW of the DS population showed a significant positive correlation with BLW and BL. In addition, it also showed a significant positive correlation with BL of the DS population. The BLW of the ML population displayed a significant positive correlation with BL. Moreover, it also showed a significant negative correlation with BL of the MC population. The BLW population was found to be significantly positively correlated with the BL trait. The BLW of the DP population was found to be significantly positively correlated with BL. The BLW of the DS population displayed a significant positive correlation with BL. Moreover, it showed a significant negative correlation with BL of both the ML and DP populations. The network was constructed using phenotypic pairwise correlations between BW, LP, BUW, BMW, BLW, and BL among the four populations MC, ML, DS, and DP, respectively (Figure 2). Most of the correlation clusters were negatively associated with the two economic traits, i.e., BW and LP, whereas correlation clusters were found to be positively correlated with the majority of the agronomic traits under investigation. Significant correlation clusters were observed among multiple characters, i.e., BLW, BMW, and BUW of the ML population, BMW and BLW of the DS population displayed significant negative correlations with DP and BW of the DP population, BLW of the MC population, BW, LP, and BUW of the DS population, and BL of the MC, BUW of the ML, and BL of the MC populations, respectively.

3.3. Estimation of Heritability

Variations among both phenotypic and genotypic characters were exhibited by the F2 populations under investigation. The phenotypic and genotypic coefficient of variation (PCV and GCV), broad sense heritability (h2b) of four agronomic (boll morphological), and two economic (yield-related) traits are summarized in Table 4. The range of GCV was between 4.40 and 19.62 for the six traits measured in all four populations. The highest value of GCV (19.62) was observed for BW of the ML population, followed by BW of the MC population (16.38), in G. arboreum, whereas in G. hirsutum, populations DS and DP displayed GCV values of 15.40 and 14.14, respectively. The range of PCV was 8.40 to 23.95 for all traits measured in all four populations. In addition, at the phenotypic level, BW revealed more variation in PCV, which suggested that all investigated populations have high genetic potential, which is critical for heterosis breeding programs because the transmissibility index (heritability) is restricted to the next generation. The majority of traits exhibited high h2b, ranging by 15% for BMW and BUW of both the DP and MC populations, respectively. Estimations of h2b were in a relatively medium range (high > 50%, medium 20–50%, low < 20%) for traits under investigation. High heritability results were proven to be effective in selecting superior genotypes based on phenotypic results. The highest genetic improvement value was related to LP (4.03–4.86) for all populations, followed by BL (4.37–2.67), and BLW and BMW (2.74 and 2.72) in the ML population, respectively. It was demonstrated that traits BW, LP, and BL hold high heritability and genetic improvement.

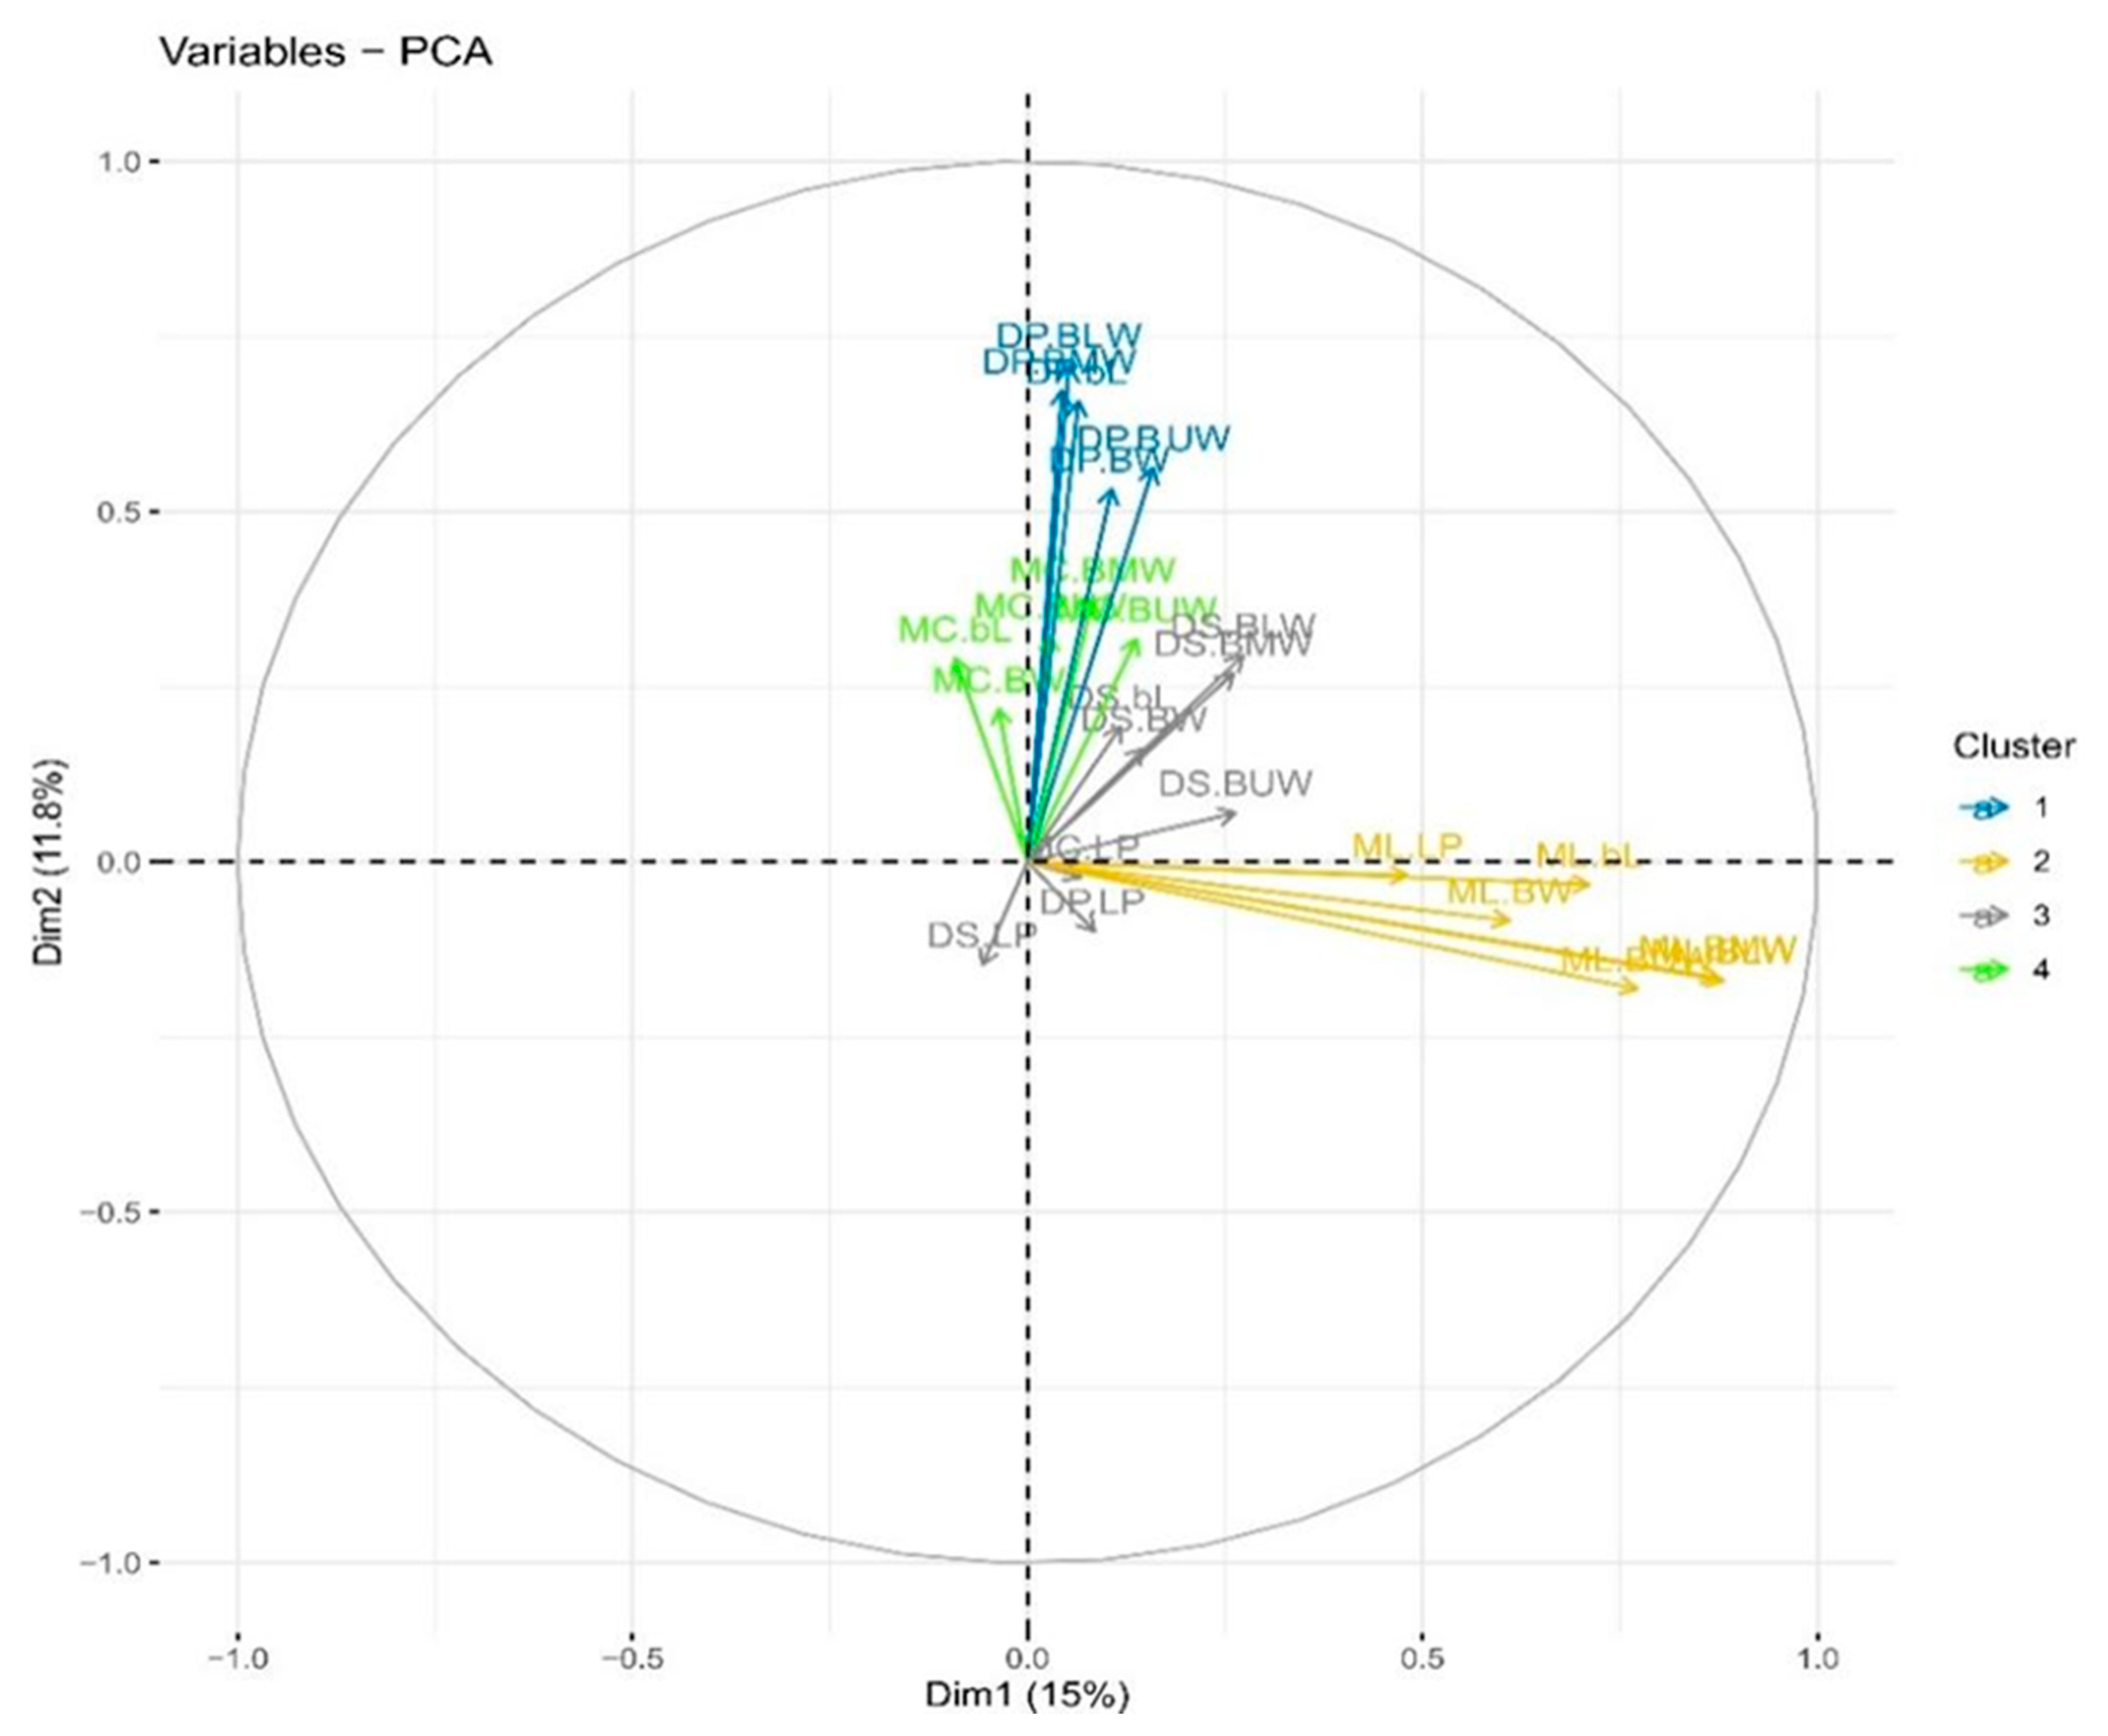
3.4. Principal Component Analysis (PCA)

Principal component analysis (PCA) was conducted on all variables at the same time to identify patterns of variance. The eigenvalues, variability (%), and cumulative percentages (%) are presented in Table 5. Seven of the twenty-four extracted PCs had eigenvalues > 1, and accounted for 62.2% of the difference between the four populations. PC1 accounted for 15.1% of the overall variability and was mainly attributed to BLW, BMW, BUW, BL, and BW of the ML population of G. arboreum. PC2 accounted for 12.2% of the overall variability and contributed mostly negative values to BLW, BMW, BL, BUW, and BW of the DP population of G. hirsutum. PC3 accounted for 11.2% of the total variability and contributed negative loadings to BLW, BMW, and BUW of the MC population of G. arboreum. PC4 accounted for 9.6% of the overall variability and was mostly ascribed to BMW of the DP population, with both positive and negative values for BL, BMW, and BLW of the DS population of G. hirsutum. PC5 accounted for 5.1% of the overall variability, and mainly revealed the differences in LP and BUW of the DP population with their positive and negative contributions for LP of the DS population. PC6 accounted for 4.7% of overall variability, and mainly revealed the differences in LP and BW of the ML population with their positive and negative values for BW and LP of both the DS and MC populations. PC7 accounted for 4.3% of overall variability, and mainly revealed the differences in LP and BUW of the MC and DS populations, with positive and negative values for BW of the DS population. In the current study, the results of the first three PCs demonstrated a high degree of variation, indicating that inter-varietal breeding could boost cotton production.

3.5. Biplot Analysis

These traits were superimposed as vectors onto the biplot, with the relative lengths of the vectors representing the relative degree of variance in each factor. The extant variant reserved from the origin showed higher variance and were found to be less correlated with other variants. The traits BW, BL, BUW, BMW, and BLW of the MC population; BW, BL, BUW, BMW, and BLW of the DP population; BW, BL, BUW, BMW, and BLW of the DS population; BW, BL, BUW, BMW, BLW, and LP of the MS population, respectively, were largely contributed with a high degree of variability, whereas, LP of the MC population, and LP of the DP population, represented the lowest variability. The quality trait, LP of the DS population, was not in a desirable direction (Figure 3). Meanwhile, a PCA plot was drawn for the four populations cumulatively, in which the agronomic traits BUW, BLW, BMW, and BL were contributed with a higher degree of variability. The economic traits, such as BW and LP, were negatively correlated to the agronomic traits in group performance.

4. Discussion

The traits of BW and LP are complex in nature owing to their association with many other physiological attributes. Previous breeding efforts for high fiber quality traits in G. hirsutum remain successful. However, the G. arboreum germplasm has received little attention in cotton breeding programs, although it has highly significant genotypic effects on agronomic boll morphological traits and economic yield-related traits. To analyze the genetic basis for variation in BW, LP, and boll size-related traits, and their genetic architecture, three lines of G. hirsutum (Dixie king, Suyuan 04-44, Pamuk) and three lines of G. arboreum (Mei Zhongmian, Chimu Heizi, L-02292-3) were selected based on their BW and other traits. Furthermore, four F2 populations were constructed, with Mei Zhongmian, Chimu Heizi, and Dixie king used as female parents owing to their larger BW, while the male parents, L-02292-3, Suyuan 04-44, and Pamuk were the smaller BW lines of F2 populations under investigation. Therefore, significant phenotypic differences were recorded in cross combinations of distantly related parents. Many selected traits showed normally distributed patterns in the four F2 populations, which indicates the quantitative nature of the traits under consideration.
A wide range of mean values were found for the traits under observation. Mean BW ranged from 2.38 to 4.05 g in G. arboreum and 4.49 to 5.12 g in G. hirsutum (Table 3). Correlation analysis helps in the determination of associations between single traits, while multivariate analysis provides accurate measurements of similarities and differences, and determines the relative proportions of variability contributing toward total variance of the germplasm [24,25,26,27,28,29]. However, these approaches cannot evaluate the genetic factors responsible for a wide range of genetic consequences among targeted traits and their components [30,31]. Wu et al. [29] and McCarty et al. [30] investigated the advancement of conditional analysis on previous techniques to assess the contributions of within-boll yield components and genetic variability on yield-related traits. BW was found to be positively correlated with LP. Krishnarao and Mary [32] also addressed the main contributions of BW, and found strong negative correlations with LP, indicating that genotypes with higher BW tend to have lower LP. Our results were in line with previous studies, indicating that focusing exclusively on LP to improve efficiency could make BW more vulnerable [33]. Previous studies also revealed that improvements in LP are associated with reductions in boll size [17,33,34,35,36].
Conversely, BW and BL contributed a significant and positive association with phenotype variation, indicating that large bolls produce coarser fibers than smaller ones, owing to large bolls having greater sink strengths [37], thus resulting in fiber cell wall biosynthesis that is relatively successful and longer lasting. In addition, BL alone accounted for the largest phenotypic variance proportion and components variance [38]. These results provide the basis for the following assumption, that large bolls yield better and coarser fibers. Moreover, the grouping of individuals based on multiple agronomic traits is relatively useful for identifying genotype adaptation and improvement in traits of economic importance [39]. Furthermore, it was stated that biplot diagrams are foremost components in genotype selection, combining desirable traits for use in breeding programs [40]. The genotypes present in the four quadrants of the graph indicate a high source of variation and a desirable combination of traits. Principal component cluster analysis showed significant inter- and intragroup variation. Multivariate analysis is a good system for evaluating the cotton germplasm, with a critical role in identifying genotypes for biotic and abiotic stress resistance and crop yield improvement.

5. Conclusions

The contribution of G. hirsutum was significantly greater than that of G. arboreum for yield and yield-associated traits. Four F2 populations were derived in the current study by intraspecific hybridization among two G. hirsutum and two G. arboreum lines selected on the basis of their boll size. Distinct phenotypic and genotypic correlations were reported between boll morphological, BW, and lint yield components. Furthermore, useful recombinants can be used for future breeding programs due to the lack of interaction between different traits. These findings suggest that upland cotton and breeding lines from breeding populations may possess the simultaneous genetic potential of multiple boll yield components. In comparison with distinct single-trait analysis, multivariate analysis is a good system for evaluating cotton germplasm, with a critical role in identifying genotypes of better yield and quality. Agronomical traits can provide a general representation of a population’s relationship with its environment. Moreover, natural varieties may be used to transfer particular genes for various characteristics to improve cotton yield. The investigated populations might be useful in future crop improvement programs.

Author Contributions

X.D. and Z.P. developed the researched the concept. Z.I., H.G. and M.S.I. collected data and conducted formal analysis. Z.I., W.N., T.N. and Z.M. helped with statistical analysis of data. Z.I., Z.P., X.D. and D.H. helped to write the original draft of the manuscript and make revisions, T.N. and M.S.I. contributed to the review and editing processes; S.F. assisted in the literature search and writing; X.D., D.H. and H.G. reviewed the manuscript; S.F., A.M.E.-S. and A.G. provided technical expertise to streamline the idea; X.D. reviewed and supervised manuscript writing and also obtained the funding for the publication. All authors have read and agreed to the published version of the manuscript.

Funding

This work was supported by funding from the Agricultural Science and Technology Innovation Program of the Chinese Academy of Agricultural Sciences (CAAS-ASTIP-ICR-2021-01).

Acknowledgments

We are thankful to the National mid-term gene bank for cotton for providing experimental material.

Conflicts of Interest

The authors declare no conflict of interest.

References

  1. Huang, G.; Wu, Z.; Percy, R.G.; Bai, M.; Li, Y.; Frelichowski, J.E.; Hu, J.; Wang, K.; Yu, J.Z.; Zhu, Y. Genome sequence of Gossypium herbaceum and genome updates of Gossypium arboreum and Gossypium hirsutum provide insights into cotton A-genome evolution. Nat. Genet. 2020, 52, 516–524. [Google Scholar] [CrossRef] [PubMed] [Green Version]
  2. Wang, K.; Wendel, J.F.; Hua, J. Designations for individual genomes and chromosomes in Gossypium. J. Cotton Res. 2018, 1, 3. [Google Scholar] [CrossRef] [Green Version]
  3. Gallagher, J.P.; Grover, C.; Rex, K.; Moran, M.; Wendel, J.F. A New Species of Cotton from Wake Atoll, Gossypium stephensii (Malvaceae). Syst. Bot. 2017, 42, 115–123. [Google Scholar] [CrossRef] [Green Version]
  4. Hu, Y.; Chen, J.; Fang, L.; Zhang, Z.; Ma, W.; Niu, Y.; Ju, L.; Deng, J.; Zhao, T.; Lian, J.; et al. Gossypium barbadense and Gossypium hirsutum genomes provide insights into the origin and evolution of allotetraploid cotton. Nat. Genet. 2019, 51, 739–748. [Google Scholar] [CrossRef] [Green Version]
  5. Chao, F.; Ma, Y.; Wu, S.; Liu, Z.; Wang, Z.; Yang, R.; Hu, G.; Zhou, Z.; Yu, H.; Zhang, M.; et al. Genome-wide association studies dissect the genetic networks underlying agronomical traits in soybean. Genome Biol. 2017, 18, 161. [Google Scholar] [CrossRef]
  6. Chen, Z.J.; Scheffler, B.; Dennis, E.; Triplett, B.A.; Zhang, T.; Guo, W.; Chen, X.; Stelly, D.; Rabinowicz, P.D.; Town, C.D.; et al. Toward Sequencing Cotton (Gossypium) Genomes: Figure. Plant Physiol. 2007, 145, 1303–1310. [Google Scholar] [CrossRef] [Green Version]
  7. Wendel, J.; Brubaker, C.; Seelanan, T. The Origin and Evolution of Gossypium. In Physiology of Cotton; Stewart, J., Oosterhuis, D., Heitholt, J., Mauney, J., Eds.; Springer: Berlin/Heidelberg, Germany, 2010. [Google Scholar]
  8. Ma, C.; Mamat, S.; Yao, J.; Isak, G. Spatio-temporal changes of cotton production in China from 1950 to 2015. Acta Geogr. Sin. 2020, 75, 1699–1710. [Google Scholar]
  9. Mehetre, S.; Mehetre, S.S.; Aher, A.R.; Gawande, V.L.; Patil, V.R.; Mokate, A.S. Induced polyploidy in Gossypium: A tool to overcome interspecific incompatibility of cultivated tetraploid and diploid cottons. Curr. Sci. 2003, 84, 1510–1512. [Google Scholar]
  10. Liu, D.; Guo, X.; Lin, Z.; Nie, Y.; Zhang, X. Genetic Diversity of Asian Cotton (Gossypium arboreum L.) in China Evaluated by Microsatellite Analysis. Genet. Resour. Crop. Evol. 2006, 53, 1145–1152. [Google Scholar] [CrossRef]
  11. Campbell, B.T.; Williams, V.E.; Park, W. Using molecular markers and field performance data to characterize the Pee Dee cotton germplasm resources. Euphytica 2009, 169, 285–301. [Google Scholar] [CrossRef]
  12. Tyagi, P.; Gore, M.A.; Bowman, D.T.; Campbell, B.T.; Udall, J.A.; Kuraparthy, V. Genetic diversity and population structure in the US Upland cotton (Gossypium hirsutum L.). Theor. Appl. Genet. 2014, 127, 283–295. [Google Scholar] [CrossRef] [PubMed]
  13. Yang, Z.; Ge, X.; Yang, Z.; Qin, W.; Sun, G.; Wang, Z.; Li, Z.; Liu, J.; Wu, J.; Wang, Y.; et al. Extensive intraspecific gene order and gene structural variations in upland cotton cultivars. Nat. Commun. 2019, 10, 2989. [Google Scholar] [CrossRef] [PubMed]
  14. Ma, Z.; He, S.; Wang, X.; Sun, J.; Zhang, Y.; Zhang, G.; Wu, L.; Li, Z.; Liu, Z.; Sun, G.; et al. Resequencing a core collection of upland cotton identifies genomic variation and loci influencing fiber quality and yield. Nat. Genet. 2018, 50, 803–813. [Google Scholar] [CrossRef] [PubMed]
  15. Nie, J.-J.; Yuan, Y.-C.; Qin, D.-L.; Liu, Y.-H.; Wang, S.-L.; Li, J.-P.; Zhang, M.-L.; Zhao, N.; Guo, W.-J.; Qi, J.; et al. Spatial distribution of bolls affects yield formation in different genotypes of Bt cotton varieties. J. Integr. Agric. 2019, 18, 2492–2504. [Google Scholar] [CrossRef]
  16. Culp, T.W.; Harrell, D.C. Influence of Lint Percentage, Boll Size, and Seed Size on Lint Yield of Upland Cotton with High Fiber Strength. Crop Sci. 1975, 15, 741–746. [Google Scholar] [CrossRef]
  17. Zeng, L.; Meredith, W.R., Jr. Associations among lint yield, yield components, and fiber properties in an introgressed pop-ulation of cotton. Crop Sci. 2009, 49, 1647–1654. [Google Scholar] [CrossRef] [Green Version]
  18. Worley, S.; Culp, T.W.; Harrell, D.C. The relative contributions of yield components to lint yield of upland cotton, Gossypium hirsutum L. Euphytica 1974, 23, 399–403. [Google Scholar] [CrossRef]
  19. Sun, S.; Li, C.; Chee, P.W.; Paterson, A.H.; Jiang, Y.; Xu, R.; Robertson, J.S.; Adhikari, J.; Shehzad, T. Three-dimensional photogrammetric mapping of cotton bolls in situ based on point cloud segmentation and clustering. ISPRS J. Photogramm. Remote Sens. 2020, 160, 195–207. [Google Scholar] [CrossRef]
  20. Zhang, S.; Wang, T.; Liu, Q.; Gao, X.; Zhu, X.; Zhang, T.; Zhou, B. Quantitative trait locus analysis of boll-related traits in an intraspecific population of Gossypium hirsutum. Euphytica 2014, 203, 121–144. [Google Scholar] [CrossRef]
  21. Majeedano, M.S.; Ahsaan, M.Z.; Somroo, A.W.; Channa, A.R. Heritability and correlation estimates for some yield traits of Gossypium hirsutum. Am. Res. Thoughts 2014, 1, 781–790. [Google Scholar]
  22. Fruchterman, T.M.J.; Reingold, E.M. Graph drawing by force-directed placement. Softw. Pract. Exp. 1991, 21, 1129–1164. [Google Scholar] [CrossRef]
  23. Benildo, G. Genomic and epigenomic bases of transgressive segregation–New breeding paradigm for novel plant phenotypes. Plant Sci. 2019, 288, 110213. [Google Scholar]
  24. Iqbal, M.A.; Ammad, A.; Zafar, Y. Characterization of indigenous Gossypium Arboreum, L. Genotypes for various fiber quality traits. Pak. J. Bot. 2015, 47, 2347–2354. [Google Scholar]
  25. Rezai, A.; Frey, K.J. Multivariate analysis of variation among wild oat accessions—Seed traits. Euphytica 1990, 49, 111–119. [Google Scholar] [CrossRef]
  26. Pezzotti, M.; Falcinelli, M.; Tomassini, C.; Veronesi, F. Evaluation of an Italian germplasm collection of Dactylis glomerata L. using a multivariate approach. J. Genet. Breed. 1994, 48, 17–23. [Google Scholar]
  27. Panthee, D.R.; Kc, R.B.; Regmi, H.N.; Subedi, P.P.; Bhattarai, S.; Dhakal, J. Diversity Analysis of Garlic (Allium sativum L.) Germplasms Available in Nepal Based on Morphological Characters. Genet. Resour. Crop. Evol. 2006, 53, 205–212. [Google Scholar] [CrossRef]
  28. Flores, F.; Gutierrez, J.; Lopez, J.; Moreno, M.; Cubero, J. Multivariate analysis approach to evaluate a germplasm collection of Hedysarum coronarium L. Genet. Resour. Crop. Evol. 1997, 44, 545–555. [Google Scholar] [CrossRef]
  29. Wu, J.; Jenkins, J.N.; McCarty, J.J., Jr.; Zhu, J. Genetic association of yield with its component traits in a recombinant inbred line population of cotton. Euphytica 2004, 140, 171–179. [Google Scholar] [CrossRef]
  30. McCarty, J.C.; Wu, J.; Jenkins, J.N. Genetic association of cotton yield with its component traits in derived primitive accessions crossed by elite upland cultivars using the conditional ADAA genetic model. Euphytica 2008, 161, 337–352. [Google Scholar] [CrossRef]
  31. McCarty, J.C.; Wu, J.; Jenkins, J.N. Primitive accession derived germplasm by cultivar crosses as sources for cotton improvement: I. Phenotypic values and variance components. Crop Sci. 2004, 44, 1226–1230. [Google Scholar] [CrossRef]
  32. Krishnarao, K.; Mary, T. Variability, correlation and path analysis of yield and fibre traits in upland cotton. Madras Agric. J. 1990, 77, 146–151. [Google Scholar]
  33. Miller, P.A.; Rawlings, J.O. Selection for Increased Lint Yield and Correlated Responses in Upland Cotton, Gossypium hirsutum L. Crop Sci. 1967, 7, 637–640. [Google Scholar] [CrossRef]
  34. Bridge, R.R.; Meredith, W.R.; Chism, J.F. Comparative Performance of Obsolete Varieties and Current Varieties of Upload Cotton. Crop Sci. 1971, 11, 29–32. [Google Scholar] [CrossRef]
  35. Ahuja, S.L.; Dhayal, L.S.; Monga, D. Performance of upland coloured cotton germplasm lines in line × tester crosses. Euphytica 2009, 169, 303–312. [Google Scholar] [CrossRef]
  36. Zeng, L.; Meredith, W.R.; Boykin, D.L.; Taliercio, E. Evaluation of an exotic germplasm population derived from multiple crosses among Gossypium tetraploid species. J. Cotton Sci. 2007, 11, 118–127. [Google Scholar]
  37. Xie, Z.-X.; Li, C.D.; Sun, H.C.; Zhu, J.J. Relationship between yield formation and source-sink of cotton cultivars with different boll weight. Cotton Sci. 2007, 3, 23–29. [Google Scholar]
  38. Tang, F.; Xiao, W. Genetic association of within-boll yield components and boll morphological traits with fibre properties in upland cotton (Gossypium hirsutum L.). Plant Breed. 2014, 133, 521–529. [Google Scholar]
  39. Souza, E.; Sorrells, M.E. Relationships among 70 North Amerian Oat Germplasms: II. Cluster Analysis Using Qualitative Characters. Crop Sci. 1991, 31, 605–612. [Google Scholar] [CrossRef]
  40. Firincioglu, H.; Erbektas, E.; Dogruyol, L.; Mutlu, Z.; Unal, S.; Karakurt, E.; Fırıncıoğlu, H. Phenotypic variation of Autumn and Spring-sown vetch (Vicia sativa ssp.) populations in central Turkey. Span. J. Agric. Res. 2009, 7, 596. [Google Scholar] [CrossRef] [Green Version]
Figure 1. Frequency distribution of phenotypic variance and correlation coefficients for six boll-related traits in four F2 populations: MC and ML of G. arborium; DS and DP of G. hirsutum. LP, lint percentage; BW, boll weight; BUW, boll upper width; BMW, boll medium width; BLW, boll lower width; BL, boll length. Significance is at p = 0.05, p = 0.01, p = 0.001, respectively.
Agronomy 12 00330 g001
Figure 2. Phenotypic correlation networks among four F2 populations: MC and ML of G. arborium; DS and DP of G. hirsutum. Correlations are denoted by blue and pink lines that represent negative and positive correlations, respectively. The width of the line is proportional to correlation strength. BW, boll weight; BL, boll length; LP, lint percentage; BUW, boll upper width; BMW, boll medium width; BLW, boll lower width.
Agronomy 12 00330 g002
Figure 3. Principal components biplot for four F2 populations.
Agronomy 12 00330 g003
Table 1. List of parental lines for hybridization on the basis of boll weight (BWg).
GenotypesParentsSpeciesBW (g)
Mei ZhongmianFemaleG. arboreum3.76
Chimu HeiziFemaleG. arboreum1.28
L-02292-3MaleG. arboreum1.33
Dixie kingFemaleG. hirsutum6.71
Suyuan 04-44MaleG. hirsutum3.71
PamukMaleG. hirsutum3.75
Table 2. Intraspecific hybridization block.
GenotypesIDCrossesSpeciesBW (g)
Mei Zhongmian× Chimu HeiziMCBig boll × Small boll G. arboreum2.1
Mei Zhongmian × L-02292-3MLBig boll × Small boll G. arboreum3.0
Dixie king × Suyuan 04-44DSBig boll × Small boll G. hirsutum6.2
Dixie king × PamukDPBig boll × Small boll G. hirsutum5.0
Table 3. Six traits demonstrate phenotypic variation in four F2 populations: ML, MC, DS, and DP.
PopulationTraitsP1P2F2 Populations
Min.Max.MeanSDCV%
MLBLW29.7222.7620.1036.5225.302.198.67
BMW29.1122.6117.4933.4724.022.179.07
BUW27.3517.0313.9729.5519.281.819.41
BW3.931.630.995.982.290.4821.16
LP32.6818.1316.6735.3226.152.9211.18
BL37.6629.2624.7452.7731.733.0419.58
MCBLW29.7222.5217.9929.4823.681.948.22
BMW29.1122.417.4828.8222.381.918.56
BUW27.3517.5212.9424.5117.681.9310.91
BW3.931.71.384.052.260.3817.18
LP32.6823.8720.4740.2928.812.267.84
BL37.6627.0120.1237.6630.033.0110.03
DSBLW34.4832.3124.0844.4235.262.396.78
BMW34.0331.1326.0939.4332.962.246.79
BUW26.7423.6917.4530.1023.202.159.27
BW5.793.931.257.455.020.8316.54
LP35.7735.3713.5746.433.383.019.02
BL45.5250.5138.7460.2750.033.787.55
DPBLW34.4826.3524.0237.9730.782.397.79
BMW34.032622.8135.6528.672.338.14
BUW26.7421.3415.2531.3320.952.1210.12
BW5.793.651.66.394.400.6715.24
LP35.7731.8113.5746.4632.393.019.29
BL45.5236.8130.1454.2642.143.698.77
P1, parent 1; P2, parent 2; Min, minimum; Max, maximum; SD, standard deviation; CV, coefficient of variation; ML, Mei Zhongmian × L-02292-3; MC, Mei Zhongmian × Chimu Heizi; DS, Dixie king × Suyuan 04-44; DP, Dixie king × Pamuk; BLW, boll lower width (mm); BMW, boll medium width (mm); BUW, boll upper width (mm); BW, boll weight (g); LP, lint percentage (%); BL, boll length (mm).
Table 4. Estimation of genetic variability and heritability parameters in ML, MC, DS, and DP F2 populations.
PopulaitonTraitsGCVPCVh2GA
MCBUW6.4516.5715.130.91
BMW5.8712.2922.801.29
BLW5.4411.9920.621.21
BL7.6613.6031.732.67
BW16.3818.6976.780.67
LP7.568.4080.864.03
MLBUW7.7012.1340.271.94
BMW7.8411.1549.442.73
BLW7.4910.6549.462.75
BL8.6611.2159.674.37
BW19.6323.9667.120.76
LP10.5612.3573.094.86
DPBUW6.1815.2116.531.08
BMW4.8012.3615.051.10
BLW4.9511.5518.331.34
BL6.6711.9231.333.24
BW14.1517.2467.341.05
LP8.6610.4668.484.78
DSBUW6.7012.9626.711.66
BMW4.719.7123.461.55
BLW4.409.9719.491.41
BL5.6610.3629.843.19
BW15.4118.6168.581.32
LP8.3610.2266.864.70
ML, Mei Zhongmian × L-02292-3; MC, Mei Zhongmian × Chimu Heizi; DS, Dixie king × Suyuan 04-44; DP, Dixie king × Pamuk; BLW, boll lower width; BMW, boll medium width; BUW, boll upper width; BW, boll weight; LP, lint percentage; BL, boll length; PCV, phenotypic coefficient variance; GCV, genotypic coefficient variance; h2, heritability; GA, genetic advance.
Table 5. The correlation matrix’s eigenvectors and eigenanalysis for the seven performance-related principal components of four F2 populations.
PopulationVariablePrincipal Components
PC1PC2PC3PC4PC5PC6PC7
MLBUW0.390.13−0.070.08−0.04−0.27−0.11
BMW0.450.13−0.080.07−0.08−0.16−0.11
BLW0.450.13−0.070.09−0.07−0.16−0.08
BL0.360.04−0.080.01−0.210.160.03
BW0.310.07−0.040.090.210.310.13
LP0.250.02−0.030.050.130.570.09
MCBUW0.07−0.16−0.35−0.180.22−0.160.05
BMW0.03−0.20−0.45−0.180.06−0.010.13
BLW0.01−0.17−0.46−0.180.080.010.08
BL−0.04−0.15−0.28−0.19−0.220.22−0.10
BW−0.02−0.11−0.22−0.11−0.17−0.07−0.19
LP0.030.010.02−0.02−0.13−0.330.79
DPBUW0.10−0.320.070.160.300.080.07
BMW0.04−0.390.050.310.12−0.09−0.042
BLW0.04−0.400.040.29−0.04−0.090.03
BL0.05−0.390.080.206−0.130.020.05
BW0.07−0.300.030.18−0.250.05−0.13
LP0.050.060.070.0050.65−0.09−0.05
DSBUW0.15−0.040.22−0.177−0.03−0.020.30
BMW0.16−0.180.28−0.369−0.060.050.001
BLW0.17−0.190.28−0.367−0.040.060.01
BL0.08−0.140.19−0.380.030.13−0.06
BW0.10−0.110.12−0.224−0.01−0.34−0.31
LP−0.040.10−0.010.157−0.300.210.07
Eigenvalue3.622.922.682.3061.231.131.04
Variability (%)15.1012.2011.209.605.104.704.30
Cumulative percentage (%)15.1027.3038.5048.1053.2057.9062.20
Principal component 1 (PC1); Principal component 2 (PC2); Principal component 3 (PC3); Principal component 4 (PC4); Principal component 5 (PC5); Principal component 6 (PC6); Principal component 7 (PC7).
Publisher’s Note: MDPI stays neutral with regard to jurisdictional claims in published maps and institutional affiliations.

