
Application of Molybdenum Nanofertilizer on the Nitrogen Use Efficiency, Growth and Yield in Green Beans
Abstract
:1. Introduction
2. Materials and Methods
2.1. Crop Location and Management
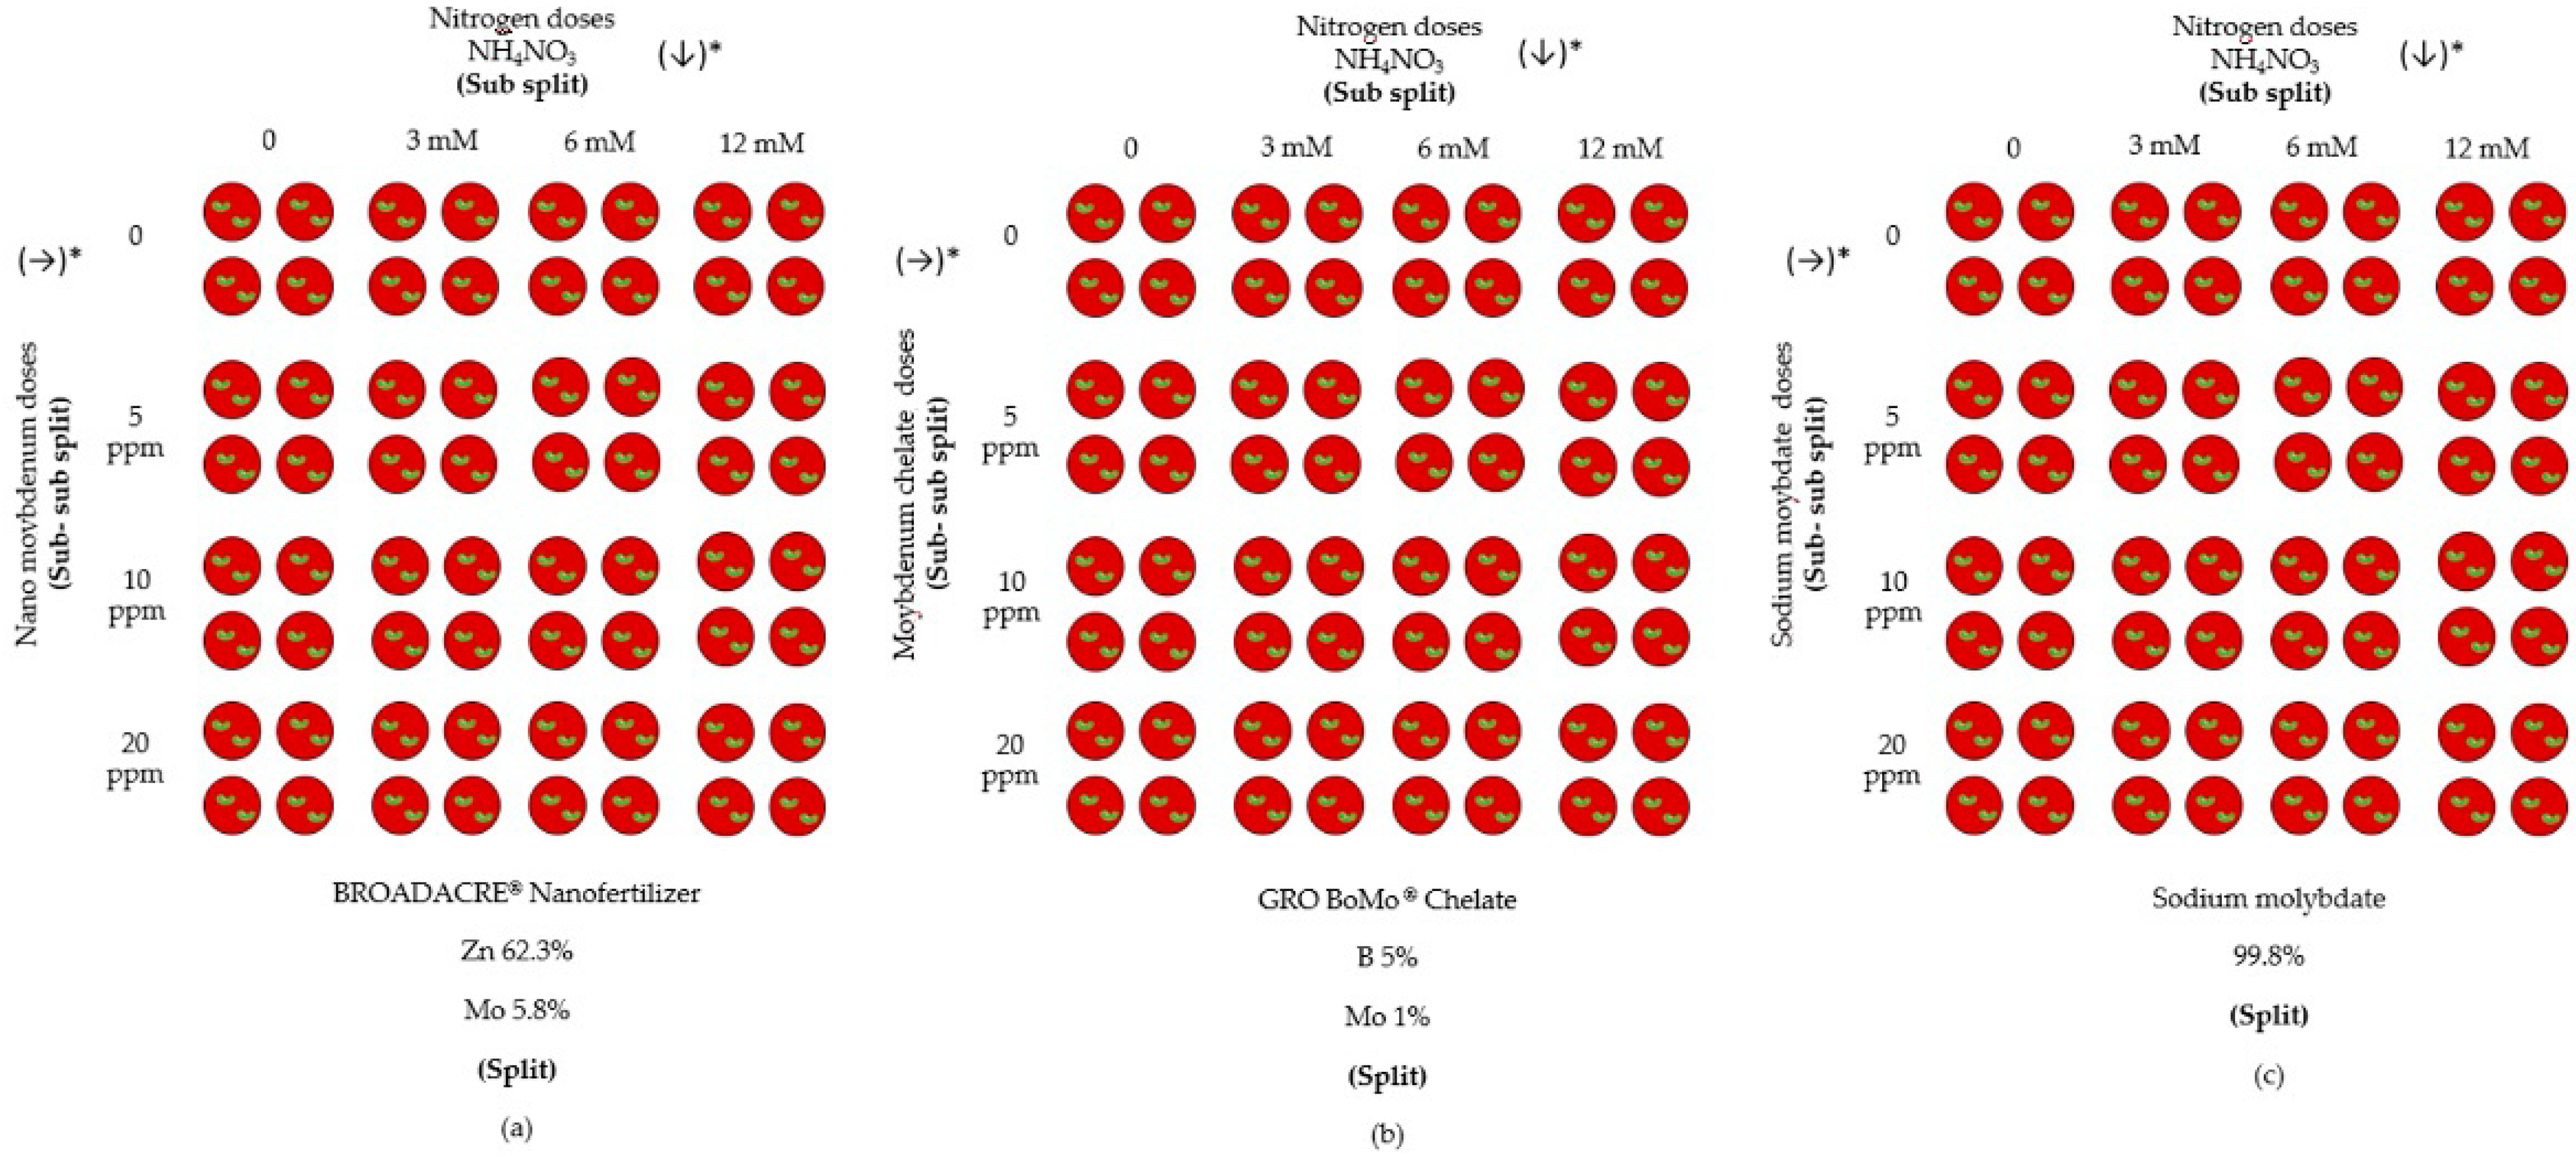
2.2. Experimental Design and Treatments
2.3. Plant Sampling
2.4. Plant Analysis
2.4.1. Biomass
2.4.2. Yield
2.4.3. Determination “In Vivo” of the Nitrate Reductase Activity (NR)
2.4.4. Total Nitrogen Determination
2.5. Nitrogen Use Efficiency Parameters (NUE)
- The total nitrogen accumulation (TNA) was calculated with the nitrogen concentration multiplied by the total biomass of the plant [14];
- Nitrogen uptake efficiency (NUpE) was calculated as TNA divided by root dry weight (DW) (mg N g−1 RDW) [14];
- Nitrogen utilization efficiency (NUtE) was calculated as dry weight (DW) of leaf tissue divided by N concentration (g2 LDW mg−1 N) [15].
Determination of the Photosynthetic Pigments Concentration
2.6. Statistic Analysis
3. Results
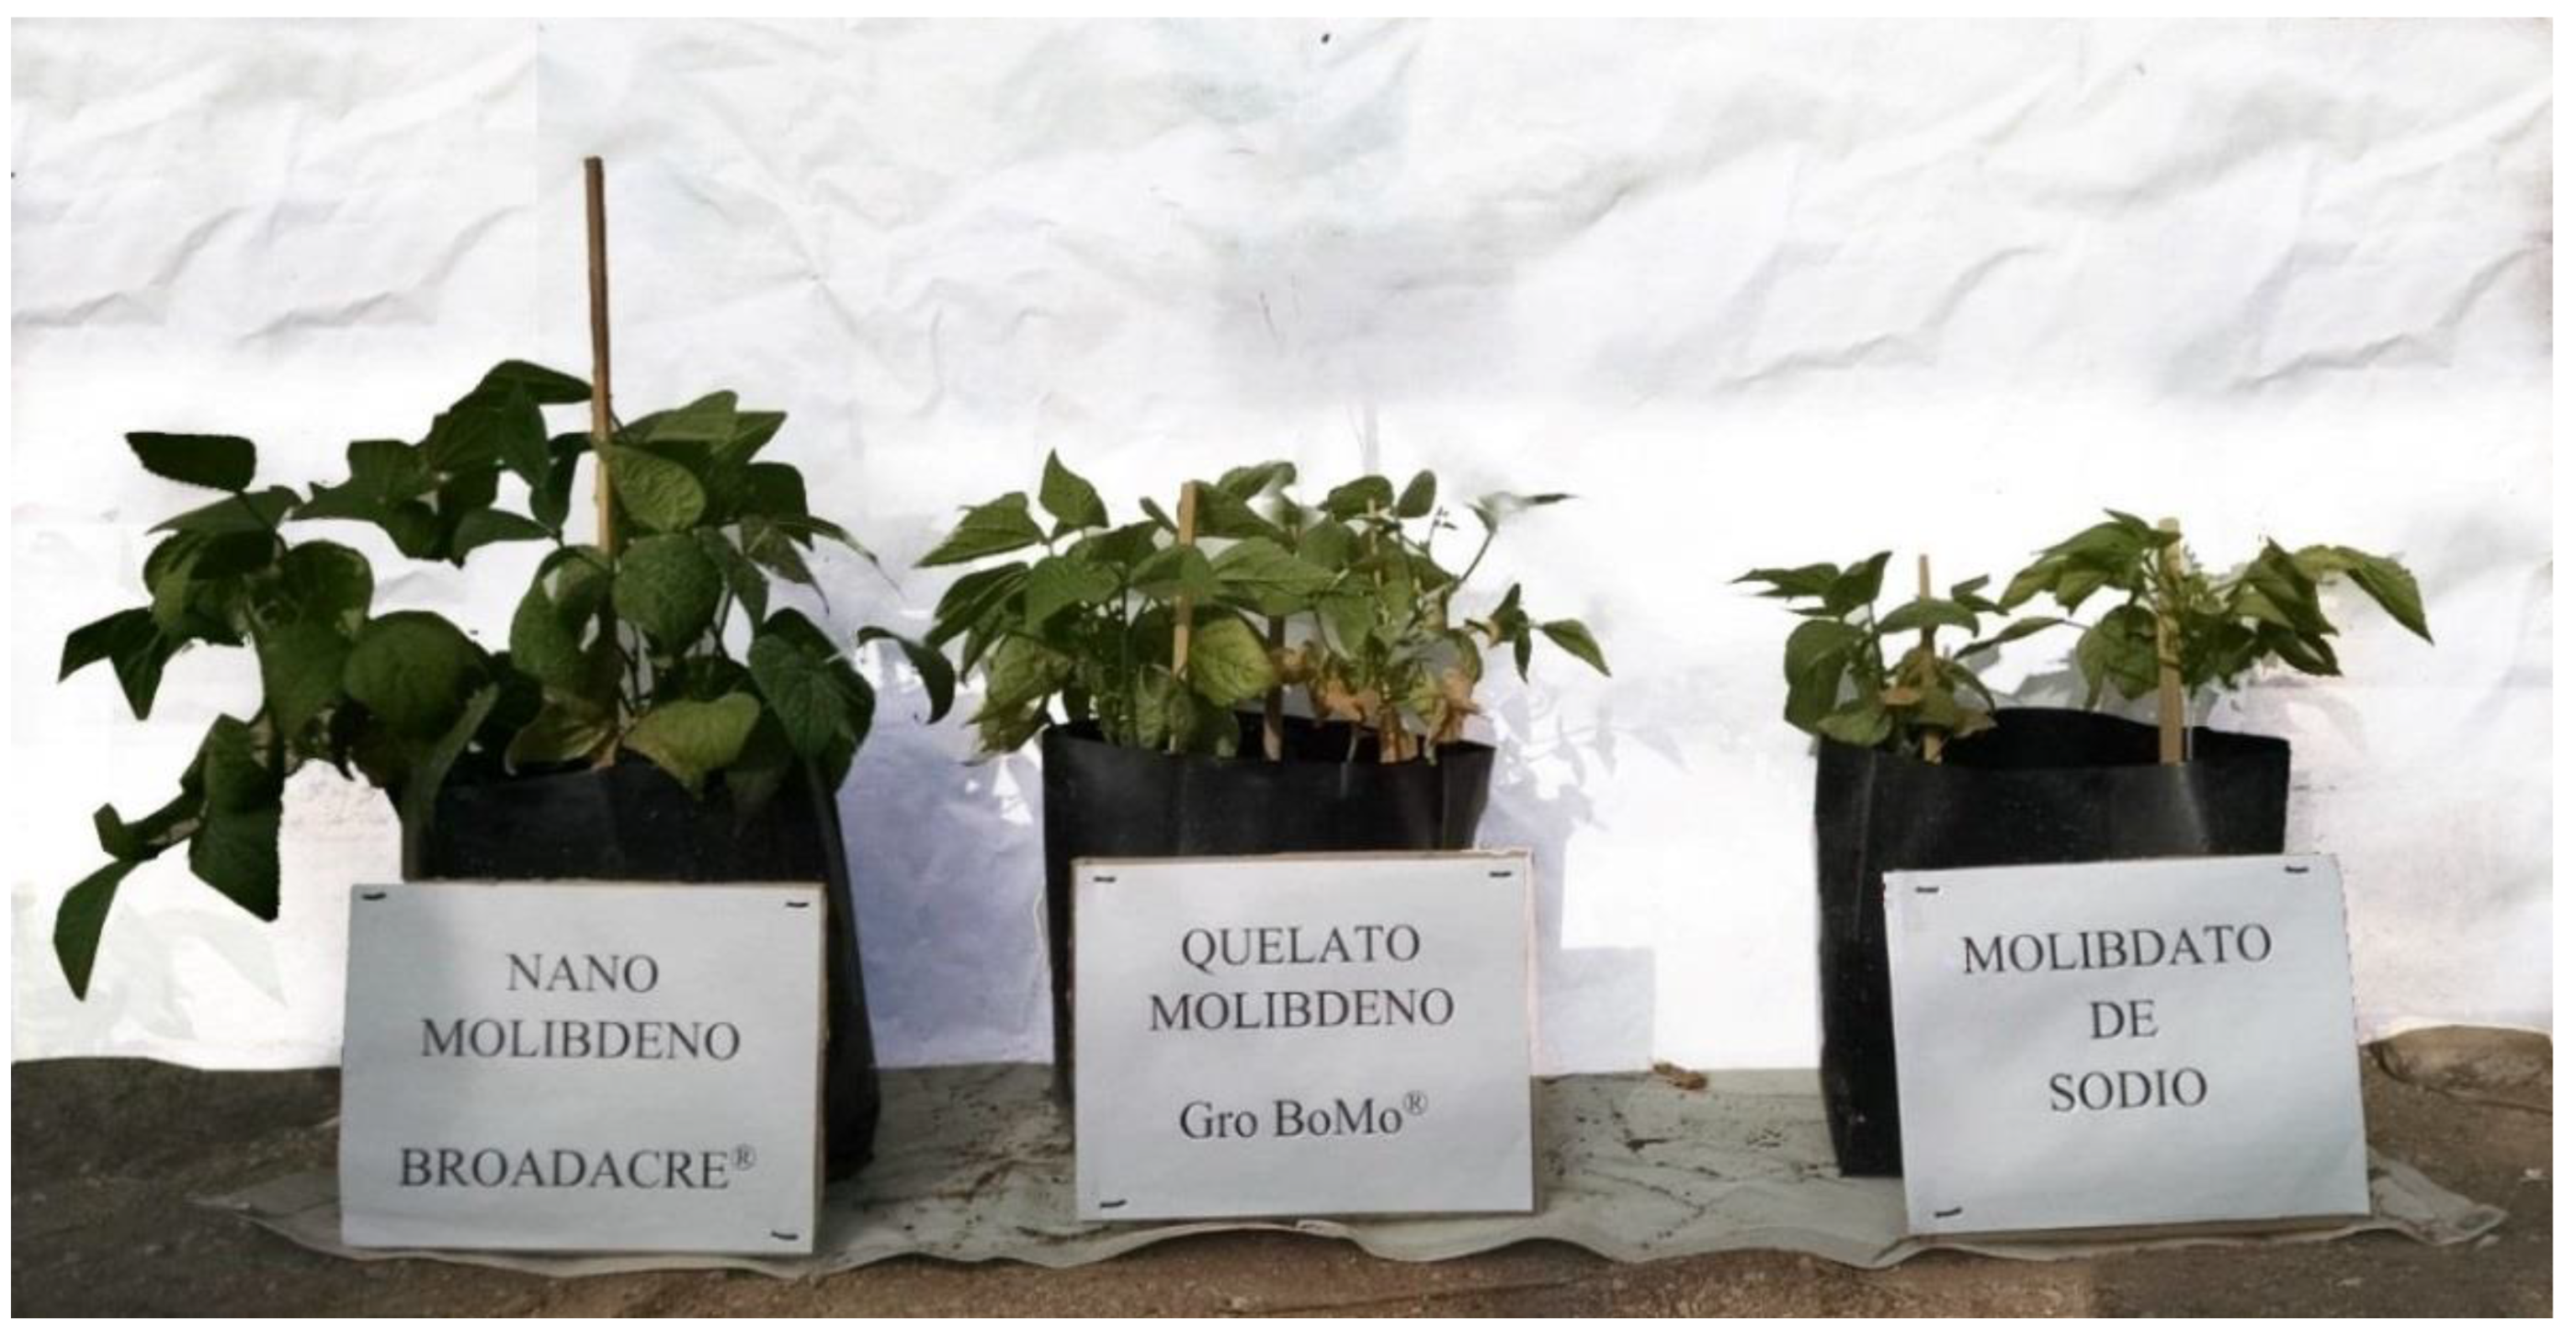
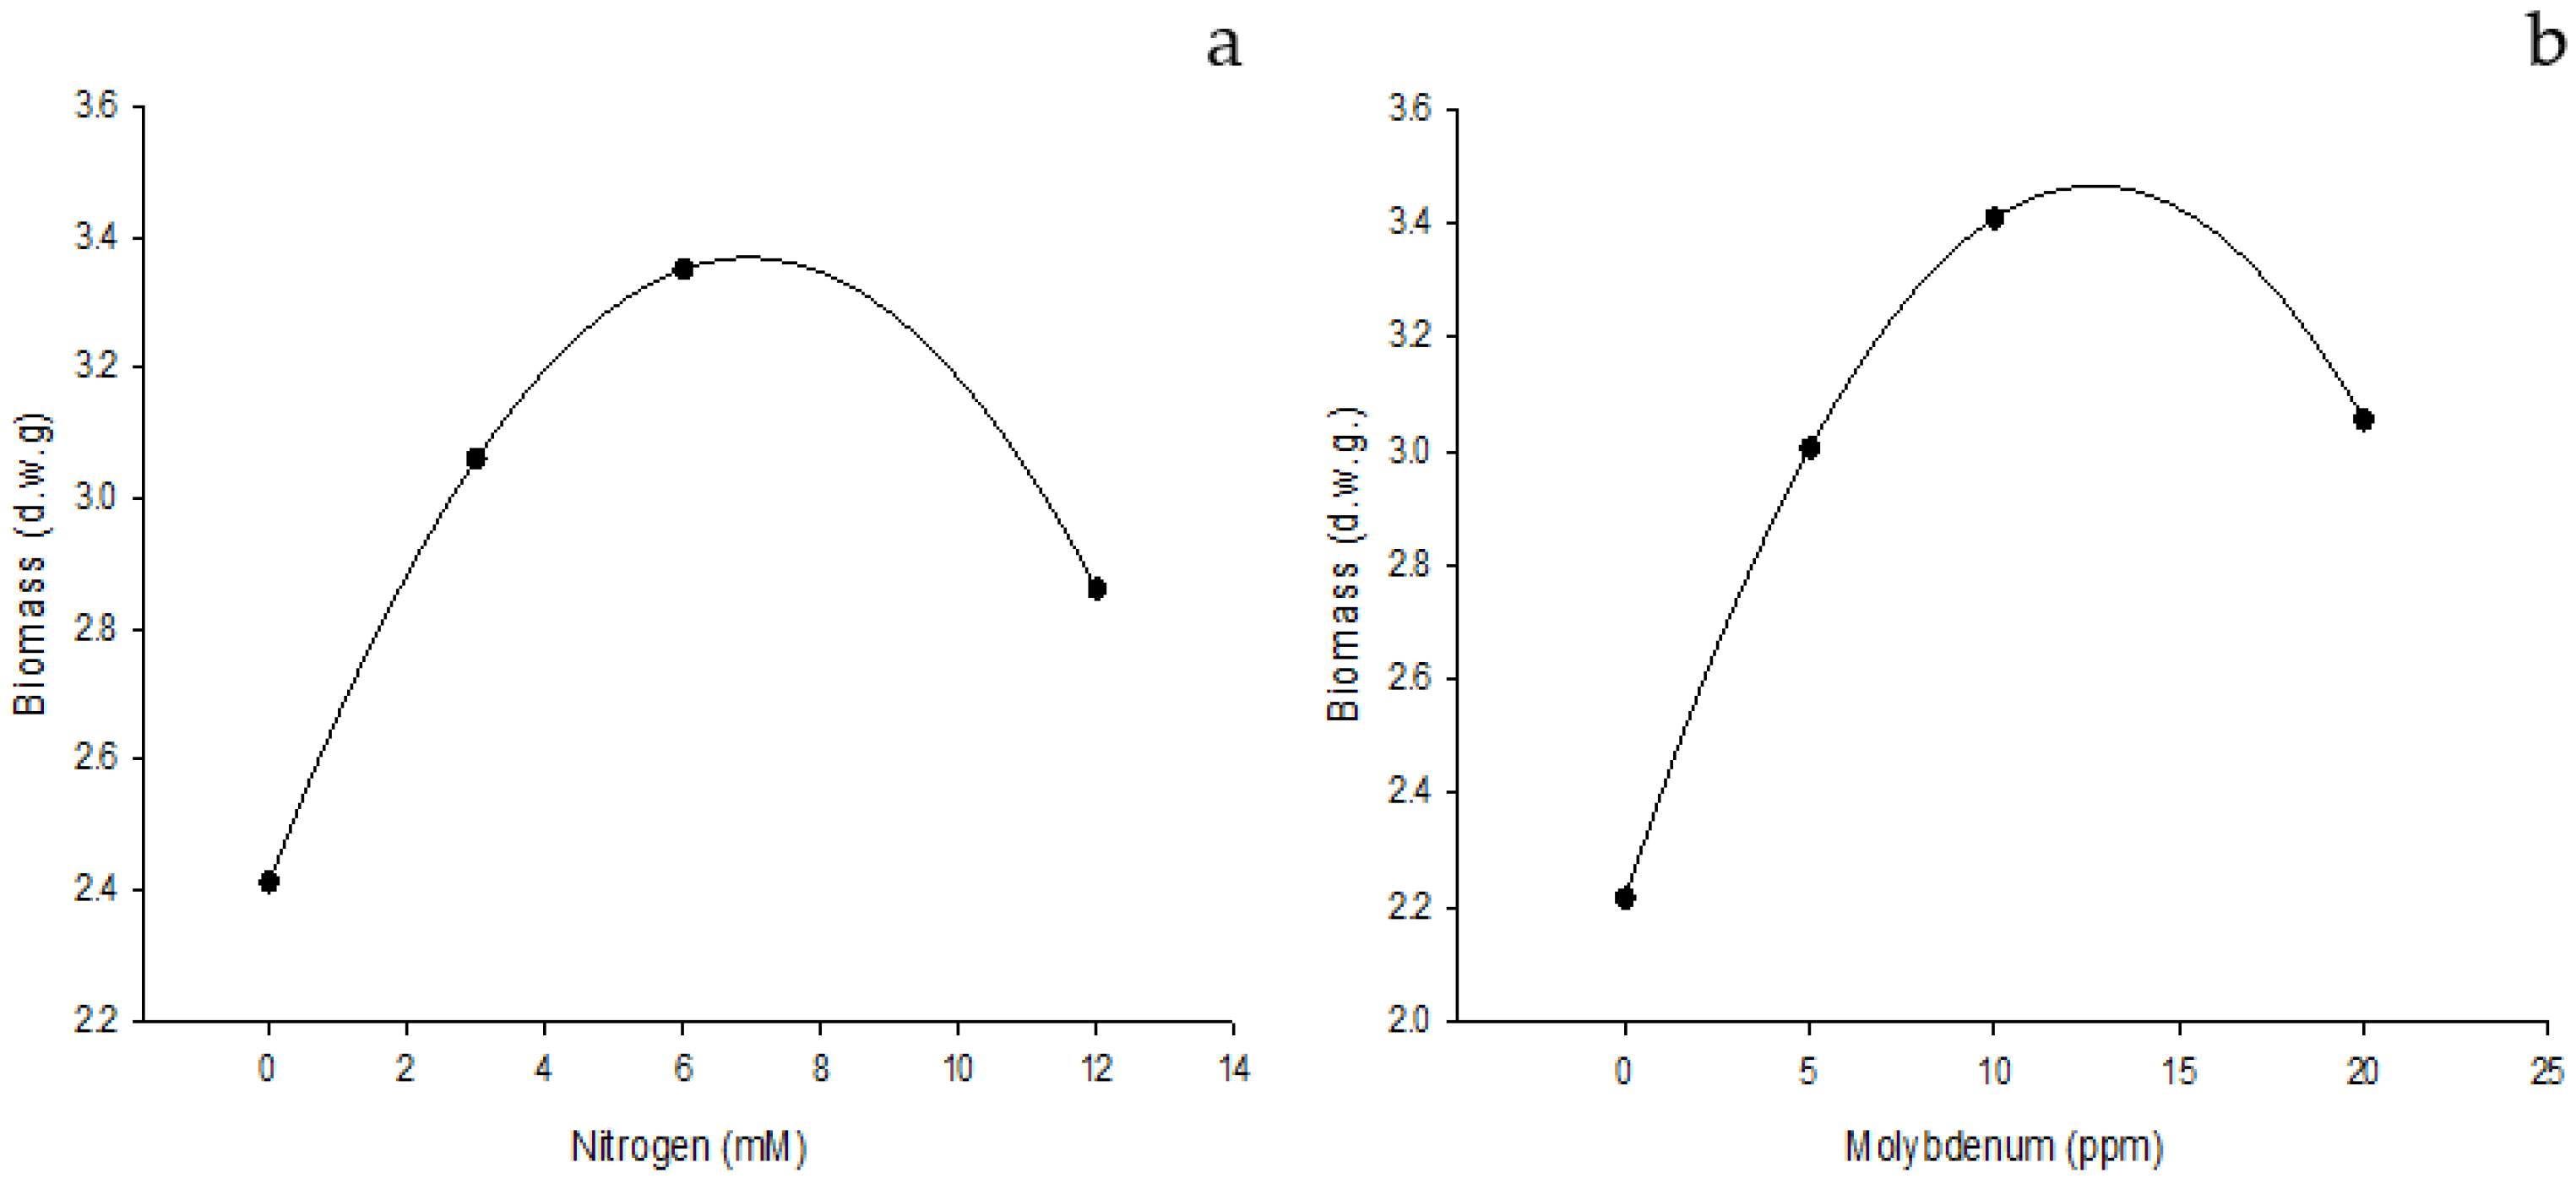
3.1. Effect of Edaphic Application of Nitrogen Supplemented with Foliar Fertilization of NanoMo on Biomass and Yield
3.2. Biomass
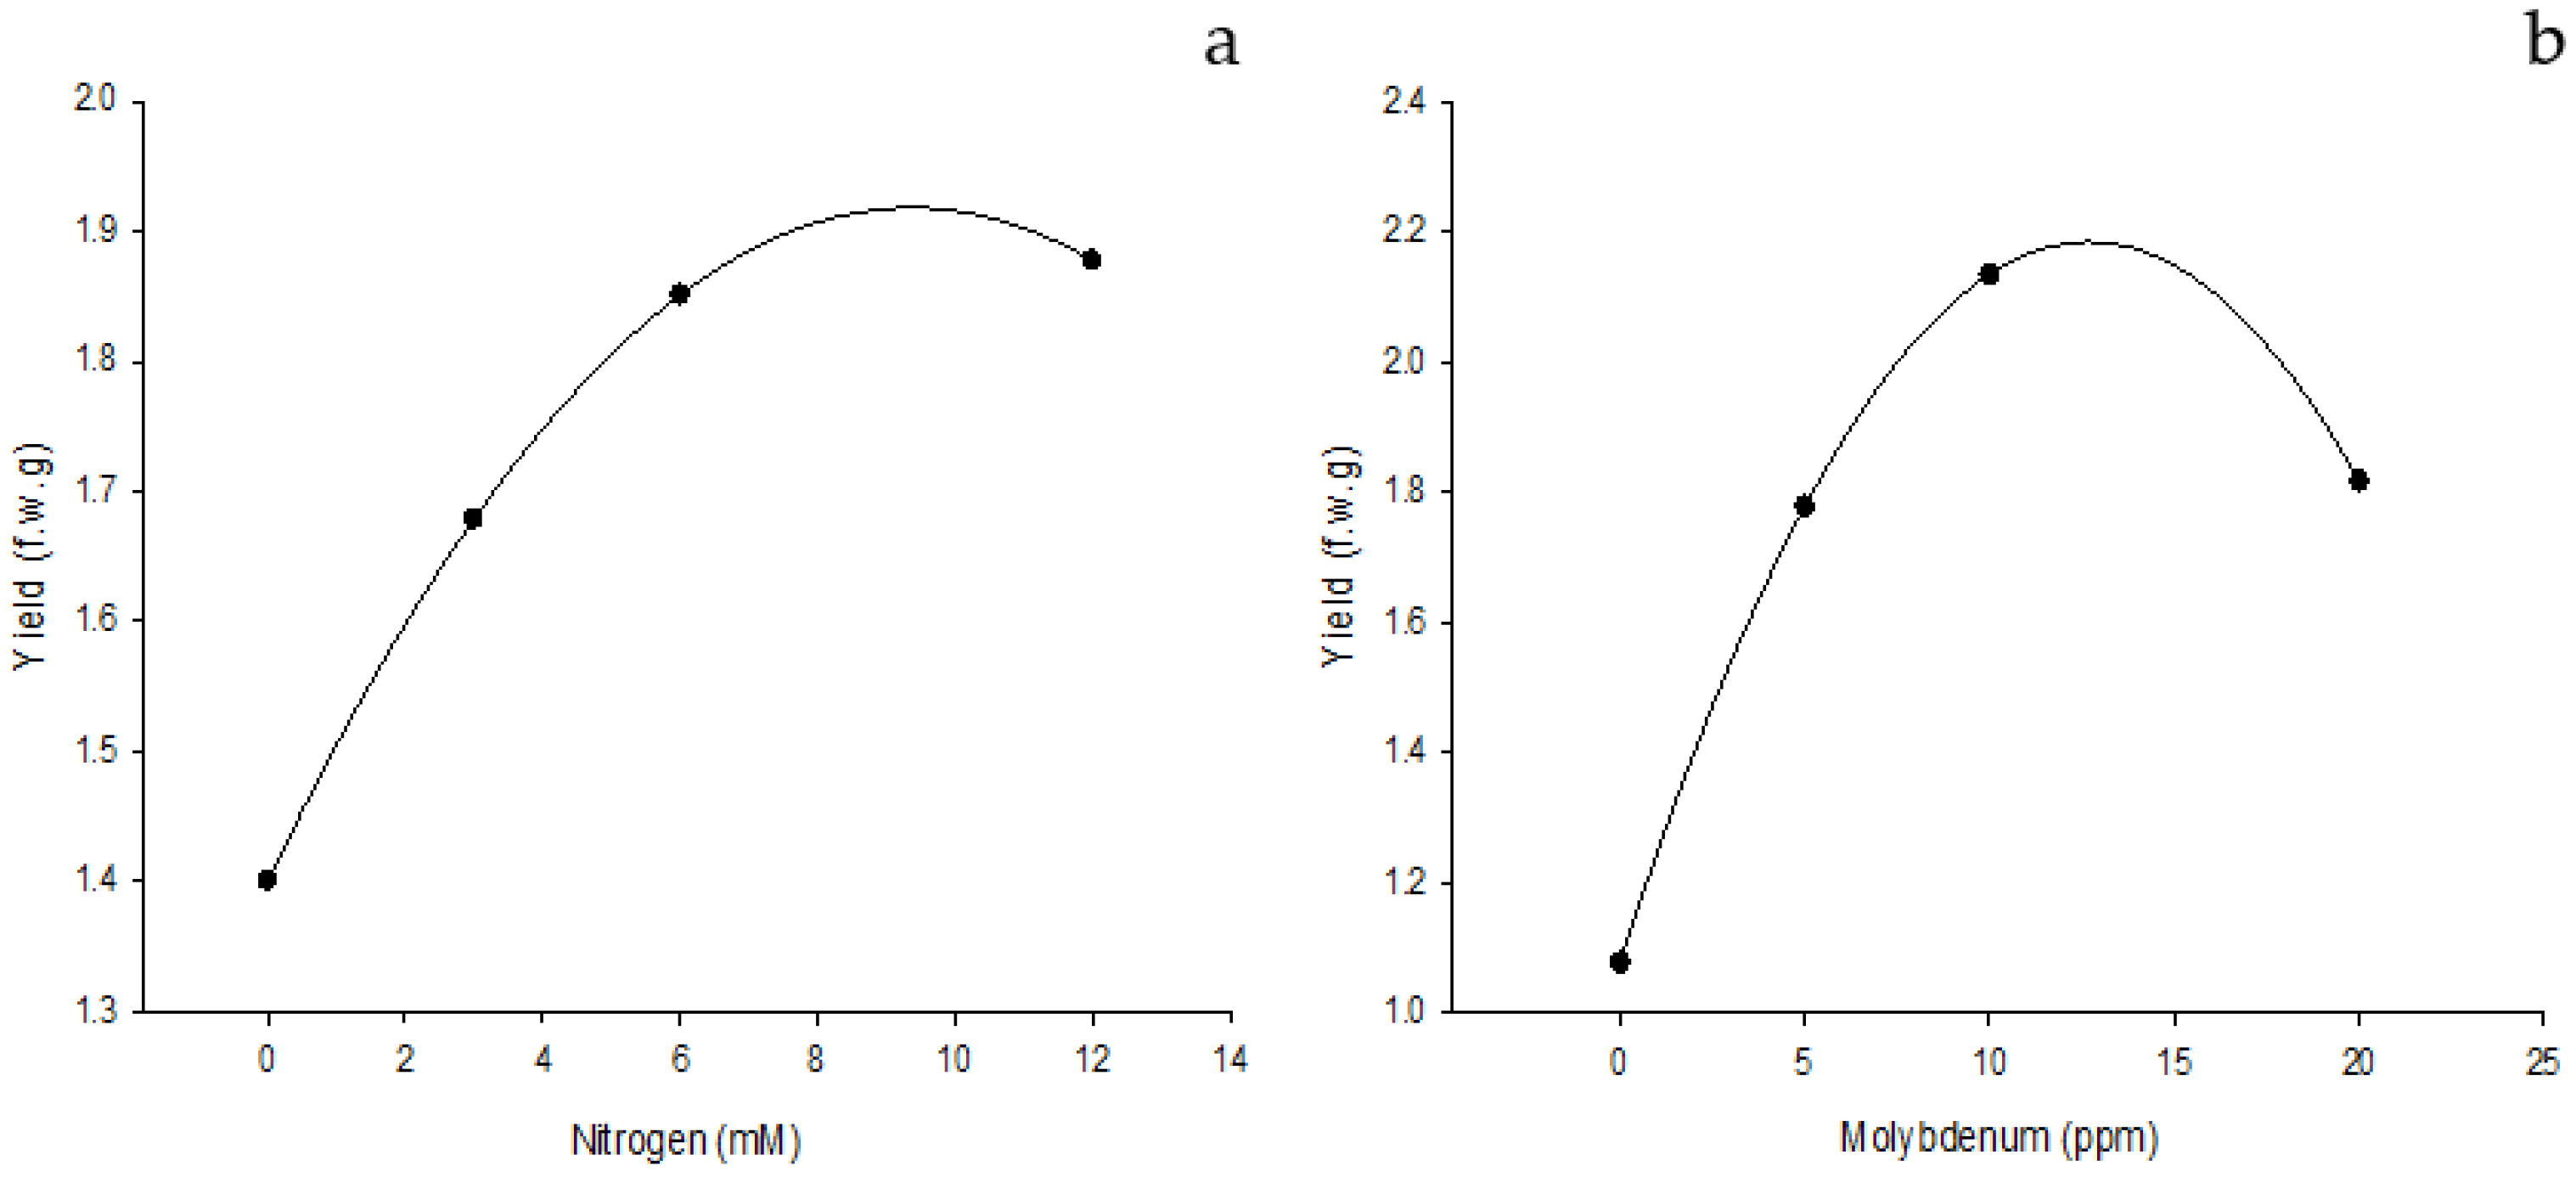
3.3. Yield
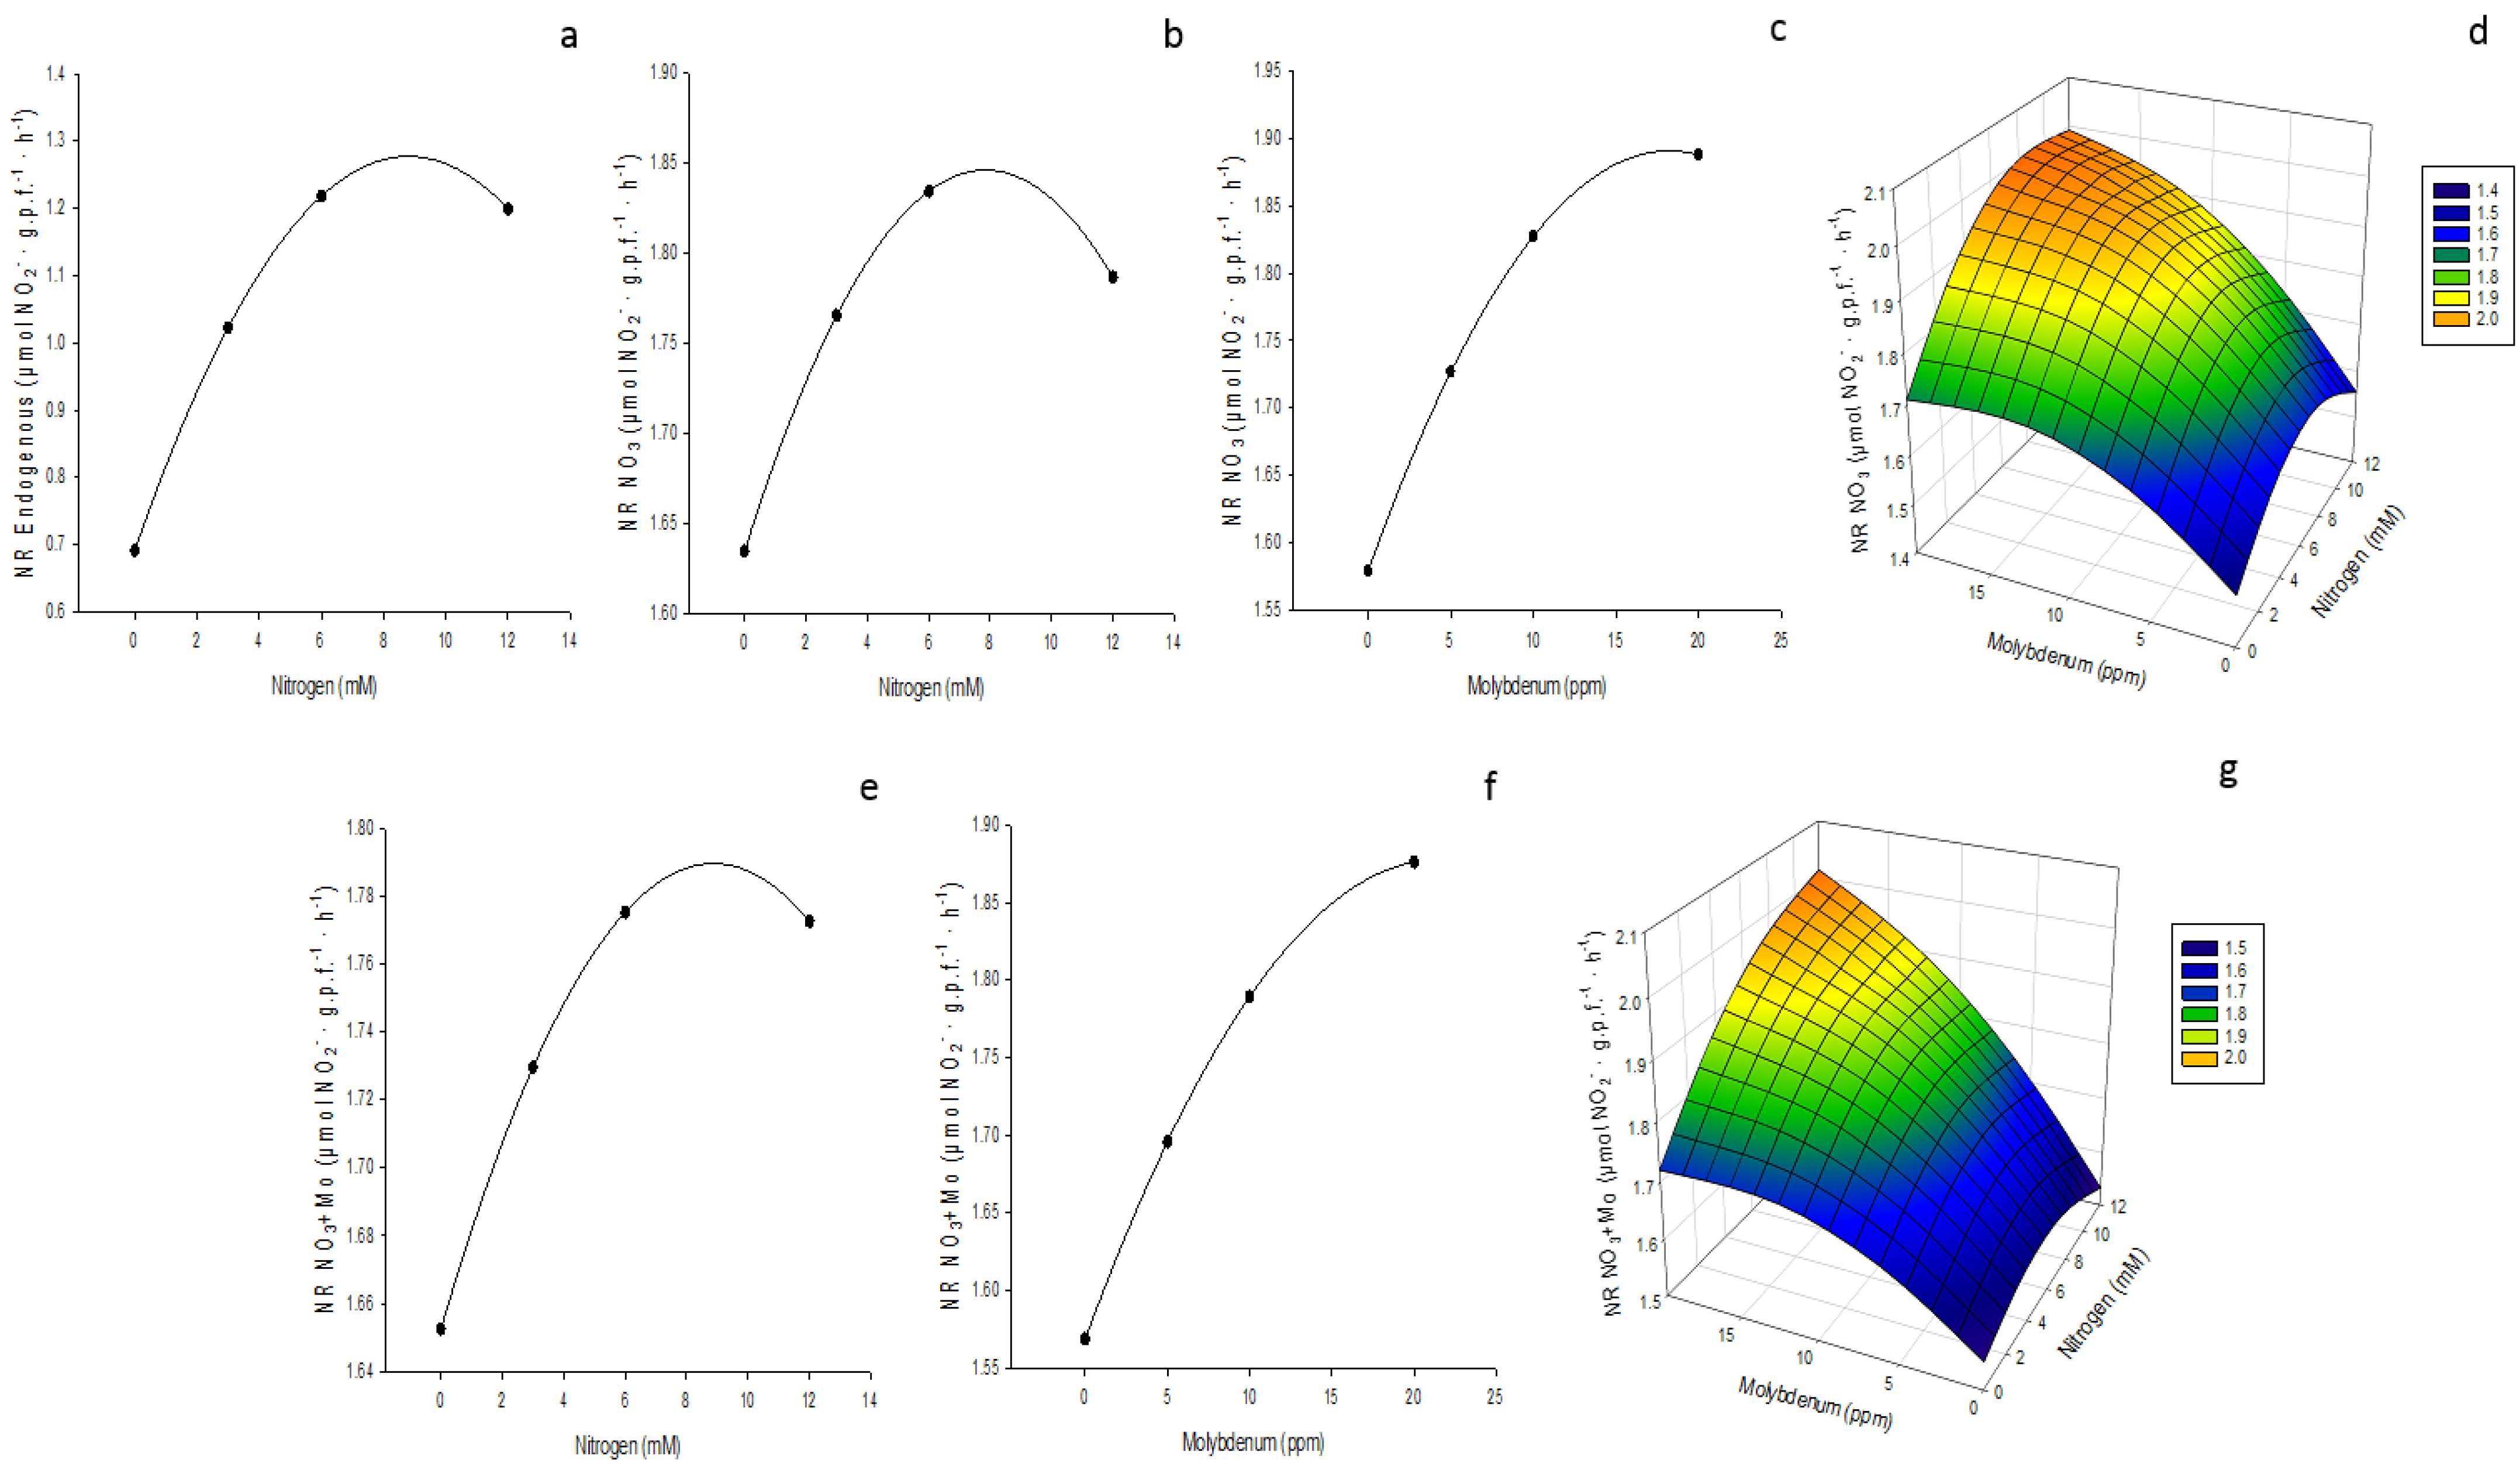
3.4. Nitrate Reductase Activity (NR)
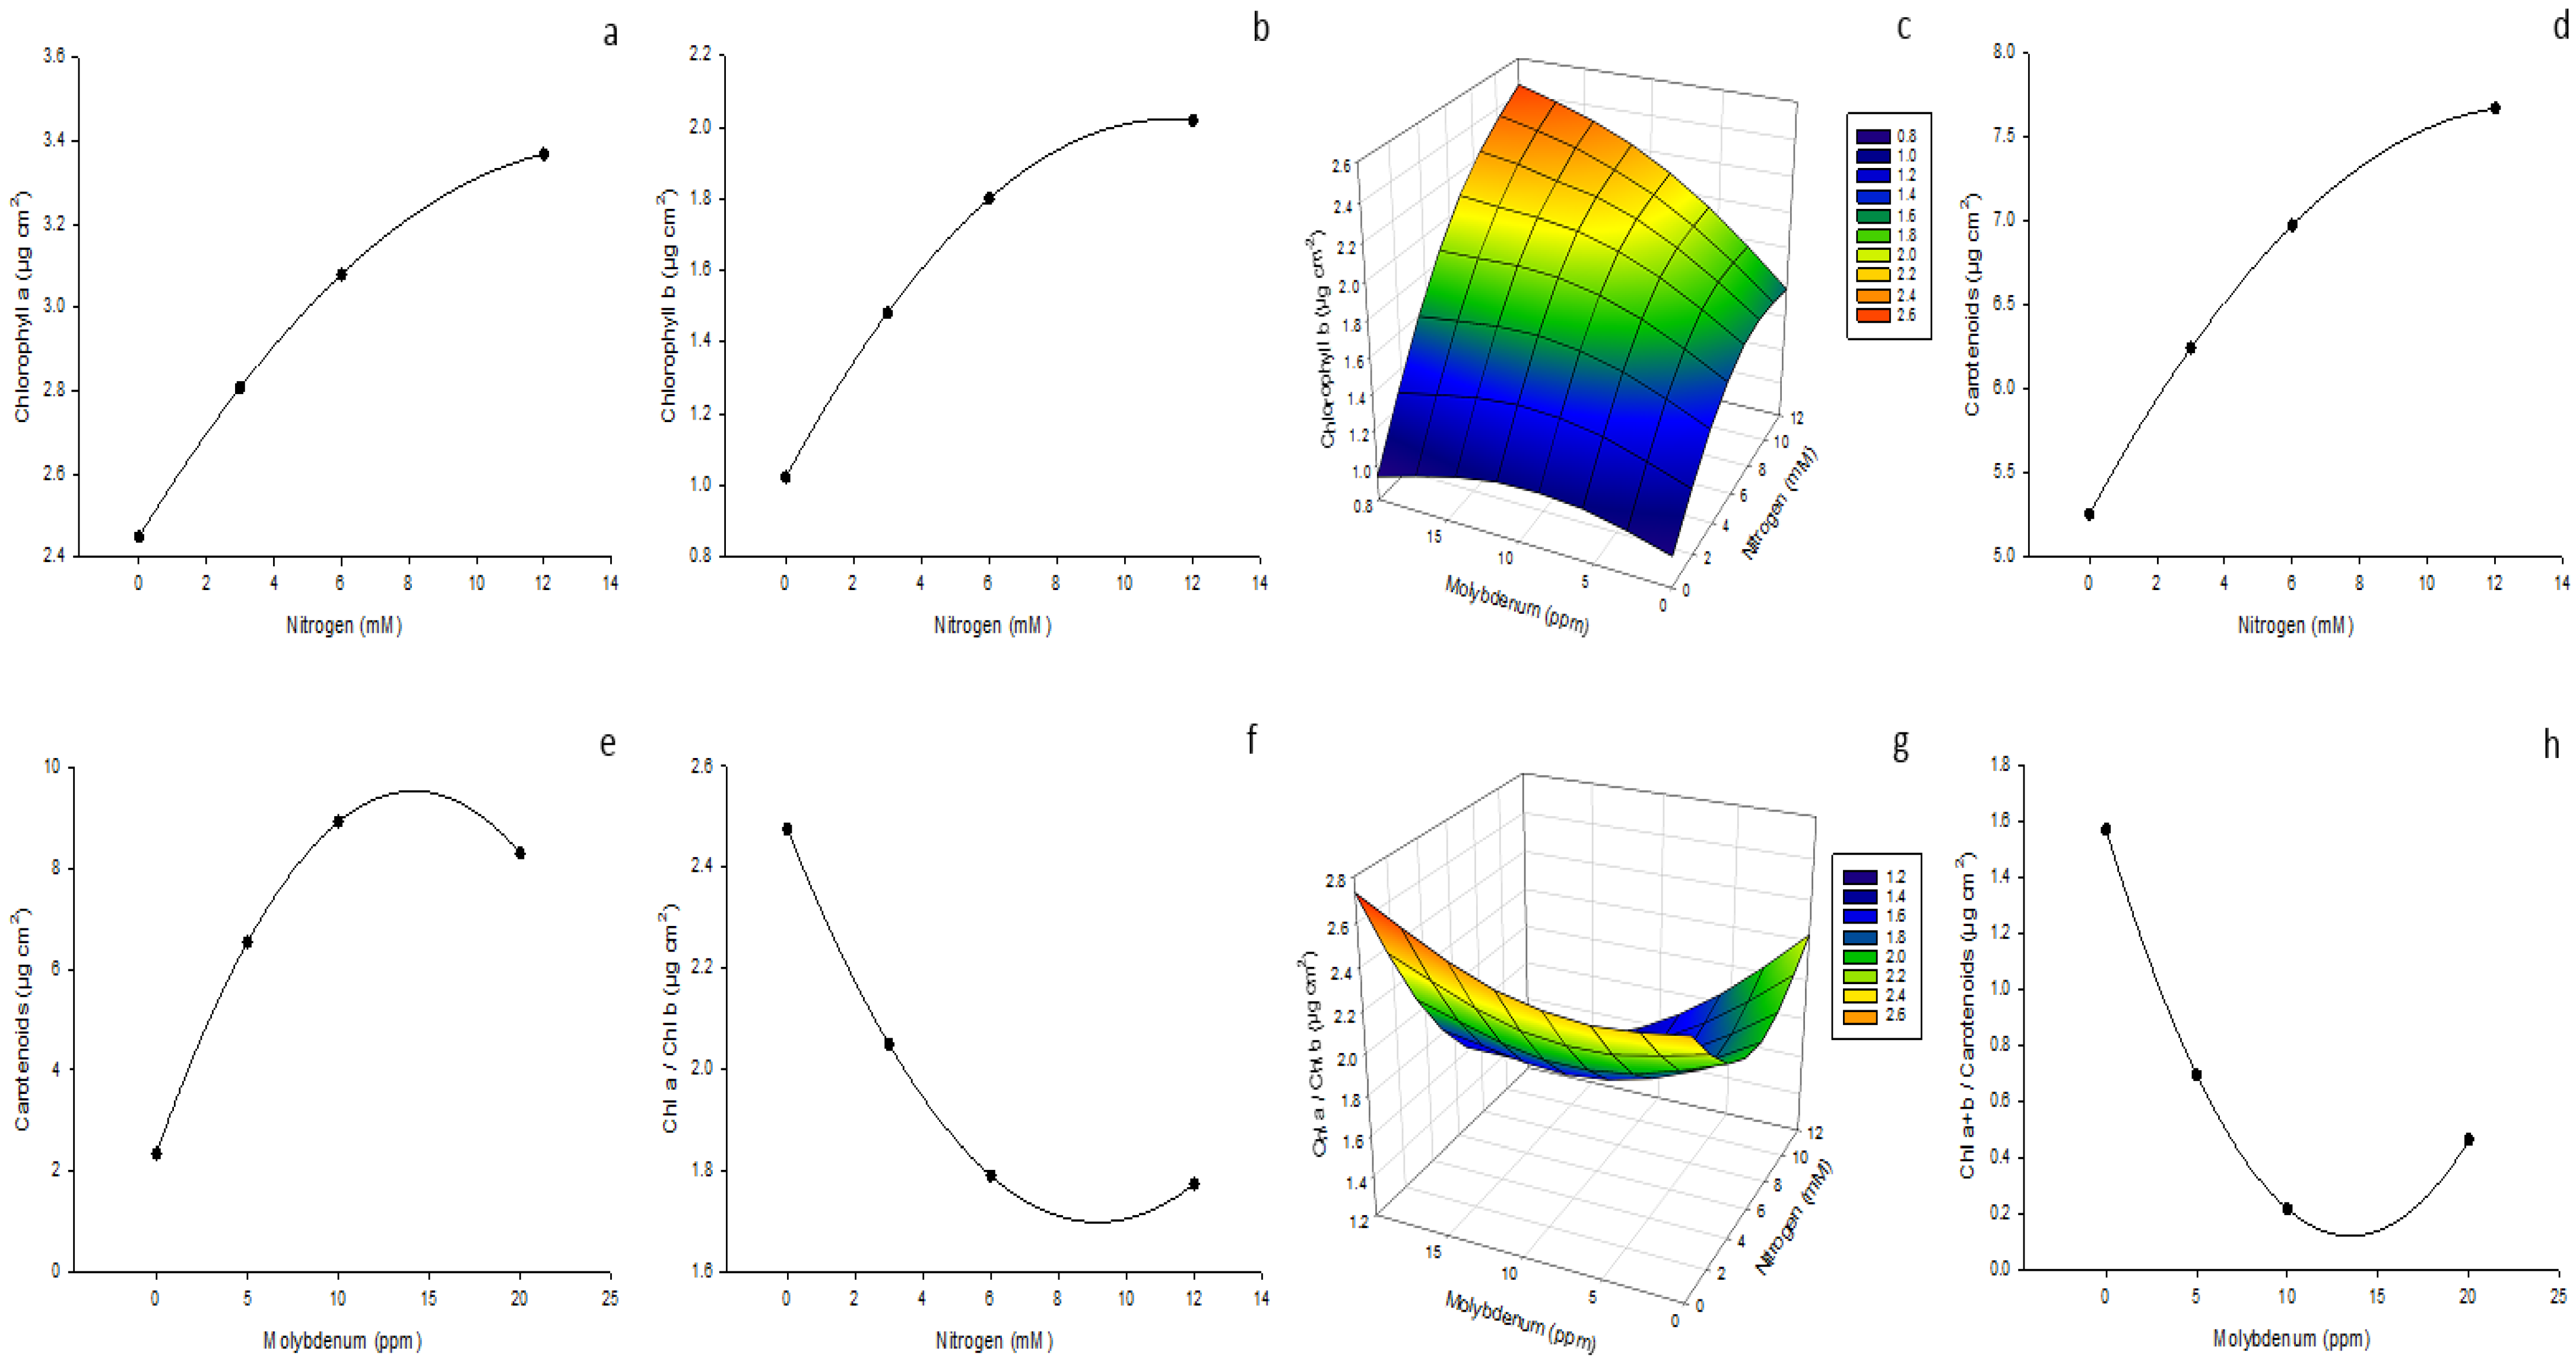
3.5. Photosynthetic Pigments
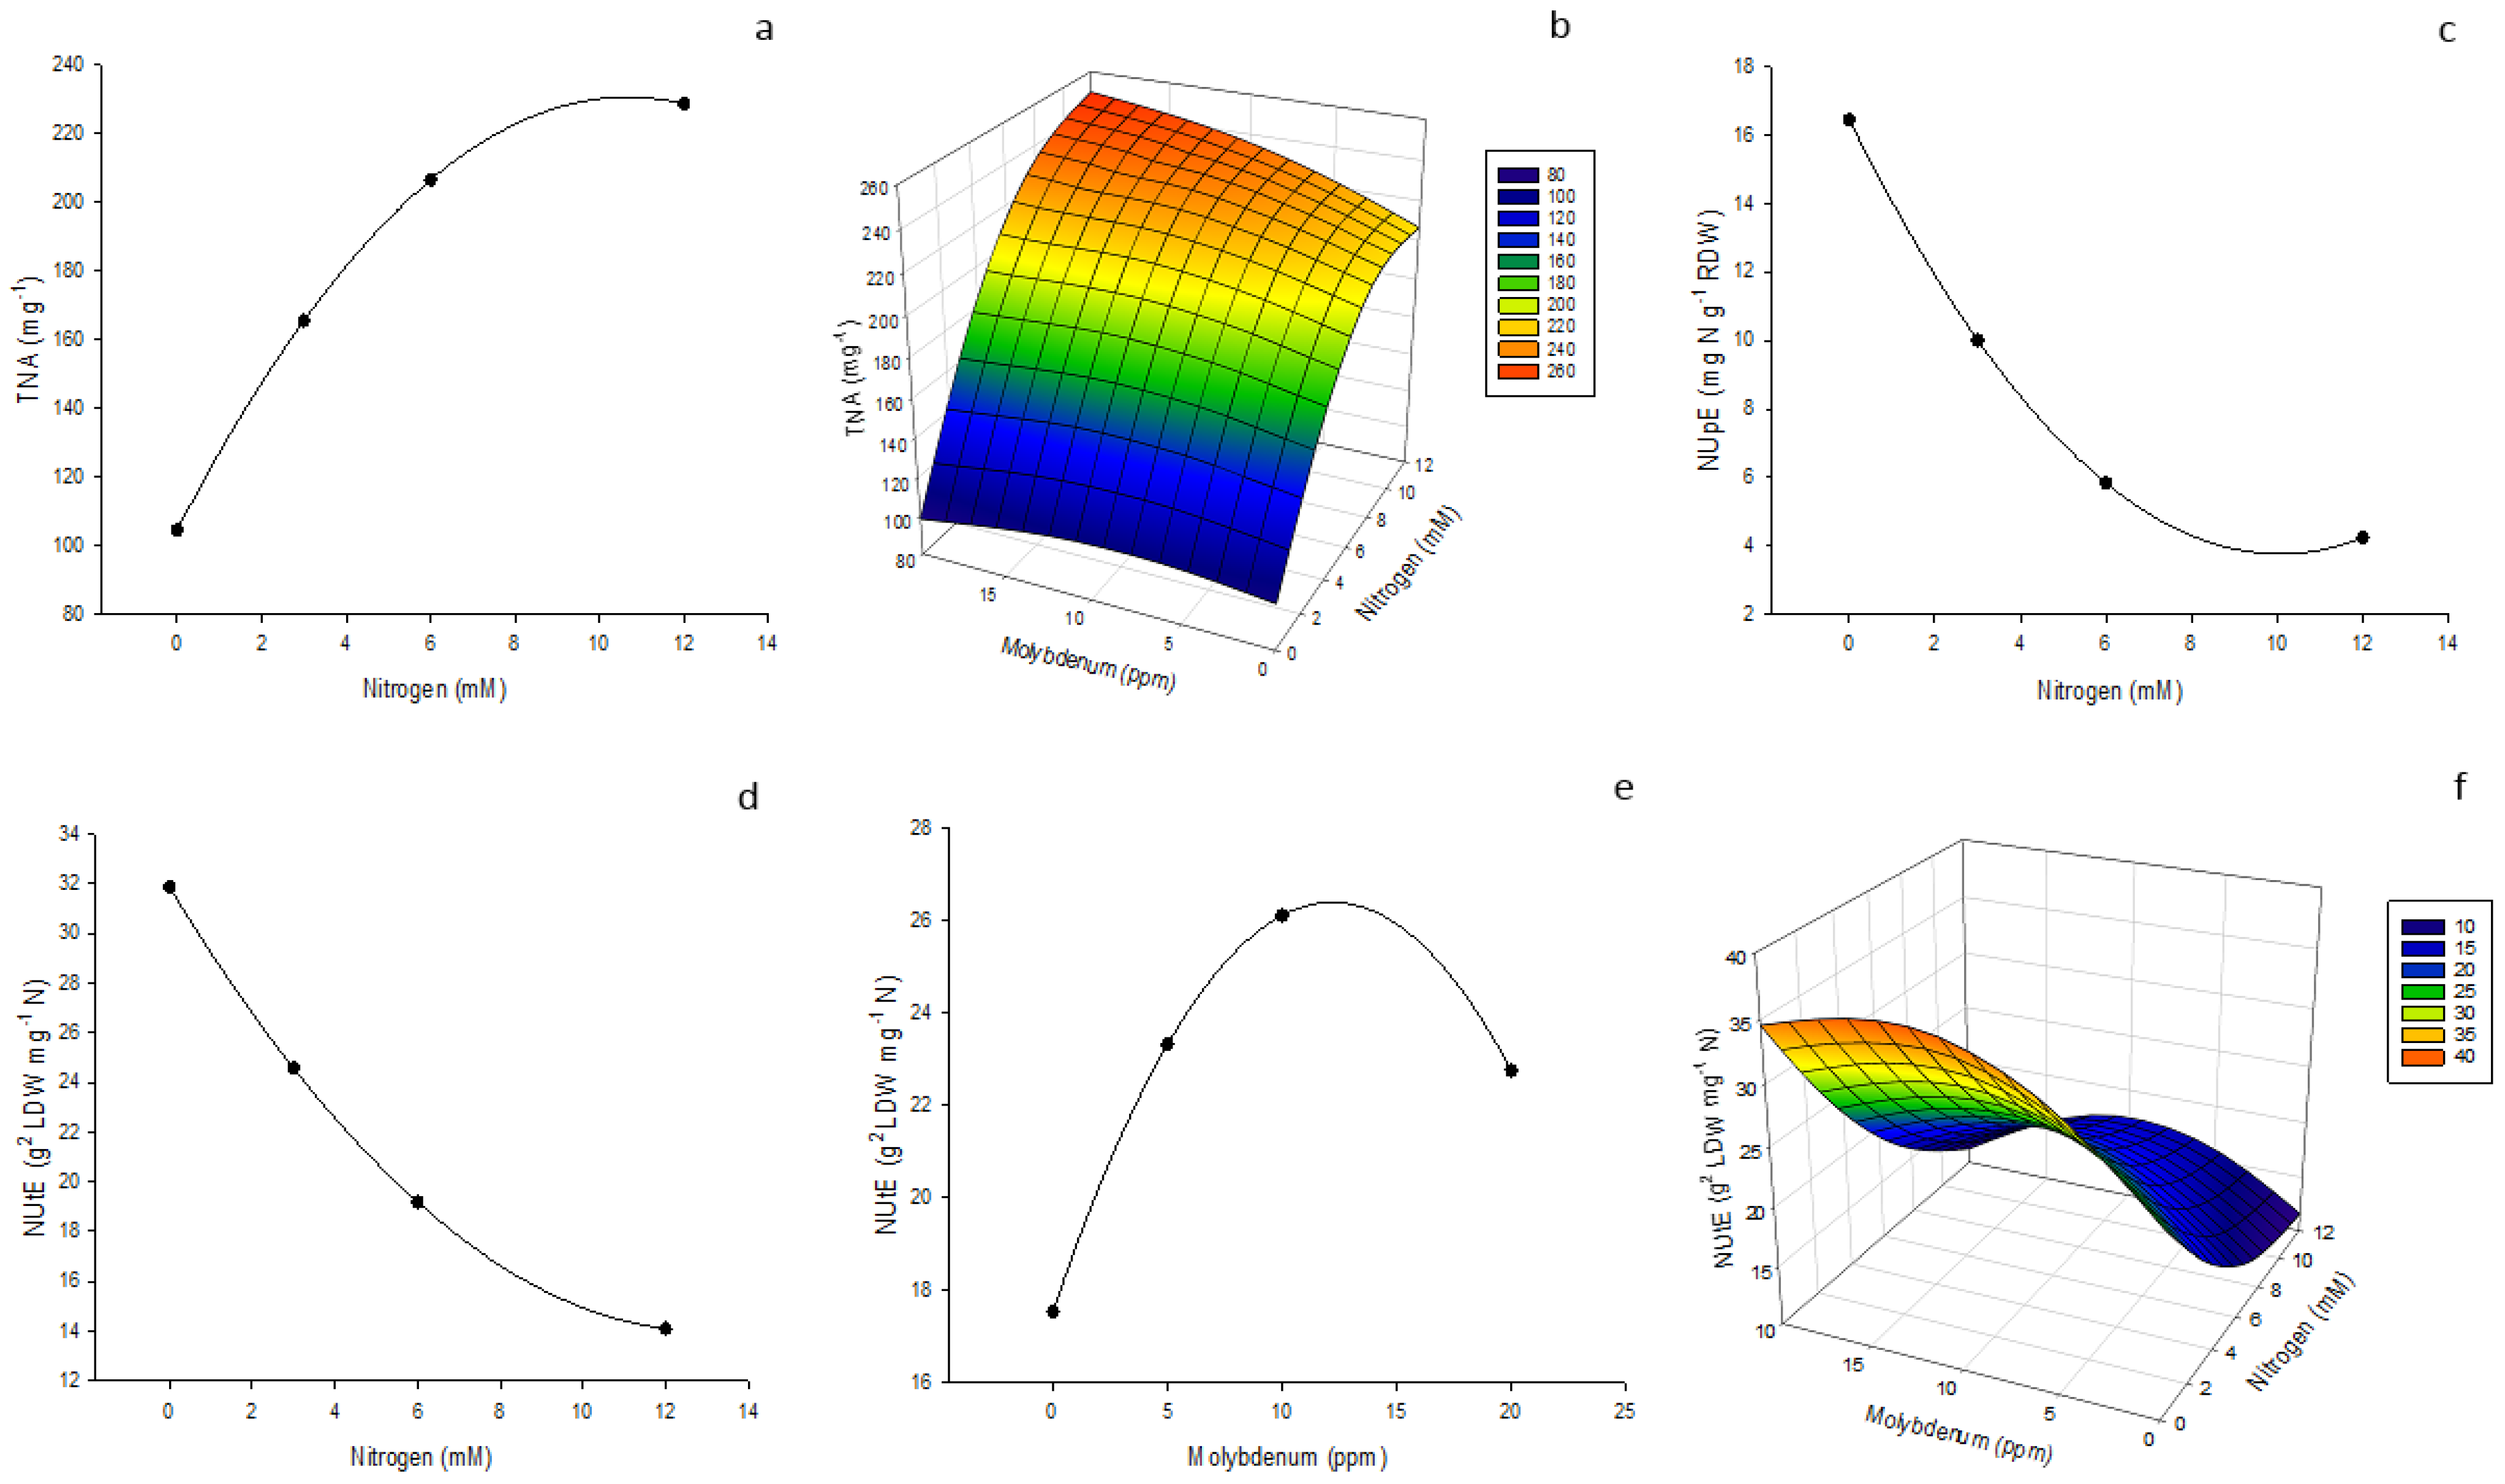
3.6. Nitrogen Use Efficiency Parameters (NUE)
4. Discussion
5. Conclusions
Author Contributions
Funding
Acknowledgments
Conflicts of Interest
References
- Trenkel, M.E. Slow and Controlled-Release and Stabilized Fertilizers: An Option for Enhancing Nutrient Use Efficiency in Agriculture, 2nd ed.; IFA: Paris, France, 2010; pp. 1–163. [Google Scholar]
- Wang, X.; Fan, J.; Xing, Y.; Xu, G.; Wang, H.; Deng, J.; Wang, Y.; Zhang, F.; Li, P.; Li, Z. The Effects of Mulch and Nitrogen Fertilizer on the Soil Environment of Crop Plants. Adv. Agron. 2018, 153, 121–173. [Google Scholar] [CrossRef]
- Nasar, J.; Shah, Z. Effect of iron and molybdenum on yield and nodulation of lentil. ARPN J. Agric. Biol. Sci. 2017, 12, 332–339. [Google Scholar]
- Santos, R.L.; Freire, F.J.; Oliveira, E.C.A.; Freire, M.B.G.S.; West, J.B.; Barbosa, J.A.; Moura, M.J.; Bezerra, P.C. Nitrate reductase activity and nitrogen and biomass accumulation in sugarcane under molybdenum and nitrogen fertilization. Rev. Bras. Cienc. Solo 2019, 43, e0180171. [Google Scholar] [CrossRef] [Green Version]
- Rana, M.S.; Bhantana, P.; Imran, M.; Saleem, M.H. Molybdenum potential vital role in plants metabolism for optimizing the growth and development. Ann. Environ. Sci. Toxicol. 2020, 4, 32–44. [Google Scholar] [CrossRef]
- Carlim, E.L.; Meert, L.; Reis, B.; Alleman, L.E. Fertilization with nickel and molybdenum in soybean: Effect on agronomic characteristics and grain quality. Terra Latinoam. 2019, 37, 217–222. [Google Scholar] [CrossRef] [Green Version]
- Tallkvist, J.; Oskarsson, A. Molybdenum. In Handbook on the Toxicology of Metals, 4th ed.; Academic Press: Cambridge, MA, USA, 2016; Chapter 47. [Google Scholar] [CrossRef]
- Alfaro, V.M.; Mejía, B.J.; Salazar, S.F. Nanofertilizante de aplicación foliar para uso en praderas. Campo Tecnol. INIA 2020, 17, 14–15. [Google Scholar]
- Hoagland, D.R.; Arnon, D.I. The Water Culture Method for Growing Plants without Soil; California Agricultural Experiment Station, University of California: Berkeley, CA, USA, 1950; p. 347. [Google Scholar]
- Sánchez, E.; Romero, L.; Ruíz, J.M. Caracterización del Estado Nutricional y Fisiológico en Plantas de Judía (Phaseolus vulgaris L. cv. Strike) Sometidas a un Estrés por Nitrógeno; Editorial de la Universidad de Granada: Granada, Spain, 2006; ISBN 84-338-4168-8. [Google Scholar]
- Dubos, B.; Snoeck, D.; Flori, A. Excessive use of fertilizer can increase leaching processes and modify soil reserves in two ecuadorian oil palm plantations. Exp. Agric. 2017, 53, 255–268. [Google Scholar] [CrossRef] [Green Version]
- Jaworski, E.G. Nitrate reductase assay in intact plant tissues. Biochem. Biophys. Res. Commun. 1971, 43, 1274–1279. [Google Scholar] [CrossRef]
- Ponce-García, C.O.; Soto-Parra, J.M.; Sánchez, E.; Muñoz-Márquez, E.; Piña-Ramírez, F.J.; Flores-Córdova, M.A.; Pérez-Leal, R.; Yáñez Muñoz, R.M. Efficiency of Nanoparticle, Sulfate, and Zinc-Chelate Use on Biomass, Yield, and Nitrogen Assimilation in Green Beans. Agronomy 2019, 9, 128. [Google Scholar] [CrossRef] [Green Version]
- Chhipa, H. Nanofertilizers and nanopesticides for agriculture. Environ. Chem. Lett. 2017, 15, 15–22. [Google Scholar] [CrossRef]
- Sidiqui, M.H.; Al-Whaibi, M.H.; Firoz, M.; Al-Khaishany, M.Y. Role of nanoparticles in plants. In Nanotechnology and Plant Sciences; Siddiqui, M.H., Al-Whaibi, M.H., Mohamed, F., Eds.; Springer: New York, NY, USA, 2015; pp. 19–35. [Google Scholar]
- Wellburn, A.R. The spectral determination of chlorophylls a and b, as well as total carotenoids, using various solvents with spectrophotometers of different resolution. J. Plant Physiol. 1994, 14, 307–313. [Google Scholar] [CrossRef]
- SAS Institute Inc. SAS/STATR User’s Guide, Version 6, 4th ed.; SAS Institute Inc.: Cary, NC, USA, 1989; Volume 2, pp. 1457–1478. [Google Scholar]
- Vargas, H.M.; Zarate, D.L.G.P.; Burguete, H.F. Factoriales fraccionados y superficie de respuesta, uso de paquetes estadísticos para microcomputadoras. Monogr. Man. Estad. Cómput. 1991, 10, 1. [Google Scholar]
- Kiba, T.; Krapp, A. Plant Nitrogen Acquisition Under Low Availability: Regulation of Uptake and Root Architecture. Plant Cell Physiol 2016, 57, 707–714. [Google Scholar] [CrossRef] [Green Version]
- Pacheco, R.S.; Brito, L.F.; Straliotto, R.; Pérez, D.V.; Araújo, A.P. Seeds enriched with phosphorus and molybdenum as a strategy for improving grain yield of common bean crop. Field Crops Res. 2012, 136, 97–106. [Google Scholar] [CrossRef]
- Naderi, M.R.; Danesh-Shahraki, A. Nanofertilizers and their roles in sustainable agriculture. Int. J. Agric. Crop Sci. 2013, 5, 22–29. [Google Scholar]
- Mendel, R.R.; Hänsch, R. Molybdoenzymes and molybdenum cofactor in plants. J. Exp. Bot. 2002, 53, 1689–1698. [Google Scholar] [CrossRef] [Green Version]
- Bekele, G.; Dechassa, N.; Tana, T.; Sharma, J.J. Effects of nitrogen, phosphorus and vermicompost fertilizers on productivity of groundnut (Arachis hypogaea L.) in Babile, Eastern Ethiopia. Agron. Res. 2019, 17, 1532–1546. [Google Scholar]
- Subramanian, K.S.; Manikandan, A.; Thirunavukkarasu, M.; Rahale, C.S. Nano-fertilizers for balanced crop nutrition. In Nanotechnologies in Food and Agriculture; Springer: Cham, Switzerland, 2015; pp. 69–80. [Google Scholar]
- Kah, M.; Kookana, R.S.; Gogos, A.; Bucheli, T.D. A critical evaluation of nanopesticides and nanofertilizers against their conventional analogues. Nat. Nanotechnol. 2018, 13, 677. [Google Scholar] [CrossRef]
- Chen, B.M.; Wang, Z.H.; Li, S.X.; Wang, G.X.; Song, H.X.; Wang, X.N. Effects of nitrate supply on plant growth, nitrate accumulation, metabolic nitrate concentration and nitrate reductase activity in three leafy vegetables. Plant Sci. 2004, 167, 635–643. [Google Scholar] [CrossRef]
- Raliya, R.; Saharan, V.; Dimkpa, C.; Biswas, P. Nanofertilizer for precision and sustainable agriculture: Current state and future perspectives. J. Agric. Food Chem. 2017, 66, 6487–6503. [Google Scholar] [CrossRef]
- Ahmadreza, A.; Babak, V.K.; Maryam, A.I. Effect of green synthesized molybdenum nanoparticles on nitrate accumulation and nitrate reductase activity in spinach. J. Plant Nutr. 2019, 43, 13–27. [Google Scholar] [CrossRef]
- Sawires, E.S. Effect of phosphorus fertilization and micronutrients on yield and yield components of chickpea (Cicer arietinum L.). Ann. Agric. Sci. Cairo 2001, 46, 155–164. [Google Scholar]
- Wei, L.-P.; Li, Y.-R.; Yang, L.-T. Effects of Molybdenum on Nitrogen Metabolism of Sugarcane. Academy of Agricultural Sciences, Sugarcane Research Center, Chinese Academy of Agricultural Sciences, China. Sugar Tech 2007, 9, 36–42. [Google Scholar] [CrossRef]
- Hachiya, T.; Sakakibara, H. Interactions between nitrate and ammonium in their uptake, allocation, assimilation, and signaling in plants. J. Exp. Bot. 2017, 68, 2501–2512. [Google Scholar] [CrossRef] [PubMed]
- Combatt, C.; Enrique, P.P.; Dairo, J.; Jarma-Orozco, A. Efecto del nitrógeno y el potasio sobre el intercambio gaseoso y la distribución de biomasa en albahaca (Ocimum basillicum L.). Rev. Colomb. Cienc. Hortícolas 2018, 12, 192–201. [Google Scholar] [CrossRef]
- Armendáriz-Fernández, K.V.; Herrera-Hernández, I.M.; Muñoz-Márquez, E.; Sánchez, E. Characterization of Bioactive Compounds, Mineral Content, and Antioxidant Activity in Bean Varieties Grown with Traditional Methods in Oaxaca, Mexico. Antioxidants 2019, 8, 26. [Google Scholar] [CrossRef] [Green Version]
- Rosales, M.A.; Franco-Navarro, J.D.; Peinado-Torrubia, P.; Díaz-Rueda, P.; Álvarez, R.; Colmenero-Flores, J.M. Chloride Improves Nitrate Utilization and NUE in Plants. Front. Plant Sci. 2020, 11, 442. [Google Scholar] [CrossRef]
- Hua, L.; Bin, H.; Chengcai, C. Nitrogen use efficiency in crops: Lessons from Arabidopsis and rice. J. Exp. Bot. 2017, 68, 2477–2488. [Google Scholar] [CrossRef] [Green Version]
- Hasaan, A.E.; Said, M.G.; Alaa, H.R.; Radi, S.K. Effects of Different Nitrogen Fertilization Rates and Foliar Application of Humic Acid, Fulvic Acid and Tryptophan on Growth, Productivity and Chemical Composition of Common Bean Plants (Phaseolus vulgaris L.). Alex. Sci. Exch. J. 2020, 41, 191–204. [Google Scholar] [CrossRef]


| Growth | ||
|---|---|---|
| Biomass | Yield | |
| Mo Source | 0.0001 U | 0.0001 |
| NanoMo | 2.92 a V | 1.70 a |
| Mo Chelate | 2.21 b | 1.08 c |
| Na Molybdate | 2.28 b | 1.33 b |
| MSD | 0.29 W | 0.22 |
| Nitrogen X | 0.0002 | 0.0024 |
| 0 | 2.13 c | 1.18 c |
| 3 | 2.60 ab | 1.30 bc |
| 6 | 2.78 a | 1.56 a |
| 12 | 2.34 bc | 1.44 ab |
| MSD | 0.25 | 0.25 |
| Molybdenum Y | <0.0001 | <0.0001 |
| 0 | 2.26 b | 2.27 b |
| 5 | 2.36 b | 1.36 b |
| 10 | 2.65 a | 2.65 a |
| 20 | 2.60 a | 2.60 a |
| MSD | 0.23 | 0.23 |
| SoMo × N | 0.3968 | 0.0311 |
| SoMo × Mo | <0.0001 | <0.0001 |
| N × Mo | 0.0481 | 0.0599 |
| SoMo × N × Mo | 0.6020 | 0.7049 |
| µ | 2.47 | 1.37 |
| C.V. | 17.75 | 30.04 |
| R2 | 0.7724 | 0.7093 |
| Biomass | |||||||||||
|---|---|---|---|---|---|---|---|---|---|---|---|
| NanoMo | Mo Chelate | Na Molybdate | |||||||||
| CV | 11.50 | R2 | 0.7520 | CV | 23.61 | R2 | 0.1668 | CV | 26.92 | R2 | 0.1654 |
| Regression | Factors | Regression | Factors | Regression | Factors | ||||||
| L | <0.0001 | N | Mo | L | 0.9424 | N | Mo | L | 0.1266 | N | Mo |
| C | <0.0001 | <0.0001 | <0.0001 | C | 0.0066 | 0.0347 | 0.4120 | C | 0.0349 | 0.0653 | 0.2754 |
| P | 0.1367 | L, C | L, C | P | 0.4723 | L, C | P | 0.7615 | L, C | ||
| Model | <0.0001 | Model | 0.0544 | Model | 0.0565 | ||||||
| Source | Es | SE | p > t | Source | Es | SE | p > t | Source | Es | SE | p > t |
| Int | 1.7961 | 0.1210 | <0.0001 | Int | 2.0772 | 0.1881 | <0.0001 | Int | 1.8780 | 0.2211 | <0.0001 |
| N | 0.2583 | 0.0358 | <0.0001 | N | 0.1594 | 0.0557 | 0.0059 | N | 0.1644 | 0.0654 | 0.0149 |
| Mo | 0.1864 | 0.0215 | <0.0001 | Mo | −0.0413 | 0.0334 | 0.2209 | Mo | 0.0005 | 0.0392 | 0.9885 |
| N × N | −0.0198 | 0.0026 | <0.0001 | N × N | −0.0120 | 0.0040 | 0.0047 | N × N | −0.0126 | 0.0048 | 0.0109 |
| Mo × N | 0.0019 | 0.0012 | 0.1367 | Mo × N | −0.0014 | 0.0019 | 0.4723 | Mo × N | 0.0007 | 0.0023 | 0.7615 |
| Mo × Mo | −0.0077 | 0.0009 | <0.0001 | Mo × Mo | 0.0022 | 0.0014 | 0.1339 | Mo × Mo | 0.0007 | 0.0017 | 0.6649 |
| Eigenvectors | Eigenvectors | Eigenvectors | |||||||||
| Eigenva | −0.6780 | 0.8535 | 0.5210 | Eigenva | 0.2267 | −0.0652 | 0.9978 | Eigenva | 0.0762 | 0.0402 | 0.9999 |
| −0.8084 | −0.5210 | 0.8535 | −0.4362 | 0.9978 | 0.0652 | −0.4564 | 0.9999 | −0.0402 | |||
| Yield | |||||||||||
|---|---|---|---|---|---|---|---|---|---|---|---|
| NanoMo | Mo Chelate | Na Molybdate | |||||||||
| CV | 18.83 | R2 | 0.6661 | CV | 23.61 | R2 | 0.1668 | CV | 33.18 | R2 | 0.3181 |
| Regression | Factors | Regression | Factors | Regression | Factors | ||||||
| L | <0.0001 | N | Mo | L | 0.9424 | N | Mo | L | <0.0001 | N | Mo |
| C | <0.0001 | 0.0002 | <0.0001 | C | 0.0066 | 0.0347 | 0.4120 | C | 0.1016 | 0.0016 | 0.0272 |
| P | 0.5980 | L, C | L, C | P | 0.4723 | C | C | P | 0.7316 | L, C | L, C |
| Model | <0.0001 | Model | 0.5403 | Model | 0.0004 | ||||||
| Source | Es | SE | p > t | Source | Est | SE | p > t | Source | Est | SE | p > t |
| Int | 0.7459 | 0.1154 | <0.0001 | Int | 1.1932 | 0.1842 | <0.0001 | Int | 0.8428 | 0.1593 | <0.0001 |
| N | 0.1161 | 0.0342 | 0.0012 | N | 0.0215 | 0.0545 | 0.6947 | N | 0.1283 | 0.0472 | <0.0001 |
| Mo | 0.1779 | 0.0205 | <0.0001 | Mo | −0.0001 | 0.0327 | 0.9967 | Mo | −0.0083 | 0.0283 | 0.7683 |
| N × N | −0.0058 | 0.0025 | 0.0224 | N × N | −0.0042 | 0.0040 | 0.2931 | N × N | −0.0061 | 0.0034 | 0.0809 |
| Mo × N | −0.0006 | 0.0012 | 0.5980 | Mo × N | 0.0016 | 0.0019 | 0.3964 | Mo × N | −0.0005 | 0.0016 | 0.7316 |
| Mo × Mo | −0.0068 | 0.0009 | <0.0001 | Mo × Mo | −0.0007 | 0.0014 | 0.6069 | Mo × Mo | 0.0015 | 0.0012 | 0.2104 |
| Eigenvectors | Eigenvectors | Eigenvectors | |||||||||
| Eigenva | −0.2113 | 0.9991 | −0.0407 | Eigenva | 0.2267 | −0.0652 | 0.9978 | Eigenva | 0.1588 | −0.0457 | 0.9989 |
| −0.6883 | 0.0407 | 0.9991 | −0.4362 | 0.9978 | 0.0652 | −0.2224 | 0.9989 | 0.0457 | |||
| Nitrate Reductase | ||||
|---|---|---|---|---|
| Endogenous | NO3 | Mo | NO3 + Mo | |
| Mo Source | <0.0001 U | 0.0005 | <0.0001 | 0.0003 |
| NanoMo | 0.62 c V | 2.88 b | 1.02 c | 2.96 b |
| Na Molybdate | 1.41 b | 3.40 a | 1.42 b | 3.13 b |
| Mo Chelate | 1.98 a | 3.56 a | 2.13 a | 3.50 a |
| MSD | 0.37 W | 0.31 | 0.38 | 0.23 |
| Nitrogen X | <0.0001 | <0.0001 | <0.0001 | <0.0001 |
| 0 | 0.47 c | 2.78 b | 0.66 c | 2.76 b |
| 3 | 1.42 b | 3.45 a | 1.62 b | 3.43 a |
| 6 | 1.63 ab | 3.42 a | 1.78 ab | 3.17 a |
| 12 | 1.83 a | 3.46 a | 2.03 a | 3.42 a |
| MSD | 0.40 | 0.36 | 0.32 | 0.29 |
| Molybdenum Y | 0.0090 | <0.0001 | 0.1310 | <0.0001 |
| 0 | 1.60 a | 2.68 c | 1.69 a | 2.66 c |
| 5 | 1.14 b | 3.49 ab | 1.32 a | 3.29 b |
| 10 | 1.16 b | 3.26 b | 1.54 a | 3.20 b |
| 20 | 1.46 ab | 3.69 a | 1.54 a | 3.63 a |
| MSD | 0.42 | 0.29 | 0.40 | 0.23 |
| SoMo × N | <0.0001 | <0.0001 | <0.0001 | <0.0001 |
| SoMo × Mo | 0.1634 | <0.0001 | 0.9616 | <0.0001 |
| N × Mo | 0.0048 | <0.0001 | 0.0048 | <0.0001 |
| SoMo × N × Mo | <0.0001 | <0.0001 | <0.0001 | <0.0001 |
| µ | 1.34 | 3.28 | 1.52 | 3.20 |
| C.V. | 59.00 | 16.82 | 49.38 | 13.70 |
| R2 | 0.7750 | 0.8851 | 0.7574 | 0.9286 |
| NR Endogenous | |||||||||||
|---|---|---|---|---|---|---|---|---|---|---|---|
| NanoMo | Mo Chelate | Na Molybdate | |||||||||
| CV | 18.83 | R2 | 0.6661 | CV | 23.61 | R2 | 0.1668 | CV | 33.18 | R2 | 0.3181 |
| Regression | Factors | Regression | Factors | Regression | Factors | ||||||
| L | 0.0003 | N | Mo | L | <0.0001 | N | Mo | L | 0.0041 | N | Mo |
| C | 0.0226 | 0.0010 | 0.0003 | C | 0.0015 | <0.0001 | 0.6770 | C | 0.0007 | 0.0016 | 0.0272 |
| P | 0.0105 | C | L, C | P | 0.9649 | L, C | P | 0.0012 | L, C | L, C | |
| Model | <0.0001 | Model | <0.0001 | Model | <0.0001 | ||||||
| Source | Es | SE | p > t | Source | Est | SE | p > t | Source | Est | SE | p > t |
| Int | 0.7115 | 0.2148 | 0.0016 | Int | 0.6672 | 0.3872 | 0.0902 | Int | 1.1540 | 0.3376 | 0.0012 |
| N | −0.0022 | 0.0636 | 0.9717 | N | 0.5507 | 0.1146 | <0.0001 | N | 0.2961 | 0.1000 | 0.0044 |
| Mo | −0.0781 | 0.0381 | 0.0451 | Mo | −0.0686 | 0.0688 | 0.3227 | Mo | −0.1568 | 0.0600 | 0.0114 |
| N × N | 0.0083 | 0.0046 | 0.0792 | N × N | −0.0305 | 0.0084 | 0.0006 | N × N | −0.0255 | 0.0073 | 0.0010 |
| Mo × N | −0.0060 | 0.0022 | 0.0105 | Mo × N | −0.0001 | 0.0040 | 0.9649 | Mo × N | 0.0121 | 0.0035 | 0.0012 |
| Mo × Mo | 0.0037 | 0.0016 | 0.0307 | Mo × Mo | 0.0036 | 0.0030 | 0.2361 | Mo × Mo | 0.0054 | 0.0026 | 0.0427 |
| Eigenvectors | Eigenvectors | Eigenvectors | |||||||||
| Eigenva | 0.5205 | −0.6340 | 0.7733 | Eigenva | 0.3629 | −0.0037 | 0.9999 | Eigenva | 0.6337 | 0.2288 | 0.9734 |
| 0.1526 | 0.7733 | 0.6340 | −1.0995 | 0.9999 | 0.0037 | −1.0052 | 0.9734 | −0.2288 | |||
| NR Induced with NO3 | |||||||||||
|---|---|---|---|---|---|---|---|---|---|---|---|
| NanoMo | Mo Chelate | Na Molybdate | |||||||||
| CV | 55.26 | R2 | 0.3297 | CV | 10.79 | R2 | 0.0676 | CV | 18.08 | R2 | 0.4734 |
| Regression | Factors | Regression | Factors | Regression | Factors | ||||||
| L | <0.0001 | N | Mo | L | 0.4921 | N | Mo | L | 0.0013 | N | Mo |
| C | 0.1788 | 0.0017 | 0.0102 | C | 0.2748 | 0.6912 | 0.4204 | C | 0.0002 | <0.0001 | <0.0001 |
| P | 0.3384 | L | P | 0.7228 | P | 0.0001 | C | L, C, Mo | |||
| Model | 0.0002 | Model | 0.5263 | Model | <0.0001 | ||||||
| Source | Es | SE | p > t | Source | Est | SE | p > t | Source | Est | SE | p > t |
| Int | 0.4347 | 0.5731 | 0.4512 | Int | 3.5921 | 0.1383 | <0.0001 | Int | 3.2165 | 0.2212 | <0.0001 |
| N | 0.4861 | 0.1697 | 0.0058 | N | 0.0011 | 0.0409 | 0.9772 | N | 0.0261 | 0.0655 | 0.6917 |
| Mo | 0.1817 | 0.1018 | 0.0797 | Mo | −0.0366 | 0.0245 | 0.1412 | Mo | 0.1173 | 0.0393 | 0.0041 |
| N × N | −0.0219 | 0.0124 | 0.0833 | N × N | 0.0005 | 0.0030 | 0.8597 | N × N | −0.0120 | 0.0048 | 0.0454 |
| Mo × N | −0.0058 | 0.0060 | 0.3384 | Mo × N | 0.0005 | 0.0014 | 0.7228 | Mo × N | 0.0095 | 0.0023 | 0.0001 |
| Mo × Mo | −0.0029 | 0.0044 | 0.5088 | Mo × Mo | 0.0017 | 0.0010 | 0.1116 | Mo × Mo | −0.0065 | 0.0017 | 0.0004 |
| Eigenvectors | Eigenvectors | Eigenvectors | |||||||||
| Eigenva | −0.2422 | −0.3048 | 0.9524 | Eigenva | 0.1765 | 0.0989 | 0.9950 | Eigenva | −0.2350 | 0.8240 | 0.5665 |
| −0.8469 | 0.9524 | 0.3048 | 0.0176 | 0.9950 | −0.0989 | −0.8503 | −0.5665 | 0.8240 | |||
| NR Induced with NO3 and Infiltered with Mo | |||||||||||
|---|---|---|---|---|---|---|---|---|---|---|---|
| NanoMo | Mo Chelate | Na Molybdate | |||||||||
| CV | 54.30 | R2 | 0.2852 | CV | 10.55 | R2 | 0.1197 | CV | 27.28 | R2 | 0.3123 |
| Regression | Factors | Regression | Factors | Regression | Factors | ||||||
| L | 0.0002 | N | Mo | L | 0.0440 | N | Mo | L | 0.0175 | N | Mo |
| C | 0.2043 | 0.0072 | 0.0212 | C | 0.7019 | 0.1259 | 0.4811 | C | 0.2818 | 0.0013 | 0.0002 |
| P | 0.4459 | L | P | 0.4513 | P | 0.0003 | Mo | ||||
| Model | 0.0013 | Model | 0.1809 | Model | 0.0005 | ||||||
| Source | Es | SE | p > t | Source | Est | SE | p > t | Source | Est | SE | p > t |
| Int | 0.7522 | 0.5797 | 0.1996 | Int | 3.2976 | 0.1329 | <0.0001 | Int | 3.4539 | 0.3075 | <0.0001 |
| N | 0.4518 | 0.1717 | 0.0109 | N | 0.0371 | 0.0393 | 0.3492 | N | −0.1721 | 0.0910 | 0.0638 |
| Mo | 0.1612 | 0.1030 | 0.1230 | Mo | −0.0055 | 0.0236 | 0.8146 | Mo | 0.0479 | 0.0546 | 0.3842 |
| N × N | −0.0216 | 0.0126 | 0.0910 | N × N | −0.0003 | 0.0028 | 0.9176 | N × N | 0.0017 | 0.0066 | 0.7975 |
| Mo × N | −0.0047 | 0.0061 | 0.4459 | Mo × N | −0.0010 | 0.0014 | 0.4513 | Mo × N | 0.0126 | 0.0032 | 0.0003 |
| Mo × Mo | −0.0025 | 0.0045 | 0.5794 | Mo × Mo | 0.0008 | 0.0010 | 0.4057 | Mo × Mo | −0.0038 | 0.0024 | 0.1177 |
| Eigenvectors | Eigenvectors | Eigenvectors | |||||||||
| Eigenva | −0.2176 | −0.2434 | 0.9699 | Eigenva | 0.0966 | −0.2851 | 0.9584 | Eigenva | 0.2789 | 0.8677 | 0.4969 |
| −0.8156 | 0.9699 | 0.2434 | −0.0203 | 0.9584 | 0.2851 | −0.5993 | −0.4969 | 0.8677 | |||
| Photosynthetic Pigments | |||||
|---|---|---|---|---|---|
| Chl A | Chl B | Carotenoids | Chl A + B | Chl A + B/C | |
| Mo Source | 0.0001 U | 0.0001 | <0.0001 | 0.0017 | 0.0032 |
| NanoMo | 2.92 a v | 1.58 a | 6.53 a | 2.02 a | 0.74 b |
| Na Molybdate | 2.43 b | 1.35 b | 5.02 b | 1.73 b | 0.73 b |
| Mo Chelate | 2.43 b | 1.29 b | 5.29 b | 1.99 a | 0.77 a |
| MSD | 0.15 w | 0.10 | 0.47 | 0.16 | 0.02 |
| Nitrogen X | 0.0002 | 0.0024 | <0.0001 | 0.0023 | 0.0019 |
| 0 | 2.20 c | 1.13 c | 4.99 c | 2.09 a | 0.71 b |
| 3 | 2.46 b | 1.44 b | 5.55 b | 1.83 b | 0.77 a |
| 6 | 2.56 b | 1.38 b | 5.65 b | 1.97 ab | 0.74 ab |
| 12 | 2.81 a | 1.66 a | 6.28 a | 1.76 b | 0.74 ab |
| MSD | 0.21 | 0.21 | 0.54 | 0.22 | 0.03 |
| Molybdenum Y | <0.0001 | <0.0001 | <0.0001 | 0.0360 | <0.0001 |
| 0 | 2.43 bc | 1.26 b | 1.62 c | 2.02 a | 1.70 a |
| 5 | 2.58 ab | 1.48 a | 6.99 a | 1.89 ab | 0.43 b |
| 10 | 2.41 c | 1.34 b | 6.54 b | 1.92 ab | 0.42 b |
| 20 | 2.60 a | 1.53 a | 7.32 a | 1.82 b | 0.41 b |
| MSD | 0.17 | 0.12 | 0.43 | 0.18 | 0.02 |
| SoMo × N | 0.3968 | 0.0311 | <0.0001 | <0.0001 | 0.0549 |
| SoMo × Mo | <0.0001 | <0.0001 | <0.0001 | 0.1719 | <0.0001 |
| N × Mo | 0.0481 | 0.0599 | 0.0026 | <0.0001 | <0.0001 |
| SoMo × N × Mo | 0.6020 | 0.7049 | <0.0001 | <0.0001 | <0.0001 |
| µ | 2.51 | 1.4 | 5.62 | 1.91 | 0.74 |
| C.V. | 13.07 | 16.63 | 14.62 | 17.73 | 6.82 |
| R2 | 0.8215 | 0.8344 | 0.9476 | 0.7029 | 0.9953 |
| Chlorophyll a | |||||||||||
|---|---|---|---|---|---|---|---|---|---|---|---|
| NanoMo | Mo Chelate | Na Molybdate | |||||||||
| CV | 14.05 | R2 | 0.4898 | CV | 18.58 | R2 | 0.3153 | CV | 18.09 | R2 | 0.1051 |
| Regression | Factors | Regression | Factors | Regression | Factors | ||||||
| L | <0.0001 | N | Mo | L | <0.0001 | N | Mo | L | 0.2100 | N | Mo |
| C | 0.3434 | <0.0001 | 0.0111 | C | 0.8392 | <0.0001 | 0.2786 | C | 0.2266 | 0.7094 | 0.1246 |
| P | 0.4455 | L | P | 0.0886 | P | 0.4571 | L | ||||
| Model | <0.0001 | Model | 0.0004 | Model | 0.2516 | ||||||
| Source | Es | SE | p > t | Source | Est | SE | p > t | Source | Est | SE | p > t |
| Int | 2.1908 | 0.1481 | <0.0001 | Int | 1.8870 | 0.1627 | <0.0001 | Int | 2.3422 | 0.1417 | <0.0001 |
| N | 0.1440 | 0.0438 | 0.0017 | N | 0.0863 | 0.0482 | 0.0786 | N | 0.0156 | 0.0419 | 0.6946 |
| Mo | 0.0283 | 0.0263 | 0.2863 | Mo | 0.0371 | 0.0289 | 0.2039 | Mo | −0.0552 | 0.0251 | 0.0322 |
| N × N | −0.0047 | 0.0032 | 0.1458 | N × N | 0.00004 | 0.0035 | 0.9909 | N × N | −0.0014 | 0.0030 | 0.6457 |
| Mo × N | −0.0012 | 0.0015 | 0.4455 | Mo × N | −0.0029 | 0.0017 | 0.0886 | Mo × N | 0.0011 | 0.0014 | 0.4571 |
| Mo × Mo | 0.0001 | 0.0011 | 0.9472 | Mo × Mo | −0.0007 | 0.0012 | 0.5556 | Mo × Mo | 0.0018 | 0.0011 | 0.0977 |
| Eigenvectors | Eigenvectors | Eigenvectors | |||||||||
| Eigenva | 0.0147 | −0.1908 | 0.9816 | Eigenva | 0.0603 | 0.8353 | −0.5497 | Eigenva | 0.1914 | 0.1337 | 0.9905 |
| −0.1780 | 0.9816 | 0.1908 | −0.1344 | 0.5497 | 0.8353 | −0.0559 | 0.9905 | −0.1373 | |||
| Chlorophyll b | |||||||||||
|---|---|---|---|---|---|---|---|---|---|---|---|
| NanoMo | Mo Chelate | Na Molybdate | |||||||||
| CV | 23.11 | R2 | 0.5943 | CV | 19.04 | R2 | 0.3815 | CV | 25.75 | R2 | 0.1230 |
| Regression | Factors | Regression | Factors | Regression | Factors | ||||||
| L | <0.0001 | N | Mo | L | 0.0002 | N | Mo | L | 0.2986 | N | Mo |
| C | 0.0117 | <0.0001 | 0.0014 | C | 0.3009 | <0.0001 | 0.0008 | C | 0.5398 | 0.1163 | 0.1060 |
| P | 0.0074 | L | C, Mo | P | 0.0005 | Mo | P | 0.0399 | Mo | ||
| Model | <0.0001 | Model | <0.0001 | Model | 0.1672 | ||||||
| Source | Es | SE | p > t | Source | Est | SE | p > t | Source | Est | SE | p > t |
| Int | 0.9718 | 0.1316 | <0.0001 | Int | 0.9669 | 0.0885 | <0.0001 | Int | 1.4313 | 0.1253 | <0.0001 |
| N | 0.1424 | 0.0389 | 0.0006 | N | 0.0190 | 0.0262 | 0.4711 | N | −0.0193 | 0.0371 | 0.6044 |
| Mo | 0.0289 | 0.0233 | 0.2204 | Mo | 0.0264 | 0.0157 | 0.0982 | Mo | −0.0316 | 0.0222 | 0.1606 |
| N × N | −0.0077 | 0.0028 | 0.0087 | N × N | 0.0030 | 0.0019 | 0.1236 | N × N | 0.0006 | 0.0027 | 0.8210 |
| Mo × N | 0.0038 | 0.0013 | 0.0074 | Mo × N | −0.0034 | 0.0009 | 0.0005 | Mo × N | 0.0027 | 0.0013 | 0.0399 |
| Mo × Mo | −0.0015 | 0.0010 | 0.1394 | Mo × Mo | 0.0001 | 0.0006 | 0.9168 | Mo × Mo | 0.0010 | 0.0009 | 0.2789 |
| Eigenvectors | Eigenvectors | Eigenvectors | |||||||||
| Eigenva | −0.0853 | 0.5119 | 0.8589 | Eigenva | 0.1736 | 0.8472 | −0.5311 | Eigenva | 0.1586 | 0.5229 | 0.8523 |
| −0.3489 | 0.8589 | −0.5119 | −0.0581 | 0.5311 | 0.8472 | −0.0290 | 0.8523 | −0.5229 | |||
| Carotenoids | |||||||||||
|---|---|---|---|---|---|---|---|---|---|---|---|
| NanoMo | Mo Chelate | Na Molybdate | |||||||||
| CV | 21.52 | R2 | 0.8052 | CV | 21.14 | R2 | 0.8011 | CV | 32.31 | R2 | 0.5719 |
| Regression | Factors | Regression | Factors | Regression | Factors | ||||||
| L | <0.0001 | N | Mo | L | <0.0001 | N | Mo | L | <0.0001 | N | Mo |
| C | <0.0001 | <0.0001 | <0.0001 | C | <0.0001 | 0.0166 | <0.0001 | C | <0.0001 | 0.5816 | <0.0001 |
| P | 0.4239 | L | L, C | P | 0.0146 | L | C | P | 0.3336 | L, C | |
| Model | <0.0001 | Model | <0.0001 | Model | <0.0001 | ||||||
| Source | Es | SE | p > t | Source | Est | SE | p > t | Source | Est | SE | p > t |
| Int | 1.2719 | 0.5068 | 0.0149 | Int | 1.2302 | 0.4036 | 0.0035 | Int | 2.1923 | 0.5853 | 0.0004 |
| N | 0.3345 | 0.1501 | 0.0297 | N | 0.0476 | 0.1195 | 0.6915 | N | 0.0168 | 0.1733 | 0.9228 |
| Mo | 0.9949 | 0.0900 | <0.0001 | Mo | 0.8986 | 0.0717 | <0.0001 | Mo | 0.6209 | 0.1040 | <0.0001 |
| N × N | −0.0142 | 0.0110 | 0.2017 | N × N | 0.0086 | 0.0087 | 0.3273 | N × N | −0.0019 | 0.0127 | 0.8802 |
| Mo × N | 0.0043 | 00.53 | 0.4239 | Mo × N | −0.0107 | 0.0042 | 0.0146 | Mo × N | 0.0060 | 0.0061 | 0.3336 |
| Mo × Mo | −0.0359 | 0.0039 | <0.0001 | Mo × Mo | −0.0301 | 0.0031 | <0.0001 | Mo × Mo | −0.0218 | 0.0045 | <0.0001 |
| Eigenvectors | Eigenvectors | Eigenvectors | |||||||||
| Eigenva | −0.5070 | 0.9991 | 0.0418 | Eigenva | 0.3431 | 0.9954 | −0.0955 | Eigenva | −0.0540 | 0.9964 | 0.0845 |
| −3.6045 | −0.0418 | 0.9991 | −3.0491 | 0.0955 | 0.9954 | −2.2035 | −0.0845 | 0.9964 | |||
| Chlorophyll a + b | |||||||||||
|---|---|---|---|---|---|---|---|---|---|---|---|
| NanoMo | Mo Chelate | Na Molybdate | |||||||||
| CV | 19.05 | R2 | 0.4640 | CV | 21.42 | R2 | 0.0662 | CV | 32.31 | R2 | 0.5719 |
| Regression | Factors | Regression | Factors | Regression | Factors | ||||||
| L | <0.0001 | N | Mo | L | 0.6485 | N | Mo | L | 0.1029 | N | Mo |
| C | 0.0044 | <0.0001 | 0.0030 | C | 0.3515 | 0.5554 | 0.3818 | C | 0.5091 | 0.2737 | 0.2798 |
| P | 0.0013 | L, C | Mo | P | 0.2965 | P | 0.3440 | ||||
| Model | <0.0001 | Model | 0.5389 | Model | 0.2372 | ||||||
| Source | Es | SE | p > t | Source | Est | SE | p > t | Source | Est | SE | p > t |
| Int | 2.4100 | 0.1388 | <0.0001 | Int | 1.9758 | 0.1537 | <0.0001 | Int | 1.8195 | 0.1508 | <0.0001 |
| N | −0.1267 | 0.0411 | 0.0031 | N | 0.0277 | 0.0455 | 0.5449 | N | 0.0404 | 0.0446 | 0.3686 |
| Mo | −0.0180 | 0.0246 | 0.4675 | Mo | 0.0133 | 0.0273 | 0.6280 | Mo | −0.0154 | 0.0268 | 0.5674 |
| N × N | 0.0093 | 0.0030 | 0.0032 | N × N | −0.0030 | 0.0033 | 0.3653 | N × N | −0.0035 | 0.0032 | 0.2896 |
| Mo × N | −0.0049 | 0.0014 | 0.0013 | Mo × N | 0.0017 | 0.0016 | 0.2965 | Mo × N | −0.0015 | 0.0015 | 0.3440 |
| Mo × Mo | 0.0017 | 0.0018 | 0.1225 | Mo × Mo | −0.0013 | 0.0012 | 0.2595 | Mo × Mo | 0.0005 | 0.0011 | 0.6379 |
| Eigenvectors | Eigenvectors | Eigenvectors | |||||||||
| Eigenva | 0.4224 | 0.8616 | −0.5075 | Eigenva | −0.0702 | 0.7925 | 0.6098 | Eigenva | 0.0666 | −0.2303 | 0.9731 |
| 0.0829 | 0.5075 | 0.8616 | −0.1766 | −0.6098 | 0.7925 | −0.1370 | 0.9731 | 0.2303 | |||
| Chlorophyll a + b/Carotenoids | |||||||||||
|---|---|---|---|---|---|---|---|---|---|---|---|
| NanoMo | Mo Chelate | Na Molybdate | |||||||||
| CV | 26.13 | R2 | 0.8858 | CV | 28.57 | R2 | 0.8752 | CV | 26.69 | R2 | 0.8827 |
| Regression | Factors | Regression | Factors | Regression | Factors | ||||||
| L | <0.0001 | N | Mo | L | 0.6485 | N | Mo | L | <0.0001 | N | Mo |
| C | <0.0001 | 0.9919 | <0.0001 | C | 0.3515 | 0.7751 | <0.0001 | C | <0.0001 | 0.9380 | <0.0001 |
| P | 0.7727 | L, C | P | 0.2965 | L, C | P | 0.7426 | L, C | |||
| Model | <0.0001 | Model | 0.5389 | Model | <0.0001 | ||||||
| Source | Es | SE | p > t | Source | Est | SE | p > t | Source | Est | SE | p > t |
| Int | 1.5820 | 0.0694 | <0.0001 | Int | 1.6486 | 0.0791 | <0.0001 | Int | 1.5371 | 0.0703 | <0.0001 |
| N | −0.0024 | 0.0205 | 0.9063 | N | 0.0176 | 0.0234 | 0.4559 | N | 0.0128 | 0.0208 | 0.5391 |
| Mo | −0.2166 | 0.0123 | <0.0001 | Mo | −0.2342 | 0.0140 | <0.0001 | Mo | −0.2100 | 0.0125 | <0.0001 |
| N × N | 0.0001 | 0.0015 | 0.9520 | N × N | −0.0014 | 0.0017 | 0.4124 | N × N | −0.0008 | 0.0015 | 0.5894 |
| Mo × N | 0.0002 | 0.0007 | 0.7727 | Mo × N | 0.0003 | 0.0008 | 0.6707 | Mo × N | −0.0002 | 0.0007 | 0.7426 |
| Mo × Mo | 0.0080 | 0.0005 | <0.0001 | Mo × Mo | 0.0085 | 0.0006 | 0.8596 | Mo × Mo | 0.0077 | 0.0005 | <0.0001 |
| Eigenvectors | Eigenvectors | Eigenvectors | |||||||||
| Eigenva | 0.8002 | 0.0080 | 0.9999 | Eigenva | 0.8597 | 0.0117 | 0.9999 | Eigenva | 0.7740 | −0.0091 | 0.9999 |
| 0.0032 | 0.9999 | −0.0080 | −0.0513 | 0.9999 | −0.0117 | −0.0299 | 0.9999 | 0.0091 | |||
| Nitrogen Use Efficiency | |||
|---|---|---|---|
| TNA | NUpE | NUtE | |
| Source Mo | 0.0002 U | <0.0001 | 0.6624 |
| NanoMo | 238.92 a V | 5.75 c | 21.54 a |
| Na Molybdate | 133.40 b | 13.24 a | 22.24 a |
| Mo Chelate | 156.33 b | 8.40 b | 23.49 a |
| MSD | 42.08 | 2.39 | 5.95 |
| Nitrogen X | <0.0001 | <0.0001 | <0.0001 |
| 0 | 115.67 b | 16.70 a | 30.90 a |
| 3 | 135.55 b | 9.30 b | 27.11 a |
| 6 | 228.80 a | 6.36 c | 17.27 b |
| 12 | 224.84 a | 4.15 c | 14.42 b |
| MSD | 45.79 | 2.29 | 7.49 |
| Molybdenum Y | 0.3599 | 0.0318 | 0.0009 |
| 0 | 168.67 a | 7.57 b | 17.86 b |
| 5 | 167.85 a | 8.54 ab | 22.47 ab |
| 10 | 187.28 a | 10.54 a | 56.77 a |
| 20 | 181.06 a | 9.88 ab | 22.64 ab |
| MSD | 33.83 | 2.81 | 5.51 |
| SoMo × N | 0.0322 | <0.0001 | <0.0001 |
| SoMo × Mo | 0.0002 | 0.4295 | 0.0378 |
| N × Mo | 0.0508 | 0.3090 | 0.0327 |
| SoMo × N × Mo | 0.2952 | 0.2646 | <0.0001 |
| µ | 176.21 | 9.13 | 22.42 |
| C.V. | 36.04 | 57.94 | 46.18 |
| R2 | 0.7793 | 0.7653 | 0.7705 |
| Total Nitrogen Accumulation (TNA) | |||||||||||
|---|---|---|---|---|---|---|---|---|---|---|---|
| NanoMo | Mo Chelate | Na Molybdate | |||||||||
| CV | 30.38 | R2 | 0.3806 | CV | 46.71 | R2 | 0.4299 | CV | 57.82 | R2 | 0.3658 |
| Regression | Factors | Regression | Factors | Regression | Factors | ||||||
| L | 0.0001 | N | Mo | L | <0.0001 | N | Mo | L | <0.0001 | N | Mo |
| C | 0.0024 | 0.0007 | 0.0017 | C | 0.0005 | <0.0001 | 0.3656 | C | 0.0262 | <0.0001 | 0.4915 |
| P | 0.2868 | L, C | P | 0.7742 | L, C | P | 0.4612 | L, C | |||
| Model | <0.0001 | Model | <0.0001 | Model | <0.0001 | ||||||
| Source | Es | SE | p > t | Source | Est | SE | p > t | Source | Est | SE | p > t |
| Int | 160.6188 | 26.1540 | <0.0001 | Int | 91.4985 | 26.3066 | 0.0010 | Int | 57.3632 | 27.7886 | 0.0435 |
| N | −0.3029 | 7.7468 | 0.9689 | N | 37.5070 | 7.7921 | <0.0001 | N | 28.4917 | 8.2307 | 0.0010 |
| Mo | 15.7424 | 4.6481 | 0.0013 | Mo | −7.8593 | 4.6752 | 0.0981 | Mo | −4.0110 | 4.9384 | 0.4200 |
| N × N | 0.5085 | 0.5687 | 0.3750 | N × N | −2.2447 | 0.5721 | 0.0002 | N × N | −1.5872 | 0.6043 | 0.0110 |
| Mo × N | 0.2973 | 0.2765 | 0.2868 | Mo × N | 0.0801 | 0.2781 | 0.7742 | Mo × N | 0.2179 | 0.2938 | 0.4612 |
| Mo × Mo | −0.7279 | 0.2047 | 0.0008 | Mo × Mo | 0.2977 | 0.2059 | 0.1537 | Mo × Mo | 0.2021 | 0.2175 | 0.3566 |
| Eigenvectors | Eigenvectors | Eigenvectors | |||||||||
| Eigenva | 19.1732 | 0.9953 | 0.0965 | Eigenva | 29.8228 | 0.0217 | 0.9997 | Eigenva | 20.7674 | 0.0836 | 0.9964 |
| −73.6638 | −0.0965 | 0.9953 | −80.8641 | 0.9997 | −0.0217 | −54.6915 | 0.9964 | −0.0836 | |||
| Nitrogen Absorption Efficiency (NUpE) | |||||||||||
|---|---|---|---|---|---|---|---|---|---|---|---|
| NanoMo | Mo Chelate | Na Molybdate | |||||||||
| CV | 48.05 | R2 | 0.3405 | CV | 64.13 | R2 | 0.5907 | CV | 48.76 | R2 | 0.6132 |
| Regression | Factors | Regression | Factors | Regression | Factors | ||||||
| L | <0.0001 | N | Mo | L | <0.0001 | N | Mo | L | <0.0001 | N | Mo |
| C | 0.1249 | <0.0001 | 0.2208 | C | 0.0001 | <0.0001 | 0.0015 | C | <0.0001 | <0.0001 | 0.1619 |
| P | 0.0803 | P | 0.0012 | L, C | P | 0.5020 | L, C | L | |||
| Model | 0.0002 | Model | <0.0001 | Model | <0.0001 | ||||||
| Source | Es | SE | p > t | Source | Est | SE | p > t | Source | Est | SE | p > t |
| Int | 7.4187 | 0.9957 | <0.0001 | Int | 12.0365 | 1.9422 | <0.0001 | Int | 21.4271 | 2.3263 | <0.0001 |
| N | −0.0712 | 0.2949 | 0.8100 | N | −2.8226 | 0.5752 | <0.0001 | N | 41.3862 | 19.1956 | 0.0352 |
| Mo | 0.0913 | 0.1769 | 0.6078 | Mo | 0.6268 | 0.3451 | 0.0745 | Mo | 21.1314 | 11.5173 | 0.0717 |
| N × N | −0.0371 | 0.0216 | 0.0915 | N × N | 0.1944 | 0.0422 | <0.0001 | N × N | −3.4424 | 1.4093 | 0.0177 |
| Mo × N | 0.0187 | 0.0105 | 0.0803 | Mo × N | −0.0702 | 0.0205 | 0.0012 | Mo × N | −0.0570 | 0.6853 | 0.9339 |
| Mo × Mo | −0.0091 | 0.0077 | 0.2469 | Mo × Mo | −0.0019 | 0.0152 | 0.8976 | Mo × Mo | −0.6386 | 0.5073 | 0.2132 |
| Eigenvectors | Eigenvectors | Eigenvectors | |||||||||
| Eigenva | −0.5235 | 0.5683 | 0.8227 | Eigenva | 7.5713 | 0.9651 | −0.2617 | Eigenva | 7.8851 | 0.9990 | −0.0440 |
| −1.7260 | 0.8227 | −0.5683 | −0.7676 | 0.2617 | 0.9651 | −3.3005 | 0.0446 | 0.9990 | |||
| Nitrogen Utilization Efficiency (NUtE) | |||||||||||
|---|---|---|---|---|---|---|---|---|---|---|---|
| NanoMo | Mo Chelate | Na Molybdate | |||||||||
| CV | 50.26 | R2 | 0.3463 | CV | 78.08 | R2 | 0.3554 | CV | 38.33 | R2 | 0.5644 |
| Regression | Factors | Regression | Factors | Regression | Factors | ||||||
| L | 0.1641 | N | Mo | L | 0.0001 | N | Mo | L | <0.0001 | N | Mo |
| C | <0.0001 | 0.0002 | 0.0559 | C | 0.0106 | <0.0001 | 0.1565 | C | <0.0001 | <0.0001 | 0.7685 |
| P | 0.4688 | L, C | L | P | 0.2757 | L, C | L | P | 0.6558 | L, C | |
| Model | 0.0001 | Model | <0.0001 | Model | <0.0001 | ||||||
| Source | Es | SE | p > t | Source | Est | SE | p > t | Source | Est | SE | p > t |
| Int | 8.8866 | 3.9011 | 0.0264 | Int | 31.6067 | 6.6101 | <0.0001 | Int | 34.8012 | 3.0713 | <0.0001 |
| N | 4.8201 | 1.1553 | 0.0001 | N | −6.1431 | 1.9579 | 0.0027 | N | −5.8532 | 0.9097 | <0.0001 |
| Mo | 1.8566 | 0.6933 | 0.0096 | Mo | 2.6727 | 1.1747 | 0.0266 | Mo | 0.4775 | 0.5458 | 0.3852 |
| N × N | −0.3935 | 0.0848 | <0.0001 | N × N | 0.3612 | 0.1437 | 0.0148 | N × N | 0.3491 | 0.0667 | <0.0001 |
| Mo × N | −0.0300 | 0.0412 | 0.4688 | Mo × N | −0.0769 | 0.0699 | 0.2757 | Mo × N | −0.0145 | 0.0324 | 0.6558 |
| Mo × Mo | −0.0679 | 0.0305 | 0.0300 | Mo × Mo | −0.0973 | 0.0517 | 0.0650 | Mo × Mo | −0.0139 | 0.0240 | 0.5629 |
| Eigenvectors | Eigenvectors | Eigenvectors | |||||||||
| Eigenva | −6.6862 | −0.1197 | 0.9928 | Eigenva | 13.2354 | 0.9949 | −0.0999 | Eigenva | 12.5825 | 0.9995 | −0.0312 |
| −14.2760 | 0.9928 | 0.1197 | −9.9666 | 0.0999 | 0.9949 | −1.4127 | 0.0312 | 0.9995 | |||
Publisher’s Note: MDPI stays neutral with regard to jurisdictional claims in published maps and institutional affiliations. |
© 2022 by the authors. Licensee MDPI, Basel, Switzerland. This article is an open access article distributed under the terms and conditions of the Creative Commons Attribution (CC BY) license (https://creativecommons.org/licenses/by/4.0/).
Share and Cite
Muñoz-Márquez, E.; Soto-Parra, J.M.; Noperi-Mosqueda, L.C.; Sánchez, E. Application of Molybdenum Nanofertilizer on the Nitrogen Use Efficiency, Growth and Yield in Green Beans. Agronomy 2022, 12, 3163. https://doi.org/10.3390/agronomy12123163
Muñoz-Márquez E, Soto-Parra JM, Noperi-Mosqueda LC, Sánchez E. Application of Molybdenum Nanofertilizer on the Nitrogen Use Efficiency, Growth and Yield in Green Beans. Agronomy. 2022; 12(12):3163. https://doi.org/10.3390/agronomy12123163
Chicago/Turabian StyleMuñoz-Márquez, Ezequiel, Juan Manuel Soto-Parra, Linda Citlalli Noperi-Mosqueda, and Esteban Sánchez. 2022. "Application of Molybdenum Nanofertilizer on the Nitrogen Use Efficiency, Growth and Yield in Green Beans" Agronomy 12, no. 12: 3163. https://doi.org/10.3390/agronomy12123163